
94% of researchers rate our articles as excellent or good
Learn more about the work of our research integrity team to safeguard the quality of each article we publish.
Find out more
ORIGINAL RESEARCH article
Front. Genet. , 20 April 2022
Sec. Genomics of Plants and the Phytoecosystem
Volume 13 - 2022 | https://doi.org/10.3389/fgene.2022.842387
This article is part of the Research Topic Application of Network Theoretic Approaches in Biology View all 11 articles
 Fushun Wang1,2†
 Kang Zhang3,4,5†Ruolan Zhang1Hongquan Liu6Weijin Zhang1Zhanxiao Jia1
 Chunyang Wang3,4*
Polyploidization plays a critical role in producing new gene functions and promoting species evolution. Effective identification of polyploid types can be helpful in exploring the evolutionary mechanism. However, current methods for detecting polyploid types have some major limitations, such as being time-consuming and strong subjectivity, etc. In order to objectively and scientifically recognize collinearity fragments and polyploid types, we developed PolyReco method, which can automatically label collinear regions and recognize polyploidy events based on the KS dotplot. Combining with whole-genome collinearity analysis, PolyReco uses DBSCAN clustering method to cluster KS dots. According to the distance information in the x-axis and y-axis directions between the categories, the clustering results are merged based on certain rules to obtain the collinear regions, automatically recognize and label collinear fragments. According to the information of the labeled collinear regions on the y-axis, the polyploidization recognition algorithm is used to exhaustively combine and obtain the genetic collinearity evaluation index of each combination, and then draw the genetic collinearity evaluation index graph. Based on the inflection point on the graph, polyploid types and related chromosomes with polyploidy signal can be detected. The validation experiments showed that the conclusions of PolyReco were consistent with the previous study, which verified the effectiveness of this method. It is expected that this approach can become a reference architecture for other polyploid types classification methods.
Studying the process of polyploidization is essential for the in-depth understanding of evolutionary laws (Marcet-Houben and Gabaldón 2015), and exploring the stability and chromosome rearrangement of the genome. Polyploidization of gymnosperms and almost all angiosperms are considered to be the main reason for the diversity of land plants (Li et al., 2016; Hao et al., 2017). Polyploidy can produce a large number of duplicated genes in the genome (Wang et al., 2018). These genes may play an important role in functional evolution, environmental adaptation, and new species formation (Wang et al., 2017; Wang et al., 2019). The recombination of some homologous chromosomes after polyploidization often causes the instability of the genome structure, and processes such as chromosome breakage and fusion often occur, which can lead to large-scale duplicated gene loss in the genome (Wang et al., 2007; Wang et al., 2011). If two species have a common ancestor, after polyploidization, although there will be differences between the genomes, the two species still have a relatively close relationship. This close relationship can be expressed in the form of collinearity. The more complete the collinearity fragment, the closer relationship between the two species is. Exploring the collinearity between species has big significance in understanding the origin of species and the evolution of the genome.
Cheng et al. (2019) drew a KS dotplot of homologous genes within Spirogloea muscicola, and found that it had recently experienced a whole genome triplication event. Through collinearity analysis, Wang et al., 2011 found that Brassica rapa and Arabidopsis thaliana experienced a whole genome triplication event. By constructing a phylogenetic gene tree, Dong et al. (2021) revealed that a whole-genome duplication event occurred in Magnoliales and Laurales. Xu et al. (2020) by drawing a phylogenetic gene tree, found that Scutellaria baicalensis and Scutellaria barbata had a whole-genome duplication event about 13.28 million years ago. Yan et al., 2021 by drawing the distribution graph of the synonymous substitution rate (KS), found two WGD events in Juglans mandshurica and Juglans regia. By drawing the distribution graph of the synonymous substitution rate (KS).
Although the KS distribution graph combined with the molecular clock (Miyata et al., 1980) can calculate the doubling time, it is a challenge to determine the collinearity information between the chromosomes. In addition, the above method, which injects prior knowledge, manually marks the collinear area by observing the atlas, and then recognizes the polyploidization through the combination of the regions. This kind of recognition method has low recognition efficiency, high dependence on prior knowledge, as well as strong subjectivity, and easy to introduce human error. Due to the lack of objective evaluation criteria, the identification of the polyploid types of is still very challenging. In terms of the types of polyploidization and the choice of chromosomes, the same atlas will cause different personal perceptions. This deviation will affect the subsequent research on chromosome rearrangement (Zhang et al., 2021). Therefore, we develop a computational model PolyReco to accurately identify and characterize some polyploid types in atlas.
Considering only KS values for identifying polyploid types might be insufficient, we add the gene positional information in PolyReco. Genes are aligned in sequential order on each of the chromosomes, so incorporating the gene positional information on chromosomes with KS values will likely increase the accuracy of polyploid type classification. In this study, sequence comparisons were performed based on the whole genome data of Vitis vinifera and Salix sinopurpurea, combined with whole genome collinearity analysis, to obtain the summary data of homology information and KS values between genomes. PolyReco comprehensively utilizes digital image processing technology and DBSCAN method, and realizes the automatic recognition and labeling of the collinear region based on the KS dotplot of homologous genes. The model uses the collinear area as the unit and combines the combination strategy to construct the combination evaluation standard. According to the performance of the chromosome combination, determine the specific polyploidization and draw the combined figure of the polyploidization. This study aims to develop a polyploidization classification tool, which has the potential to take chromosome position information into account with the KS values for boosting polyploid type prediction performance.
With the whole genome data of Salix sinopurpurea (Spu) and Brassica rapa (Bra) as the main research materials, comparative genomics was used to compare the collinearity between Salix sinopurpurea and the reference genome Vitis vinifera (Vvi), Brassica rapa and the reference genome Arabidopsis thaliana (Ath).
Genomes and their gene annotations of Salix sinopurpurea and Vitis vinifera were downloaded from Joint Genome Institute. Download the required documents for Brassica rapa and Arabidopsis thaliana at http://brassicadb.org/and http://www.arabidopsis.org/shangxia, respectively.
Due to the huge amount of original genome data, in order to extract target data from the genome sequence and annotation files, the downloaded genome data is processed with a custom python script to obtain the blast results, which is convenient for subsequent research and analysis. Screen the original data of species genomes, information was extracted from the genome annotation files, which include chromosome number, gene start and end positions, gene transcription direction, and gene ID information, and then rename the gene ID and the number of the genes was given in order of their appearance on chromosomes. Map the gene ID in the CDS sequence and protein sequence file to the new ID of the corresponding gene in the genome annotation file. Label the processed genomic data with a unified naming method.
Blastp was used to explore to align genomic sequences of different species. Screen out gene pairs with the expected value (E-value) not greater than 10–5 and score evaluation (Score) higher than 100, so that the subsequent genome collinearity analysis results are more reliable.
The WGDI (Sun et al., 2021) use MAFFT (Wong, Suchard, and Huelsenbeck 2008) or MUSCLE (Edgar 2004) to perform multiple sequence alignment, and calculates the synonymous substitution rate using the yn00 (Yang et al., 2000) or ng86 (Nei and Gojobori 1986) program of the PAML package. Finally, the visualization is realized by extracting block, and then output blockinfo file.
In this paper, the input for DBSCAN requires the blockinfo file generated by WGDI and the chromosome length information (len file) of the two species. By setting the epsilon (eps) and minimum points (MinPts), cluster analysis is performed on the collinearity fragments in the KS dotplot. The collinear region was then obtained from the clustering results combined with certain rules for merging. And then realizes the automatic identification and labeling of the collinear region. The comparison result of a chromosome of the target species and a chromosome of the reference species is shown as a cell on the KS dotplot, that is, a comparison unit.
The KS dotplot between Salix sinopurpurea and Vitis vinifera genome homologous genes drawn by wgdi (Figure 1A). The horizontal axis represents the chromosome of the target species (Salix sinopurpurea) and the vertical represents the chromosome of the reference species (Vitis vinifera). On the KS dotplot, the chromosome number of Salix sinopurpurea is shown from left to right, and the chromosome number of Vitis vinifera is shown from top to bottom. The KS value ranges from 0.00 to 2.00. As shown in the figure, different colored points correspond to different KS values. It can be observed in Figure 1A, in addition to the clear and complete homologous fragments of grape chromosome 4 with Salix sinopurpurea chromosomes 6 and 18, it also has fuzzy and unclear homologous fragments with Salix sinopurpurea chromosomes 1, 2 and 4. The reason why these fragments are unclear and incomplete is that they are doubled by the whole genome triplication events shared by older dicots. The collinearity of the homologous fragments produced by the whole genome triplication events shared by ancient dicotyledons is far inferior to that of the whole genome duplication events shared by the Salicaceae. The specific manifestation is that the KS value is significantly large, belongs to the blue-purple system, scarce and fragmented seriously. The results showed the structural similarities and differences between genomes. The generated data and pictures provide references for follow-up research.

FIGURE 1. (A) KS dotplot between Salix sinopurpurea and Vitis vinifera genome homologous genes (B) DBSCAN cluster recognition effect figure (C) Automatic label result of collinearity fragments based on DBSCAN.
Using the DBSCAN algorithm, by setting the eps to 50 and the MinPts to 3, cluster the KS dotplot between Salix sinopurpurea and Vitis vinifera genome homologous genes. The algorithm outputs the clustering result figure (Figure 1B), in which each category is represented by a rectangular box. The DBSCAN can cluster out complete collinearity fragments, in grape chromosome 14 and Salix sinopurpurea chromosome 5, as well as in grape chromosome 14 and Salix sinopurpurea chromosome 15. It also can identify fragmented collinearity fragments in grape chromosome 4 and Salix sinopurpurea chromosome 5, grape chromosome 13 and Salix sinopurpurea chromosome 16. These will accurately reflect the relationship between the collinearity fragments and improve the subsequent combination effect.
The model sorts the category in the same comparison unit from top to bottom to generate ID, and calculates the number of homologous gene points in the box (num), the length of the box (y1-y2), and the width of the box (x1-x2). The model then generates cluster.csv files that contain the target species chromosome number (chr1), the reference species chromosome number (chr2), ID, and the horizontal and vertical coordinates of the upper left corner point are l_x and l_y, respectively, num, the horizontal and vertical coordinates of the lower right point are r_x and r_y, respectively, y1-y2, and x1-x2. Part of the data in the cluster.csv file of grape chromosome 13 is shown in Table 1. Among them, chromosome 13 and chromosome 1 form a class. The coordinates of the upper left corner of this class are 145, 354, and the coordinates of the lower right corner are 257, 228. The number of homologous genes contained is 32. The length of the cluster box is 126 coordinate lengths, and the width is 112 coordinate lengths.

TABLE 1. Partial data of grape chromosome 13 cluster.csv file.
In order to perform a combined analysis on the identified collinearity fragments, the model read the cluster.csv file generated by clustering. The model uses y_gap and x_gap, which represents the gap in the longitudinal and horizontal directions of adjacent collinear segments, as the basis for judging overlap. The location information of the gene is combined to set the parameters gap and Slen. In the comparison unit, the parameter gap represents the mean value of y_gap. Through a series of experiments and continuous optimization of parameter selection, it is finally determined that 1/6 of the corresponding chromosome length of the target species is the value of parameter Slen. For all collinearity fragments whose num is greater than the specified value, one condition is that the collinearity fragments do not overlap, another is overlap. In the first condition, collinear fragments will be merged if 0 ≤y_gap ≤ gap and 0 ≤x_gap ≤ Slen. And in the second condition, there is overlap in the y-axis direction, they will be merged when it meets 0 ≤ x_gap < Slen; if there is overlap in the x-axis direction, when it meets 0 ≤ y_gap ≤ gap, merge them. Finally, the model output the clustering result graph (Figure 1C), in which the merged result is marked with a rectangular box, and the combine.csv file is generated.
The content of the combine.csv file is the same as the cluster.csv file. Table 2 shows some data of the combine.csv file. Among them, chromosome 13 and chromosome 8 form two classes. The coordinates of the upper left corner of the first class are 592, 1,264, and the lower right corner are 671, 1,155. The number of homologous genes contained in this class is 56. The length of the labeled box ∆y is 112 coordinate length, and the width ∆x is 79 coordinate length; the upper left corner coordinate of the second class are 78, 1,089, and the lower right corner are 605, 446. The number of homologous genes contained in this class is 239, ∆y is 643 coordinate length, ∆x is 537.

TABLE 2. Partial data of grape chromosome 13 combine.csv file.
In order to determine the polyploid types and related chromosomes of the species, we develop the polyploidy recognition algorithm. The algorithm read the generated combine.csv file, look for the labeled box with the largest ∆y, mark it, and then look up and down to find the labeled box with the length less than it. The result.csv file will be built by adopting exhaustive above process. Among them, comro represents the combination round, sumy represents the sum of ∆y in same combination round. In order to determine the specific polyploidy of the species, the gene collinearity evaluation index line chart is drawn. The horizontal is the combined round, and the vertical is the corresponding gene collinearity evaluation index. The significant inflection point in the line chart represents the corresponding polyploid type. The gene collinearity evaluation index (MI) was calculated by dividing the cumulative collinearity fragments length to the corresponding chromosome length of the reference species in the len file to describe the performance of the polyploidy in the corresponding combination round, and the larger its value, the better the performance.
Where
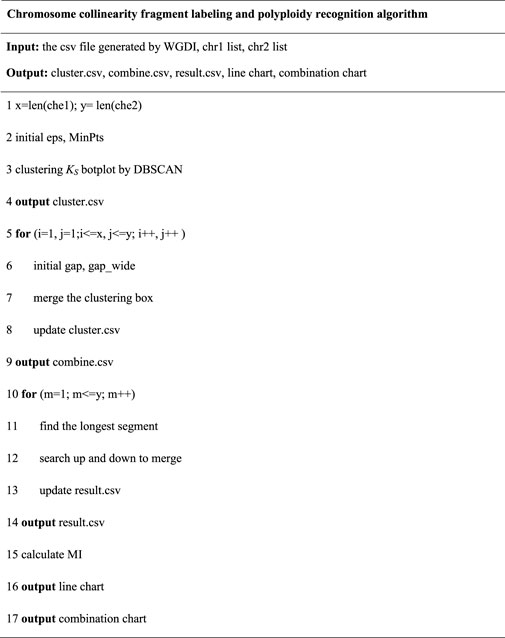
After determining the combination round, output the combined result graph. To describe the analysis of input, output and fetching the final results of the analysis, we made pseudo code. The pseudo code of the chromosome collinearity fragment labeling and polyploidy recognition algorithm is shown as below for a better understanding of the context and better assess the relevance of this paper.
Algorithm 1. Chromosome collinearity fragment labeling and polyploidy recognition algorithm.
Using PolyReco to objectively determine the polyploid types of Salix sinopurpurea. The model use Vitis vinifera as the reference genome to identify the target species Salix sinopurpurea polyploid type, and read the data of Vitis vinifera chromosome 4, 13 and 14. The DBSCAN algorithm obtains the collinearity fragments, and get the combine.csv file. Then using the polyploidy recognition algorithm to combine the labeled boxes exhaustively, and get the gene collinearity evaluation index table of each chromosome in different combination rounds (Supplementary Table S1). In the colinearity evaluation index line chart (Figure 2A), we can find that chromosomes 4, 13, and 14 of Vitis vinifera have obvious inflection points when the combined round is 2. Therefore, it is determined that the Salix sinopurpurea has a whole genome duplication event recently. This conclusion can be found in Wang et al., 2011.
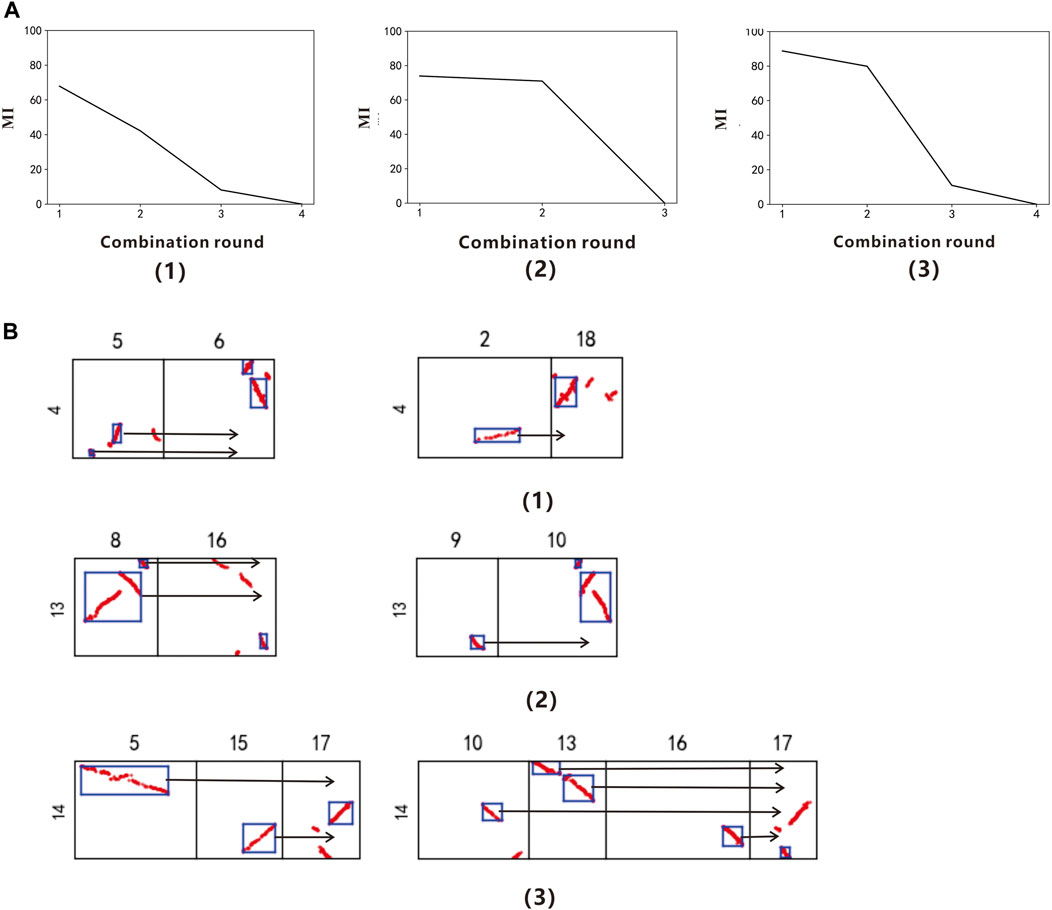
FIGURE 2. (A) Collinearity evaluation index line chart of Vitis vinifera Chr.4, Chr.13, and Chr.14 (B) Combination figure of Salix sinopurpurea polyploidy. (A,B) correspond to each other. (1) The grape chromosome 4 (2) The grape chromosome 13 (3) The grape chromosome 14.
After determining the specific polyploidy, we can output the information of the labeled box participating in the polyploidy, and obtain the result.csv file of Vitis vinifera chromosomes 4, 13, and 14, in which the data of chromosome 13 is shown in Table 3.
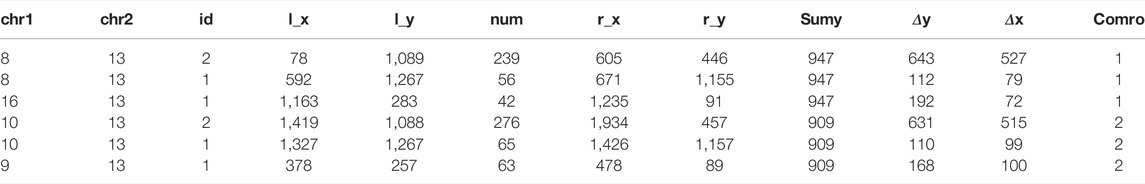
TABLE 3. Vitis vinifera Chr. 13 result.csv file.
According to the result.csv file, output the combined figure of the Salix sinopurpurea polyploidy (Figure 2B). When the combination round is 2, get the two groups with the highest scores, among which the chromosomes 5 and 6 of the Salix sinopurpurea can be combined into a relatively complete chromosome 4 of Vitis vinifera, the corresponding MI is 67.87%; the chromosomes 2 and 18 of the Salix sinopurpurea can be combined into a relatively complete chromosome 4 of Vitis vinifera, and the corresponding MI is 42.19%. The chromosomes 8 and 16 of the Salix sinopurpurea can be combined into a relatively complete Vitis vinifera chromosome 13 with MI of 73.93%; the chromosomes 9 and 10 of the Salix sinopurpurea can be combined into a relatively complete Vitis vinifera chromosome 4, MI is 70.96%. The chromosomes 5, 15, and 17 of Salix sinopurpurea can be combined into a relatively complete Vitis vinifera chromosome 14 with MI of 88.74%; the chromosomes 10, 13, 16, and 17 of Salix sinopurpurea can be combined into a relatively complete Vitis vinifera chromosome 14, MI is 79.88%.
In order to further verify the universality of the method, according to the procedure in 3.1, the model uses Arabidopsis thaliana as the reference genome to identify the polyploidy type of the target species Brassica rapa. Through reading the data of chromosomes 1, 3 and 5 of Arabidopsis thaliana, we finally get the gene collinearity evaluation index table of each chromosome in different combination rounds (Supplementary Table S2). In the collinearity evaluation index line chart (Figure 3A), it can be found that chromosomes 1, 3, and 5 of Arabidopsis thaliana had an obvious turning point when the combination round was 3. Therefore, it is determined that the Brassica rapa. had a whole genome triplication event recently. This conclusion can be found in Wang (2011a).
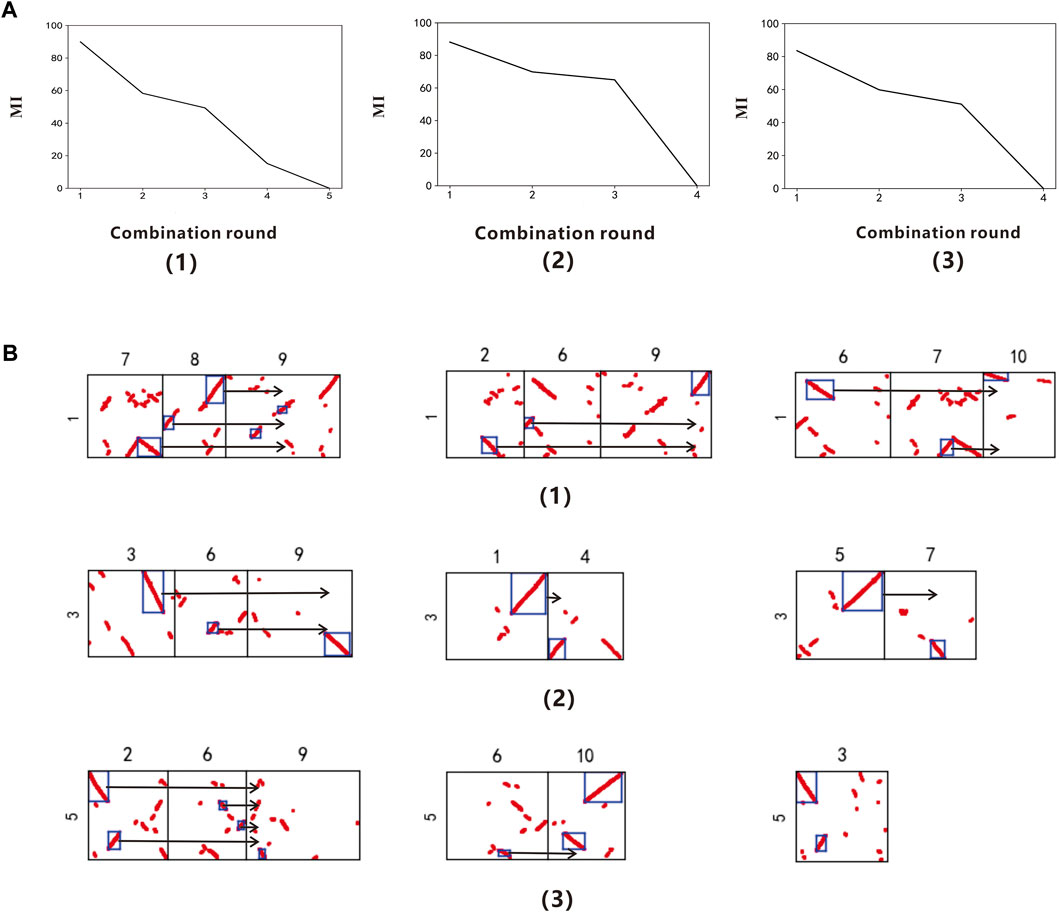
FIGURE 3. (A) Collinearity evaluation index line chart of Arabidopsis thaliana Chr.1, Chr.3 and Chr.5 (B) Combination figure of Brassica rapa polyploidy. (A,B) correspond to each other. (1) The Arabidopsis thaliana chromosome 1 (2) The Arabidopsis thaliana chromosome 3 (3) The Arabidopsis thaliana chromosome 5
After determining the specific polyploidy, the result.csv file of Arabidopsis thaliana chromosomes 1, 3, and 5 is obtained, in which the data of chromosome 3 is shown in Table 4.
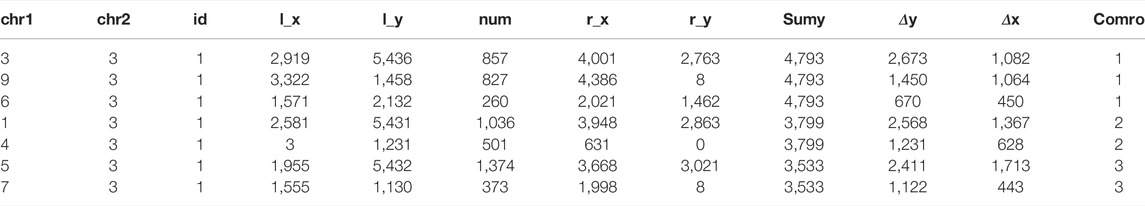
TABLE 4. Arabidopsis thaliana Chr. 3 result.csv file.
According to the result.csv file, output the combined figure of Brassica rapa polyploidy (Figure 3B). When the combination round is 3, get the three groups with the highest scores, among which the chromosomes 7, 8, and 9 of the Brassica rapa can be combined into a relatively complete chromosome 1 of Arabidopsis thaliana, the corresponding MI is 89.88%; the chromosomes 2, 6, and 9 of the Brassica rapa can be combined into a relatively complete chromosome 1 of Arabidopsis thaliana, and the corresponding MI is 58.31%; the chromosomes 6, 7, and 10 of the Brassica rapa can be combined into a relatively complete chromosome 1 of Arabidopsis thaliana, and the corresponding MI is 49.38%. The chromosomes 3, 6, and 9 of the Brassica rapa can be combined into a relatively complete Arabidopsis thaliana chromosome 3 with MI of 88.16%; the chromosomes 1 and 4 of the Brassica rapa can be combined into a relatively complete Arabidopsis thaliana chromosome 3 with MI of 69.87%; the chromosomes 5 and 7 of the Brassica rapa can be combined into a relatively complete Arabidopsis thaliana chromosome 3 with MI of 64.98%. The chromosomes 2, 6, and 9 of the Brassica rapa can be combined into a relatively complete Arabidopsis thaliana chromosome 5, MI is 83.54%; the chromosomes 6 and 10 of the Brassica rapa can be combined into a relatively complete Arabidopsis thaliana chromosome 5, MI is 59.84%; the chromosomes 3 of the Brassica rapa can be combined into a relatively complete Arabidopsis thaliana chromosome 5, MI is 51.17%.
In Figure 3B, there are two seemingly identical collinearity fragments among the four fragments formed by Arabidopsis thaliana chromosome 3 and Brassica rapa chromosome 4, with the naked eye. But only one is labeled and used, because it has a small number of homologous genes. So this method can break through the limitations of the human eye, and find chromosome fragments with strong collinearity, as well as provide a basis for objective judgment of polyploidy.
The previous study has mostly used to observe the atlas with prior knowledge to identify the polyploid types of the species. This method has some major limitations, such as low efficiency, high dependence on prior knowledge, strong subjectivity, lack of objective evaluation criteria, and easy introduction of human error. In this paper, digital image processing technology was used to identify polyploid types based on clustering algorithms. The KS dotplot of homologous genes was used as the research object, and the DBSCAN method was used to cluster. Then we can obtain the collinear fragments and automatically label collinear region. According to the gene collinearity evaluation index line chart of each combination, the model can determine the polyploid type and related chromosome combination. The study mainly focused on developing a polyploidization recognition algorithm and providing the method to speed up the evolutionary laws of gene structure associated with polyploidy research. PolyReco involves more than a simple labels of collinear regions, but also gives the polyploidy types through the collinearity evaluation index line chart and related chromosomes at the end. Compared with MCScanX (Wang et al., 2012), PolyReco labels the specific gene segments involved in the polyploidy events and improves the recognition efficiency of polyploidy. Compared to traditional methods, PolyReco reduces the dependence on prior knowledge, solves the limitations of the human eye in visual space, comply with artificial logic analysis and reasoning process. Moreover, the PolyReco can not only provides an effective method for large-scale rapid identification of genome polyploidy but also has important application value in distant hybrid breeding (Rabanus-Wallace et al., 2021).
In summary, the proposed PolyReco provides a reference model for processing automatically label collinear regions and recognize polyploidy. However, the KS dotplot is sensitive to the size of the parameter Eps. When a large value is used for Eps, the fragmented collinearity segments are easy to cluster together. On the contrary, it is easy to separate continuous fragments so that complete collinearity fragments cannot be clustered. In the next step, we expect to study the DBSCAN clustering method based on adaptive Eps to further optimize the clustering effect.
The original contributions presented in the study are included in the article/Supplementary Material, further inquiries can be directed to the corresponding author.
FW and KZ conceived and designed the experiments, performed the experiments, analyzed the data, prepared figures and/or tables, authored or reviewed drafts of the paper. RZ performed the experiments, analyzed the data, prepared figures and/or tables, and authored drafts of the paper. HL designed the experiments and analyzed the data. WZ and ZJ analyzed the data, prepared figures and/or tables. CW conceived and designed the experiments, authored or reviewed drafts of the paper. Manuscript is approved by all authors for publication.
This work was supported by Science and Technology Research Project of Hebei Province Colleges and Universities (No. QN2020421); the Scientific Research Project of Introducing Talents of Hebei Agricultural University (No. YJ201944); the Innovative Research Group Project of Hebei Natural Science Foundation (Grant No. C2020204111); the International Science and Technology Cooperation base Special Project of Hebei (Grant No. 20592901D); National Natural Science Foundation of China (31901864).
The authors declare that the research was conducted in the absence of any commercial or financial relationships that could be construed as a potential conflict of interest.
All claims expressed in this article are solely those of the authors and do not necessarily represent those of their affiliated organizations, or those of the publisher, the editors and the reviewers. Any product that may be evaluated in this article, or claim that may be made by its manufacturer, is not guaranteed or endorsed by the publisher.
The Supplementary Material for this article can be found online at: https://www.frontiersin.org/articles/10.3389/fgene.2022.842387/full#supplementary-material
Cheng, S., Xian, W., Fu, Y., Marin, B., Keller, J., Wu, T., et al. (2019). Genomes of Subaerial Zygnematophyceae Provide Insights into Land Plant Evolution. Cell 179 (5), 1057–1067. doi:10.1016/j.cell.2019.10.019
Dong, S., Liu, M., Liu, Y., Chen, F., Yang, T., Chen, L., et al. (2021). The Genome of Magnolia Biondii Pamp. Provides Insights into the Evolution of Magnoliales and Biosynthesis of Terpenoids. Hortic. Res. 8 (1), 38. doi:10.1038/s41438-021-00471-9
Edgar, R. C. (2004). MUSCLE: a Multiple Sequence Alignment Method with Reduced Time and Space Complexity. BMC Bioinformatics 5, 113. doi:10.1186/1471-2105-5-113
Hao, M., Li, A., Shi, T., Luo, J., Zhang, L., Zhang, X., et al. (2017). The Abundance of Homoeologue Transcripts Is Disrupted by Hybridization and Is Partially Restored by Genome Doubling in Synthetic Hexaploid Wheat. Bmc Genomics 18, 149. doi:10.1186/s12864-017-3558-0
Li, Z., Defoort, J., Tasdighian, S., Maere, S., Van de Peer, Y., and De Smet, R. (2016). Gene Duplicability of Core Genes Is Highly Consistent across All Angiosperms. Plant Cell 28 (2), 326–344. doi:10.1105/tpc.15.00877
Marcet-Houben, M., and Gabaldón, T. (2015). Beyond the Whole-Genome Duplication: Phylogenetic Evidence for an Ancient Interspecies Hybridization in the Baker's Yeast Lineage. Plos Biol. 13 (8), e1002220. doi:10.1371/journal.pbio.1002220
Miyata, T., Yasunaga, T., and Nishida, T. (1980). Nucleotide Sequence Divergence and Functional Constraint in mRNA Evolution. Proc. Natl. Acad. Sci. U.S.A. 77 (12), 7328–7332. doi:10.1073/pnas.77.12.7328
Nei, M., and Gojobori, T. (1986). Simple Methods for Estimating the Numbers of Synonymous and Nonsynonymous Nucleotide Substitutions. Mol. Biol. Evol. 3 (5), 418–426. doi:10.1093/oxfordjournals.molbev.a040410
Rabanus-Wallace, M. T., Hackauf, B., Mascher, M., Lux, T., Wicker, T., Gundlach, H., et al. (2021). Chromosome-scale Genome Assembly Provides Insights into rye Biology, Evolution and Agronomic Potential. Nat. Genet. 53 (4), 564–573. doi:10.1038/s41588-021-00807-0
Sun, P., Jiao, B., Yang, Y., Shan, L., Li, T., Li, X., et al. (2021). WGDI: A User-Friendly Toolkit for Evolutionary Analyses of Whole-Genome Duplications and Ancestral Karyotypes. bioRxiv. doi:10.1101/2021.04.29.441969
Wang, J., Sun, P., Li, Y., Liu, Y., Yang, N., Yu, J., et al. (2018). An Overlooked Paleotetraploidization in Cucurbitaceae. Mol. Biol. Evol. 35 (1), 16–26. doi:10.1093/molbev/msx242
Wang, J., Sun, P., Li, Y., Liu, Y., Yu, J., Ma, X., et al. (2017). Hierarchically Aligning 10 Legume Genomes Establishes a Family-Level Genomics Platform. Plant Physiol. 174 (1), 284–300. doi:10.1104/pp.16.01981
Wang, J., Yuan, J., Yu, J., Meng, F., Sun, P., Li, Y., et al. (2019). Recursive Paleohexaploidization Shaped the Durian Genome. Plant Physiol. 179 (1), 209–219. doi:10.1104/pp.18.00921
Wang, X., Wang, H., Wang, J., Sun, R., Wu, J., Liu, S., et al. (2011). The Genome of the Mesopolyploid Crop Species Brassica Rapa. Nat. Genet. 43 (10), 1035–1039. doi:10.1038/ng.919
Wang, X., Tang, H., Bowers, J. E., Feltus, F. A., and Paterson, A. H. (2007). Extensive Concerted Evolution of rice Paralogs and the Road to Regaining independence. Genetics 177 (3), 1753–1763. doi:10.1534/genetics.107.073197
Wang, Y., Tang, H., Debarry, J. D., Tan, X., Li, J., Wang, X., et al. (2012). MCScanX: a Toolkit for Detection and Evolutionary Analysis of Gene Synteny and Collinearity. Nucleic Acids Res. 40 (7), e49. doi:10.1093/nar/gkr1293
Wong, K. M., Suchard, M. A., and Huelsenbeck, J. P. (2008). Alignment Uncertainty and Genomic Analysis. Science 319 (5862), 473–476. doi:10.1126/science.1151532
Xu, Z., Gao, R., Pu, X., Xu, R., Wang, J., Zheng, S., et al. (2020). Comparative Genome Analysis of Scutellaria Baicalensis and Scutellaria Barbata Reveals the Evolution of Active Flavonoid Biosynthesis. Genomics, Proteomics & Bioinformatics 18 (3), 230–240. doi:10.1016/j.gpb.2020.06.002
Yan, F., Xi, R. M., She, R. X., Chen, P. P., Yan, Y. J., Yang, G., et al. (2021). Improved De Novo Chromosome‐level Genome Assembly of the Vulnerable walnut Tree Juglans Mandshurica Reveals Gene Family Evolution and Possible Genome Basis of Resistance to Lesion Nematode. Mol. Ecol. Resour. 21 (6), 2063–2076. doi:10.1111/1755-0998.13394
Yang, Z., Nielsen, R., Goldman, N., and Pedersen, A.-M. K. (2000). Codon-substitution Models for Heterogeneous Selection Pressure at Amino Acid Sites. Genetics 155 (1), 431–449. doi:10.1093/genetics/155.1.431
Zhang, Y., Wang, F. S., Zhang, Z. K., Jia, Z. X., and Wang, C. Y. (2021). Music Emotion Recognition Method Based on Multi Feature Fusion. Ijart 13, 1–22. doi:10.1504/ijart.2021.10043883
Keywords: clustering, collinearity fragment, polyploidy, DBSCAN, chromosome
Citation: Wang F, Zhang K, Zhang R, Liu H, Zhang W, Jia Z and Wang C (2022) PolyReco: A Method to Automatically Label Collinear Regions and Recognize Polyploidy Events Based on the KS Dotplot. Front. Genet. 13:842387. doi: 10.3389/fgene.2022.842387
Received: 23 December 2021; Accepted: 21 March 2022;
Published: 20 April 2022.
Edited by:
Manish Kumar Pandey, International Crops Research Institute for the Semi-Arid Tropics (ICRISAT), IndiaReviewed by:
Victor A. Albert, University at Buffalo, United StatesCopyright © 2022 Wang, Zhang, Zhang, Liu, Zhang, Jia and Wang. This is an open-access article distributed under the terms of the Creative Commons Attribution License (CC BY). The use, distribution or reproduction in other forums is permitted, provided the original author(s) and the copyright owner(s) are credited and that the original publication in this journal is cited, in accordance with accepted academic practice. No use, distribution or reproduction is permitted which does not comply with these terms.
*Correspondence: Chunyang Wang, c2htd2N5QGhlYmF1LmVkdS5jbg==
†These authors share first authorship between correspondence and specialty section
Disclaimer: All claims expressed in this article are solely those of the authors and do not necessarily represent those of their affiliated organizations, or those of the publisher, the editors and the reviewers. Any product that may be evaluated in this article or claim that may be made by its manufacturer is not guaranteed or endorsed by the publisher.
Research integrity at Frontiers
Learn more about the work of our research integrity team to safeguard the quality of each article we publish.