
94% of researchers rate our articles as excellent or good
Learn more about the work of our research integrity team to safeguard the quality of each article we publish.
Find out more
ORIGINAL RESEARCH article
Front. Genet., 08 April 2022
Sec. Human and Medical Genomics
Volume 13 - 2022 | https://doi.org/10.3389/fgene.2022.832331
This article is part of the Research Topic10 Years of Frontiers in Genetics: past discoveries, current challenges and future perspectivesView all 31 articles
 Jinlin Kang1,2,3†
 Na li1,2,3,4†
 Fen Wang1,2,3†
 Yan Wei1,2,3
 Yangyang Zeng1,2,3Qifan Luo1,2,3Xuehua Sun1,2,3Hui Xu1,2,3Jin Peng1,2,3*Fuxiang Zhou1,2,3*
Purpose: Mitochondrial dysfunction refers to cancer immune evasion. A novel 7-gene prognostic signature related to the mitochondrial DNA copy number was utilized to evaluate the immunocyte infiltration in colon cancer according to the risk scores and to predict the survival for colon cancer.
Experimental design: We performed an integrated bioinformatic analysis to analyze transcriptome profiling of the EB-treated mitochondrial DNA–defected NCM460 cell line with differentially expressed genes between tumor and normal tissues of COAD in TCGA. The LASSO analysis was utilized to establish a prognostic signature. ESTIMATE and CIBERSORT validated the differences of immunocyte infiltration between colon cancer patients with high- and low-risk scores.
Results: Our study identified a 7-gene prognostic signature (LRRN2, ANKLE1, GPRASP1, PRAME, TCF7L1, RAB6B, and CALB2). Patients with colon cancer were split into the high- and low-risk group by the risk scores in TCGA (training cohort: HR = 2.50 p < 0.0001) and GSE39582 (validation cohort: HR = 1.43 p < 0.05). ESTIMATE and CIBERSORT revealed diverseness of immune infiltration in the two groups, especially downregulated T-cell infiltration in the patients with high-risk scores. Finally, we validated the colon patients with a low expression of the mitochondrial number biomarker TFAM had less CD3+ and CD8+ T-cell infiltration in clinical specimens.
Conclusion: An mtDNA copy number-related 7-gene prognostic signature was investigated and evaluated, which may help to predict the prognosis of colon cancer patients and to guide clinical immunotherapy via immunocyte infiltration evaluation.
Colon cancer is the fourth most common malignant tumor, which caused approximately 247,563 deaths in China in 2018 (Feng et al., 2019). The incidence and mortality of colorectal cancer increased rapidly with the economic development in recent years (Chen et al., 2016). Molecular testing plays an increasingly important role in estimating prognosis and deciding the best therapy for colon cancer patients with worse prognosis (Van Cutsem et al., 2016). We focused on mitochondrial dysfunction, which has been proved to play diverse roles in cancer metabolism, immune response, and cell signaling pathways (Hutson et al., 1988; West et al., 2011; Wallace, 2012). Mitochondria have their own 16-kilobase mitochondrial genome independent of the nucleus genome, which encodes two rRNAs, 22 tRNAs, and 13 polypeptides. The alterations of mitochondrial DNA (mtDNA) contribute to aberrant mitochondrial respiration, metabolism, and other cellular functions (Yu, 2011). Metabolism alteration has been commonly acknowledged as one of the hallmarks of cancer, which is associated with tumorigenesis, tumor microenvironment, cell progression, immune infiltration, and treatment response (Elia and Fendt, 2016; Pavlova and Thompson, 2016; Lunt and Fendt, 2017). Notably, increasing evidence demonstrated the relationship between immune cell infiltration and dysregulated metabolic pathways (Peteret al., 2017; Li et al., 2019). The alterations of metabolism promoted reprogramming of the tumor microenvironment (TME), herein enhanced immunostimulation (Cheng et al., 2014; Arts et al., 2016).
Following the inspiring success in melanoma and lung cancer, immunotherapy has been applied in the treatment of colon cancer since 2017. However, current immune checkpoint inhibitors (ICIs) merely showed less effect in several restricted subtypes of colon cancer (Ganesh et al., 2019). Accumulating evidence suggests that less infiltration of immunocytes showed the contribution of immune resistance (Herrera et al., 2013). The immune system recognizes itself through binding T-cell receptors (TCRs) to the human leukocyte antigen (HLA). This process is modulated by co-stimulatory factors named immune checkpoints, such as programmed cell death 1 (PD1) and cytotoxic T-lymphocyte antigen 4 (CTLA4) (Sharma and Allison, 2015). However, there were only few studies that clarified the relationship between mtDNA copy number reduction and tumor immunocyte infiltration. The value of aforementioned seven signature genes in predicting the immunocyte infiltration in colon cancer was assessed. Subsequently, the results were validated in GSE39582 (n = 550) and estimated using the ESTIMATE algorithm. Taken together, we utilized integrated bioinformatic analysis to select seven significant genes positively related to mitochondrial content reduction and confirmed their potential values in colon cancer to predict the prognosis and evaluate immune infiltration.
HTSeq-FPKM workflow type transcriptome data and clinical data of colon adenocarcinoma (COAD) were obtained from TCGA (https://portal.gdc.cancer.gov). GEO datasets (GSE39582) were obtained from GEO (https://www.ncbi.nlm.nih.gov/geo/). Only those patients whose overall survival days were more than 30 days were collected.
The human immortalized colon cell line NCM460 was acquired from Procell Company. (Wuhan, China). The cells were cultured in Dulbecco’s modified Eagle medium (DMEM; Thermo Fisher, United States) with 10% fetal bovine serum (Gibco, United States) and 1% pen-strep (100 U/ml penicillin and 100 mg/ml streptomycin) (Gibco, United States). The mtDNA copy number knockdown was induced by maintaining in 50 ng/ml ethidium bromide (EB) with 1 mM sodium pyruvate (Sigma-Aldrich, St. Louis, MO, United States) and 50 μg/ml uridine (Sigma-Aldrich, St. Louis, MO, United States) ethidium bromide (EB) maintained for over 4 months.
Total RNA was extracted from NCM460 using TRIzol. RNA samples were taken from EB-treated NCM460 and normal NCM460 cells; RNA transcriptome analysis was conducted by Seqhealth Technology Company (Wuhan, China).
The transcriptome data of NCM460 and EB-treated NCM460 cells, COAD in TCGA dataset, and GSE39582 were extracted for further analysis. Differences between tumor tissue and adjacent normal tissue were collected using the limma package. |logFC| more than 0.5 and the false discovery rate (FDR) less than 0.05 were set down as the cut-off standard.
The functional analysis of DEGs was implemented using clusterProfiler.
The analysis of the PPI network with the confidence score >0.9 was performed using the Metascape website (https://metascape.org) and Cytoscape. In order to visualize the PPI network and screen out valuable hub genes, we utilized the MCODE plug‐in of Cytoscape software with the degree as 5, node score as 0.2, k‐core as 2, and maximum depth as 100 for cut‐off criteria
The correlation scores of individual samples were evaluated using the ESTIMATE algorithm. The expressions of the HLA family genes, CTLA4, and 22 immune-related subtypes were analyzed between the low-risk and high-risk groups using the limma and CIBERSORT package.
The Kaplan–Meier survival analysis was performed to assess the correlation between the patient survival probability and different groups, which were characterized by the risk score related to the 7-gene feature expression in TCGA calculated by LASSO. The results were validated in GSE39582 (n = 550).
All of the 475 DEGs (p < 0.05) were screened by overlapping transcriptome DEGs from tumor vs. adjacent normal tissue and DEGS from NCM460 cells treated with ethidium bromide (EB) or not. Among them, 12 genes were assayed by LASSO Cox analysis with 10-round cross-validation. Stepwise multiple Cox regression analysis was performed to select and optimize prognostic features. Univariate and multivariate Cox regression analyses assessed the independence of the prognostic signature from clinical factors. Time-dependent ROC analysis was performed using the survival package. Nomogram and calibration curves were accomplished using the rms package.
Patients pathologically diagnosed by biopsy in Zhongnan hospital, Wuhan University, in the past 3 years were included in our research. The paraffin sections of surgical tissues of 39 colon cancer patients were used for the immunohistochemical analyses. These sections were put into xylene, absolute ethanol, 85% alcohol, and 75% alcohol for deparaffinzation and rehydration. The tissue sections were filled with citric acid (PH6.0) in a microwave oven and heated on medium power for antigen retrieval. The sections were put into 3% hydrogen peroxide and incubated at 4°C in darkness. To cover the tissues, the sections were sealed for 30 min in 3%BSA at 4°C. The sections were placed flat in a wet box and incubated with primary antibodies against transcription factor A (TFAM, Proteintech), CD3 (Servicebio GB13014), and CD8 (Servicebio GB13429 overnight at 4°C. The samples were then incubated with the secondary antibody (HRP-labeled) for 50 min. The samples were visualized and counterstained with DAB and hematoxylin and then dehydrated in ethanol and cleared in xylene. The sections were placed and shaken on the decolorization shaker three times completely for 15 min in PBS(PH7.4) after each step. The intensities of CD3, CD8, and TFAM were visualized by Image-Pro Plus 6.0 and were analyzed by Halo (India labs, United States).
Total RNA of SW480 cells was extracted using the RNeasy Mini Kit, while reverse transcription was performed using the Prime Script RT Reagent Kit. SYBR Premix Ex Taq (Aidlab Biotechnologies) was utilized for real-time PCR at an ABI Prism 7900 instrument (Applied Biosystems).
The primer sequences used in this research are as follows:
LRRN2: F CGAGGCTACCACTGTGGAC
LRRN2: R GGGCATCCGAAAAGCTGTTC
ANKLE1: F GACCCCAACGCTCGATCTG
ANKLE1: R TCGGGCTCCTGAGTCTCTG
GPRASP1: F AGGAGGAGACCAATATGGGGT
GPRASP1: R GGACCTAGACATGGTATTAGCCT
PRAME: F TGGAATTAACTTGTGGCAACCT
PRAME: R TCTGACAGCCCTCTAACACGA
TCF7L1: F TCGTCCCTGGTCAACGAGT
TCF7L1: R ACTTCGGCGAAATAGTCCCG
RAB6B: F TGTACGACAGCTTCGACAACA
RAB6B: R CTGCGGAACCTCTCCTGAC
CALB2: F ACTTTGACGCAGACGGAAATG
CALB2: R GAAGTTCTCTTCGGTTGGCAG
β-Actin: F CATGTACGTTGCTATCCAGGC
β-Actin: R CTCCTTAATGTCACGCACGAT
Statistical analysis was performed in R version 4.0.3. The correlations of protein expression in pathological data were analyzed using prism 7.
The gene expression profile of the mtDNA-reduced NCM460 cell line, which was derived from the normal human colon mucosal epithelium, was analyzed using the “limma” package. A total of 2075 DEGs were screened, of which 794 genes were upregulated while 1281 genes were downregulated. The results are shown in Figures 1A,B. To first realize the function of DEGs of EtBr-treated colon cells, the alternated DEGs were transmitted to the “clusterProfiler” for functional annotations. GO and KEGG term enrichment analyses showed that the upregulated DEGs were fairly enriched, as shown in (Figures 1C–F). Furthermore, we found that DEGs in the biological process (BP) group were enriched in “signal transduction, cell adhesion, oxidation–reduction process, positive regulation of GTPase activity, and positive regulation of cell proliferation” based on the results of GO analysis of all DEGs. In the cellular composition (CC) group, all DEGs were associated with the “integral component of membrane, plasma membrane, cytosol, extracellular exosome, and integral component of plasma membrane.” In addition, the terms “calcium ion binding, receptor binding, kinase activity, heparin binding, and oxidoreductase activity” were enriched in the molecular function (MF) module. These apparently elevated terms of DEGs supported the notion that they functioned in carcinogenesis and progression for colon cancer in patients with mtDNA content reduction.
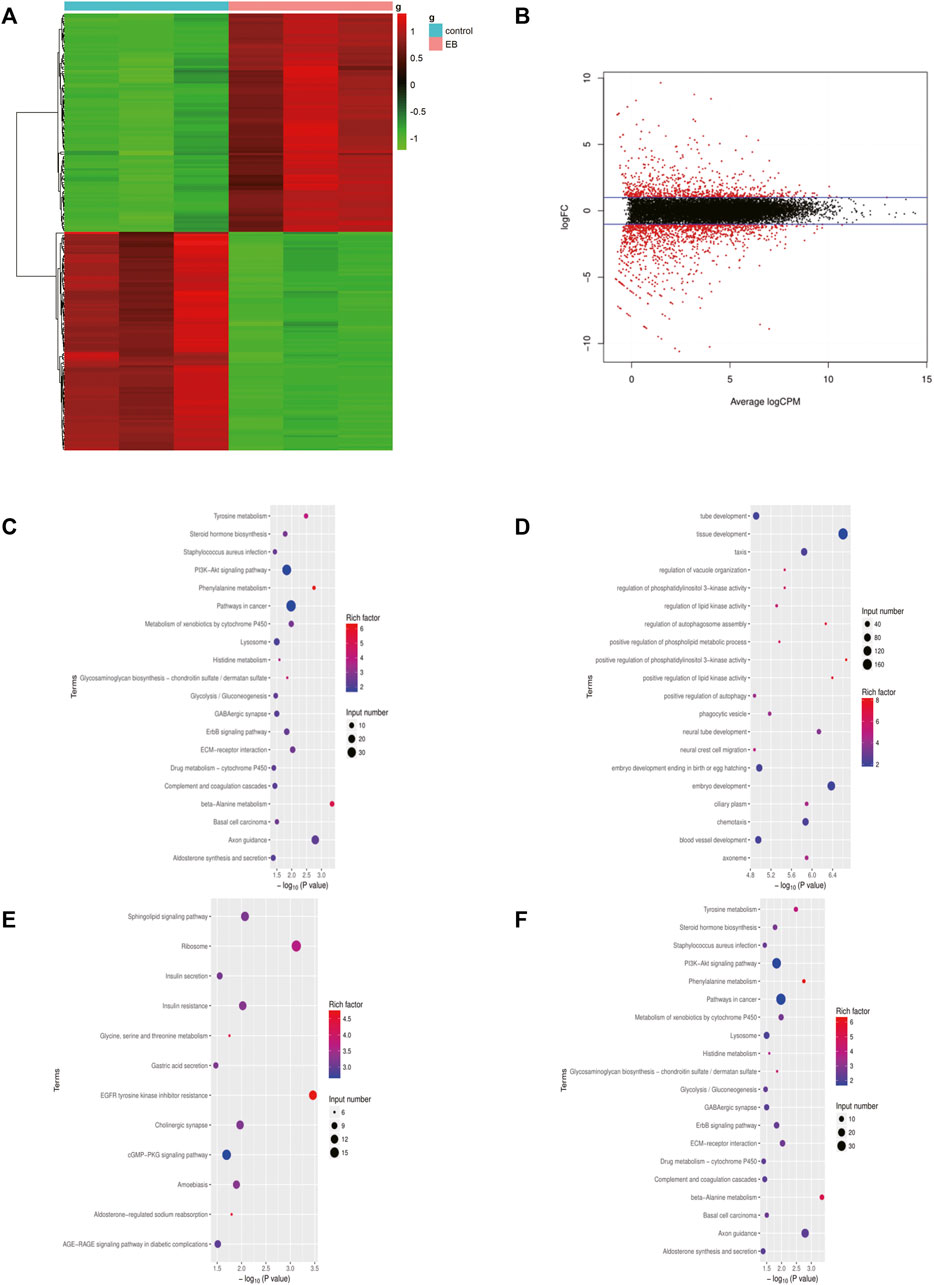
FIGURE 1. DEGs identified in the EB-treated NCM460 cell line. (A) Heatmap of the top 200 DEGs by |logFC|. The color from blue to red indicates low to high expression level. (B) Volcano map between EB-treated and control groups of the NCM460 cell line. (C,D) Enriched terms in GO analysis of DEGs in EB-treated NCM460, respectively. (E,F) Enriched terms in KEGG analysis of DEGs in EB-treated NCM460 DEGs, respectively; DEGS means differentially expressed genes; logFC means log fold change.
Comparing the transcriptome of NCM460 and the EtBr-treated NCM460 cell line, 2075 DEGs were identified, which were composed of 794 upregulated genes and 1281 downregulated genes. We selected 475 DEGs using the Venn diagram of prognostic genes in TCGA datasets and EB-treated NCM460 DEGs (Figures 2A,B). Functional analysis was performed via clusterProfiler in R. The top GO terms included the carboxylic acid biosynthetic process and organic acid biosynthetic process. The network of GO enriched terms is displayed in Figures 2C,D. Anion transmembrane transporter activity and glycosaminoglycan binding are enriched in the biological processes (BPs). Interestingly, there are no items enriched in the cellular composition (CC), and the top 15 terms are the same in all GO and MF (Figure 2C). It seemed DEGs are mostly correlated with the biosynthetic process and transmembrane transport. In addition, 475 DEGs were analyzed using the Search Tool for the Retrieval of Interacting Genes database (STRING) and performed to formulate the protein–protein interaction (PPI) network (Figure 2E). Central modules were instituted using Molecular Complex Detection (MCODE) (Figure 2F). The results gained from STRING showed that the PPI network of DEGs consisted of 252 nodes and 444 edges. The top 30 distinguished proteins were classified as hub genes, which might play vital roles in the mtDNA content reduction related to tumor initiation through PPI analysis. A total of eight clusters were generated in MCODE, and the top three clusters were selected as hub modules by the scores evaluated in MCODE (Supplementary Table S2). The 11 genes in MCODE1 (CCR10, CXCL16, CXCL2, CXCL3, CXCL8, GPER1, NMU, SAA1, BDKRB2, CCL20, and CCL5) were associated with cell chemotaxis, which induced the directional migration of cells including cancer cells and immune cells.
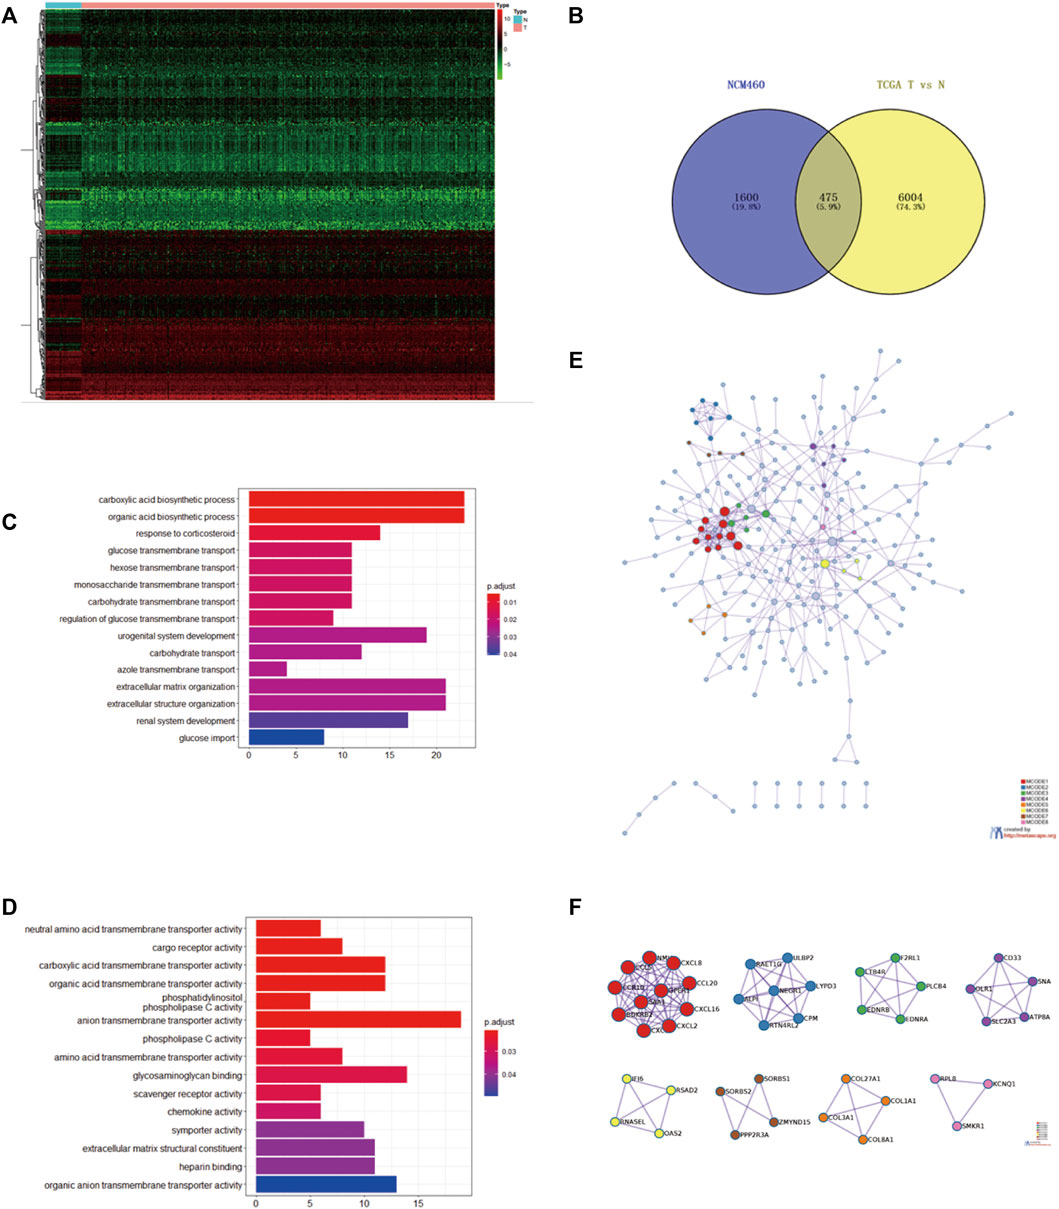
FIGURE 2. Intersection of the mtDNA-related gene and prognostic gene in TCGA (A). Heatmap of the top 200 DEGs identified between tumor and compared normal tissues from COAD in TCGA based on the value of |logFC| (B). Intersection of 475 common DEGs with the prognostic value in TCGA and EB-treated NCM460 using the Venn diagram. Top three hub modules were classified in MODE. Red circles represented upregulated genes, while blue circles represented downregulated genes. (C,D) Heatmap of GO enriched terms and biological process (BP) GO enriched terms. (E) PPI network of the common 475 genes calculated by STRING software from the Metascape website (F) Top eight modules of the PPI network; GO, gene ontology; PPI, protein–protein interaction [Color figure can be viewed at wileyonlinelibrary.com].
We implemented a prognostic analysis of 475 DEGs by the overlap of prognostic genes in TCGA datasets and NCM460 EB-related DEGs. The significant prognostic factors revealed by univariate Cox proportional hazards regression (p < 0.001) were SNAP25, LRRN2, ANKLE1, GPRASP1, CD37, PRAME, PDZD4, TCF7L1, RAB6B, CALB2, DUSP9, and SUSD5 (Supplementary Table S1).From the least absolute shrinkage and selection operator (LASSO) Cox regression analysis, 12 genes were filtered for stepwise multivariate Cox regression analysis (Supplementary Table S1). Finally, seven key genes (LRRN2, ANKLE1, GPRASP1, PRAME, TCF7L1, RAB6B, and CALB2) were generated to manufacture the prognostic signature: risk score = 0.231*LRRN2+ 0.448*ANKLE1+0.086*GPRASP1+ 0.118*PRAME+ 0.104*TCF7L1+ 0.171*RAB6B+ 0.049*CALB2. The distribution of the risk score, survival status, and gene expression profiles between the two groups in TCGA and GSE39582 are displayed in Fig.4.
Colon cancer patients in TCGA were split into a high‐risk group and a low‐risk group by the median risk score and then validated in GSE39582 dataset (Figures 3A–F). As a result, the overall survival time of patients in the low‐risk group was significantly longer than that of the high‐risk group (n = 413, HR = 2.5,p < 0.0001), which was also validated in GSE39582 (n = 550,HR = 1.4, p < 0.05) (Figures 4A,B). The distribution of risk scores with age, gender, stage, pathologic stage(T), pathologic lymph node status, and metastasis were also analyzed by univariate and multivariate cox proportional hazards regression in the training dataset and validated dataset (Figures 4C–J).
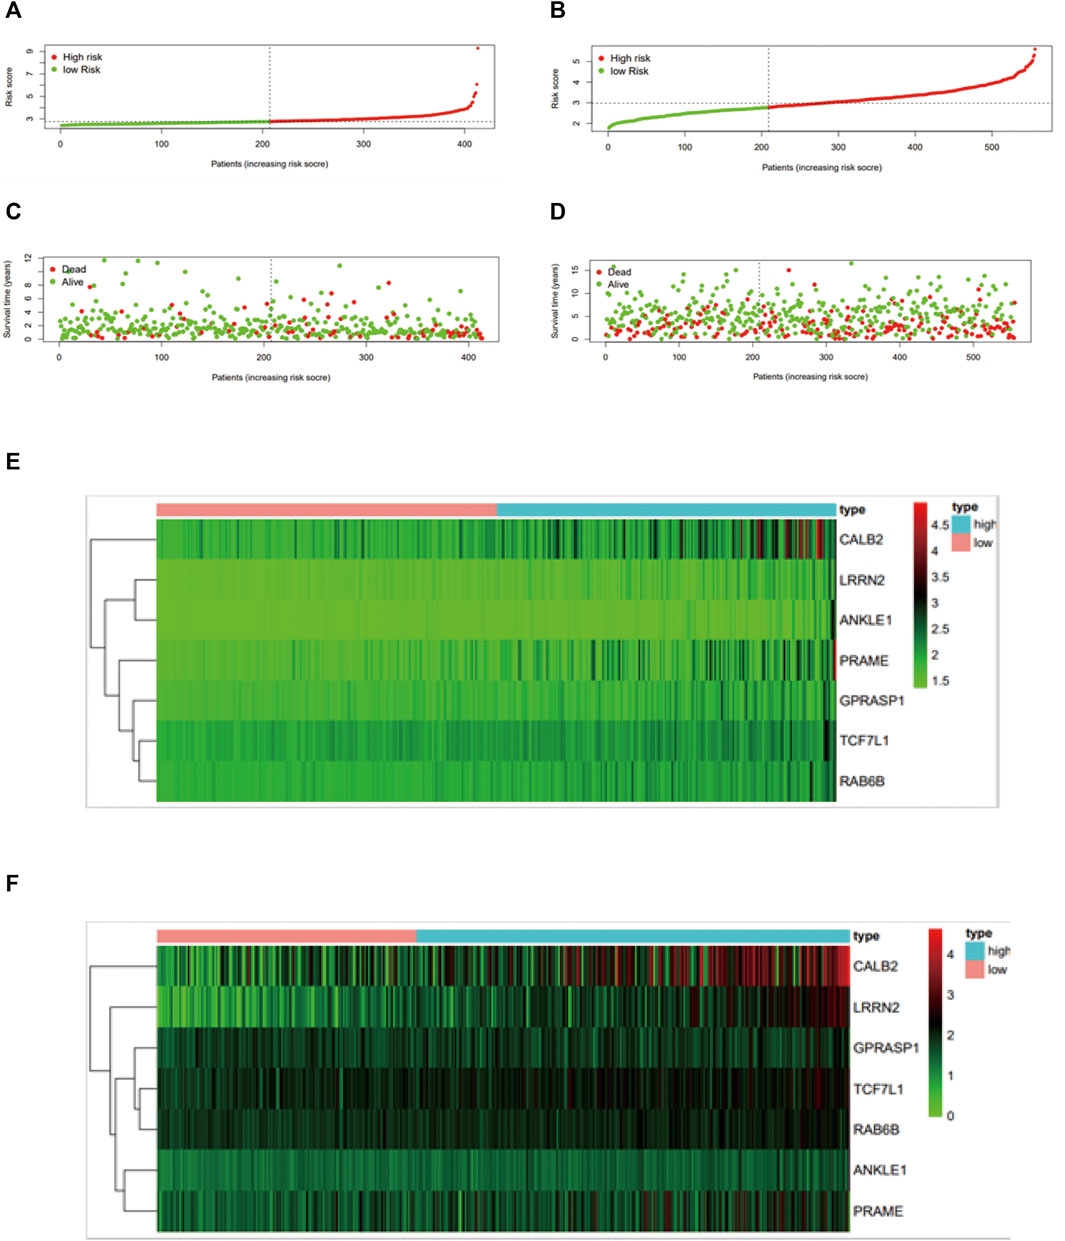
FIGURE 3. Construction and validation of the mtDNA-related prognostic signature. Assessment of LASSO regression analysis of 475 DGEs is shown here. (A) Risk score, (C) survival status, and (E) profiles of mtDNA-associated gene expression. The value of the mtDNA-related prognostic signature was validated in GSE39582 by the (B) risk score, (D) survival status, and (F) mtDNA-related gene expression profiles, and GSE39582 was displayed in Figure 4.
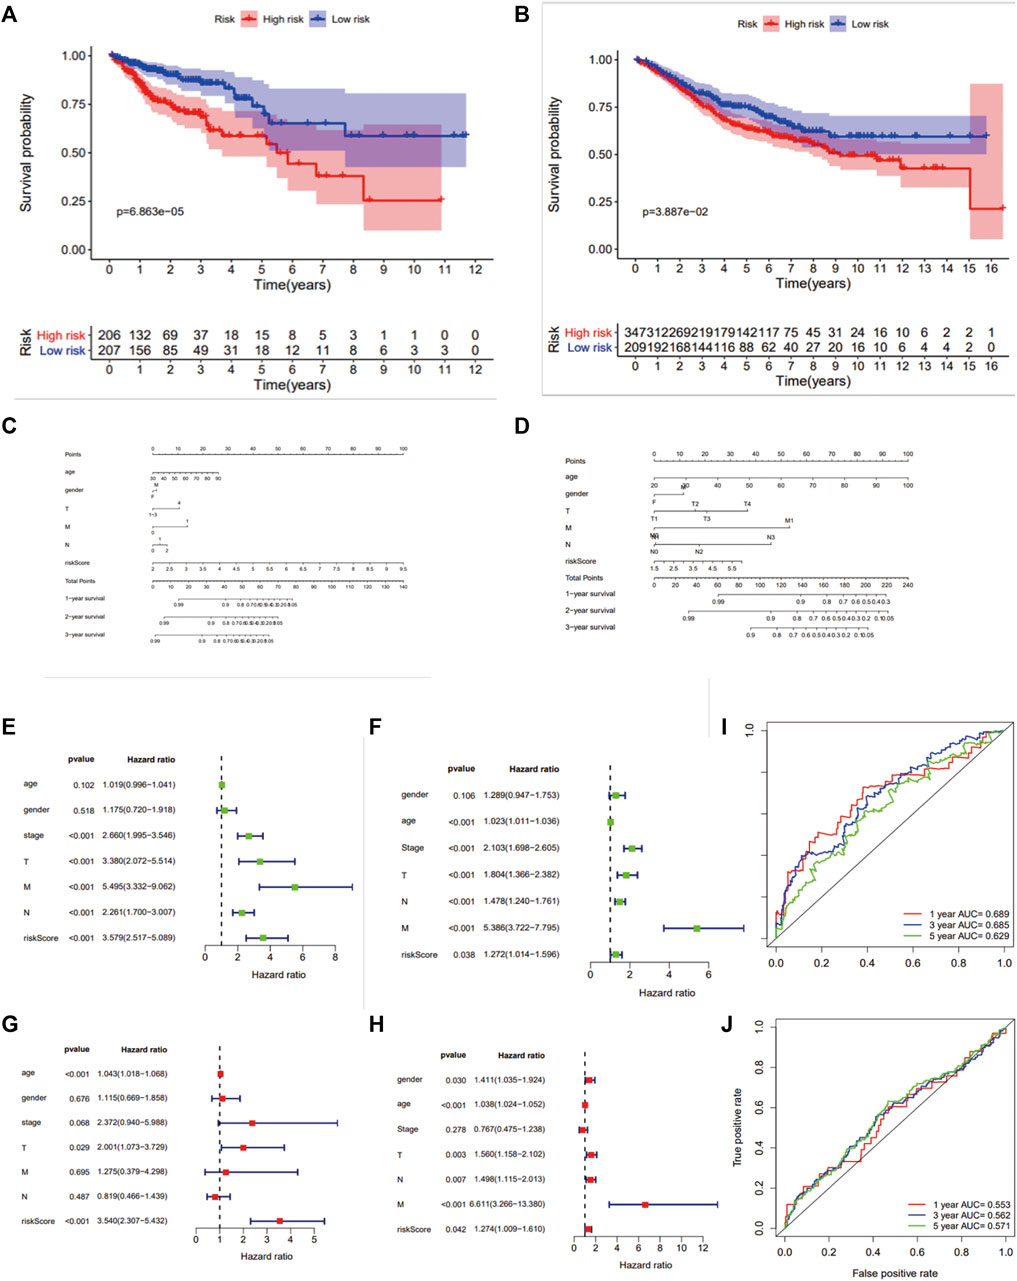
FIGURE 4. Survival analysis and ROC analysis of the 7-gene prognostic signature. Kaplan–Meier survival curves of OS (A,B), OS predictive nomogram (C,D), univariate (E,F) and multivariate Cox proportional hazards regression (G,H) and ROC curves (I,J) in patients with colon carcinoma in TCGA and GSE39582.
Recent studies suggest that the reprogramming of tumor metabolism led to local immunosuppression in the tumor microenvironment. An integrated bioinformatic analysis was applied to evaluate the differences of immune infiltration between the two groups with high- and low-risk scores established previously. As a result (Figure 5), the high-risk score group shows a higher ESTIMATE (p < 0.001), immune (p < 0.05), and stromal scores (p < 0.001) with a lower tumor purity (p < 0.001), which indicated that these patients with high risk scores may have strong infiltration of immune cells and stromal cells. Patients in the high-risk score group had a low-level expression in 12 HLA genes of the whole 24 HLA families and a higher expression of CTLA4 (p < 0.01) but no difference in the PDL1 expression.
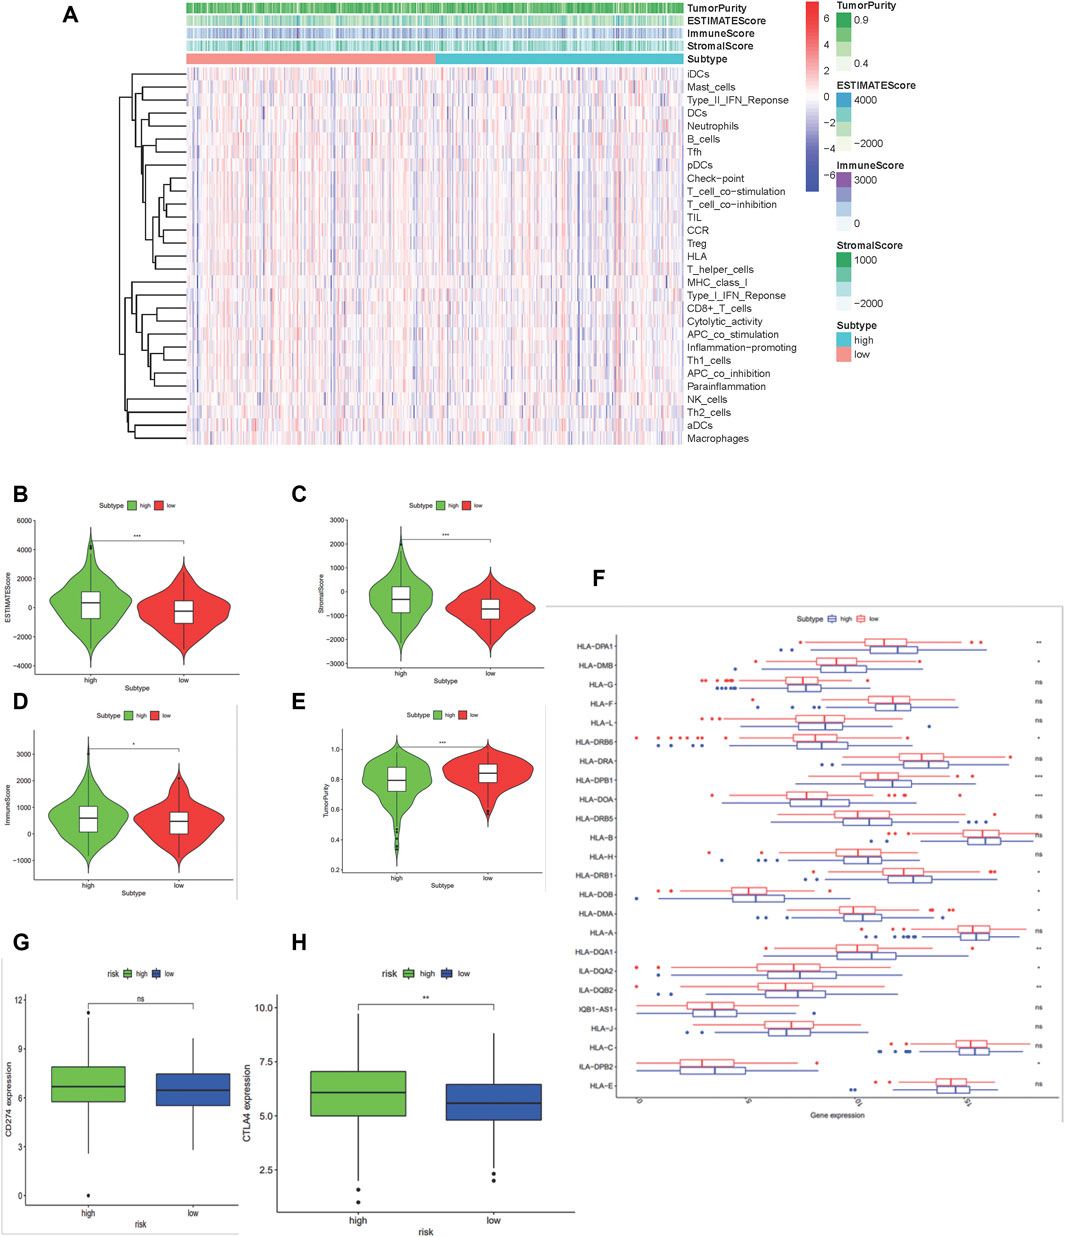
FIGURE 5. Construction and certification of mtDNA-related patients groups in colon carcinoma samples. (A) Binary risk group constructed by LASSO regression analysis of 475 DGEs and further validated using the ESTIMATE algorithm. (B–E) Differences of scores calculated by the ESTIMATE between the high-risk and low-risk group. (F) Boxplot shows the expression of HLA family genes. (G–H) Expressions of PD-L1 (CD274) and CTLA4. (*:p < 0.05 **:p < 0.01 ***: p < 0.001).
Compared to the low-risk group, CIBERSORT displayed different immune cell infiltrations in the high-risk group: downregulated dendritic cells (p = 0.006), CD8+ T cells (p = 0.008), and CD4+ activated memory T cells (p <0.0001), while upregulated naïve B cells (p = 0.032), M0 macrophages (p <0.0001), T regulatory cells (p = 0.024), and eosinophils (p = 0.011). These results suggested that patients with the high-risk score might benefit less from immunotherapy, which showed the value of the 7-gene prognostic signature in predicting the efficacy of immune checkpoint inhibitor immunotherapy. Above results are shown in Figure 6
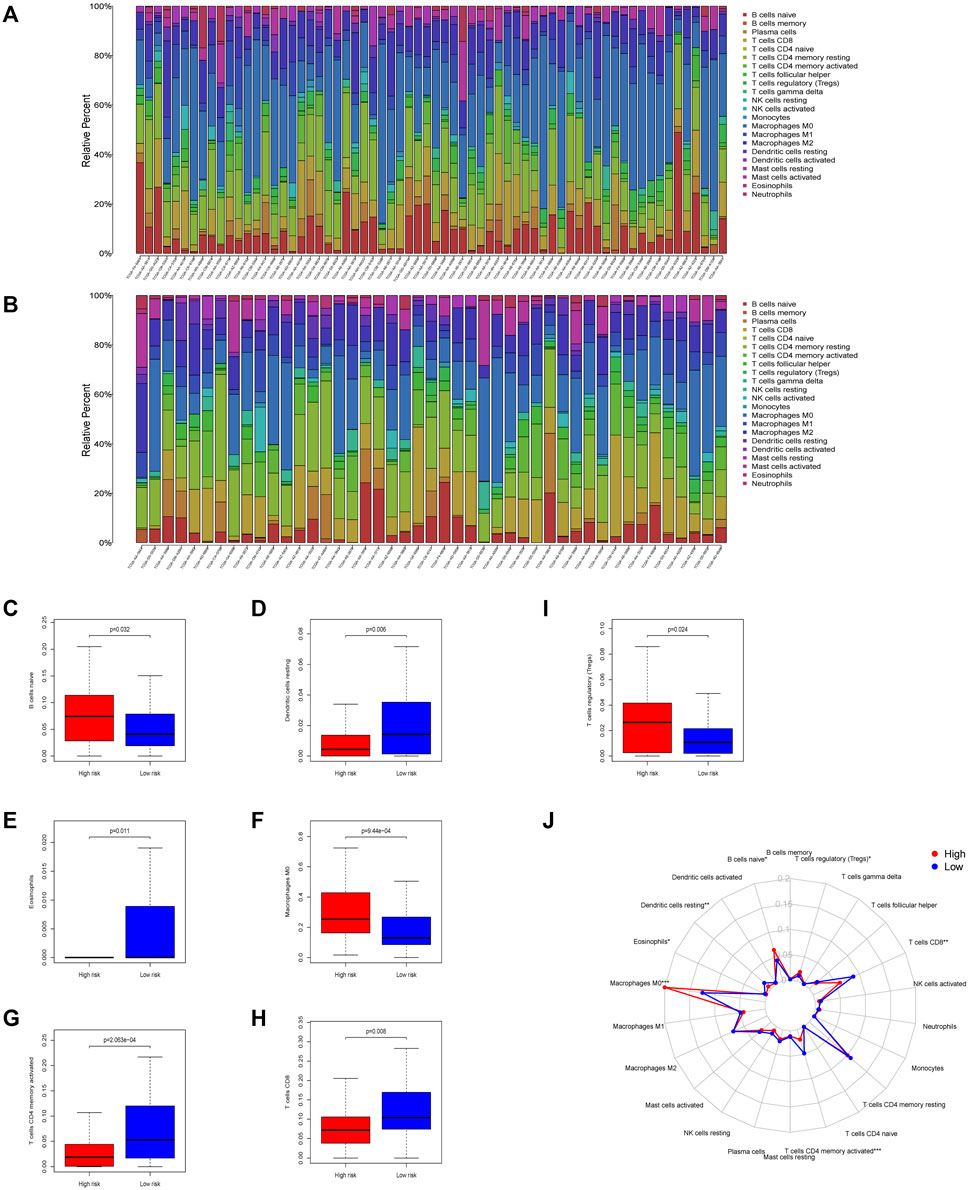
FIGURE 6. Immune infiltration conditions between the two mtDNA-related groups in colon carcinoma samples. Immune infiltration of high- (A) and low-(B) risk group calculated using the CIBERSORT algorithm was shown in the two barplot, respectively. (C–I) Differences of tumor-infiltrating immune cells during the two groups. Seven subtypes of tumor-infiltrating immune cells between the high-risk and low-risk group showed significant differences (p <0.05). (J) Radar plot shows the whole survey of CIBERSORT analysis (*:p < 0.05 **:p < 0.01 ***: and p < 0.001).
As previously mentioned, our findings had demonstrated that patients with lower mtDNA content relatively were less immune cell infiltrated, especially CD8+ T cells indicated using the ESTIMATE algorithm. To investigate whether mtDNA depletion was associated with a significant decrease of T-cell infiltration, we examined the abundance of the mitochondrial biomarker TFAM and T-cell infiltrations by CD3 and CD8 by immunohistochemistry (IHC) in the pathological section of colon cancer carcinoma in Zhongnan Hospital (Figures 7A,B,D,E). As a result, we found a significant positive relationship (p = 0.0031 and 0.0237, respectively) between CD3+ and CD8+ T cells and the expression of the mitochondrial biomarker TFAM (Figures 7C,F).
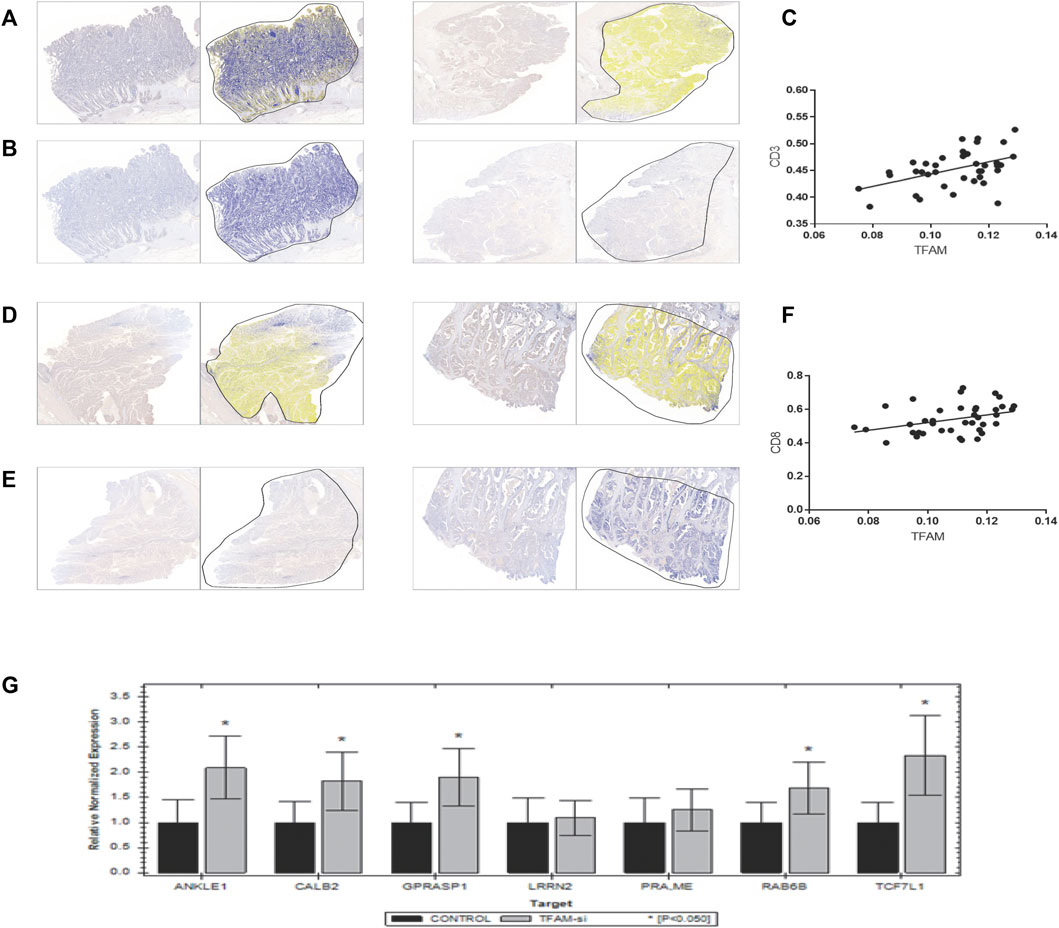
FIGURE 7. Verification of the correlation between T-cell infiltration and mitochondrial copy number. Results of immunohistochemistry of 39 colon patients are shown here. (A,B,D,E) were paired IHC tissues. As shown in results, tissues with a higher TFAM expression [left of (A,B,D,E)] have a stronger CD3 [right of (A,B)] and CD8 [right of (D,E)] expression. (C,F) shows positive correlation relationship of CD3 and CD8 with the TFAM expression (p = 0.0031 and 0.0237, respectively). (G) Results of the mRNA expression of seven signature genes in TFAM-knockdown SW480 cells by qPCR.
TFAM is critical for mitochondrial DNA replication, transcription, and stability, which has been confirmed to be related with poor prognosis in several cancers (Toki et al., 2010; Yoshida et al., 2011; Kurita et al., 2012; Kunkel et al., 2016). To investigate whether TFAM expression could be responsible for the decrease of T-cell infiltration in the mtDNA content-reduced condition, TFAM expression was knocked down by the TFAM siRNA lentivirus vector to knockdown in SW480 cells. Furthermore, five genes of the seven signature genes were significantly upregulated in TFAM-knockdown cells by qPCR (Figure 7G).
As per our results, patients with colon adenocarcinoma were split into two different prognostic groups based on the risk scores calculated according to the expression of mtDNA content reduction-related signature genes in TCGA. Although previous studies have demonstrated that mtDNA content reduction played a vital role in tumor initiation, progression, and drug resistance in colon adenocarcinoma, few studies investigated the relationship of mtDNA content and immune infiltration (Buckner et al., 2014; Wei et al., 2018; Chen et al., 2020). It has been commonly acknowledged that mitochondrial DNA content reduction induced tumorigenesis, metabolic reprogram, and biological alterations, which influenced the immunocyte distribution (Lee et al., 2005; Lee and John, 2015; Mou et al., 2018). Hence, we investigated the transcriptome profiling of EtBr-treated NCM460 (human immortalized colon cell line) to assess the biological alterations induced by mtDNA content reduction.
Among the whole 2,075 DEGs, there were 794 upregulated genes and 1281 downregulated genes. All these DEGs were evaluated by GO term enrichment and KEGG pathway analysis. As the results of GO enrichment analysis, most of these terms were associated with metabolic reprogramming which was one of the hallmarks in tumorigenesis (Srinivasan et al., 2017). Furthermore, the GO and KEGG analyses also proved that alternations induced by mtDNA content reduction were mainly proficient in the metabolic pathways in COAD, which deserves further exploration.
From the 2,075 mtDNA-related DEGs, 475 DEGs were selected using the Venn diagram of prognostic genes in TCGA datasets. A total of eight clusters were generated in MCODE. MCODE 1 was the most notable cluster among them. The 11 genes in MCODE1 (CCR10, CXCL16, CXCL2, CXCL3, CXCL8, GPER1, NMU, SAA1, BDKRB2, CCL20, and CCL5) were associated with cell chemotaxis, which induced the directional migration of cells including cancer cells and immune cells (Buckner et al., 2014; AbdelMageed et al., 2019; Chen et al., 2019; Zhao Q. Q. et al., 2020). The findings indicated that the defected mtDNA content in cancer cells might be associated with tumor progression and immune cell infiltrations in COAD.
Finally, a mtDNA content-related 7-gene signature was identified according to prognostic genes from colon adenocarcinoma transcriptome data. The efficacy of the risk scores and the integrated nomograms to predict the outcome of patients was evaluated in TCGA dataset (COAD) and validated in GSE39582 datasets. Therefore, our mtDNA content-related signature risk scores maybe a prognostic biomarker in colon adenocarcinoma.
The question followed was why the mtDNA content-related signature played such roles in overall survival. As indicated in results, the 7-gene prognostic signature showed significant differences of HLA family genes and immune checkpoint expression between two groups, which played critical roles in the antitumor immune system (Fridman et al., 2012; McGranahan et al., 2017; Topalian et al., 2020). In total, 12 HLA genes were significantly downregulated among the whole 24 HLA families in patients with high-risk scores, which indicated that these patients may benefit less from immunotherapy since immune evasion. We investigated the expression of major immune checkpoints PDL1, CTLA4, LAG3, and PDCD1. Regrettably, there was no significant difference in PDL1, LAG3, and PDCD1. However, the high-risk score group had a higher expression of CTLA4, which predominantly inhibits T-cell activation and immune response (Fiegle et al., 2019). CTLA-4 blockade was shown to inhibit tumor progression by upregulating effector T-cell activity and suppress regulatory T cells (Tregs), which suggest that the patients with high-risk score of the 7-gene prognostic signature might benefit less from CTLA-4 blockade therapy. Thus, it also demonstrated the value of the 7-gene prognostic signature in immunotherapy.
In this study, seven genes (LRRN2, ANKLE1, GPRASP1, PRAME, TCF7L1, RAB6B, and CALB2) were identified. LRRN2 was the first to be reported upregulated in glioma and was related to cell adhesion and signal transduction (Almeida et al., 1998). ANKLE1 was known as a new hotspot for the predisposition of breast cancer, which played a vital role in DNA damage response and DNA repair (Bakshi et al., 2020). GPRASP1 was mainly localized in the cell cytoplasm and could translocate to the nucleus, which indicates it may be involved in transcription regulation and tumorigenesis by retrograde signaling (Abu-Helo and Simonin, 2010). PRAME is considered as a repressor of retinoic receptor, which is recognized by cytolytic T lymphocytes (Xu et al., 2020). TCF7L1 encodes T-cell family factors and regulates cell senescence via the Wnt/β-catenin signaling pathway (Shan et al., 2019). Rab6B, whose family member affects the regulation of intracellular transport routes, has been known as an oncogene in colon cancer (Zhao L. et al., 2020). Moreover, it has been convinced that CALB2 is associated with apoptosis, ECM, and poor clinical outcomes via the mitochondrial pathway (Stevenson et al., 2011; Ojasalu et al., 2020). In brief, the role of the seven genes in colon cancer and mitochondrial-associated tumorigenesis also need further exploration, especially PRAME and TCF7L1.
On the other hand, the high-risk group had a higher ESTIMATE, immune, and stromal scores with lower tumor purity, which indicated the patients with high-risk scores might have more immune infiltration. Previous studies proved that reprogramming of the tumor immune microenvironment was a valuable prognostic signature, such as a lack of T cells, microphage phenotype, the number of B cells, CD4+ T cells, CD8+ T cells, DC cells, and the ablation of eosinophils (Shankaran et al., 2001; Galon et al., 2006; Bindea et al., 2013; Herrera et al., 2013; Arnold et al., 2020; Petitprez et al., 2020). The abundance of CD8+, activated CD4+ memory T cells, and DC cells was downregulated, while M0 microphages, B naïve cells, and Tregs were \ significantly upregulated in the high-risk group, which showed a pro-tumor tendency. M0 cells were considered as another type of TAM or an incompletely differentiated M2 and strongly associated with the poor outcome in many different types of cancers (Yang et al., 2019; Zhang et al., 2020). It was fairly controversial for the roles of tumor-infiltrating B cells, which was both tumor-promoting and tumor-suppressing (Martinet et al., 2012; Dieu-Nosjean et al., 2014; Colbeck et al., 2017; Sautès-Fridman et al., 2019). As is known, Tregs depletion promotes tumor growth and tumor immune evasion (Wei et al., 2004). CD4+ and CD8+ T-cell responses play a key role in the process of malignant cell elimination (Ostroumov et al., 2018). B naïve cells had been confirmed as a biomarker to predict the immunotherapy response (Petitprez et al., 2020). In tissues from colon cancer patients, less CD3+CD8+ T cells and the higher expression of the mitochondrial biomarker TFAM were found. It could be exclaimed that the alterations of the gene expression induced by mtDNA content defects brought about TME reprogramming, which indicated the potential of our risk score to forecast the effect of immunotherapy. Taken together, the 7-gene signature might work in the process of carcinogenesis, proliferation, and cancer immune evasion. Further exploration of these findings was required.
In conclusion, by multiple bioinformatics analysis, the hub genes of the DEGs intersected from TCGA and the transcriptome data of EB-treated NCM460 were screened, and the 7-gene prognostic signature was established in colon cancer initiation and progression. The predicting efficacy of the 7-gene prognostic signature could be attributed to the variations of immune infiltration and immune checkpoint in the tumor microenvironment. Our finding provides novel insights into the roles of mitochondrial DNA content reduction in TME reprogramming.
The datasets presented in this study can be found in online repositories. The names of the repository/repositories and accession number(s) can be found in the article/Supplementary Material.
The studies involving human participants were reviewed and approved by the Medical Ethics Committee, Zhongnan Hospital of Wuhan University. Written informed consent for participation was not required for this study in accordance with the national legislation and the institutional requirements.
JK, NL and FW designed this work. YW and QL performed the experiment and wrote the manuscript. YZ and XS performed the bioinformatics analysis. All the authors performed data review and approved the manuscript.
The National Natural Science Foundation (81773238) supported our study.
The authors declare that the research was conducted in the absence of any commercial or financial relationships that could be construed as a potential conflict of interest.
All claims expressed in this article are solely those of the authors and do not necessarily represent those of their affiliated organizations, or those of the publisher, the editors, and the reviewers. Any product that may be evaluated in this article, or claim that may be made by its manufacturer, is not guaranteed or endorsed by the publisher.
The Supplementary Material for this article can be found online at: https://www.frontiersin.org/articles/10.3389/fgene.2022.832331/full#supplementary-material
AbdelMageed, M., Ali, H., Olsson, L., Lindmark, G., Hammarström, M. L., Hammarström, S., et al. (2019). The Chemokine CXCL16 Is a New Biomarker for Lymph Node Analysis of Colon Cancer Outcome. Int. J. Mol. Sci. 20 (22). 5793. doi:10.3390/ijms20225793
Abu-Helo, A., and Simonin, F. (2010). Identification and Biological Significance of G Protein-Coupled Receptor Associated Sorting Proteins (GASPs). Pharmacol. Ther. 126 (3), 244–250. doi:10.1016/j.pharmthera.2010.03.004
Almeida, A., Zhu, X. X., Vogt, N., Tyagi, R., Muleris, M., Dutrillaux, A.-M., et al. (1998). GAC1, a New Member of the Leucine-Rich Repeat Superfamily on Chromosome Band 1q32.1, Is Amplified and Overexpressed in Malignant Gliomas. Oncogene 16 (23), 2997–3002. doi:10.1038/sj.onc.1201828
Arnold, I. C., Artola-Boran, M., Gurtner, A., Bertram, K., Bauer, M., Frangez, Z., et al. (2020). The GM-CSF-IRF5 Signaling axis in Eosinophils Promotes Antitumor Immunity through Activation of Type 1 T Cell Responses. J. Exp. Med. 217 (12), e20190706. doi:10.1084/jem.20190706
Arts, R. J. W., Novakovic, B., ter Horst, R., Carvalho, A., Bekkering, S., Lachmandas, E., et al. (2016). Glutaminolysis and Fumarate Accumulation Integrate Immunometabolic and Epigenetic Programs in Trained Immunity. Cel Metab. 24 (6), 807–819. doi:10.1016/j.cmet.2016.10.008
Bakshi, D., Katoch, A., Chakraborty, S., Shah, R., Sharma, B., Bhat, A., et al. (2020). ANKLE1 as New Hotspot Mutation for Breast Cancer in Indian Population and Has a Role in DNA Damage and Repair in Mammalian Cells. Front. Genet. 11, 609758. doi:10.3389/fgene.2020.609758
Bindea, G., Mlecnik, B., Tosolini, M., Kirilovsky, A., Waldner, M., Obenauf, A. C., et al. (2013). Spatiotemporal Dynamics of Intratumoral Immune Cells Reveal the Immune Landscape in Human Cancer. Immunity 39 (4), 782–795. doi:10.1016/j.immuni.2013.10.003
Buckner, C. M., Moir, S., Kardava, L., Ho, J., Santich, B. H., Kim, L. J. Y., et al. (2014). CXCR4/IgG-expressing Plasma Cells Are Associated with Human Gastrointestinal Tissue Inflammation. J. Allergy Clin. Immunol. 133 (6), 1676–1685. doi:10.1016/j.jaci.2013.10.050
Chen, L., Peng, J., Wang, Y., Jiang, H., Wang, W., Dai, J., et al. (2020). Fenofibrate-induced Mitochondrial Dysfunction and Metabolic Reprogramming Reversal: the Anti-tumor Effects in Gastric Carcinoma Cells Mediated by the PPAR Pathway. Am. J. Transl Res. 12 (2), 428–446.
Chen, M. C., Baskaran, R., Lee, N. H., Hsu, H. H., Ho, T. J., Tu, C. C., et al. (2019). CXCL2/CXCR2 axis Induces Cancer Stem Cell Characteristics in CPT‐11‐resistant LoVo colon Cancer Cells via Gαi‐2 and Gαq/11. J. Cell Physiol. 234 (7), 11822–11834. doi:10.1002/jcp.27891
Chen, W., Zheng, R., Baade, P. D., Zhang, S., Zeng, H., Bray, F., et al. (2016). Cancer Statistics in China, 2015. CA: A Cancer J. Clinicians 66 (2), 115–132. doi:10.3322/caac.21338
Cheng, S.-C., Quintin, J., Cramer, R. A., Shepardson, K. M., Saeed, S., Kumar, V., et al. (2014). mTOR- and HIF-1α-Mediated Aerobic Glycolysis as Metabolic Basis for Trained Immunity. Science 345 (6204), 1250684. doi:10.1126/science.1250684
Colbeck, E. J., Ager, A., Gallimore, A., and Jones, G. W. (2017). Tertiary Lymphoid Structures in Cancer: Drivers of Antitumor Immunity, Immunosuppression, or Bystander Sentinels in Disease? Front. Immunol. 8, 1830. doi:10.3389/fimmu.2017.01830
Dieu-Nosjean, M.-C., Goc, J., Giraldo, N. A., Sautès-Fridman, C., and Fridman, W. H. (2014). Tertiary Lymphoid Structures in Cancer and beyond. Trends Immunol. 35 (11), 571–580. doi:10.1016/j.it.2014.09.006
Elia, I., and Fendt, S. M. (2016). Vivo Cancer Metabolism Is Defined by the Nutrient Microenvironment. Translational Cancer Res. 5 (S6). doi:10.21037/tcr.2016.11.53
Feng, R.-M., Zong, Y.-N., Cao, S.-M., and Xu, R.-H. (2019). Current Cancer Situation in China: Good or Bad News from the 2018 Global Cancer Statistics? Cancer Commun. 39 (1), 22. doi:10.1186/s40880-019-0368-6
Fiegle, E., Doleschel, D., Koletnik, S., Rix, A., Weiskirchen, R., Borkham-Kamphorst, E., et al. (2019). Dual CTLA-4 and PD-L1 Blockade Inhibits Tumor Growth and Liver Metastasis in a Highly Aggressive Orthotopic Mouse Model of Colon Cancer. Neoplasia 21 (9), 932–944. doi:10.1016/j.neo.2019.07.006
Fridman, W. H., Pagès, F., Sautès-Fridman, C., and Galon, J. (2012). The Immune Contexture in Human Tumours: Impact on Clinical Outcome. Nat. Rev. Cancer 12 (4), 298–306. doi:10.1038/nrc3245
Galon, J., Costes, A., Sanchez-Cabo, F., Kirilovsky, A., Mlecnik, B., Lagorce-Pagès, C., et al. (2006). Type, Density, and Location of Immune Cells within Human Colorectal Tumors Predict Clinical Outcome. Science 313 (5795), 1960–1964. doi:10.1126/science.1129139
Ganesh, K., Stadler, Z. K., Cercek, A., Mendelsohn, R. B., Shia, J., Segal, N. H., et al. (2019). Immunotherapy in Colorectal Cancer: Rationale, Challenges and Potential. Nat. Rev. Gastroenterol. Hepatol. 16 (6), 361–375. doi:10.1038/s41575-019-0126-x
Herrera, M., Herrera, A., Domínguez, G., Silva, J., García, V., García, J. M., et al. (2013). Cancer-associated Fibroblast and M2 Macrophage Markers Together Predict Outcome in Colorectal Cancer Patients. Cancer Sci. 104 (4), 437–444. doi:10.1111/cas.12096
Hutson, S. M., Fenstermacher, D., and Mahar, C. (1988). Role of Mitochondrial Transamination in Branched Chain Amino Acid Metabolism. J. Biol. Chem. 263 (8), 3618–3625. doi:10.1016/s0021-9258(18)68969-0
Kunkel, G. H., Chaturvedi, P., and Tyagi, S. C. (2016). Mitochondrial Pathways to Cardiac Recovery: TFAM. Heart Fail. Rev. 21 (5), 499–517. doi:10.1007/s10741-016-9561-8
Kurita, T., Izumi, H., Kagami, S., Kawagoe, T., Toki, N., Matsuura, Y., et al. (2012). Mitochondrial Transcription Factor A Regulates BCL2L1 Gene Expression and Is a Prognostic Factor in Serous Ovarian Cancer. Cancer Sci. 103 (2), 239–444. doi:10.1111/j.1349-7006.2011.02156.x
Lee, H.-C., Yin, P.-H., Lin, J.-C., Wu, C.-C., Chen, C.-Y., Wu, C.-W., et al. (2005). Mitochondrial Genome Instability and mtDNA Depletion in Human Cancers. Ann. N. Y Acad. Sci. 1042, 109–122. doi:10.1196/annals.1338.011
Lee, W. T. Y., and John, J. S. (2015). The Control of Mitochondrial DNA Replication during Development and Tumorigenesis. Ann. N.Y. Acad. Sci. 1350, 95–106. doi:10.1111/nyas.12873
Li, X., Wenes, M., Romero, P., Huang, S. C.-C., Fendt, S.-M., and Ho, P.-C. (2019). Navigating Metabolic Pathways to Enhance Antitumour Immunity and Immunotherapy. Nat. Rev. Clin. Oncol. 16 (7), 425–441. doi:10.1038/s41571-019-0203-7
Lunt, S. Y., and Fendt, S. M. (2017). Metabolism - A Cornerstone of Cancer Initiation, Progression, Immune Evasion and Treatment Response. Curr. Opin. Syst. Biol. 8, 67–72.doi:10.1016/j.coisb.2017.12.006
Martinet, L., Le Guellec, S., Filleron, T., Lamant, L., Meyer, N., Rochaix, P., et al. (2012). High Endothelial Venules (HEVs) in Human Melanoma Lesions. Oncoimmunology 1 (6), 829–839. doi:10.4161/onci.20492
McGranahan, N., Rosenthal, R., Hiley, C. T., Rowan, A. J., Watkins, T. B. K., Wilson, G. A., et al. (2017). Allele-Specific HLA Loss and Immune Escape in Lung Cancer Evolution. Cell 171 (6), 1259–e11. e11. doi:10.1016/j.cell.2017.10.001
Mou, J.-j., Peng, J., Shi, Y.-y., Li, N., Wang, Y., Ke, Y., et al. (2018). Mitochondrial DNA Content Reduction Induces Aerobic Glycolysis and Reversible Resistance to Drug-Induced Apoptosis in SW480 Colorectal Cancer Cells. Biomed. Pharmacother. 103, 729–737. doi:10.1016/j.biopha.2018.04.099
Ojasalu, K., Brehm, C., Hartung, K., Nischak, M., Finkernagel, F., Rexin, P., et al. (2020). Upregulation of Mesothelial Genes in Ovarian Carcinoma Cells Is Associated with an Unfavorable Clinical Outcome and the Promotion of Cancer Cell Adhesion. Mol. Oncol. 14 (9), 2142–2162. doi:10.1002/1878-0261.12749
Ostroumov, D., Fekete-Drimusz, N., Saborowski, M., Kühnel, F., and Woller, N. (2018). CD4 and CD8 T Lymphocyte Interplay in Controlling Tumor Growth. Cell. Mol. Life Sci. 75 (4), 689–713. doi:10.1007/s00018-017-2686-7
Pavlova, N. N., and Thompson, C. B. (2016). The Emerging Hallmarks of Cancer Metabolism. Cel Metab. 23 (1), 27–47. doi:10.1016/j.cmet.2015.12.006
Peter, S.J., Beckermann, K. E., Mason, F. M., Andrejeva, G., Greenplate, A. R., et al. (2017). Mitochondrial Dysregulation and Glycolytic Insufficiency Functionally Impair CD8 T Cells Infiltrating Human Renal Cell Carcinoma. JCI Insight 2 (12), e93411. doi:10.1172/jci.insight.93411
Petitprez, F., de Reyniès, A., Keung, E. Z., Chen, T. W.-W., Sun, C.-M., Calderaro, J., et al. (2020). B Cells Are Associated with Survival and Immunotherapy Response in Sarcoma. Nature 577 (7791), 556–560. doi:10.1038/s41586-019-1906-8
Sautès-Fridman, C., Petitprez, F., Calderaro, J., and Fridman, W. H. (2019). Tertiary Lymphoid Structures in the Era of Cancer Immunotherapy. Nat. Rev. Cancer 19 (6), 307–325. doi:10.1038/s41568-019-0144-6
Shan, J., Shen, J., Wu, M., Zhou, H., Feng, J., Yao, C., et al. (2019). Tcf7l1 Acts as a Suppressor for the Self-Renewal of Liver Cancer Stem Cells and Is Regulated by IGF/MEK/ERK Signaling Independent of β-Catenin. Stem Cells 37 (11), 1389–1400. doi:10.1002/stem.3063
Shankaran, V., Ikeda, H., Bruce, A. T., White, J. M., Swanson, P. E., Old, L. J., et al. (2001). IFNγ and Lymphocytes Prevent Primary Tumour Development and Shape Tumour Immunogenicity. Nature 410 (6832), 1107–1111. doi:10.1038/35074122
Sharma, P., and Allison, J. P. (2015). The Future of Immune Checkpoint Therapy. Science 348 (6230), 56–61. doi:10.1126/science.aaa8172
Srinivasan, S., Guha, M., Kashina, A., and Avadhani, N. G. (2017). Mitochondrial Dysfunction and Mitochondrial Dynamics-The Cancer Connection. Biochim. Biophys. Acta (Bba) - Bioenerg. 1858 (8), 602–614. doi:10.1016/j.bbabio.2017.01.004
Stevenson, L., Allen, W. L., Proutski, I., Stewart, G., Johnston, L., McCloskey, K., et al. (2011). Calbindin 2 (CALB2) Regulates 5-fluorouracil Sensitivity in Colorectal Cancer by Modulating the Intrinsic Apoptotic Pathway. PLoS One 6 (5), e20276. doi:10.1371/journal.pone.0020276
Toki, N., Kagami, S., Kurita, T., Kawagoe, T., Matsuura, Y., Hachisuga, T., et al. (2010). Expression of Mitochondrial Transcription Factor A in Endometrial Carcinomas: Clinicopathologic Correlations and Prognostic Significance. Virchows Arch. 456 (4), 387–393. doi:10.1007/s00428-010-0895-7
Topalian, S. L., Taube, J. M., and Pardoll, D. M. (2020). Neoadjuvant Checkpoint Blockade for Cancer Immunotherapy. Science 367 (6477), 367. doi:10.1126/science.aax0182
Van Cutsem, E., Cervantes, A., Adam, R., Sobrero, A., Van Krieken, J. H., Aderka, D., et al. (2016). ESMO Consensus Guidelines for the Management of Patients with Metastatic Colorectal Cancer. Ann. Oncol. 27 (8), 1386–1422. doi:10.1093/annonc/mdw235
Wallace, D. C. (2012). Mitochondria and Cancer. Nat. Rev. Cancer 12 (10), 685–698. doi:10.1038/nrc3365
Wei, W.-Z., Morris, G. P., and Kong, Y.-c. M. (2004). Anti-tumor Immunity and Autoimmunity: a Balancing Act of Regulatory T Cells. Cancer Immunol. Immunother. 53 (2), 73–78. doi:10.1007/s00262-003-0444-1
Wei, Y., Chen, L., Xu, H., Xie, C., Zhou, Y., and Zhou, F. (2018). Mitochondrial Dysfunctions Regulated Radioresistance through Mitochondria-To-Nucleus Retrograde Signaling Pathway of NF-κB/PI3K/AKT2/mTOR. Radiat. Res. 190 (2), 204–215. doi:10.1667/rr15021.1
West, A. P., Shadel, G. S., and Ghosh, S. (2011). Mitochondria in Innate Immune Responses. Nat. Rev. Immunol. 11 (6), 389–402. doi:10.1038/nri2975
Xu, Y., Zou, R., Wang, J., Wang, Z. W., and Zhu, X. (2020). The Role of the Cancer Testis Antigen PRAME in Tumorigenesis and Immunotherapy in Human Cancer. Cell Prolif 53 (3), e12770. doi:10.1111/cpr.12770
Yang, S., Liu, T., Cheng, Y., Bai, Y., and Liang, G. (2019). Immune Cell Infiltration as a Biomarker for the Diagnosis and Prognosis of Digestive System Cancer. Cancer Sci. 110 (12), 3639–3649. doi:10.1111/cas.14216
Yoshida, Y., Hasegawa, J., Nezu, R., Kim, Y.-K., Hirota, M., Kawano, K., et al. (2011). Clinical Usefulness of Mitochondrial Transcription Factor A Expression as a Predictive Marker in Colorectal Cancer Patients Treated with FOLFOX. Cancer Sci. 102 (3), 578–582. doi:10.1111/j.1349-7006.2010.01835.x
Yu, M. (2011). Generation, Function and Diagnostic Value of Mitochondrial DNA Copy Number Alterations in Human Cancers. Life Sci. 89 (3-4), 65–71. doi:10.1016/j.lfs.2011.05.010
Zhang, Q., Li, H., Mao, Y., Wang, X., Zhang, X., Yu, X., et al. (2020). Apoptotic SKOV3 Cells Stimulate M0 Macrophages to Differentiate into M2 Macrophages and Promote the Proliferation and Migration of Ovarian Cancer Cells by Activating the ERK Signaling Pathway. Int. J. Mol. Med. 45 (1), 10–22. doi:10.3892/ijmm.2019.4408
Zhao, Q. Q., Jiang, C., Gao, Q., Zhang, Y. Y., Wang, G., Chen, X. P., et al. (2020). Gene Expression and Methylation Profiles Identified CXCL3 and CXCL8 as Key Genes for Diagnosis and Prognosis of colon Adenocarcinoma. J. Cel Physiol 235 (5), 4902–4912. doi:10.1002/jcp.29368
Zhao, L., Xue, M., Zhang, L., Guo, B., Qin, Y., Jiang, Q., et al. (2020). MicroRNA-4268 Inhibits Cell Proliferation via AKT/JNK Signalling Pathways by Targeting Rab6B in Human Gastric Cancer. Cancer Gene Ther. 27 (6), 461–472. doi:10.1038/s41417-019-0118-6
ANKLE1 ankyrin repeat and LEM domain containing 1
AUC area under the curve
BP biological process
CALB2 calbindin 2
CC cellular composition
CIBERSORT Cell-type Identification by Estimating Relative Subsets of RNA Transcripts HR Hazard ratio
CTLA4 cytotoxic T lymphocyte-associated antigen-4
DEGs differentially expressed genes
ESTIMATE Estimation of Stromal and Immune cells in Malignant Tumor tissues using the Expression data
FDR false discovery rate
FPKM fragments per kilobase per million
GEO Gene Expression Omnibus
GO gene ontology analysis
GPRASP1 G protein-coupled receptor associated sorting protein 1
HLA human leukocyte antigen
HTSeq high-throughput sequence
ICIs immune checkpoint inhibitors
KEGG Kyoto Encyclopedia of Genes and Genomes
LASSO least absolute shrinkage and selection operator
LRRN2 leucine rich repeat neuronal 2
MCODE Molecular Complex Detection
MF molecular functions
mtDNA mitochondrial deoxyribonucleic acid
PD-L1 programmed death-ligand 1
PPI protein–protein interaction
PRAME PReferentially expressed Antigen in MElanoma
OS overall survival
RAB6B member RAS oncogene family 6B
ROC receiver operating characteristic
STRING Search Tool for the Retrieval of Interacting Genes database
TCF7L1 transcription factor 7-like 1
TFAM transcription factor A, Mitochondrial; TCGA The Cancer Genome Atlas
TIICs tumor-infiltrating immune cell
TME tumor microenvironment
Keywords: mitochondiral DNA, Colon Cancer, Immunocyte infiltration, Bioinformatic analysis, Gene signature
Citation: Kang J, li N, Wang F, Wei Y, Zeng Y, Luo Q, Sun X, Xu H, Peng J and Zhou F (2022) Exploration of Reduced Mitochondrial Content–Associated Gene Signature and Immunocyte Infiltration in Colon Adenocarcinoma by an Integrated Bioinformatic Analysis. Front. Genet. 13:832331. doi: 10.3389/fgene.2022.832331
Received: 09 December 2021; Accepted: 14 March 2022;
Published: 08 April 2022.
Edited by:
William C. Cho, QEH, Hong Kong SAR, ChinaReviewed by:
Zengjun Wang, Nanjing Medical University, ChinaCopyright © 2022 Kang, li, Wang, Wei, Zeng, Luo, Sun, Xu, Peng and Zhou. This is an open-access article distributed under the terms of the Creative Commons Attribution License (CC BY). The use, distribution or reproduction in other forums is permitted, provided the original author(s) and the copyright owner(s) are credited and that the original publication in this journal is cited, in accordance with accepted academic practice. No use, distribution or reproduction is permitted which does not comply with these terms.
*Correspondence: Jin Peng, cGp4cDg4OEAxMjYuY29t; Fuxiang Zhou, aGFwcHl6aG91ZnhAc2luYS5jb20=
†These authors have contributed equally to this work
Disclaimer: All claims expressed in this article are solely those of the authors and do not necessarily represent those of their affiliated organizations, or those of the publisher, the editors and the reviewers. Any product that may be evaluated in this article or claim that may be made by its manufacturer is not guaranteed or endorsed by the publisher.
Research integrity at Frontiers
Learn more about the work of our research integrity team to safeguard the quality of each article we publish.