- 1Department of Endocrinology, China-Japan Union Hospital, Jilin University, Changchun, China
- 2Department of Genetics, College of Basic Medical Sciences, Jilin University, Changchun, China
- 3Key Laboratory of Pathobiology, Ministry of Education, College of Basic Medical Sciences, Jilin University, Changchun, China
- 4Department of Pathology, College of Basic Medical Sciences, Jilin University, Changchun, China
- 5Department of Molecular Biology, College of Basic Medical Sciences, Jilin University, Changchun, China
Background/Aims: The storage amount of liver glycogen could affect the liver fibrosis assessment made by MRI-based methods. However, it remained unclear whether glycogen amount could bias the estimation of liver fat content by proton density fat fraction. In this study, we aimed to investigate whether glycogen metabolism gene variants could contribute to the bias of PDFF by genetic association.
Methods: We conducted an association study of the glycogen metabolism genes based on the PDFF data of 11,129 participants in the UK Biobank. The effect of the SNPs in these genes on non-alcoholic fatty liver disease was estimated by a meta-analysis of the available NAFLD case-control studies.
Results: We identified significant associations of the SNPs near the genes encoding glycogen phosphorylase (PYGM and PYGL) and synthase (GYS2) with PDFF (FDR-corrected p value < 0.05). The genes encoding the regulatory proteins of glycogenolysis (PHKB, CALM2/3), glucose transporter (SLC2A1), and glucose kinase (GCK) were also associated with PDFF. The SNP rs5402 of SLC2A2 and rs547066 of PYGM were associated with NAFLD (p < 0.05) with others being insignificant. Except for the PYGM gene, the PDFF-associated SNPs showed no associations with NAFLD. In addition, the burden tests of rare variants in these genes were not significant after FDR correction.
Conclusion: Liver glycogen metabolism genes associated with PDFF were not associated with NAFLD, which implicated a potential bias effect of glycogen storage on the quantification of liver fat content by PDFF.
Introduction
Non-alcoholic fatty liver disease (NAFLD) is the condition in which liver fat content exceeds 5% of liver weight in the absence of excessive alcohol consumption, viral infection, or chemical or physical liver damages (Mundi et al., 2020). Currently, liver biopsy is the gold standard for the diagnosis of NAFLD. Nonetheless, the need for noninvasive methods to identify liver steatosis has been emerging to overcome the shortcomings of liver biopsy, including bleeding and complications, inter-observation variability.
Magnetic resonance imaging proton density fat fraction (MRI-PDFF) is a quantitative imaging biomarker and is an accurate and highly sensitive method for measuring the steatosis of the whole liver. It can accurately detect microscopic steatosis as small as 5% (Schwimmer et al., 2005; Le et al., 2012; Reeder et al., 2012; Reeder 2013). MRI-PDFF is increasingly used in the diagnosis of fatty liver diseases and in clinical trials to evaluate the drug efficacy. Previous studies have shown that hepatic glycogen content could affect T1 MRI mapping, which in theory could induce errors in PDFF measurements (Kramer et al., 2017; Mozes et al., 2021). At present, direct quantification of liver glycogen is possible through PAS staining or biochemical measurements of liver biopsy, or 13C-MRS in vivo. However, the evidence for the impact of hepatic glycogen content on MRI-PDFF measurements has not been demonstrated.
Here, we investigated whether glycogen metabolism genes could potentially affect the liver fat content assessed by imaging-based methods using genetic association studies of PDFF and NAFLD. With this genetic evidence, our study will be informative for the rational of considering glycogen storage when developing novel imaging-based diagnostic methods or the clinical interpretation of current PDFF measurements.
Materials and Methods
The UK Biobank Cohort
The UK Biobank is a prospective cohort study that recruited more than 500,000 participants aged 37–73 (99.5% of people aged 40–69) from all over the United Kingdom from 2006 to 2010. In 2014, approximately 45,000 participants accepted the UK Biobank’s invitation for a visit of abdominal magnetic resonance imaging. Although the invitation was not determined by medical information, the MRI exclusion criteria (such as metal or electronic implants, surgery 6 weeks before the appointment, severe hearing, or respiratory dysfunction) may lead to a slightly healthy cohort. The UK Biobank has been approved by the Northwest Multicenter Research Ethics Committee (reference number: 11/NW/0382) and obtained written informed consent from all the participants before the study.
Proton Density Fat Fraction Measurement
Dixon sequences were acquired using Siemens 1.5T MAGNETOM Aera at the dedicated UK Biobank imaging center (Wilman et al., 2017). PDFF from DIXON sequence were calculated using LiverMultiScan (Perspectum Diagnostics, Oxford, United Kingdom). The multi-gradient GRE was used to scan the transverse section of the liver center above the hilum using the extended 3D DIXON sequence with acquisition parameters of 2.5 mm voxel size, 6 mm slice thickness, 20° flip angle (FA), 27 ms repetition time (TR), and two signal averages. The second, fourth, and sixth echoes were used to construct the PDFF map. Three 15 mm diameter circular regions of interest (ROI) were selected by trained professionals to cover the liver parenchyma and avoid blood vessels or bile ducts in the PDFF map. The reported PDFF was calculated based on the average density of the three ROIs from the fat and water phases, using the liver fat percentage formula: fat/(water + fat). PDFF≥5% was defined as fatty liver disease. In total, we have the PDFF measurements for 16,307 individuals.
Genetic Data and QC
The genetic data and quality control procedure have been described elsewhere (Bycroft et al., 2018). In brief, the genomic DNA was extracted from peripheral blood and genotyped by Applied Biosystems UK Biobank Axiom Array (N = 14,328) and UK BiLEVE Axiom Array (N = 1,517). Individuals whose genotype missing rate >5%), heterogeneity rate >3 SD, or self-reported sex mismatched the one inferred from the genotypes were excluded. The included participants were of European ancestry. The genotypes were imputed off the combined haplotype reference of the UK10K and 1000 genome cosmopolitan panels. Our SNP association analysis was restricted to the genetic variations with minor allele frequency (MAF) > 1% and imputation quality score> 0.7. The genetic principal components were calculated from the genotypes of the UK Biobank array data (Abraham and Inouye 2014)
Candidate Gene and SNP Selection
Human genes encoding the enzymes for glycogenesis and glycogenolysis, as well as the direct regulator factors of these reversible reactions, were selected as the candidate genes according to the pathway map of Kyoto Encyclopedia of Genes and Genomes (https://www.kegg.jp). For the purpose of this study, we restricted the candidate genes in autosomes, which resulted in the removal of PHKA1 and PHKA2. Both of these genes are located in chromosome X. In total, we obtained 24 genes of which common SNPs and rare SNPs located in the gene body, including the 5′ UTR and 3’ UTR, were included in our linear mixed model and burden test, respectively (Supplementary Table S1).
Association Test of Common Variants
We conducted the association analysis in a linear mixed model with GCTA (Yang et al., 2011), which takes into account the population structure and kinship. The kinship matrix was calculated using common genetic variants (MAF >0.01%) that passed quality control in all 106 batches and existed in both genotyping arrays. We excluded the participants with excessive alcohol consumption (>40 g per day) or liver damaging drug use to avoid the confounding from nongenetic factors. The PDFF was inverse-normal transformed to a standard normal distribution (Figure 1). We further adjusted sex, age, BMI, and PC1-5 as the covariates in the model. False discovery rate (FDR) was adopted for the multiple tests correction. FDR p value < 0.05 was considered as the significant association. Pleotropic effects of the genetic variants were obtained from the NHGRI-EBI GWAS catalog with proxy SNPs (r2 > 0.6) or the T2D Knowledge Portal (https://t2d.hugeamp.org/).
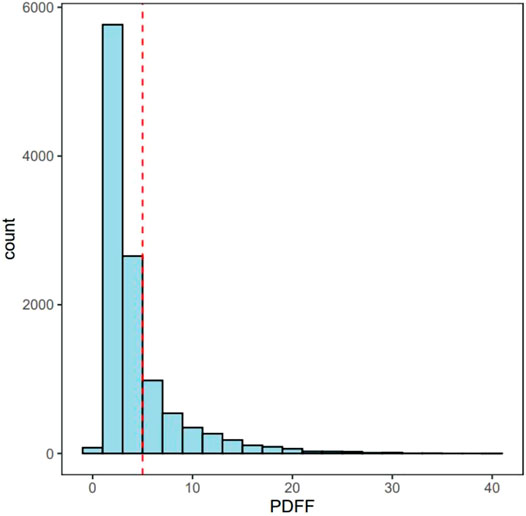
FIGURE 1. The distribution of PDFF. Red line represents 5% of PDFF. MRI-PDFF < 5% are Non-NAFLD participants and MRI-PDFF ≥ 5% are defined as NAFLD patients.
For the purpose of picking index SNPs, the common SNPs were clumped by linkage disequilibrium (LD) calculated from 1000 Genomes GBR panel (r2 > 0.1, window size of 1 Mb).
Gene-Based Burden Tests of Rare Variants
In order to study whether the rare genetic variants of glycogen metabolism genes were associated with liver fat fraction, we tested the rare variants (MAF < 0.01) burden in our candidate genes. The rare variants were genotyped by whole exome sequencing using the updated functional equivalence (FE) scheme (called the OQFE scheme). Of the 200 thousand participants who were sequenced, 100,000 variants were observed in the target region covering around 39 million bases. These included 8,086,176 SNPs, 370,958 INDELs, and 1,596,984 multiple allelic variants, with 95.6% of the genetic variants being covered 20 times or more.
Burden tests were evaluated by SAIGE-GENE (Zhou W et al., 2020). Three algorithms were employed, including the tradition burden test, SKAT, which aggregates the individual score test statistics of SNPs in a SNP set and efficiently computes SNP-set level p-values (https://www.hsph.harvard.edu/skat/). The Bonferroni corrected p value threshold p < 0.05 was considered the significant association with PDFF.
Meta-Analysis of Non-Alcoholic Fatty Liver Disease GWAS
We performed a meta-analysis of the summary statistics of SNPs in glycogen metabolism genes using a fixed-effect inverse variance weighted model. The summary statistics were from four independent GWAS of NAFLD in the populations of European ancestry, included three published NAFLD GWAS (Namjou et al., 2019; Anstee et al., 2020; Liu et al., 2020) and the FinnGen NAFLD GWAS, covering 4,362 NAFLD cases and 602,500 controls. The diagnosis of NAFLD was mostly made using liver biopsy, ultrasound, or computerized tomography. The meta-analysis was conducted using METAL software (Willer et al., 2010).
Results
Sample Characteristics
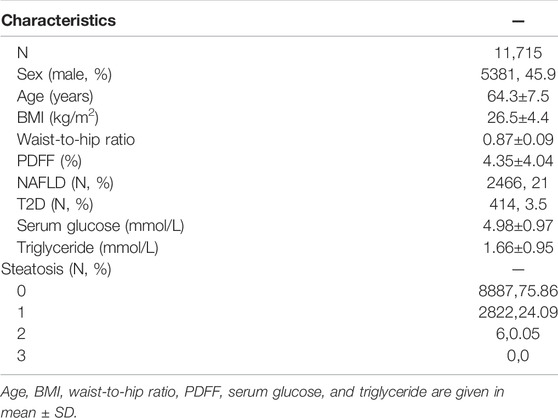
Of the 16,307 participants with PDFF data, 14,056 were of European ancestry. Of these, we excluded 320 participants with hepatic virus infection, 32 participants with liver damaging drug use, and 1,989 participants with excessive alcohol consumption. Finally, 11,715 participants were available for further analysis. Of these, 45.9% were males (Table 1). The average age was 64.3 years (SD = 7.5 years), with an average BMI of 26.5±4.4 kg/m2. The average PDFF was 4.35 (SD = 4.04). The average glucose was 4.98 mmol/L (SD = 0.97 mmol/L) and the average triglycerides was 1.66 mmol/L (SD = 0.95 mmol/L). Using the cutoff of 5%, there were 2,466 NAFLD patients, accounting for 21% of the total. The T2D prevalence was 3.5% (414) lower than the population prevalence.
Common SNP Association Analysis
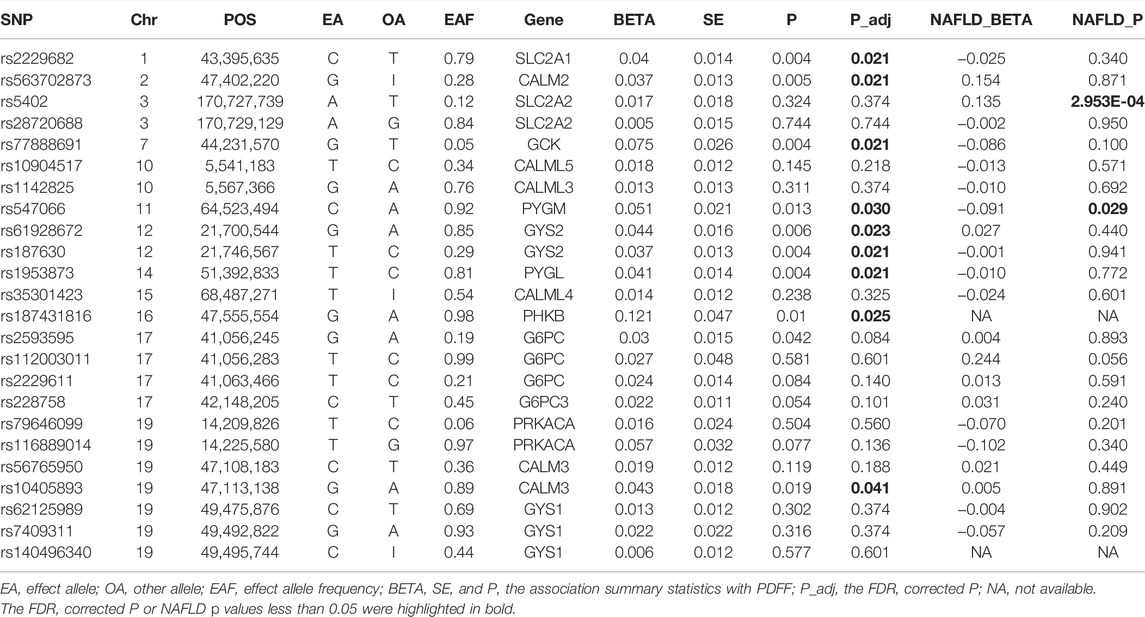
In total, 11,129 participants with valid genetic data were included in the association tests. We obtained 2,027 common SNPs in the candidate genes from the imputation data (Supplementary Table S2). After LD-based clumping, 30 tagSNPs were selected (Table 2). Nine of these SNPs were significantly associated with PDFF (FDR corrected p value < 0.05). These included genes encoding the subunits of enzymes catalyze the reversible conversion between phosphorylated glucose and glycogen, i.e., GYS2 (rs61928672, beta = −0.04, p = 0.006 and rs187630, beta = 0.037, p = 0.004), PYGM (rs547066, beta = −0.05, p = 0.013), and PYGL (rs1953873, beta = −0.04, p = 0.004), and genes encoding the glucose transporter 1 and 2, i.e., SLC2A1 (rs2229682, beta = −0.04, p = 0.021). Moreover, the glucose kinase (GCK) is also associated with PDFF (rs77888691, beta = 0.075, p = 0.021). Glucose 6-phosphatase (G6PC, G6PC2/3) was not associated with PDFF. The genes encoding the regulatory factors, including the β subunits of phosphorylase kinase (PHKB) and calmodulin (CALM2/3), were also associated with PDFF.
The PDFF-associated SNPs were further tested for the association with NAFLD through the meta-analysis of independent studies (Table 2 and Figure 2). Of the nine PDFF-associated SNPs in our study, rs187431816 in PHKB gene was not available in the meta-analyzed result. The proxy SNP rs7499413 (r2 = 0.32, D’ = 1.0 with rs187431816) was not associated with NAFLD (p = 0.45) in the meta-analysis. Of the remaining eight SNPs, only rs547066 in PYGM gene was associated with NAFLD (p = 0.029, Figure 2E). Other SNPs were not significantly associated with NAFLD (p > 0.05).
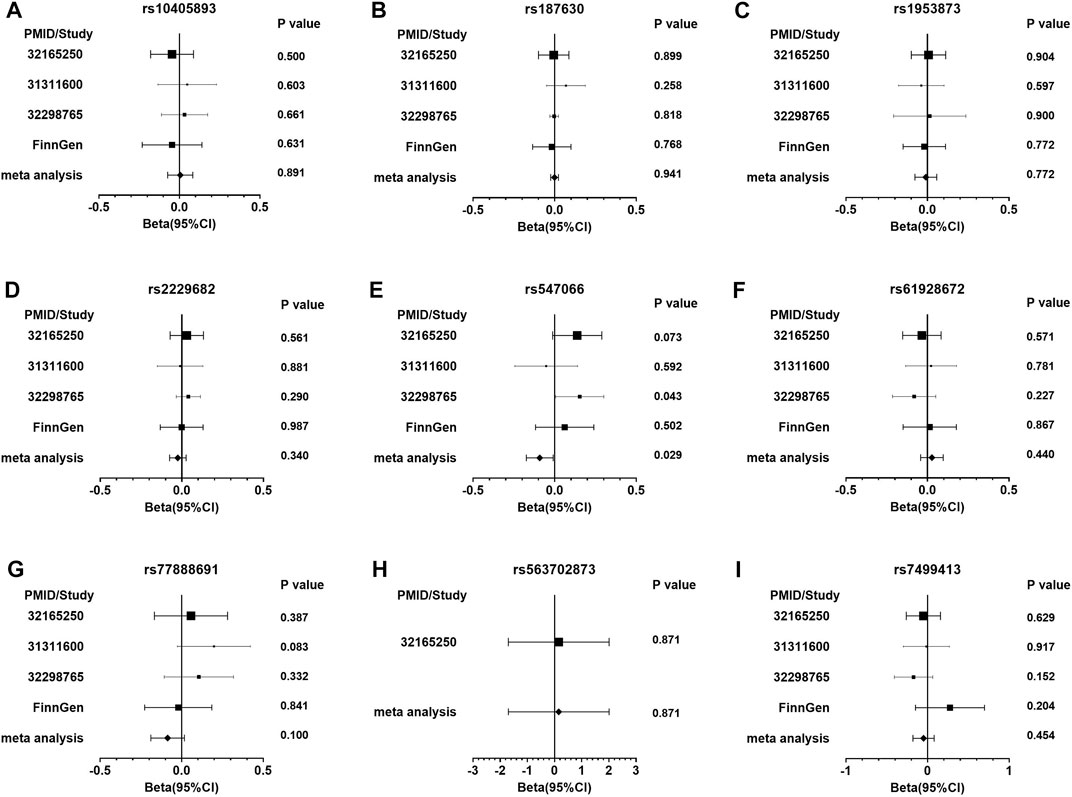
FIGURE 2. The forest plots of the meta-analysis of NAFLD in glycogen SNPs associated with PDFF. Figure (A) presents rs10405893; (B) rs187630; (C) rs1953873; (D) rs2229682; (E) rs547066; (F) rs61928672; (G) rs77888691; (H) rs563702873; and (I) rs7499413.
Pleotropic Effects of the Associated Genes
The glycogen SNPs associated with PDFF were reported to be associated with the serum level of alkaline phosphatase (PHKB) and gamma-glutamyl transferase (GYS2). Others were associated with glycemic or insulinemic traits, including fasting glucose, glycated hemoglobin, fasting insulin, or type 2 diabetes. PYGM and GCK were also associated with adiposity traits, e.g., birth weight and BMI (Table 3). In particular, GCK and GYS2 were associated with T2D and fasting insulin level, respectively. It is worth noting that these associations were proxied by SNPs with weak LD with the glycogen SNPs. Hence, we sought to replicate the association with T2D and fasting insulin level using the meta-analyzed results from cohorts that are available in T2D Knowledge Portal. The GYS2 SNP rs187630 was associated with fasting insulin (p = 1.16 × 10⁻⁵), while GCK SNP rs77888691 was not associated with T2D (Supplementary Table S3).
Rare Variant Burden Test
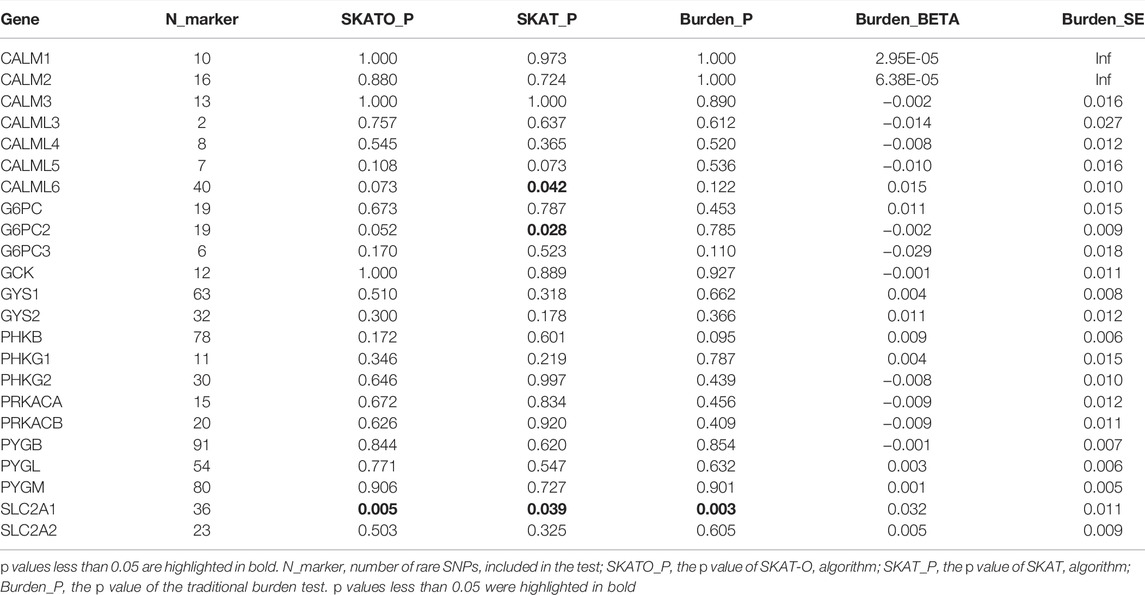
The rare SNPs of most glycogen metabolism genes were not associated with PDFF after Bonferroni correction (corrected p value > 0.05, Table 4). At the nominal significance level, SCL2A1, encoding membrane glucose transporter 1, was associated with PDFF (SKAT-O p value = 0.005). This association was also supported by the sensitivity analysis made by SKAT and traditional burden test (p value = 0.039 and 0.003, respectively).
Discussion
In this study, we provided the genetic evidence that liver glycogen storage could bias the liver fat assessment made by imaging-based methods, i.e., PDFF. We discovered that glycogen metabolism genes were associated with liver fat content as measured by PDFF. We also demonstrated that these genes, except for PYGM, were not associated with NAFLD. PYGM is a glycogen phosphorylase primarily expressed in skeletal muscle, while PYGL which was associated with PDFF, is the liver form of glycogen phosphorylase. Hence, our study showed that genetic variants in genes functional relevant to liver glycogen storage could bias the imaging-based liver fat quantification, while not actually associated with the increased risk of excessive live fat deposition.
Glycogen metabolism in the liver involved a pair of reversible reactions which is catalyzed by distinct enzymes. Glycogen synthase 1 and 2 (encoded by GYS1 and GYS2) are responsible for adding glucose to the terminal of the glycogen molecule, while glycogen phosphorylase L and M (PYGL and PYGM) can cleave a glucose molecule from glycogen. PYGL is primarily expressed in the liver. The regulatory proteins of this reversible reaction also play a role in the amount of glycogen stored in the liver. Phosphorylase kinase (PHK) and calmodulin could activate glycogen phosphorylases, while protein kinase A is responsible for the activation of PHK and deactivation of glycogen synthases. Moreover, the intracellular availability of glucose also affects the glycogen storage in liver. This is usually managed by glucose transporters (SLC2A1 and SLC2A2), glucose kinase (GCK), and Glucose-6-phosphatase. The latter two catalyze the reversible reaction that converts between d-glucose and d-glucose 6-phosphate.
Insulin resistance is frequently seen in patients of NAFLD (Watt et al., 2019). Our results showed that GYS2 genetic variants were associated with both PDFF and fasting insulin. In fact, it has been demonstrated that the genetic disruption of Gys2 in mice induced hepatic glycogen depletion and liver-specific insulin resistance (Irimia et al., 2017). Therefore, the alteration in hepatic glycogen content related to GYS2 genetic variants may induce the departure of PDFF measurement from the true liver fat content. In addition, the remaining PDFF-associated SNPs were not associated with fasting insulin. This is consistent with our major finding that these genetic variants were not associated with NAFLD.
Glycogen storage in the body is bonded to a large amount of water with a mass ratio of 1:3. MRI radio frequency pulse can form the magnetic coupling between the protons of a glycogen and the nearby water molecules (van Zijl et al., 2007). This magnetic coupling weakens the water signal, which in turn results in exaggerated liver fat measurements. Currently, 13C magnetic resonance spectroscopy is a popular glycogen measurement, but a special equipment usually not available in the clinic is required (Gruetter et al., 1994). On MRI, glycogen imaging with chemical exchange saturation transfer imaging (glycoCEST) and nuclear Overhauser enhancement (glycoNOE) can be used to map liver glycogen content indirectly (van Zijl et al., 2007; Zhou Y et al., 2020). However, the difficulty lies in how to decompose the signals of glycogen molecules from the total water signal, since the chemical exchange between the hydroxyl protons of glycogen seems to be inevitable. From a genetics point of view, we demonstrated that the genetic variants of glycogen metabolism genes could bring bias to PDFF, which highlighted the relevance of correcting PDFF for liver glycogen content without the decomposition of glycogen signals from the total.
Our study has limitations. First of all, the participants included in our study and the meta-analysis of NAFLD were mostly of European ancestry. Whether our conclusion can be applied to non-European cohorts remained to be further elucidated. Second, it is possible that the negative associations in our results are attributed to the limited statistical power in NAFLD meta-analysis. Our conclusion should be tested in studies with a larger sample size.
Conclusion
The common genetic variants in genes related to liver glycogenesis and glycogenolysis were associated with liver PDFF, while they were not associated with the risk of NAFLD. This implicated a bias effect caused by liver glycogen when quantifying the liver fat using MRI. A MRI-based liver fat quantification method simultaneously accounting for liver glycogen storage could lead to a more accurate map of liver fat content.
Data Availability Statement
Publicly available datasets were analyzed in this study. The UK Biobank data are available through application at the UK Biobank (https://www.ukbiobank.ac.uk/). GWAS summary statistics for NAFLD meta-analysis were obtained through the GWAS catalog (Namjou et al., 2019 and Anstee et al., 2020), personal communication (Liu et al., 2020), and the FinnGen Project (www.finngen.fi).
Author Contributions
ZS, JL, and XP conducted data collection and analysis. ZS, JL, XP, and PC interpreted the results. JW and JY conducted the project management. LY wrote the first draft of the manuscript. PC and QW revised the manuscript. All authors contributed to manuscript revision, read, and approved the submitted version.
Funding
This study was supported by “Changbai Mountain Scholar” Distinguished Professor Award Program (Department of Education) and Research Grant for Provincial Healthcare System (No. SCZSY201612, Department of Finance) of Jilin Province.
Conflict of Interest
The authors declare that the research was conducted in the absence of any commercial or financial relationships that could be construed as a potential conflict of interest.
Publisher’s Note
All claims expressed in this article are solely those of the authors and do not necessarily represent those of their affiliated organizations, or those of the publisher, the editors, and the reviewers. Any product that may be evaluated in this article, or claim that may be made by its manufacturer, is not guaranteed or endorsed by the publisher.
Acknowledgments
This study was conducted using data obtained from UK Biobank Access Application number 71668. We thank Dr. Wanqing Liu and other researchers for making their GWAS summary statistics available to us.
Supplementary Material
The Supplementary Material for this article can be found online at: https://www.frontiersin.org/articles/10.3389/fgene.2022.830445/full#supplementary-material
References
Abraham, G., and Inouye, M. (2014). Fast Principal Component Analysis of Large-Scale Genome-wide Data. PLoS One 9 (4), e93766. doi:10.1371/journal.pone.0093766
Anstee, Q. M., Darlay, R., Cockell, S., Meroni, M., Govaere, O., Tiniakos, D., et al. (2020). Genome-wide Association Study of Non-alcoholic Fatty Liver and Steatohepatitis in a Histologically Characterised Cohort☆. J. Hepatol. 73 (3), 505–515. doi:10.1016/j.jhep.2020.04.003
Bycroft, C., Freeman, C., Petkova, D., Band, G., Elliott, L. T., Sharp, K., et al. (2018). The UK Biobank Resource with Deep Phenotyping and Genomic Data. Nature 562 (7726), 203–209. doi:10.1038/s41586-018-0579-z
Gruetter, R., Magnusson, I., Rothman, D. L., Avison, M. J., Shulman, R. G., and Shulman, G. I. (1994). Validation of13C NMR Measurements of Liver Glycogenin Vivo. Magn. Reson. Med. 31 (6), 583–588. doi:10.1002/mrm.1910310602
Irimia, J. M., Meyer, C. M., Segvich, D. M., Surendran, S., DePaoli-Roach, A. A., Morral, N., et al. (2017). Lack of Liver Glycogen Causes Hepatic Insulin Resistance and Steatosis in Mice. J. Biol. Chem. 292 (25), 10455–10464. doi:10.1074/jbc.m117.786525
Kramer, H., Pickhardt, P. J., Kliewer, M. A., Hernando, D., Chen, G.-H., Zagzebski, J. A., et al. (2017). Accuracy of Liver Fat Quantification with Advanced CT, MRI, and Ultrasound Techniques: Prospective Comparison with MR Spectroscopy. Am. J. Roentgenology 208 (1), 92–100. doi:10.2214/ajr.16.16565
Le, T. A., Chen, J., Changchien, C., Peterson, M. R., Kono, Y., Patton, H., et al. (2012). Effect of Colesevelam on Liver Fat Quantified by Magnetic Resonance in Nonalcoholic Steatohepatitis: a Randomized Controlled Trial. Hepatology 56 (3), 922–932. doi:10.1002/hep.25731
Liu, Z., Zhang, Y., Graham, S., Wang, X., Cai, D., Huang, M., et al. (2020). Causal Relationships between NAFLD, T2D and Obesity Have Implications for Disease Subphenotyping. J. Hepatol. 73 (2), 263–276. doi:10.1016/j.jhep.2020.03.006
Mózes, F. E., Valkovič, L., Pavlides, M., Robson, M. D., and Tunnicliffe, E. M. (2021). Hydration and Glycogen Affect T1 Relaxation Times of Liver Tissue. NMR Biomed. 34 (7), e4530. doi:10.1002/nbm.4530
Mundi, M. S., Velapati, S., Patel, J., Kellogg, T. A., Abu Dayyeh, B. K., and Hurt, R. T. (2020). Evolution of NAFLD and its Management. Nutr. Clin. Pract. 35 (1), 72–84. doi:10.1002/ncp.10449
Namjou, B., Lingren, T., Lingren, T., Huang, Y., Parameswaran, S., Cobb, B. L., et al. (2019). GWAS and Enrichment Analyses of Non-alcoholic Fatty Liver Disease Identify New Trait-Associated Genes and Pathways across eMERGE Network. BMC Med. 17 (1), 135. doi:10.1186/s12916-019-1364-z
Reeder, S. B. (2013). Emerging Quantitative Magnetic Resonance Imaging Biomarkers of Hepatic Steatosis. Hepatology 58 (6), 1877–1880. doi:10.1002/hep.26543
Reeder, S. B., Hu, H. H., and Sirlin, C. B. (2012). Proton Density Fat-Fraction: a Standardized MR-Based Biomarker of Tissue Fat Concentration. J. Magn. Reson. Imaging 36 (5), 1011–1014. doi:10.1002/jmri.23741
Schwimmer, J. B., Middleton, M. S., Deutsch, R., and Lavine, J. E. (2005). A Phase 2 Clinical Trial of Metformin as a Treatment for Non-diabetic Paediatric Non-alcoholic Steatohepatitis. Aliment. Pharmacol. Ther. 21 (7), 871–879. doi:10.1111/j.1365-2036.2005.02420.x
van Zijl, P. C. M., Jones, C. K., Ren, J., Malloy, C. R., and Sherry, A. D. (2007). MRI Detection of Glycogen In Vivo by Using Chemical Exchange Saturation Transfer Imaging (glycoCEST). Proc. Natl. Acad. Sci. U.S.A. 104 (11), 4359–4364. doi:10.1073/pnas.0700281104
Watt, M. J., Miotto, P. M., De Nardo, W., and Montgomery, M. K. (2019). The Liver as an Endocrine Organ-Linking NAFLD and Insulin Resistance. Endocr. Rev. 40 (5), 1367–1393. doi:10.1210/er.2019-00034
Willer, C. J., Li, Y., and Abecasis, G. R. (2010). METAL: Fast and Efficient Meta-Analysis of Genomewide Association Scans. Bioinformatics 26 (17), 2190–2191. doi:10.1093/bioinformatics/btq340
Wilman, H. R., Kelly, M., Garratt, S., Matthews, P. M., Milanesi, M., Herlihy, A., et al. (2017). Characterisation of Liver Fat in the UK Biobank Cohort. PLoS One 12 (2), e0172921. doi:10.1371/journal.pone.0172921
Yang, J., Lee, S. H., Goddard, M. E., and Visscher, P. M. (2011). GCTA: a Tool for Genome-wide Complex Trait Analysis. Am. J. Hum. Genet. 88 (1), 76–82. doi:10.1016/j.ajhg.2010.11.011
Zhou, W., Zhao, Z., Nielsen, J. B., Fritsche, L. G., LeFaive, J., Gagliano Taliun, S. A., et al. (2020). Scalable Generalized Linear Mixed Model for Region-Based Association Tests in Large Biobanks and Cohorts. Nat. Genet. 52 (6), 634–639. doi:10.1038/s41588-020-0621-6
Keywords: non-alcoholic fatty liver disease, liver fat content, magnetic resonance imaging, proton density fat fraction, glycogen synthase, glycogen phosphorylase, glycogen metabolism
Citation: Yang L, Sun Z, Li J, Pan X, Wen J, Yang J, Wang Q and Chen P (2022) Genetic Variants of Glycogen Metabolism Genes Were Associated With Liver PDFF Without Increasing NAFLD Risk. Front. Genet. 13:830445. doi: 10.3389/fgene.2022.830445
Received: 05 January 2022; Accepted: 02 March 2022;
Published: 06 April 2022.
Edited by:
Annalisa Terranegra, Sidra Medicine, QatarReviewed by:
Cinzia Myriam Calabrese, Politecnico di Torino, ItalyYang Zhang, Capital Medical University, China
Copyright © 2022 Yang, Sun, Li, Pan, Wen, Yang, Wang and Chen. This is an open-access article distributed under the terms of the Creative Commons Attribution License (CC BY). The use, distribution or reproduction in other forums is permitted, provided the original author(s) and the copyright owner(s) are credited and that the original publication in this journal is cited, in accordance with accepted academic practice. No use, distribution or reproduction is permitted which does not comply with these terms.
*Correspondence: Qing Wang, d2FuZ19xaW5nQGpsdS5lZHUuY24=; Peng Chen, cGNoZW5Aamx1LmVkdS5jbg==
†These authors have contributed equally to this work
 Liu Yang
 Zewen Sun2
 Jianping Wen
 Qing Wang