- Department of Pathology and Laboratory Medicine, University of Kansas Medical Center, Kansas City, KS, United States
DOT1L is essential for embryonic hematopoiesis but the precise mechanisms of its action remain unclear. The only recognized function of DOT1L is histone H3 lysine 79 (H3K79) methylation, which has been implicated in both transcriptional activation and repression. We observed that deletion of the mouse Dot1L gene (Dot1L-KO) or selective mutation of its methyltransferase domain (Dot1L-MM) can differentially affect early embryonic erythropoiesis. However, both mutations result in embryonic lethality by mid-gestation and growth of hematopoietic progenitor cells (HPCs) is similarly affected in extensively self-renewing erythroblast (ESRE) cultures established from yolk sac cells. To understand DOT1L-mediated gene regulation and to clarify the role of H3K79 methylation, we analyzed whole transcriptomes of wildtype and Dot1L-mutant ESRE cells. We observed that more than 80% of the differentially expressed genes (DEGs) were upregulated in the mutant ESRE cells either lacking the DOT1L protein or the DOT1L methyltransferase activity. However, approximately 45% of the DEGs were unique to either mutant group, indicating that DOT1L possesses both methyltransferase-dependent and -independent gene regulatory functions. Analyses of Gene Ontology and signaling pathways for the DEGs were consistent, with DEGs that were found to be common or unique to either mutant group. Genes related to proliferation of HPCs were primarily impacted in Dot1L-KO cells, while genes related to HPC development were affected in the Dot1L-MM cells. A subset of genes related to differentiation of HPCs were affected in both mutant groups of ESREs. Our findings suggest that DOT1L primarily acts to repress gene expression in HPCs, and this function can be independent of its methyltransferase activity.
Introduction
DOT1L histone methyltransferase (DOT1L) is an essential regulator of vital tissue and organ development during embryonic life, including hematopoiesis (Feng et al., 2010). We observed that loss of DOT1L in mice (Dot1L-KO) results in lethal anemia during mid-gestation (Feng et al., 2010). DOT1L is the only known methyltransferase in eukaryotic cells to methylate lysine 79 of histone H3 (H3K79) (Feng et al., 2002). We generated a mouse line carrying a point mutation (Asn241Ala) in the mouse Dot1l gene (Dot1l-MM) that renders its catalytic domain inactive (Min et al., 2003; Malcom et al., 2022). Dot1l-MM mice expressed an intact DOT1L protein that lacked only the H3K79 methyltransferase activity (Malcom et al., 2022). The methyltransferase mutant, Dot1l-MM mice, were also embryonic lethal. The embryos died around mid-gestation (Malcom et al., 2022). The mice also displayed defects in embryonic hematopoiesis, including a decreased ability to form definitive myeloid, and oligopotent (mixed) blood progenitors in ex vivo cultures (Malcom et al., 2022). However, unlike the Dot1L knockout (Dot1l-KO) (Feng et al., 2010), Dot1L-MM embryos were not anemic at E10.5 and hematopoietic progenitor cells (HPC) from Dot1l-MM yolk sacs were able to produce erythroid colonies in numbers similar to the wildtype (Malcom et al., 2022).
Histone methylation is important for permissive or repressive chromatin conformation and can have a profound effect on regulation of gene expression (Jambhekar et al., 2019). DOT1L is responsible for the mono-, di- and tri-methyl marks on lysine 79 of histone H3 (H3K79) (Feng et al., 2002). These histone modifications as well as the DOT1L protein have been strongly associated with actively transcribed chromatin regions (Steger et al., 2008). Thus, it has been suggested that DOT1L is involved in epigenetic regulation of transcriptional activation of genes in a tissue-specific manner.
In this study, we examined the expression of DOT1L-regulated genes on embryonic day 10.5 (E10.5) yolk sac (YS) derived hematopoietic progenitor cells (HPC). We observed that more than 82% of the differentially expressed genes (DEGs) in Dot1l-KO or Dot1l-MM HPCs cultured ex vivo, were upregulated, suggesting that DOT1L primarily acts to repress transcription in yolk sac HPCs.
Methods
Dot1L Mutant Mouse Models
The Dot1L-KO mice were generated and maintained as described previously (Feng et al., 2010). To produce the Dot1L-MM mouse, we generated mutant mESC (Malcom et al., 2022). Briefly, mESCs (E14TG2a) were targeted with CRISPR/Cas9 to introduce a point mutation (Asp241Ala) within exon 9 of Dot1L. This mutation lies in the methyltransferase domain of Dot1L and has been demonstrated to eliminate DOT1L catalytic activity without altering the overall protein structure (Min et al., 2003). Allele-specific PCR of genomic DNA was used identify the mutated mESC clones. Biallelic mutant mES clones were evaluated for H3K79 di-methylation (H3K79me2) by Western blot analysis (Malcom et al., 2022). This analysis indicated that DOT1L methyltransferase activity was absent in these cells. These results were confirmed in the Dot1L-MM embryos (Malcom et al., 2022). Dot1L-KO and Dot1L-MM heterozygous mice were maintained by continuous backcrossing to 129 stocks. Genotyping was performed on tail clips by using RED extract-N-Amp Tissue PCR Kit (Sigma-Aldrich) as previously described (Rumi et al., 2014; Rumi et al., 2017). Genotyping primer sequences are shown in Supplementary Tables S1, S2. All animal experiments were performed in accordance with the protocols approved by the University of Kansas Medical Center Animal Care and Use Committee.
Extensively Self-Renewing Erythroblasts (ESRE)
Dot1L-KO or Dot1L-MM heterozygous mutant males and females were set up for timed mating to collect the conceptuses on E10.5. Pregnant females were sacrificed, and uteri were dissected to separate embryos and yolk sacs. Embryos were treated with RED extract-N-Amp Tissue PCR reagents (Millipore Sigma, Saint-Louis, MO) to purify genomic DNA and perform the genotyping PCR.
Digested E10.5 yolk sacs were washed in IMDM, resuspended in 1 ml ESRE culture media, and plated into gelatin-coated, 12 well plates for ESRE culture, following a previously published protocol (England et al., 2011). ESRE culture media consisted of StemPro34 media containing nutrient supplement (Gibco/BRL), 2 U/ml human recombinant EPO (University of Kansas Hospital Pharmacy), 100 ng/ml SCF (PeproTech), 10–6 M dexamethasone (Sigma), 40 ng/ml insulin-like growth factor-1 (PeproTech) and penicillin-streptomycin (Invitrogen). After 1 day of culture, the nonadherent cells were aspirated, washed, resuspended in fresh ESRE media, and transferred to a new gelatin-coated well. After an additional 2 days in culture, total RNA was extracted from wildtype, Dot1L-KO or Dot1L-MM HPCs using TRI Reagent (Sigma-Aldrich) following the manufacturer’s instructions.
Assessment of Cell Proliferation, Cell Cycle Analysis and Apoptosis Assays
Single-cell suspensions from E10.5 yolk sacs were cultured in MethoCult™ GF M3434 (StemCell Technologies, Vancouver, BC, Canada) for 4 days. The mix of cytokines in this methylcellulose medium promotes definitive erythroid, myeloid, and mixed progenitor differentiation. Cells were collected on day 4 and stained with Annexin V to assess apoptosis. Some cells were fixed by adding cold 70% ethanol slowly to single cell suspensions, and then stained with propidium iodide (Belloc et al., 1994). Flow cytometry was performed using a FACSCalibur (BD Biosciences, San Jose, CA) (Krishan, 1975). Analyses of the cytometric data were carried out using CellQuest Pro software (BD Biosciences) (Sen et al., 2007; Chiruvella et al., 2008; Sutherland et al., 2009).
Sample Collection, Library Preparation and RNA-Sequencing
RNA quality was assessed by a Bioanalyzer at the KUMC Genomics Core, and samples with RIN values over 9 were selected for RNA-sequencing library preparation. RNA samples were extracted from multiple, expanded yolk sac cells obtained from embryos of the same genotype. These samples were pooled to prepare each RNA-seq library. 500 ng of total RNA was used to prepare an RNA-seq library using the True-Seq mRNA kit (Illumina, San Diego, CA) as described previously (Khristi et al., 2018a; Chakravarthi et al., 2019; Chakravarthi et al., 2020a). The quality of RNA-seq libraries was evaluated by Agilent Analysis at the KUMC Genomics Core and the sequencing was performed on an Illumina NovaSeq 6000 sequencer (KUMC Genomics Core).
RNA-Seq Data Analysis
RNA-sequencing data were demultiplexed, trimmed, aligned, and analyzed using CLC Genomics Workbench 12.2 (Qiagen Bioinformatics, Germantown, MD) as described previously (Khristi et al., 2018a; Chakravarthi et al., 2019; Chakravarthi et al., 2020a). Through trimming, low-quality reads were removed, and good-quality reads were aligned with the Mus musculus genome (mm10) using default guidelines: 1) maximum number of allowable mismatches = 2, 2) minimum length and similarity fraction = 0.8, and 3) minimum number of hits per read = 10. Gene expression values were measured in transcripts per million (TPM). DEGs were identified that had an absolute fold change of TPM ≥2 and a false discovery rate (FDR) p-value of ≤0.05.
Gene Ontology and Disease Pathway Analysis for the RNA-Sequencing Data
DEGs were subjected to Gene Ontology (GO) analysis (http://www.pantherdb.org) and categorized for biological, cellular and molecular function. DEGs in Dot1L-mutant HPCs were further analyzed by Ingenuity Pathway Analysis (IPA; Qiagen Bioinformatics, Germantown, MD) to build gene networks related to blood development. Functional analyses were performed towards understanding the biological pathways and functions altered in either of the Dot1L mutant progenitor cells.
Validation of RNA-Sequencing Data
DEGs were validated by RT-qPCR. RT-qPCR validation included cDNA samples prepared with wildtype, Dot1L-MM and Dot1L-KO ESRE cell-derived total RNA. cDNAs were reverse transcribed from 1 μg of total RNA by using Applied Biosystems High-Capacity cDNA Reverse Transcription Kits (Thermo Fisher Scientific). Real-time RT-qPCR amplification of cDNAs was carried out in a 20 μL reaction mixture containing Applied Biosystems Power SYBR Green PCR Master Mix (Thermo Fisher Scientific). The genes were selected from the IPA analyses and MGI data that impacted the proliferation and differentiation of HPCs. All PCR primers were designed using Primer 3 (Untergasser et al., 2007) and the primer sequences are shown in Supplementary Table S3. Amplification and fluorescence detection of qRT-PCR were carried out on Applied Biosystems QuantStudio 7 Flex Real Time PCR System (Thermo Fisher Scientific). The results of RT-qPCR were normalized to Rn18s expression and calculated by the comparative ΔΔCT method (Khristi et al., 2018b; Khristi et al., 2019; Chakravarthi et al., 2020b).
Statistical Analysis
Each RNA-seq library or cDNA was prepared from pooled RNA samples extracted from at least 3 different ESRE cultures of the same genotype. Each group for RNA sequencing consisted of three independent libraries and the differentially expressed genes (DEGs) were identified by CLC Genomics workbench as described previously (Khristi et al., 2018a; Chakravarthi et al., 2019; Chakravarthi et al., 2020a). In CLC Genomics Workbench, DEGs are determined by an inbuilt “Differential Expression for RNA-seq tool” that performs a multi-factorial statistic on the set of expression data across groups (like ANOVA) for comparison (Khristi et al., 2018a). RT-qPCR validation included at least six cDNA samples prepared from wildtype, Dot1L-KO and Dot1L-MM ESRE cell total RNA. The experimental results are expressed as mean ± standard error (SE). The RT-qPCR results were analyzed by one-way ANOVA, and the significance of mean differences were determined by Duncan’s post hoc test, with p ≤ 0.05. All the statistical calculations were done using SPSS 22 (IBM, Armonk, NY).
Results
Dot1L-KO and Dot1L-MM Embryos Exhibit Distinct Hematopoietic Phenotypes
We observed that Dot1L-KO embryos develop more slowly than WT embryos and suffer from lethal anemia (Feng et al., 2010) (Figures 1A–E). Dot1L-KO embryos die between embryonic day 11.5 (E11.5) and E13.51. Ex vivo culture of HPCs from E10.5 Dot1L-KO YS showed that erythroid differentiation was severely affected compared to the myeloid lineage (Feng et al., 2010). We generated another mouse model that carries a point mutation (Asn241Ala) in endogenous Dot1L, rendering the catalytic domain inactive (Malcom et al., 2022) (Figures 1F–J). Although the Dot1L-methyl mutant (Dot1L-MM) embryos also died at mid-gestation, we observed remarkable differences in the hematopoietic phenotype between the Dot1L-KO and Dot1L-MM mice (Malcom et al., 2022) (Figures 1B–E,G–J); in particular, erythropoiesis was minimally affected in Dot1L-MM yolk sacs and embryos, suggesting that hematopoietic activity of DOT1L may not be limited to its MT domain. However, ex vivo culture of yolk sac cells demonstrated that formation of both myeloid and mixed colonies was dramatically reduced in either Dot1L-KO or Dot1L- MM3. Culture of Dot1L-KO HPCs showed decreased cell proliferation (Figure 2A) accumulation of cells in the G0/G1 stage of the cell cycle (Figure 2B), and a greater percentage of Dot1L-KO and Dot1L-MM HPCs in ESRE cultures that were Annexin V-positive (Feng et al., 2010) (Figure 2C). In addition, Alkaline Comet assays showed greater DNA damage in Dot1L-MM cells compared to wildtype cells. DNA damage in Dot1L-KO ESRE cells was also elevated in comparison to that observed in wildtype cells. (Figure 2D).
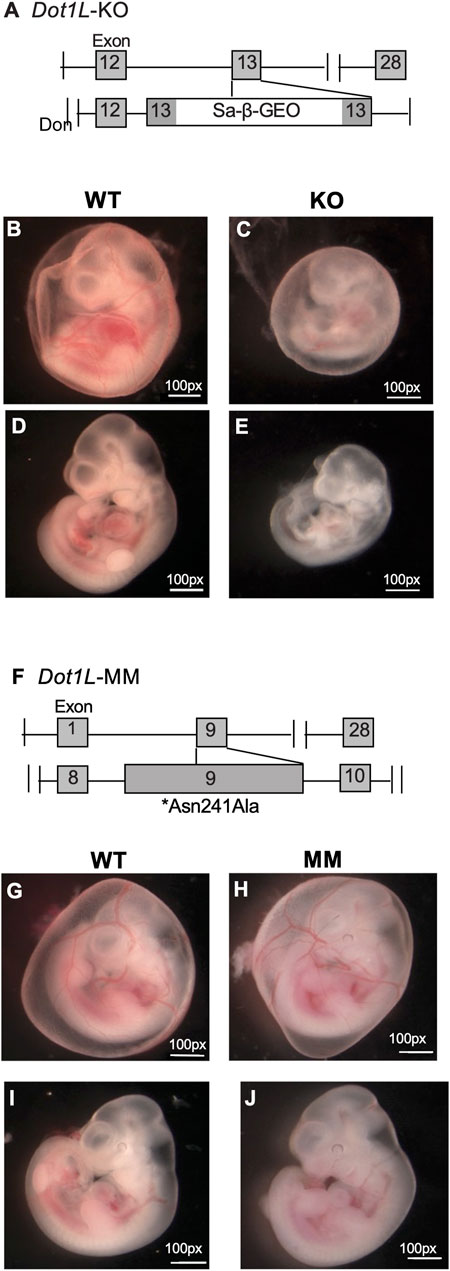
FIGURE 1. Differential phenotypes of Dot1L-KO and Dot1L-MM embryos. Schematic representation of the gene trap construct used to generate the mutant Dot1L-KO alleles (A). Representative images of E10.5 wildtype (WT) (B,D), Dot1L-KO (C,E), show that growth of Dot1L-KO embryos is slower than that of WT (B–E). In addition, at E10.5, the KO embryos demonstrated significant anemia, as there was noticeably less blood in both the yolk sac vasculature (B,C), as well as the body of the embryo (D,E). Schematic diagram of mouse Dot1L gene targeted by CRISPR/Cas9 to introduce a point mutation (Asn241Ala) that eliminates its methyltransferase activity (Dot1L-MM) (F). Representative images of E10.5 WT (G,I) and Dot1L-MM (H,J) embryos show that the growth of Dot1L-MM embryos is comparable to that of wildtype embryos. While Dot1L-MM embryos displayed embryonic lethality, they had little to no anemia (G–J), unlike the KO (B–E).
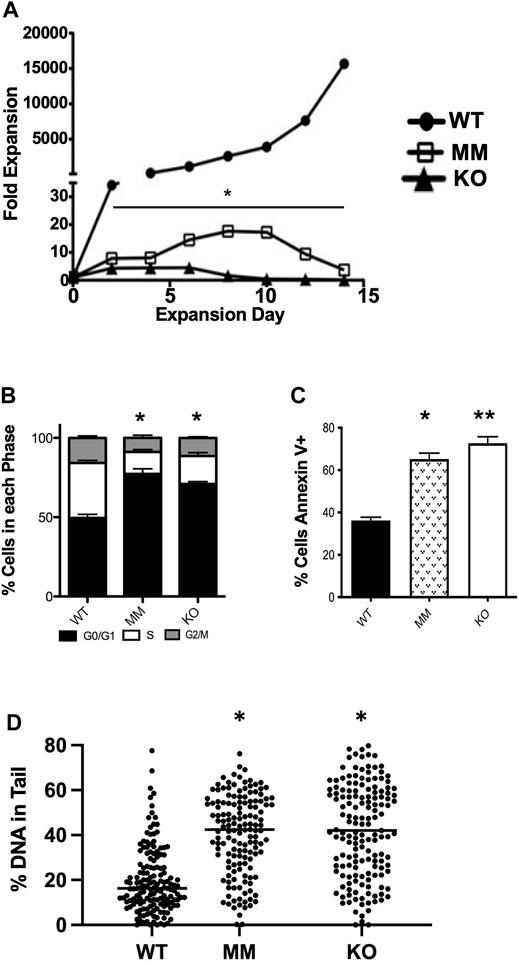
FIGURE 2. Dot1L-KO and Dot1L-MM ESREs display defective proliferation and survival. Cells isolated from E10.5 wildtype (WT), Dot1L-KO, and Dot1L-MM YSs were cultured in expansion media for ESREs. (A) Cell numbers were counted via trypan blue exclusion every 2 days for 14 days, and fold expansion was calculated relative to day 3 after isolation. On day 6–7 of counting, cells were labeled with propidium iodide or Annexin V and analyzed via flow cytometry for cell cycle analysis (B) and apoptosis (C). Alkaline Comet assays were performed on day 6 ESREs to assess DNA damage. Both Dot1L-KO and Dot1L-MM ESREs displayed evidence of increased DNA damage compared to WT, as measured by increased comet “tail length”. Solid lines indicate median percent DNA in comet tails (D). (A,D) are images of representative experiments, n ≥ 4. (B,C) are compiled data from 4 separate experiments. In these figures, bars represent mean ± SE. *indicates p ≤ 0.05. **indicates p ≤ 0.01.
DEGs in Dot1L-KO or Dot1L-MM ESRE Cells
Transcriptome data sets were generated by sequencing mRNA purified from ESRE cultures using E10.5 wildtype, Dot1L-KO or Dot1L-MM YS cells. The raw data have been deposited to NCBI SRA under PRJNA666736. Analyzed data including the DEGs are shown in Figures 3A–F. Of the total 25,749 reference genes in the mm10 genome, 16,806 genes were detected in wildtype, 17,602 in Dot1L-KO and 17,761 in Dot1L-MM ESRE cells. Analyses of the detected genes for level of gene expression revealed that ∼40% had a very low abundance (<1 TPM), ∼20% had low abundance (1-5 TPM), ∼12% had moderate abundance (>5–10 TPM), ∼25% had high abundance (>10–100 TPM), and only ∼3% of the genes had a very high abundance (>100 TPM). Among these genes, 1790 were differentially expressed (absolute fold change ≥2, p-value ≤ 0.05) in Dot1L-KO, with 358 downregulated and 1408 upregulated. Similarly, 1977 genes were differentially expressed (absolute fold change ≥2, p-value ≤ 0.05) in Dot1L-MM cells, with 328∼17% downregulated and 1649∼83% upregulated. Remarkably, 812 (∼45%) of the DEGs (635 upregulated and 177 downregulated) were unique to Dot1L-KO and 1023 (∼52%) of the DEGs (893 upregulated and 130 downregulated) were unique to Dot1L-MM ESRE cells (Supplementary Table S4–S11). When gene expression was compared between the mutant groups, we identified a total of 359 differentially expressed genes (233 genes upregulated and 126 downregulated) (Supplementary Table S12, S13). The DEGs were also evident in the hierarchical clustering (Figures 3A,B) and Volcano plots (Figures 3C,D), which demonstrate that most of the DEGs were upregulated in Dot1L-KO or Dot1L-MM HPCs (Figures 3E,F).
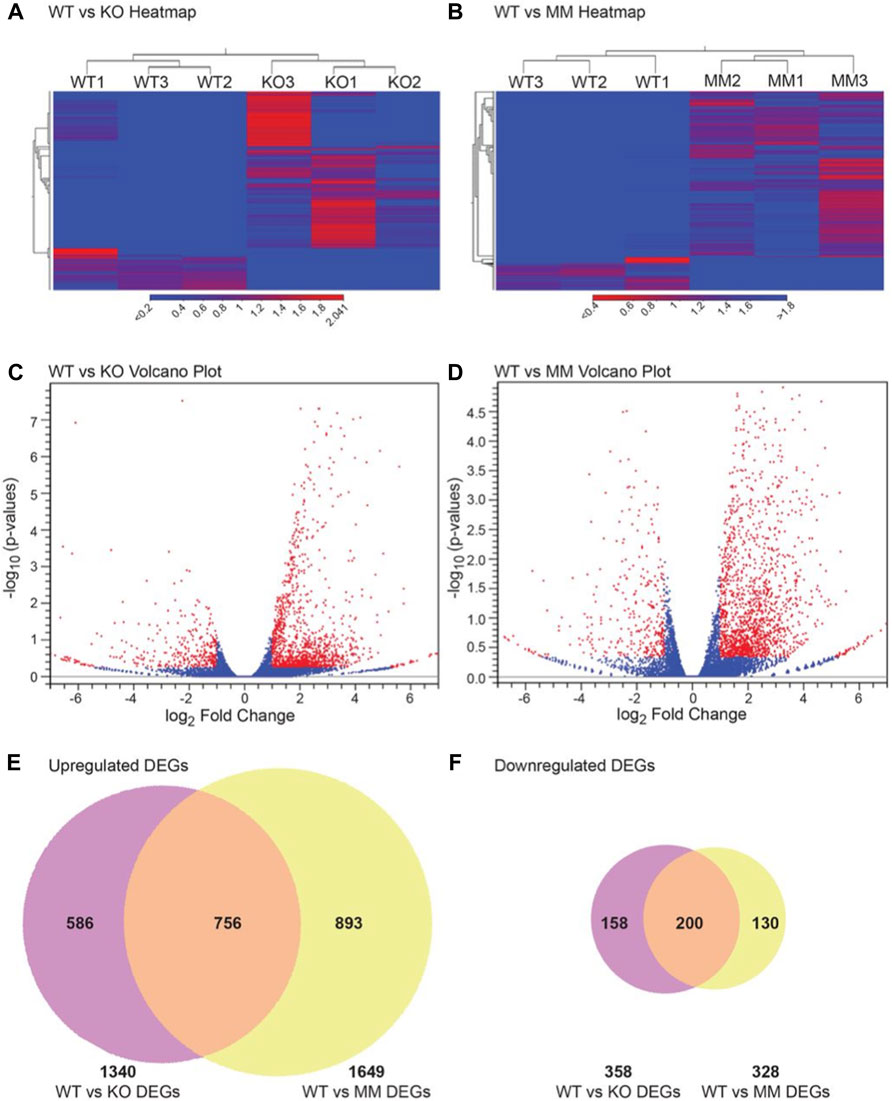
FIGURE 3. DEGs in Dot1L-KO and Dot1L-MM ESREs. Analyses of HPC transcriptomes were performed in wildtype (WT), Dot1L-KO, and Dot1L-MM ESREs on the 3rd day of ex vivo culture. RNA-seq libraries were prepared using 500 ng of total RNA extracted from pooled ESRE cells and sequencing was performed on an Illumina NovaSeq 6000 platform. RNA-seq data were analyzed using the CLC Genomics Workbench. All expressed genes were distributed according to TPM values. Hierarchical clustering was performed on differentially expressed genes (absolute fold change ≥2, p value ≤ 0.05) in WT versus Dot1L-KO groups (A), and WT versus Dot1L-MM groups (B). The DEGs in the Dot1L-KO, and Dot1L-MM ESRE cells are presented in Volcano plots [(C,D) respectively], with red dots showing the differentially expressed genes (n = 3/genotype). Finally, Venn diagrams showing that majority of the DEGs (∼82%) in either Dot1L-KO or Dot1L- MM are upregulated (E,F). Venn diagrams also showed that about 35–40% of the DEGs were unique to either Dot1L-mutant group (E,F).
Gene Ontology (GO) Analysis of the DEGs
GO analysis classified the DEGs into three categories: Biological Process (Figures 4A,B), Molecular Function (Figures 4C,D) and Cellular Component (Figures 4E,F). GO analysis revealed that the majority of genes in the Biological Process group were involved in biological processes, cellular processes, or cell signaling (Figures 4A,B). The genes in Molecular Function were involved in binding, protein-protein interactions, catalytic activity, and molecular and transcriptional regulation (Figures 4C,D). The genes in Cellular Component were predominantly involved in cell parts, membranes, organelles, and protein-protein complexes (Figures 4E,F).
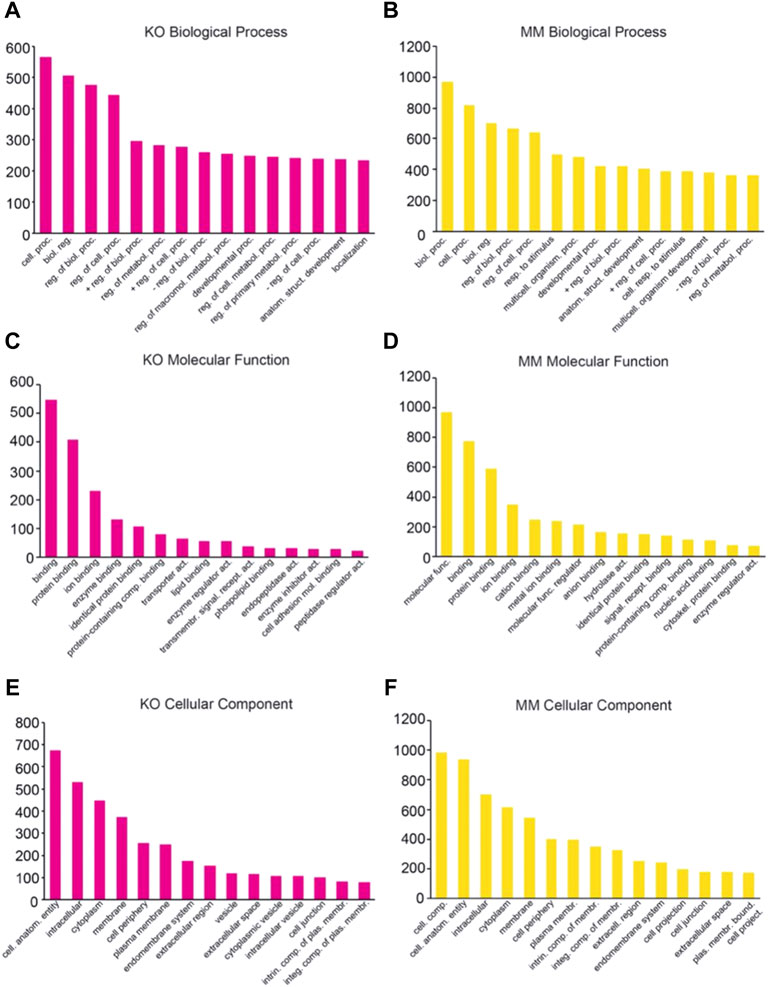
FIGURE 4. Classification of differentially expressed genes based on Gene Ontology. The differentially expressed genes in Dot1L-KO and Dot1L-MM ESREs were subjected to Panther Classification Analysis (http://pantherdb.org). Differentially expressed genes were classified. based on Biological Process (A,B), Molecular Function (C,D) and Cellular Components (E,F).
Ingenuity Pathway Analysis of the DEGs
IPA of the DEGs in Dot1L-KO or Dot1L-MM HPCs in ESRE cultures revealed altered expression of genes related to regulation of hematopoiesis. Among the hematopoietic pathways involved, we were particularly interested in proliferation and differentiation of hematopoietic progenitor cells (Figures 5A–D). We observed that many of the genes related to differentiation of HPCs were affected in both Dot1L-KO or Dot1L-MM ESRE cells (Figures 5A,B). However, the genes related to proliferation of HPCs were primarily impacted in Dot1L-KO ESRE cells (Figure 5C), while the genes related to development of HPCs were affected in Dot1L-MM cells (Figure 5D). We have also included lists of the genes shown in Figure 5A–D (Supplementary Tables S14–S17). Interestingly, among the 165 known genes involved in differentiation of HPCs, only 9 were affected in Dot1L-KO cells, whereas 21 were affected in Dot1L-MM ESRE cells (Figures 5E,F).
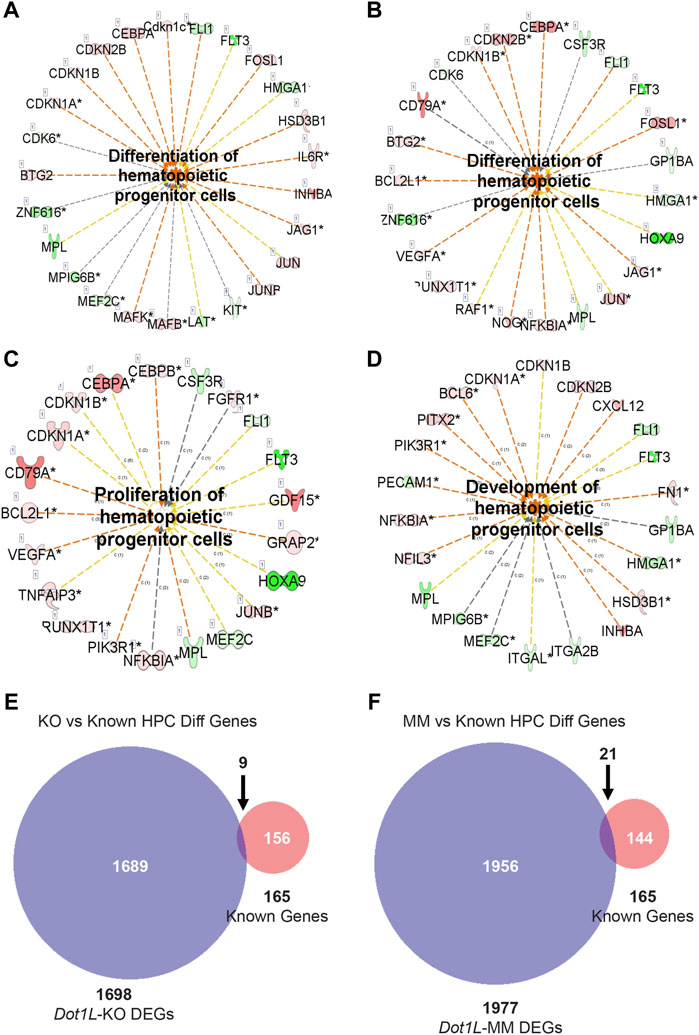
FIGURE 5. DEGs involved in proliferation and differentiation of HPCs. DEGs from RNA-seq data representing wildtype (WT) versus Dot1L-KO (A,C), and WT versus Dot1L-MM (B,D) were subjected to IPA analysis and detected many genes crucial for proliferation and differentiation of HPCs. In addition, we curated a group of genes (n = 165) from the MGI database (www.informatics.jax.or) that are involved in differentiation of HPCs and compared those with the DEGs identified in our RNA-seq data. Most of the DEGs in Dot1L-KO or Dot1L-MM ESRE cells were found to be novel (E,F). ‘c’ next to the relationship lines (A-D) stands for relationship types of ‘Causation/Leads to’ and the numbers next to ‘c’ stand for the number of reference findings supporting that link of relationship. The number before the gene name (A-D) inside the box represents number of splice variants. Asterisk (*) marks next to a gene name (A-D) indicate that multiple identifiers in the dataset file map to a single gene.
RT-qPCR Analyses Validated DEGs Involved in HPC Proliferation and Differentiation
Differentially expressed genes that were identified as being involved in proliferation and differentiation of HPCs were validated by RT-qPCR analysis. We observed that while genes involved in proliferation of HPCs were significantly downregulated in both Dot1L-KO and Dot1L- MM ESRE cells (Figures 6A–F), those involved in induction of differentiation were markedly upregulated (Figures 6G–I). These included downregulation of Hoxa9, Mpl, Mpo, Dnmt3b, Flt3, and Flt3l as well as upregulation of the CDK inhibitors. Marked increase in CDK inhibitors (Figures 6H,I) can explain the accumulation of cells in the G0/G1 phase of the cell cycle and the increased proportion of the Dot1L-mutant ESRE cells undergoing apoptosis (Figure 2).
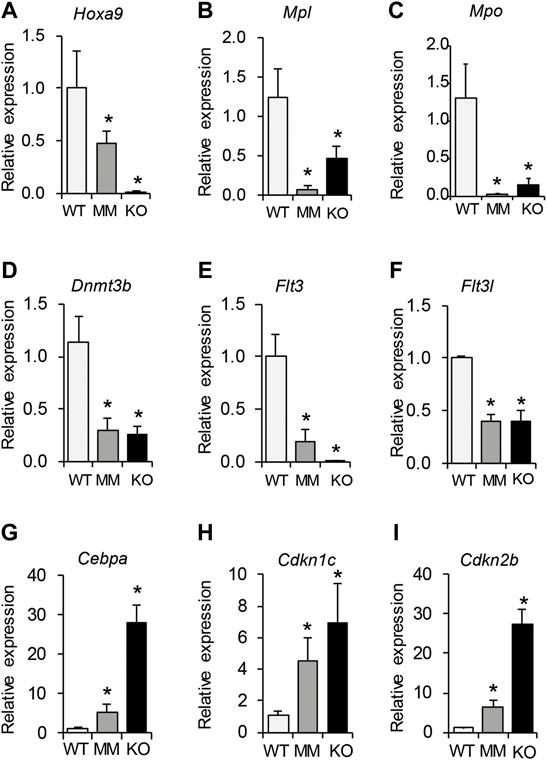
FIGURE 6. RT-qPCR validation of selected DEGs involved in proliferation and differentiation of HPCs. Differentially expressed genes that were identified to be involved in proliferation and differentiation of HPCs were further validated by RT-qPCR analyses. We observed that genes involved in proliferation of HPCs were significantly downregulated in both Dot1L-KO and Dot1L-MM ESRE cells (A–F). In contrast, those involved in induction of HPC differentiation were markedly upregulated (G–I). A marked increase in CDK inhibitors (H,I) correlates with the increased numbers of cells arrested in G0/G1 phase of the cell cycle, as well as the increased percentage of the Dot1L-mutant ESRE cells undergoing apoptosis. Relative expression was determined using 3 individual samples and is expressed as mean ± SE. *indicates p < 0.05.
Discussion
DOT1L is expressed at high levels in mouse HPCs (Supplementary Figure S1), suggesting a potential role for this chromatin organizer and transcriptional regulator in early blood development. This study analyzed the DEGs in both Dot1l-KO and Dot1L-MM mouse HPCs derived from E10.5 yolk sacs to examine early blood development. RNA-seq datasets were used to identify DOT1L-regulated genes in mouse HPCs and understand their potential role in early blood development.
We previously reported that hematopoietic transcription factor (TF) Gata2 was significantly reduced in Dot1L-KO HPCs, whereas Pu.1, an erythropoiesis inhibiting TF was upregulated (Feng et al., 2010). We also observed that KIT-positive HPCs from Dot1L-KO yolk sacs expressed low levels of Trpc6 (Feng et al., 20202020). Our RNA-seq data recapitulated the previous observations regarding expression of Gata2, Pu.1 and Trpc6 (PRJNA666736). Gene ontology and IPA analyses indicated that DOT1L regulates genes responsible for cell signaling and protein-protein interactions. Our previous studies have demonstrated that either loss of DOT1L expression (Feng et al., 2010) or loss of its methyltransferase activity leads to G0/G1 cell cycle arrest and increased apoptosis. IPA analyses showed that the DEGs are linked to proliferation and differentiation of HPCs, which were further validated by RT-qPCR analyses. We observed that while genes involved in proliferation of HPCs were significantly downregulated, those involved in induction of differentiation were markedly upregulated (Figure 6).
It is possible that the observed phenotype of failed primitive erythroid development in Dot1L-KO, but not Dot1L-MM mice is consistent with the observation that genes related to proliferation are preferentially affected in the Dot1L-KO cells. During embryonic hematopoiesis in the yolk sac, the vast majority of proliferation is involved in early erythrocyte formation, necessary to supply the developing embryo with sufficient oxygen for proper growth and development. If proliferation of these developing cells is diminished by these alterations in gene expression, then this might result in the phenotypic differences we observed. We postulate that the changes in proliferation-related genes result in a preferential reduction in proliferation in Dot1-KO HPCs, in vivo, compared to Dot1L-MM HPCs.
A marked increase in CDK inhibitors positively correlates with the accumulation of cells in the G0/G1 phase of the cell cycle and an increased proportion of the Dot1L-mutant ESRE cells undergoing apoptosis. The gene expression profile also showed a positive correlation with mechanisms involved in increased DNA damage.
DOTL1L is responsible for methylation of H3K79 (Feng et al., 2002). Histone methylation is integral to permissive or repressive chromatin conformation, and regulation of gene expression (Miller and Grant, 2013). Expression of Dot1/Dot1L is conserved across species (Feng et al., 2002; van Leeuwen et al., 2002; Shanower et al., 2005; Janzen et al., 2006; Steger et al., 2008) and enrichment of H3K79 methyl marks is associated with actively transcribed chromatin regions (Feng et al., 2002; van Leeuwen et al., 2002; Shanower et al., 2005; Janzen et al., 2006; Steger et al., 2008). However, DOT1L has also been associated with repression of gene transcription (Wong et al., 2015).
In this study we found that more than 80% of DEGs are upregulated in the absence of either the entire DOT1L protein or the H3K79 methyltransferase activity, consistent with DOT1L activity being involved primarily in transcriptional repression of gene expression in HPC. Solely based on gene expression data, it is not possible to conclude that DOT1L acts as a transcriptional repressor. The effect can be indirect; instead of DOT1L acting directly to repress the expression of the genes, it is possible that one or more of the DOT1L-upregulated genes are responsible for inducing repression of the observed downregulated genes in ESRE cells. Another possibility is that DOT1L could be required for the expression of master transcriptional activators, which will also generate the same effects on gene expression. These and other possible scenarios will be examined in future studies.
Although 60% of DEGs were common to both Dot1L-mutant groups, the remaining 40% of DEGs were unique to either group (Figure 3). These data indicate that while a majority of HPC gene expression requires DOT1L methyltransferase activity, expression of a large number of DOT1L-regulated genes do not require the intrinsic methyltransferase activity of the protein. These data are consistent with a recent study in mouse embryonic stem cells (mESC) which demonstrated a potential H3K79 methylation-independent role of DOT1L in transcriptional elongation and cell fate determination (Cao et al., 2020).
Given the potential clinical relevance of targeted DOT1L activity in various cancer therapies, identification of the precise molecular mechanisms of the methyltransferase independent DOT1L function in the regulation of gene expression is a priority. Our data point to a previously undescribed role for DOT1L in regulating gene expression in a defined, murine developmental system. Identifying the components of this mode of gene regulation may lead to the discovery of novel DOT1L functions of this very interesting epigenetic regulator and may provide opportunity to identify new therapeutic targets.
Data Availability Statement
The datasets presented in this study can be found in online repositories. The names of the repository/repositories and accession number(s) can be found below: https://www.ncbi.nlm.nih.gov/, PRJNA666736.
Ethics Statement
The animal study was reviewed and approved by the KUMC Animal Care and Use Proposal KUMC-ACUP. Written informed consent was obtained from the owners for the participation of their animals in this study.
Author Contributions
SB, AR, SG, and VC performed experiments and participated in gene expression and statistical analyses of data. CM performed experiments, generated the DOT1L mutation and participated in the generation of mutant mice. JV generated the DOT1L mutant mice. TF edited the manuscript. MR and PF. performed experiments, compiled data, oversaw the research, and wrote and edited the manuscript.
Funding
This work was supported by the National Institutes of Health (R01 DK091277) and by the University of Kansas Medical Center (KUMC) Research Institute. The mouse model was generated in the Transgenic and Gene Targeting Institutional Facility at KUMC, supported in part by the Center of Biomedical Research Excellence (COBRE) Program Project in Molecular Regulation of Cell Development and Differentiation (NIH P30 GM122731) and the University of Kansas Cancer Center (NIH P30 CA168524). The content is solely the responsibility of the authors and does not necessarily represent the official views of the KUMC Research Institute.
Conflict of Interest
The authors declare that the research was conducted in the absence of any commercial or financial relationships that could be construed as a potential conflict of interest.
Publisher’s Note
All claims expressed in this article are solely those of the authors and do not necessarily represent those of their affiliated organizations, or those of the publisher, the editors and the reviewers. Any product that may be evaluated in this article, or claim that may be made by its manufacturer, is not guaranteed or endorsed by the publisher.
Supplementary Material
The Supplementary Material for this article can be found online at: https://www.frontiersin.org/articles/10.3389/fgene.2022.828086/full#supplementary-material
Supplementary Figure S1 | KMT and KDM profiling analyses in Dot1L-KO and Dot1L-MM ESRE cells. The expression levels of a total of 27 KMTs and KDMs were analyzed using our RNA-seq data. The expression levels of Dot1L were the 4th highest of these genes in wildtype (WT) ESRE cells (A). In Dot1L-KO cells expression was very low (B) and high in Dot1L-MM cells (C), comparable to that of WT HPCs.
References
Belloc, F., Dumain, P., Boisseau, M. R., Jalloustre, C., Reiffers, J., Bernard, P., et al. (1994). A Flow Cytometric Method Using Hoechst 33342 and Propidium Iodide for Simultaneous Cell Cycle Analysis and Apoptosis Determination in Unfixed Cells. Cytometry 17 (1), 59–65. doi:10.1002/cyto.990170108
Cao, K., Ugarenko, M., Ozark, P. A., Wang, J., Marshall, S. A., Rendleman, E. J., et al. (2020). DOT1L-controlled Cell-Fate Determination and Transcription Elongation Are Independent of H3K79 Methylation. Proc. Natl. Acad. Sci. USA 117 (44), 27365–27373. doi:10.1073/pnas.2001075117
Chakravarthi, V. P., Ghosh, S., Dai, E., Pathak, D., and Rumi, M. A. K. (2020). Transcriptome Datasets of ESR2-Regulated Genes in Rat Granulosa Cells during Gonadotropin-Induced Follicle Maturation. Data in Brief 30, 105405. doi:10.1016/j.dib.2020.105405
Chakravarthi, V. P., Ghosh, S., Roby, K. F., Wolfe, M. W., and Rumi, M. A. K. (2020). A Gatekeeping Role of ESR2 to Maintain the Primordial Follicle Reserve. Endocrinology 161 (4), 161. doi:10.1210/endocr/bqaa037
Chakravarthi, V. P., Ghosh, S., Roy, R., Dai, E., Pathak, D., and Rumi, M. A. K. (2019). Transcriptome Datasets of Gonadotropin-Induced ESR2-Regulated Genes in Rat Oocytes. Data in Brief 27, 104786. doi:10.1016/j.dib.2019.104786
Chiruvella, K. K., Kari, V., Choudhary, B., Nambiar, M., Ghanta, R. G., and Raghavan, S. C. (2008). Methyl Angolensate, a Natural Tetranortriterpenoid Induces Intrinsic Apoptotic Pathway in Leukemic Cells. FEBS Lett. 582 (29), 4066–4076. doi:10.1016/j.febslet.2008.11.001
England, S. J., McGrath, K. E., Frame, J. M., and Palis, J. (2011). Immature Erythroblasts with Extensive Ex Vivo Self-Renewal Capacity Emerge from the Early Mammalian Fetus. Blood 117 (9), 2708–2717. doi:10.1182/blood-2010-07-299743
Feng, Q., Wang, H., Ng, H. H., Erdjument-Bromage, H., Tempst, P., Struhl, K., et al. (2002). Methylation of H3-Lysine 79 Is Mediated by a New Family of HMTases without a SET Domain. Curr. Biol. 12 (12), 1052–1058. doi:10.1016/s0960-9822(02)00901-6
Feng, Y., Borosha, S., and Ratri, A. (20202020). DOT1L Methyltransferase Regulates the Calcium Influx in Erythroid Progenitor Cells in Response to Erythropoietin. BioRxiv. doi:10.04.32574610.1101/2020.10.04.325746
Feng, Y., Yang, Y., Ortega, M. M., Copeland, J. N., Zhang, M., Jacob, J. B., et al. (2010). Early Mammalian Erythropoiesis Requires the Dot1L Methyltransferase. Blood 116 (22), 4483–4491. doi:10.1182/blood-2010-03-276501
Jambhekar, A., Dhall, A., and Shi, Y. (2019). Roles and Regulation of Histone Methylation in Animal Development. Nat. Rev. Mol. Cel. Biol. 20, 625–641. doi:10.1038/s41580-019-0151-1
Janzen, C. J., Hake, S. B., Lowell, J. E., and Cross, G. A. M. (2006). Selective Di- or Trimethylation of Histone H3 Lysine 76 by Two DOT1 Homologs Is Important for Cell Cycle Regulation in Trypanosoma Brucei. Mol. Cel. 23 (4), 497–507. doi:10.1016/j.molcel.2006.06.027
Khristi, V., Chakravarthi, V. P., Singh, P., Ghosh, S., Pramanik, A., Ratri, A., et al. (2018). Differentially Regulated Genes in Esr2-Mutant Rat Granulosa Cells. Data in Brief 19, 1008–1011. doi:10.1016/j.dib.2018.05.098
Khristi, V., Chakravarthi, V. P., Singh, P., Ghosh, S., Pramanik, A., Ratri, A., et al. (2018). ESR2 Regulates Granulosa Cell Genes Essential for Follicle Maturation and Ovulation. Mol. Cell. Endocrinol. 474, 214–226. doi:10.1016/j.mce.2018.03.012
Khristi, V., Ratri, A., Ghosh, S., Pathak, D., Borosha, S., Dai, E., et al. (2019). Disruption of ESR1 Alters the Expression of Genes Regulating Hepatic Lipid and Carbohydrate Metabolism in Male Rats. Mol. Cell. Endocrinol. 490, 47–56. doi:10.1016/j.mce.2019.04.005
Krishan, A. (1975). Rapid Flow Cytofluorometric Analysis of Mammalian Cell Cycle by Propidium Iodide Staining. J. Cel. Biol. 66 (1), 188–193. doi:10.1083/jcb.66.1.188
Malcom, C. A., Ratri, A., Piasecka-Srader, J., Borosha, S., Chakravarthi, V. P., Alvarez, N. S., et al. (2022). Primitive Erythropoiesis in the Mouse Is Independent of DOT1L Methyltransferase Activity. Front. Cel. Dev. Biol. 9, 813503. doi:10.3389/fcell.2021.813503
Miller, J. L., and Grant, P. A. (2013). The Role of DNA Methylation and Histone Modifications in Transcriptional Regulation in Humans. Epigenetics: Develop. Dis., 289–317. doi:10.1007/978-94-007-4525-4_13
Min, J., Feng, Q., Li, Z., Zhang, Y., and Xu, R.-M. (2003). Structure of the Catalytic Domain of Human DOT1L, a Non-SET Domain Nucleosomal Histone Methyltransferase. Cell 112 (5), 711–723. doi:10.1016/s0092-8674(03)00114-4
Rumi, M. A. K., Dhakal, P., Kubota, K., Chakraborty, D., Lei, T., Larson, M. A., et al. (2014). Generation of Esr1-Knockout Rats Using Zinc finger Nuclease-Mediated Genome Editing. Endocrinology 155 (5), 1991–1999. doi:10.1210/en.2013-2150
Rumi, M. A. K., Singh, P., Roby, K. F., Zhao, X., Iqbal, K., Ratri, A., et al. (2017). Defining the Role of Estrogen Receptor β in the Regulation of Female Fertility. Endocrinology 158 (7), 2330–2343. doi:10.1210/en.2016-1916
Sen, R., Bandyopadhyay, S., Dutta, A., Mandal, G., Ganguly, S., Saha, P., et al. (2007). Artemisinin Triggers Induction of Cell-Cycle Arrest and Apoptosis in Leishmania Donovani Promastigotes. J. Med. Microbiol. 56 (9), 1213–1218. doi:10.1099/jmm.0.47364-0
Shanower, G. A., Muller, M., Blanton, J. L., Honti, V., Gyurkovics, H., and Schedl, P. (2005). Characterization of the Grappa Gene, the Drosophila Histone H3 Lysine 79 Methyltransferase. Genetics 169 (1), 173–184. doi:10.1534/genetics.104.033191
Steger, D. J., Lefterova, M. I., Ying, L., Stonestrom, A. J., Schupp, M., Zhuo, D., et al. (2008). DOT1L/KMT4 Recruitment and H3K79 Methylation Are Ubiquitously Coupled with Gene Transcription in Mammalian Cells. Mol. Cel. Biol. 28 (8), 2825–2839. doi:10.1128/mcb.02076-07
Sutherland, D. R., Nayyar, R., Acton, E., Giftakis, A., Dean, S., and Mosiman, V. L. (2009). Comparison of Two Single-Platform ISHAGE-Based CD34 Enumeration Protocols on BD FACSCalibur and FACSCanto Flow Cytometers. Cytotherapy 11 (5), 595–605. doi:10.1080/14653240902923161
Untergasser, A., Nijveen, H., Rao, X., Bisseling, T., Geurts, R., and Leunissen, J. A. M. (2007). Primer3Plus, an Enhanced Web Interface to Primer3. Nucleic Acids Res. 35, W71–W74. doi:10.1093/nar/gkm306
van Leeuwen, F., Gafken, P. R., and Gottschling, D. E. (2002). Dot1p Modulates Silencing in Yeast by Methylation of the Nucleosome Core. Cell 109 (6), 745–756. doi:10.1016/s0092-8674(02)00759-6
Keywords: DOT1L methyltransferase, Dot1l methyltransferase mutant mouse, erythroid-myeloid progenitors, erythroid-myeloid differentiation, mutant mouse models
Citation: Borosha S, Ratri A, Ghosh S, Malcom CA, Chakravarthi VP, Vivian JL, Fields TA, Rumi MAK and Fields PE (2022) DOT1L Mediated Gene Repression in Extensively Self-Renewing Erythroblasts. Front. Genet. 13:828086. doi: 10.3389/fgene.2022.828086
Received: 02 December 2021; Accepted: 23 February 2022;
Published: 23 March 2022.
Edited by:
Tamer Onder, Koç University, TurkeyReviewed by:
Ying Liu, Cornell University, United StatesHengbin Wang, University of Alabama at Birmingham, United States
Copyright © 2022 Borosha, Ratri, Ghosh, Malcom, Chakravarthi, Vivian, Fields, Rumi and Fields. This is an open-access article distributed under the terms of the Creative Commons Attribution License (CC BY). The use, distribution or reproduction in other forums is permitted, provided the original author(s) and the copyright owner(s) are credited and that the original publication in this journal is cited, in accordance with accepted academic practice. No use, distribution or reproduction is permitted which does not comply with these terms.
*Correspondence: Patrick E. Fields, cGZpZWxkc0BrdW1jLmVkdQ==
†These authors have contributed equally to this work
 Shaon Borosha
 Anamika Ratri
 Carrie A. Malcom
 V. Praveen Chakravarthi
 Timothy A. Fields
 M. A. Karim Rumi
 Patrick E. Fields