 Mohammad Rafiqul Islam1†
 Shahzad Amir Naveed1†Yue Zhang1†
 Zhikang Li1,2,3Xiuqin Zhao1
 Sajid Fiaz4Fan Zhang1,2Zhichao Wu1Zhiqing Hu1Binying Fu1Yingyao Shi2Shahid Masood Shah5Jianlong Xu1,3*
 Wensheng Wang1,2,6*
- 1Institute of Crop Sciences/National Key Facility for Crop Gene Resources and Genetic Improvement, Chinese Academy of Agricultural Sciences, Beijing, China
- 2College of Agronomy, Anhui Agricultural University, Hefei, China
- 3Shenzhen Branch, Guangdong Laboratory for Lingnan Modern Agriculture, Agricultural Genomics Institute at Shenzhen, Chinese Academy of Agricultural Sciences, Shenzhen, China
- 4Department of Plant Breeding and Genetics, The University of Haripur, Haripur, Pakistan
- 5Department of Biotechnology, COMSATS University Islamabad-Abbottabad Campus, Abbottabad, Pakistan
- 6National Nanfan Research Institute (Sanya), Chinese Academy of Agricultural Sciences, Sanya, China
Multiple stress tolerance at the seed germination stage is crucial for better crop establishment in the direct-seeded rice ecosystem. Therefore, identifying rice genes/quantitative trait loci (QTLs) associated with salinity and anaerobic tolerance at the germination stage is a prerequisite for adaptive breeding. Here, we studied 498 highly diverse rice accessions Xian (Indica) and Geng (Japonica), and six traits that are highly associated with salinity and anaerobic tolerance at germination stage were measured. A high-density 2.8M Single Nucleotide Polymorphisms (SNP) genotype map generated from the 3,000 Rice Genomes Project (3KRGP) was used for mapping through a genome-wide association study. In total, 99 loci harboring 117 QTLs were detected in different populations, 54, 21, and 42 of which were associated with anaerobic, salinity, and combined (anaerobic and salinity) stress tolerance. Nineteen QTLs were close to the reported loci for abiotic stress tolerance, whereas two regions on chromosome 4 (qSGr4a/qCL4c/qRI4d and qAGr4/qSGr4b) and one region on chromosome 10 (qRI10/qCL10/ qSGr10b/qBM10) were associated with anaerobic and salinity related traits. Further haplotype analysis detected 25 promising candidates genes significantly associated with the target traits. Two known genes (OsMT2B and OsTPP7) significantly associated with grain yield and its related traits under saline and anaerobic stress conditions were identified. In this study, we identified the genes involved in auxin efflux (Os09g0491740) and transportation (Os01g0976100), whereas we identified multistress responses gene OsMT2B (Os01g0974200) and a major gene OsTPP7 (Os09g0369400) involved in anaerobic germination and coleoptile elongation on chromosome 9. These promising candidates provide valuable resources for validating potential salt and anaerobic tolerance genes and will facilitate direct-seeded rice breeding for salt and anaerobic tolerance through marker-assisted selection or gene editing.
1 Introduction
As the staple food for most Asian people, rice productivity has more than doubled since the “Green Revolution” in 1960s, when the global breeding efforts have been largely focused on improving yields under irrigated lands in Asia and rest of the world (Khush, 2001; Jena and Nissila, 2017). However, abiotic stresses (salinity, drought, cold, heat, etc.) are major obstacles to establishment and yield of rice crops, especially in rainfed areas (Khush, 2005). Rice is normally grown in the semiaquatic environments, and transplanting has been the predominant method in rice planting for decades. However, rice grown areas by direct seeding have been increasing rapidly in recent years because direct seeding offers many advantages such as earlier maturity, reduced water use, planting costs, operational simplicity, and so on, particularly in areas of double rice cropping (Kumar and Ladha, 2011). However, direct seeding of rice (DSR) tends to suffer more from anaerobic stress of flooding, heavy rain, or saline water irrigation at the time of sowing, particularly in fields of small-hold farmers of Asia (Flowers and Yeo, 1995; Hakim et al., 2010). Further, DSR can be exposed to combined stress of salinity in nonanoxic conditions during tidal in lowlands of coastal areas of many Asian countries (Ray et al., 2016; Naveed et al., 2018). Under this kind of scenario, flooding decelerates seed germination and delays seedling establishment (Ismail et al., 2008), whereas shoot growth of rice seedlings can be simultaneously arrested under salt stress due to osmotic stress and high accumulation of Na+ in shoot tissues (Munns and Tester, 2008), because rice plants could not maintain their normal energy level under hypoxia (low O2 concentration) (Kurniasih et al., 2013). Thus, developing rice varieties with superior ability to germinate under salinity and anaerobic stress is essential for success of DSR.
Rice anaerobic germination tolerance (AGT) is a complex trait and known to be associated with rapid coleoptile elongation at germination stage because elongated coleoptiles allow plants to obtain enough oxygen to meet the required metabolic activity under anaerobic stress. The faster coleoptiles elongate, the more likely rice seedlings can survive under anaerobic stress. Both AGT and salinity germination tolerance (SGT) of rice are complex phenomena controlled by multiple quantitative trait loci (QTLs)/genes, and rice germplasm accessions are known to vary considerably for their AGT and SGT (Ghosal et al., 2020). Identification of important QTLs/ genes and their functional haplotypes (alleles) is an important step to understand the genetic and molecular bases of complex traits (Judson et al., 2002; Niu, 2004). Recently, the genome-wide association studies (GWASs) have emerged as a powerful approach for direct identification of QTLs and candidate genes associated with complex traits in germplasm, particularly in discovering useful germplasm accessions and mining underutilized allele/haplotype combinations for crop improvements (Myles et al., 2009). Association mapping using GWAS has multiple gains over the traditional linkage mapping analysis using biparental populations, including (1) higher mapping resolution, (2) more and significant loci for associated phenotypes, and (3) shortened study time (Yu and Buckler, 2006). In rice, GWAS efforts have been greatly facilitated by the free availability of the seeds and genomic sequences of a core collection of 3,010 rice germplasm accessions (Wang W. et al., 2018). In the past 2 decades, several efforts have been taken to dissect rice AGT and SGT by identifying QTLs/alleles to facilitate functional genomic analyses of the traits and to provide target QTLs/genes for marker-assisted selection breeding (Kamoshita et al., 2002). After screening 8,000 rice accessions, Angaji et al. (2010) reported that a Xian (Indica) landrace, Khao-Hlan-On, has excellent AGT, which were largely controlled by five putative QTLs (qAG-1-2, qAG-3-1, qAG-7-2, qAG-9-1, and qAG-9-2). They further fine-mapped a major QTL, qAG-9-2, on the long arm of chromosome 9 and determined OsTPP7 as the most likely candidate gene for qAG-9-2 (Kretzschmar et al., 2015). Later, Zhang M. et al. (2017) reported several novel genetic loci for AGT in 432 Xian (Indica) accessions and demonstrated the Hap.2 of one candidate gene (LOC_Os06g03520) associated perfectly with flooding tolerance. Hsu and Tung (2015) reported a strong correlation between the subpopulation groups and five haplotypes of HXK6 gene; allelic variations of different haplotypes contributes to the phenotypic variation of coleoptile responses to anoxic conditions.
Mishra et al. (2016) reported the different haplotypes of HKT genes were associated with varied salt tolerance. Using a panel of 208 rice mini-core accessions, Naveed et al. (2018) identified six loci associated with rice salt tolerance on chromosomes 2, 3, 4, 6, 8, and 12. A similar GWAS by Chadchawan et al. (2017) identified 10 loci/genes on chromosomes 1, 2, 5, 10, 11, and 12 for leaf Na+ content in Thai rice. Shi et al. (2017) used 478 rice accessions and identified 11 loci associated with salt tolerance at seed germination stage. Two hundred thirty-two diverse rice accessions were used for photosynthesis measurement under salinity stress and identified two genomic regions on chromosome 5 highly associated with Photosystem II (PSII), and it was reported that chloroplast biogenesis in response to salt stress is important. However, the reported AGT and salt tolerance loci and alleles represent only a small portion of the expected loci/alleles involved in salinity and anaerobic tolerance at the germination stage and few of the identified QTLs were resolved into candidate genes for further validation and application in rice improvement.
Haplotypes can be defined as a linear arrangement of the genes/alleles (Judson et al., 2002) and can be determined through genotypic data (Niu, 2004). Identification of candidate genes and their functional haplotypes (alleles) for QTLs provides important information to determine causal genes and facilitate further validation and application of identified QTL in trait improvement. This has been greatly facilitated with the availability of large numbers of the 3,010 resequenced rice genomes (Wang W. et al., 2018). For example, Naveed et al. (2018) reported 22 candidate genes each with two to four haplotypes for salt tolerance at the germination and seedling stages in rice. Zhang J. et al. (2017) used 211 rice accessions and identified 22 candidate genes each with two to five haplotypes for ferrous iron and zinc toxicity tolerance at the seedling stage. This study reports our recent effort to identify 99 QTLs for AGT, SGT, and anaerobic plus salinity germination tolerance (ASGT), each of which was resolved into relatively few candidate genes’ strong evidence from comprehensive analyses of gene–Coding sequence (CDS) haplotypes (functional alleles). Our results should be helpful to enhance the current knowledge and information on the genetic and molecular bases of both AGT and SGT and to facilitate further validation their functionalities by gene editing and utilization in improving rice AGT and SGT in future marker-aided breeding programs.
2 Materials and Methods
2.1 Plant Material
A set of 498 accessions of diverse germplasm accessions representing the major global rice-growing regions was selected from 3,000 Rice Genomes Project (3KRGP) as the materials. This pool of germplasm accessions consisted of five subpopulations, including 312 Xian (Indica), 131 Geng (Japonica), 14 Aus, 15 aromatic/basmati (Bas), and 26 admixture (Adm). Because the population structure may significantly impact our results in the following QTL identification by GWAS, we divided the 498 accessions into two populations based on the genomic relationships (Wang W. et al., 2018), the whole population with all 498 accessions included, population Xian (Indica) consisting of 312 Xian, 14 Aus and 26 Adm accessions, and population Geng (Japonica) consisting of 131 Geng and 15 aromatic/basmati (Bas) accessions.
2.2 Evaluation of the Rice Accessions for Anaerobic and Salinity Germination Tolerance
2.2.1 Evaluation of Anaerobic Germination Tolerance
Ten sterilized seeds of each of the 498 accession were placed in a capped glass tube of 2.5 × 8 cm (diameter × height) filled with distilled water up to 5 cm to submerge the seeds. Glass tubes were incubated in a growth chamber at 27°C ± 1°C, with a 12-h light (approximately 150 μmol m−2s−1)/12-h dark cycle and 60%–65% moisture without changing water for 7 days. For the control experiment, 10 sterilized seeds were placed on moist filter paper in glass tubes. After 7 days, coleoptile lengths (CLs) of seedlings were measured using a standard glass measuring scale, and the anaerobic response index (RI) was calculated as:
2.2.2. Evaluation of Salinity Germination Tolerance
Ten sterilized seeds of each accession were placed in two filter papers soaked with 10 ml of 115 mM of sodium chloride in a petri plate (9 cm) during the germination stage to screen salinity tolerance. In the controlled treatment, the same number of seeds per line was placed on a filter paper soaked in 10 ml of distilled water in a petri dish. All petri dishes were incubated under controlled conditions in the growth chamber at a temperature of 27 ± 1°C, with 12 h of light and dark (day/night) and 60%–65% moisture. This experiment was laid out under completely random design with three replications for each accession. The final germination rates (GRs in %) were measured for all germinating seeds 10 days after germination. Total biomass (BM) was taken as dry weight (g) of 5 plants; plants (root and shoot) were dried at 70°C for 3 days and was weighted on a digital high-accuracy balance.
2.2.3 Evaluation of Anaerobic Plus Salinity Germination Tolerance
To identify promising accessions tolerant to the combined (salt plus anaerobic) stress, 200 accessions tolerant to either salt or anaerobic stress were selected from previous separate screening experiments based on higher germination under stress conditions. Ten sterilized seeds of each of the 200 accession were placed in a capped glass tube of 2.5 × 8 cm (diameter × height) filled with saline solution (65 mM) up to 5 cm to submerge the seeds. Glass tubes were incubated in a growth chamber at 27°C ± 1°C, with a 12-h light period and 60%–65% moisture without changing water for 7 days. For the control experiment, 10 sterilized seeds were placed on moist filter paper in glass tubes. After 7 days, CLs were measured using a standard glass measuring scale and the anaerobic salt RI (ASRI) was calculated as:
2.3 Data Analyses
Phenotypic data distribution and correlations among measured traits and stress index were computed and plotted by using R statistical software, corrplot package (http://www.R-project.org). The 2.8M SNP genotypic data generated from the 3KRGP were used in this study (Zheng et al., 2015). SNPs with missing rates of more than 20% and minor allele frequency ≤0.05 were removed, leaving a total of 2,760,730 high-quality SNPs used data analyses for the whole population, 1,973,926 SNPs for the Xian (Indica) population, and 1,371,057 SNPs for the Geng (Japonica) population in the following GWAS.
2.4 Population Structure and Kinship
The 2.8M high-quality SNPs were used to calculate the population structure (Q) and kinship (K) of the 498 rice accessions based on Bayesian clustering and principal components using the software STRUCTURE 2.3.4. The program was run with the following parameters: k (1–5), with a variable number of groups; five runs at each k value, and for each run, 10,000 burn-in iterations followed by 10,000 MCMC (Markov Chain Monte Carlo) iterations. To calculate the appropriate K value, the default method, Centered_IBS, was applied using TASSEL 5.2.23 (Bradbury et al., 2007). The IBS was scaled (1 + F) for the mean diagonal element, where F is the inbreeding coefficient for the whole population of 498 accessions. These Q and K matrix were used for associations and analysis.
Linkage disequilibrium (LD) was measured using squared allele frequency correlations (r2) values between pairs of the SNP markers, calculated using the TASSEL 5.2.23 software (Bradbury et al., 2007). To find the relationship between the r2 value and physical distance of the identical marker pair, the R package ggplot2 was used to obtain the second-order polynomial curve of r2 fitting of the filtered data. The LD decay rate was measured by dropping r2 to a half along the chromosomal distance (Huang et al., 2010).
2.5 QTLs and Candidate Gene Identification by GWAS and Haplotype Analyses
The linear mixed-effects model was applied to determine the association between each SNP and the measured traits (Zhang et al., 2010) by using an efficient mixed-model analysis with the EMMA expedited (EMMAX) software (Kang et al., 2010) to determine genetic similarities among accessions. The effective number of independent markers (N) was calculated using the GEC software (Tumino et al., 2016). As mentioned previously, all rice accessions used in this study were divided into three panel populations, the whole (Xian + Geng + Adm, n = 498), Xian (Indica) (n = 326), and Geng (Japonica) (n = 146) populations. It is well-known that the smaller the population size is, the less the power is in detecting QTLs by GWAS. Based on population sizes, two thresholds of p = 1.0 × 10⁻⁵ and 1.0 × 10⁻⁶ were used to claim significant SNP-trait associations in the Geng (Japonica) population, Xian (Indica) and whole populations, respectively, determined by the total number of SNPs (0.05/N) in GWAS. Based on the LD estimates (r2) of 200, 170, and 220 kb of the whole, Xian (Indica), and Geng (Japonica) populations (Wang W. et al., 2018), any two or more significant SNPs in <200-kb distances were considered as a single QTLs. Genes inside the QTLs with p = 1.0 × 10⁻⁴ were used for GO (Gene Ontology) enrichment, and the group with false discovery rate ≤0.05 was regarded as significantly enriched. The Pearson correlation coefficient was calculated in R software version 3.5.0, and the network was visualized using Cytoscape version 3.6.1.
Identification of candidate genes for important QTLs was achieved by determining important QTLs for the measured traits and then by identifying candidate genes for important QTLs by bioinformatics and haplotype analyses. From those QTLs identified by GWAS, anyone that met at least two of the following three criteria was considered as important QTL: (1) having large phenotypic effects with >10% of the total trait variance and (2) the LOD peaks of significant SNPs mapped to the same location (∼1 Mb) of a fine mapped QTL/cloned gene of functional relevance, (3) QTL region–containing nonsynonymous SNPs in their CDS −log10 (p < 10−4). Then, three steps were used to identify candidate genes for important QTL regions by (1) searching all genes in the target region of important QTL-containing nonsynonymous SNPs in their CDS regions based on corresponding reference genomes (Minghui 63) used as the Xian (Indica) reference genome and Nipponbare as the Geng (Japonica) reference genome); (2) the presence of major gene CDS haplotypes (gcHaps) in more than 10 accessions that showed statistically significant differences between the major haplotypes of selected candidate genes for the associated trait; and (3) for each of the most likely candidate genes, a haplotype network in the 3KRGP was constructed using all nonsynonymous SNPs downloaded from the Rice SNP-Seek Database (Alexandrov et al., 2015) within its coding sequence regions using the RFGB v2.0 (Wang et al., 2020) and the pegas package in R. Haplotypes present in at least 150 rice accessions in 3KRGP were used for comparing. The mean trait value of each haplotype was compared using one-way analysis of variance (ANOVA) followed by Duncan new multiple range tests (p < 0.05) with the agricolae package in R. Then, each of the candidate genes was interpreted according to its population organization and evolutionary relationships of their major gcHaps in the 3KRGP (Supplementary Figure S1).
3 Results
3.1 Phenotypic Variation and Trait Correlations
The 498 accessions showed huge variation for the measured AGT and SGT traits (Table 1). On average, the Geng (Japonica) population showed significantly higher values than the Xian (Indica) population for most the AGT and SGT traits. ANOVA showed that the genotypic differences among the accessions explained 97.2%, 32%, and 97.5% of the total phenotypic variances of GR under anaerobic condition (AGr), CL, and RI contributing to AGT (Supplementary Table S1), and 97.4%, 90.3%, and 97.1% of the total phenotypic variances of GR under salinity condition (SGr), and BM contributing to SGT, respectively (Supplementary Table S1). As expected, highly positive correlation was observed between the three AGT traits, with r = 0.82 between AGr and CL, 0.82 between AGr and RI, and 0.99 between CL and RI, indicating that CL was the primary determinant of AGT. For the SGT traits, moderately positive correlations were observed between SGr and BM (r = 0.31), (Supplementary Figure S2). Based on the screening result, we were able to identify 53 promising accessions, including 33 AGT accessions (21 Geng and 11 Xian accessions) from 14 countries, which had mean AGr >79%. There were 14 SGT accessions (5 Geng and 9 Xian lines) from 12 countries that had mean SGr >76% (Supplementary Table S2). There were 17 RIs under anaerobic and salinity condition (ASRI) accessions (16 Geng and 1 Xian) from eight countries that had mean ASRI >2.9 cm. Ten of these accessions were promising under more than one stress. Eight accessions showed excellent performance under AGT and ASRI, and one accession (IRIS_313-10710) showed excellent germination under AGT and SGT stresses. One accession (B068) showed excellent performance under three stresses: AGT, SGT, and ASRI (Supplementary Table S2). These accessions would be valuable sources of genetic variation for genetic/molecular dissection and improvement of rice AGT and SGT in the future.
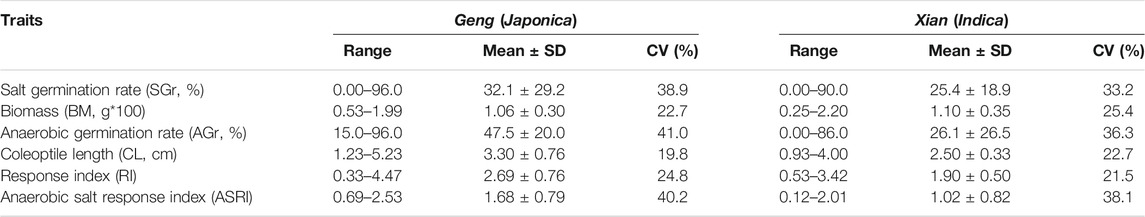
TABLE 1. Performances of salt tolerance related traits measured at germination under salinity and anaerobic stresses.
3.2 Population Structure
The population structure and kinship analyses using the 2,760,730 high-quality SNPs through STRUCTURE indicated that k = 2 was most informative to describe the population structure of the 498 accessions used in this study (Figure 1). The huge amounts of variation for all measured AGT and SGT traits (Table 1) were the foundation for our following GWAS analyses, with the whole population consisting of all 498 lines, the Geng (Japonica) population consisting of 146 accessions (Geng + Bas), the Xian (Indica) population consisting of 326 (Xian + Aus).
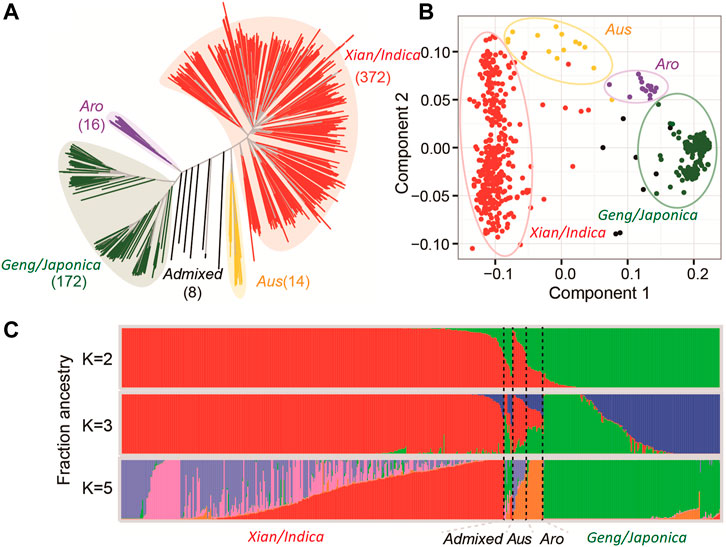
FIGURE 1. Population structure of germplasm showing NJ tree plot (A), PC (B), and Bayesian clustering (C) of germplasm.
3.3 Identification of QTLs for AGT and SGT Traits by GWAS
Based on a stringent threshold (p = 1.0 × 10⁻⁵ for Geng and 1.0 × 10⁻⁶ for Xian), we detected a total 99 QTLs associated with the six traits measured under the salinity and anaerobic germination stresses in different rice populations (Figure 2). For the 3 AGT traits, we identified 54 QTLs. Nine QTLs associated with AGr mapped to chromosomes 2, 4, 5, 8, 9, and 11, four of which (qAGr2, qAGr5, qAGr8a, and qAGr8b) were identified only in population Geng (Japonica), three QTLs (qAGr9, qAGr11a and qAGr11c) only in population Xian (Indica), and the remaining two (qAGr4 and qAGr11b) in both whole and Xian (Indica) populations. These QTLs had main effects ranging from 7.1 for qAGr11a to 19.5 for qAGr8b (Supplementary Table S3). Eighteen QTLs affecting CL were identified and mapped to chromosomes 1, 2, 3, 4, 6, 7, 8, 9, and 10. Eight of these QTLs were detected only in population Geng (Japonica), qCL4a and qCL9b were detectable only in population Xian (Indica), and seven QTLs were detectable only in the whole population, suggesting the allelic differences at these QTLs were primarily reflected between the two subspecies. qCL4b was detected in the whole and Geng (Japonica) populations. These QTLs had effects ranging from 3.3 for qCL3d to 10.6 for qCL9b. Twenty-seven QTLs affecting anaerobic RI were identified. Of these, 15 were detected only in population Geng (Japonica), and eight were detectable only in the whole population; qRI4b, qRI9b, and qRI11c only in population Xian (Indica); and qRI4c in both Geng (Japonica) and whole populations. These RI QTL had effects ranging from 2.3 for qRI11a to 16.3 for qRI12b. We noted that nine pairs of CL and RI QTLs were mapped to the identical locations with the same peak SNPs (Supplementary Table S3). Each of these cases should be considered the same QTL affecting both CL and RI because of the high positive correlation between CL and RI.
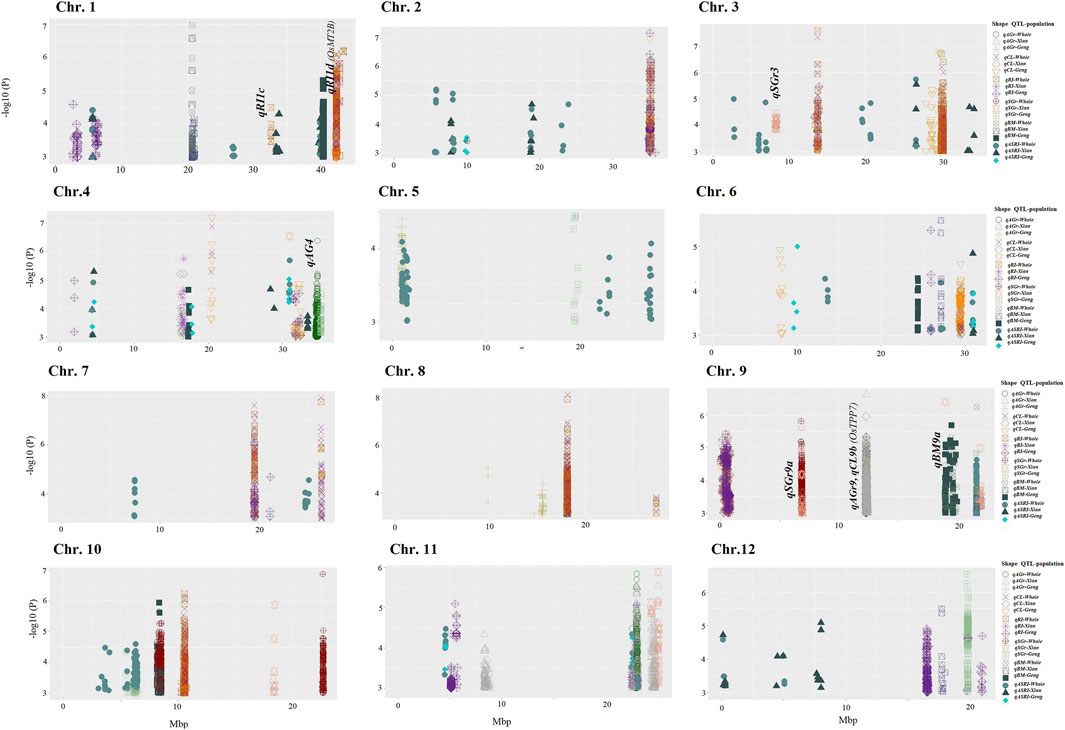
FIGURE 2. Manhattan plots of AGT and SGT QTLs in the whole genome. Significant SNPs for six traits in Xian (Indica), Geng (Japonica), or whole populations are displayed in different colors and shapes; each shape represents specific QTL identified in Xian (Indica), Geng (Japonica), or whole.
Twenty-one QTLs were identified for the SGT traits. Nine QTLs associated with BM were identified and mapped to chromosomes 1, 4, 6, 9, 10, and 12. These included qBM1b, qBM4, qBM6a, qBM9b, and qBM10 detectable only in population Geng (Japonica), qBM6b and qBM12 only in population Xian (Indica), and qBM1a in both whole and Xian (Indica) populations. These QTLs had effects ranging from 3.2 for qBM6b to 9.6 for qBM9a. Twelve QTLs affecting salt GR (SGr) were identified and mapped to chromosomes 3, 4, 5, 9, 10, 11, and 12. These included qSGr4b, qSGr5, qSGr10a, and qSGr12 in population Geng (Japonica); qSGr3, qSGr4a, qSGr9b, qSGr10c, and qSGr11 in population Xian (Indica); qSGr10b and qSGr10d in the whole population; and qSGr9a in the Xian (Indica) and whole populations. These QTLs had effects ranging from 4.7 for qSGr4a to 20.2 for qSGr4b (Supplementary Table S3).
In addition, we identified 42 QTLs associated with ASRI and mapped to all 12 rice chromosomes. Twenty of these QTLs were detected in the whole population; seven QTLs (qASRI1a, qASRI1d, qASRI2e, qASRI2g, qASRI3e, qASRI12a, and qASRI12b) in the Xian (Indica) and whole populations; qASRI4a and qASRI6d were in all three populations; seven QTLs (qASRI1c, qASRI1e, qASRI2b, qASRI3f, qASRI4c, qASRI4e, and qASRI12c) detected only in population Xian (Indica); qASRI2d, qASRI4b, and qASRI6a in population Geng (Japonica); and qASRI4d, qASRI11a, and qASRI11b in the Geng (Japonica) and whole populations. These QTLs had effects ranging from 2.1 ASRI for qASRI5b to 11.3 ASRI for qASRI3e (Figure 2; Supplementary Table S2).
3.4 GO Enrichment Analysis
In total, 317 genes with significant SNP were used for GO enrichment analysis, and significant GO terms for embryonic development, nitrogen compound metabolism, nucleic acid metabolism, carbohydrate metabolic process, response to stress, and response to stimulus were identified. Four GO terms (embryonic development, carbohydrate metabolic process, response to stress, and response to stimulus) highly associated with abiotic stress tolerance were targeted for further analysis, and 22 genes were found common for the target GO terms. The results explained that the genes with significant SNPs are associated with abiotic stress tolerance trait in rice (Supplementary Figures S4, S5).
3.5 Candidate Genes for Important QTLs
Based on the GWAS results, we were able to determine seven important QTLs: qRI1c, qRI1d, qSGr3, qAGr4, qBM9a, qSGr9a, and qAGr9 (qCL9b and qRI9b), based on their large phenotypic effects and LOD peaks of multiple highly significant SNPs mapped to a small region of ∼1 Mb or to a fine mapped QTL/cloned gene of functional relevance. Based on the criteria, four QTLs, qRI1c, qRI1d, qAGr4, and qAGr9 (qCL9b and qRI9b), with large effects on AGT, appeared to be more important, and candidate genes were identified in those regions. qAGr4 was mapped in a confidence interval of 230 kb (34.60–34.83 Mb) on chromosome 4 with 142 SNPs in the 32 genes, which resulted in identification of six candidate genes, Os04g0677700, Os04g0678300, Os04g0678700, Os04g0679050, Os04g0681600, and Os04g0682100 (Table 2). Os04g0679050 encoding an H0801D08.10 protein and has 3 major haplotypes consisted of nonsynonymous SNPs. Hap1 presented in only 3 Xian (Indica) and 11 Geng (Japonica) accessions and had a mean AGr of 45.4%, significantly higher than the predominant Hap2 (mean AGr = 31.3%) and Hap3 (mean AGr = 11.3%) (Supplementary Figure S3). Similarly, Os04g0682100 encodes a C2 calcium/lipid-binding protein and has only two major haplotypes in the whole population. Hap1 was predominant in population Geng (Japonica) and associated with a mean AGr of 57.3%, significantly higher than Hap2, which had a mean AGr of 21.8% and was predominant in population Xian (Indica) (Supplementary Figure S3). We observed four major haplotypes at Os04g0681600, which encodes a DUF580 family protein of unknown function. Hap1 and Hap2 were present in population Geng (Japonica) and had mean AGr of 54.4% and 44.2%, significantly higher than Hap3 and Hap4, which were present primarily in population Xian (Indica) (Supplementary Figure S3; Table 3). These results suggested Os04g0679050, Os04g0681600, and Os04g0682100 were most likely candidates for qAGr4. qAGr9 (qCL9b and qRI9b) mapped to an interval of 240 kb (12.20–12.44 Mb) on chromosome 9, which harbors a cloned QTL gene, OsTPP7 (LOC_Os09g20390), encoding the trehalose-6-phosphate phosphatase involved in trehalose-6-phosphate metabolism and enhancing rice AGT by driving growth kinetics of the germinating embryo and elongating coleoptile under anaerobic conditions (Kretzschmar et al., 2015). The haplotype analyses suggest seven candidate genes, Os09g0369050, Os09g0369250, Os09g0369400, Os09g0369500, Os09g0370500, Os09g0371000, and Os09g0372800. Of them, Os09g0369400 encodes a protein similar to trehalose-6-phosphate phosphatase 7 (TPP7) and has only three major haplotypes in population Xian (Indica) with Hap1 associated with significantly higher AGr and longer CL than Hap2 (Supplementary Figure S3; Table 3).
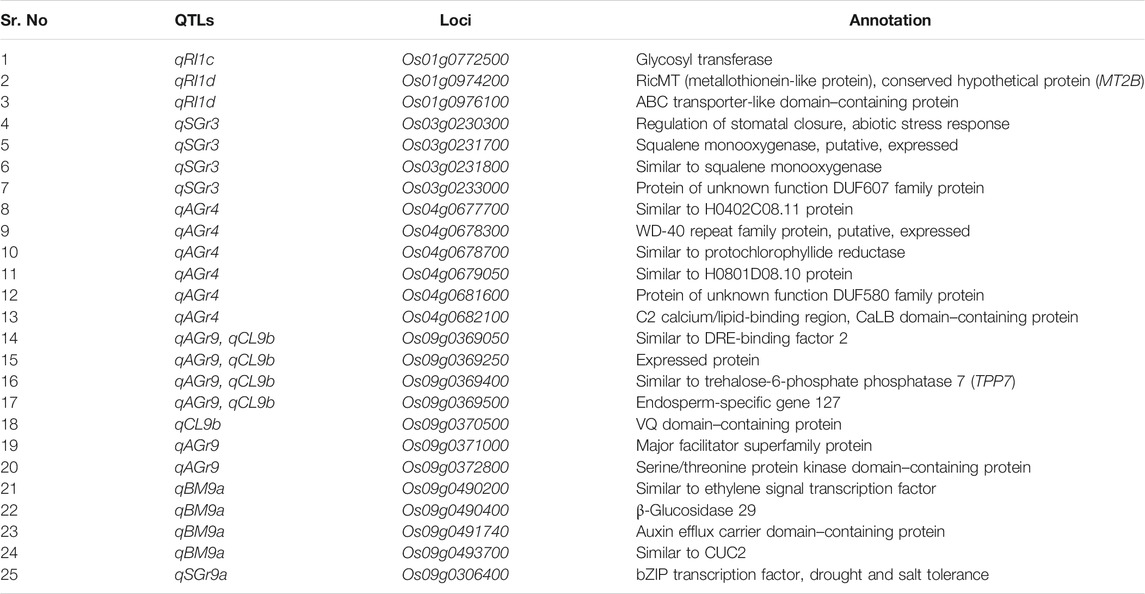
TABLE 2. List of 25 candidate genes for seven important QTLs identified at under salinity and anaerobic stresses.

TABLE 3. Haplotype analysis of the candidate genes for important QTL regions.
We discovered five major haplotypes (with frequency >150) constructed from SNPs within the CDS regions of this gene in the 3,010 rice accessions (Figure 3A). According to their frequencies in the five major rice populations, Hap1 and its derived one, Hap4, were the predominant alleles in population Geng (Japonica) and associated with high AGr in the tested populations, whereas Hap2 was the predominant allele in population Xian (Indica) and associated with lower AGr. However, two less frequent alleles, Hap3 and Hap5, which were present almost only in population Xian (Indica), were associated with greatly reduced AGr. Figure 3D explains that Os09g0306400 has four haplotypes in the 3,010 rice accessions, and according to the frequencies, haplotypes were the predominant alleles in population Xian (Indica), and this allele is associated with high SGr in the tested populations. On chromosome 1, three candidate genes, Os01g0772500, Os01g0974200, and Os01g0976100, were identified in two important QTLs (qRI1c and qRI1d). Os01g0772500 encodes glycosyl transferase, Os01g0974200 encodes RicMT (metallothionein-like protein), conserved hypothetical protein (MT2B), and Os01g0976100 encodes protein contains domain for ABC transporter.
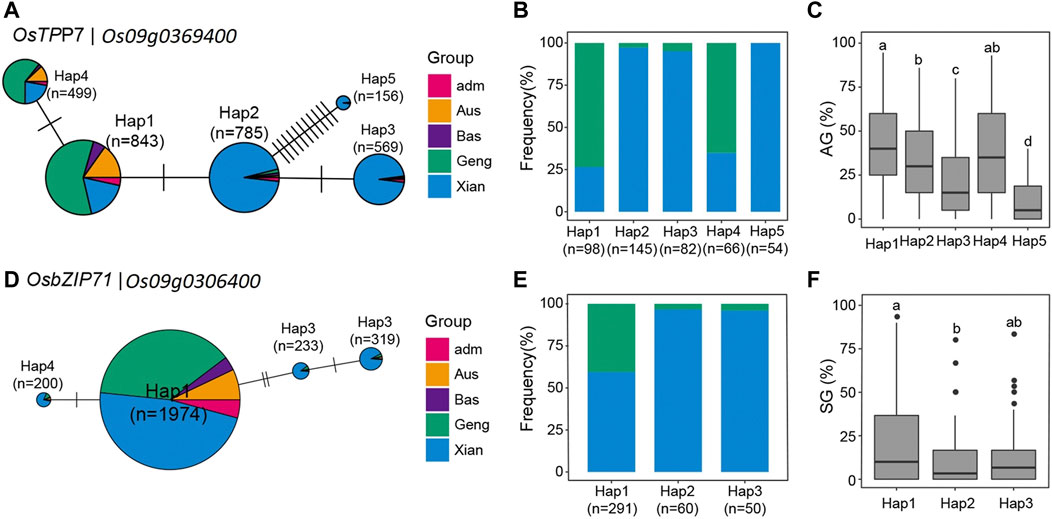
FIGURE 3. (A) for OsTPP7 and (D) for OsbZIP71; Frequencies of (B), 5 haplotypes(Hap) of OsTPP7 and (E), 3 haplotypes(Hap) of OsbZIP71 in subgroups of 3RGP; The distribution of AG for the (C), 5 Haps of OsTPP7 and the distribution of SG the (F), 3 Haps of OsbZIP71. Different letters above each boxplot indicate significant differences among haplotypes according to Tukey’s honest’s significant difference test (p < 0.05).
Three SGT important QTLs, qSGr3, qBM9a, and qSGr9a, were analyzed for candidate gene identification. qSGr3 mapped to chromosome 3 in the confidence interval of 360 kb (6.83–7.19 Mb) where we detected 158 SNPs in the 41 genes with LOD peaks in genes Os03g0230300 (regulation of stomatal closure and abiotic stress response), Os03g0231700 (the squalene monooxygenase), Os03g0231800 (similar to squalene monooxygenase), and Os03g0233000 (a DUF607 family protein of unknown function) (Figure 3), indicating that they were the most likely candidate genes for qSGr3. Os03g0231800 is predicted to encode a squalene monooxygenase and has four major haplotypes in the mapping panel populations. Hap1 was associated with significantly higher SGr than the other three haplotypes based on ANOVA (Supplementary Figure S3). At the other three candidate genes, no significant differences were detected among their haplotypes, suggesting Os03g0231800 can be candidate gene for qSGr3.
qBM9a was mapped to a confidence interval of 260 kb (18.88–19.14) on chromosome 4–containing 118 SNPs with 3 LOD peaks in 21 genes, which led us to identify four most likely candidate genes, Os09g0490200 (similar to ethylene signal transcription factor), Os09g0490400 (β-glucosidase 29), Os09g0491740 (an auxin efflux carrier domain–containing protein), and Os09g0493700 (similar to CUC2). Os09g0490400 encodes the β-glucosidase 29 and has three major haplotypes in the whole population. Hap1 was associated with the highest BM, followed by Hap2 and Hap3 with the lowest BM (Table 3; Supplementary Figure S3). Predicted to be an ethylene signal transcription factor gene, Os09g0490200 has two major haplotypes, and Hap1 was associated with significantly higher BM (Supplementary Figure S3). Os09g0493700 is predicted to be a CUC2 gene with three major haplotypes, and Hap1 was associated with the highest BM, followed by Hap2, and Hap3 had the lowest BM (Supplementary Figure S3).
4 Discussion
DSR has increased rapidly recently in different Asian countries because of its being labor-saving and cost-effective. However, developing high-yielding rice cultivars suitable for direct seeding must have good AGT and SGT in order to achieve high and sustainable yields under salinity and anaerobic stresses at the germination stage. In this study, we have shown that there is tremendous genetic variation for traits contributing to AGT and SGT in the primary gene pool of rice and identified large numbers of QTLs affecting the AGT and SGT traits in rice. While providing a clear picture regarding the overall level and pattern of this useful genetic diversity and materials, our results shed some light on the genetic basis of SGT and AGT in rice and suggest more efficient strategies how to exploit this valuable genetic variation in future development of new and high-yielding DSR varieties. In this study, huge amounts of phenotypic variation were observed among accessions for the measured AGT and SGT traits, primarily within the subspecific populations. On average, Geng (Japonica) accessions showed significantly higher AGT than Xian (Indica) accessions, which was also reflected by more Geng (Japonica) accessions showing high level of AGT. The subspecific differences in SGT traits were less pronounced. Thus, future improvement of both AGT and SGT should focus on exploitation of within-subspecies variation. In this respect, the identification of 33 AGT accessions and 14 SGT accessions of diverse origins (Table 2) provided excellent materials for future genetic/molecular dissection and improvement of AGT and SGT.
With the threshold of −log10 (p < 10−5) for two or more SNPs in 200 kb by GWAS, we were able to identify large numbers of QTLs significantly associated with the AGT and SGT traits and ASGT, indicating rice adaptation to AG, SG, and ASG stresses is genetically complex. Clearly, most of the identified QTLs had relatively small effects on the AG, SGT traits, and ASGT. We noted that most (87.1%) of the identified QTLs were detected in a single population, including 39 QTLs detectable only in population Geng (Japonica), 22 QTLs in population Xian (Indica), and 39 QTLs detected only in the whole population, whereas 5 (qCL4b, qRI7a, qASRI4d, qASRI11a, and qASRI11b) and 10 QTLs (qAGr11b, qBM1a, qSGr9a, qASRI1a, qASRI1d, qASRI2e, qASRI2g, qASRI3e, qASRI12a, and qASRI12b) were detected in whole in parallel with Geng (Japonica) and Xian (Indica) populations, respectively, and 2 QTLs (qASRI4a and qASRI6d) were detected in Geng, Xian (Indica) and whole populations. While providing strong evidence for the impact of population structure of the tested accessions on effectiveness of GWAS, this result has important implications for their potential application to improving rice AGT, SGT, and ASGT in future breeding programs, for example, for those QTLs identified in either population Xian (Indica) or Geng (Japonica).
Three QTL (qCL9b, qRI9b, and qAGr9) associated with AGT were identified in the same region on chromosome 9 (12.20–12.44 Mb); this region was previously cloned and reported as major anaerobic stress tolerance gene OsTPP7 (Kretzschmar et al., 2015). Two QTL qBM9a and qBM9b associated with salinity stress were identified in the same region on chromosome 9 (18.87–20.00 Mb); this region was previously cloned from Xian (Indica) rice variety 9,311 and reported as OsEATB, a major gene involved in the reduction of plant height that is a major factor to increase plant yield (Qi et al., 2011). One QTL (qRI1c) was identified on chromosome 1 (32.60–33.03 Mb); this region is adjacent to the previously cloned gene OsKAT1, which was reported as a rice shaker potassium channel that confers tolerance to salinity stress in rice (Obata et al., 2007). One QTL (qSGr9a) was identified on chromosome 9 (6.82–7.05 Mb); this region is adjacent to previously cloned gene OsbZIP71, another rice shaker potassium channel conferring salinity tolerance in rice (Liu et al., 2013). Two QTLs (qRI12b and qSGr12) were identified in the same region on chromosome 12 (19.68–19.84) associated with SGr and AGr length; this region is adjacent to previously cloned gene OsATG10b (Shin et al., 2009), which plays an important role in the survival of rice cells against oxidative stresses. One QTL (qRI1d) was identified on chromosome 1 associated with root length; this region was previously reported for salt tolerance as OrbHLH001, and overexpression of OrbHLH001 from Dongxiang wild rice (Oryza rufipogon) conferred salt tolerance in rice plants (Chen et al., 2013). One QTL (qSGr3) was identified on chromosome 3 associated with salinity germination; this region was reported for drought and salt tolerance as dsm3 (Du et al., 2011). One region of chromosome 10 (8.29–8.58 Mb) had three QTLs (qSGr10b and qBM10) associated with two traits measured under salinity stress; these traits have positive correlations with each other. Association of this region with three different traits predicts that this region can produce salinity tolerance. A major advantage in our study was the use of high-density genotypic data to identify QTL through GWAS, allowing us to narrow down the QTL region to <200 kb, which we further investigated to identify significant SNPs >−log (p) > 3 in the CDS to mark candidate genes. In total, 24 candidate genes were identified for 7 QTL short-listed as important. One candidate gene, Os01g0772500 for qRI1, encodes glycosyl transferase, and in rice, this protein has been characterized as leaf senescence protein and associated with photosynthetic rate, stomatal conductance, and transpiration rate (Wang M. et al., 2018).
Two candidate genes, Os01g0974200 and Os01g0976100, were identified for qRI1d. Os01g0974200 encodes protein RicMT (metallothionein-like protein), and metallothionein-producing genes are involved in multiple types of abiotic stress tolerance (Kumar et al., 2012). Identification of this locus in our study can be cloned to find genes for abiotic stress tolerance. While Os01g0976100 encodes a protein-containing ABC transporter-like domains, these proteins are involved in plant developmental processes and transporting various compounds/elements across cell membranes (Hwang et al., 2016). Four candidate genes, Os03g0230300, Os03g0231700, Os03g0231800, and Os03g0233000, were identified for qGS3. Os03g0230300 encodes a protein involved in the regulation of stomatal closure and the abiotic stress response (You and Chan, 2015). Os03g0231700 encodes squalene monooxygenase, and Manavalan et al. (2011) used RNAi-mediated disruption of squalene synthase and found drought tolerance and improvement in rice yield. Os03g0231800 expressed a putative protein, and Os03g0233000 encodes a protein of unknown function in the DUF607 family. DUF domain proteins are reported for drought tolerance in rice (Cui et al., 2016). Six candidate genes, Os04g0677700, Os04g0678300, Os04g0678700, Os04g0679050, Os04g0681600, and Os04g0682100, were identified for qAGr4. Os04g0677700 and Os04g0679050 expressed putative proteins similar to H0402C08.11 and H0801D08 protein. Os04g0678300 expressed a WD-40 family protein; these proteins are associated with plant tolerance to abiotic stresses (Kong et al., 2015). Os04g0678700 expressed protochlorophyllide reductase. Protochlorophyllide is a precursor of chlorophyll, which is the most important component of photosynthesis and anabolic processes (Dalal and Tripathy, 2012). Os04g0681600 expressed a DUF580 domain protein. Os04g0682100 expressed a CaLB domain protein, which is a novel repressor of abiotic stress responses (de Silva et al., 2011). Five candidate genes, Os09g0369050, Os09g0369250, Os09g0369400, Os09g0369500, and Os09g0370500, were identified for qCL9b, and six candidate genes, Os09g0369050, Os09g0369250, Os09g0369400, Os09g0369500, Os09g0371000, and Os09g0372800, for qAGr9. Four candidate genes (Os09g0369050, Os09g0369250, Os09g0369400, and Os09g0369500) were significant for both QTL qAGr9 and qCL9b. Os09g0369050 expressed a protein similar to DRE-binding factor 2 protein. DRE elements are present in the promoter regions of various gene involved in abiotic stress tolerance. Os09g0369250 expressed a putative protein of unknown function, and Os09g0369400 expressed a protein similar to trehalose-6-phosphate, phosphatase 7, as osTPP7, a cloned gene for anaerobic stress tolerance at germination in rice (Kretzschmar et al., 2015), and it participates in starch mobilization to promote embryo germination and coleoptile elongation (Hsu and Tung, 2015). Os09g0369500 expressed a conserved protein known as endosperm-specific gene (OsEnS). The endosperm is a critical factor for seed growth, and OsEnS gene was identified on chromosome 9 in rice (Nie et al., 2013). Os09g0370500 expressed a VQ domain protein; VQ domain proteins are involved in abiotic stress responses and developmental processes (Jing and Lin, 2015). Os09g0371000 expressed a major facilitator superfamily protein, and these proteins have multiple roles in auxin transport and drought stress tolerance in Arabidopsis (Remy et al., 2013). Os09g0372800 expressed a serine/threonine protein kinase domain–containing protein, and this protein causes resistance to rice stripe disease (Lee and Kim, 2015). Four candidate genes, Os09g0490200, Os09g0490400, Os09g0491740, and Os09g0493700, were identified for qBM9a. Os09g0490200 encodes ethylene signal transcription factor, and it is reported that ethylene signaling-related genes respond to dehydration stresses (Ren et al., 2017). Os09g0490400 expressed β-glucosidase; these proteins are involved in abiotic stresses through the accumulation of antioxidant flavanols (Baba et al., 2017). Os09g0491740 expressed auxin efflux carrier domain protein, and auxin has been reported as a key growth regulator that is involved in abiotic stress responses (Sharma et al., 2015). Os09g0493700 expressed a protein similar to CUC2; CUC is associated with drought and salt tolerance in rice.
Identification of the candidate gene based on its relevance in the mechanism to the trait of interest leads us to identify trait-controlling genes. Identification of new and previously reported QTL/candidate genes in this study demonstrated the advantages of GWAS using high genetic diversity and higher-resolution mapping to identify candidate genes. However, few confines were found for GWAS approach, as we had a limited ability to detect rare QTL/alleles because minor alleles were removed, and this method cannot detect epistasis. A further selection of nonsynonymous SNPs in the coding regions of the gene for haplotype analyses cannot cover the trait variation caused by SNP/mutation in the promoter or noncoding regions of the gene. Moreover, use of a single reference genome (presence or absence of gene) can cause errors in GWAS for the accuracy of QTL and candidate genes.
5 Conclusion
In GWAS, using high genetic diversity is a powerful tool for the identification of QTL candidate genes and haplotypes. In this study, a total of 54 and 21 QTLs were identified related to anaerobic and salt tolerance at the germination stage. Different genomic regions of Xian (Indica) and Geng (Japonica) are involved in AGT and SGT trait, which suggest specific QTL for the subgroup. In total, 25 candidate genes were identified, several of these in the genomic regions reported or cloned for anaerobic and salt tolerance. It was also found the Geng (Japonica) accession having more tolerance to anaerobic stress as compared to the Xian (Indica). The identified anaerobic and salt tolerant accessions that have high breeding values can be used in future rice breeding for anaerobic and salinity tolerance at germination stage. Identification of tolerant accessions and the QTLs/genes in this study supports that results are useful for the ongoing and future rice breeding programs.
Data Availability Statement
The original contributions presented in the study are included in the article/Supplementary Material, further inquiries can be directed to the corresponding authors.
Author Contributions
WW and JX conceived the idea, ZL, ZW, and XZ collected the literature review. FZ, SF, and ZH provided technical expertise to strengthen the basic idea. MI, SN, and YZ recorded data. BF, YS, and SS helped in analyzing data. MI, SN, and ZL helped in initial manuscript preparation. JX and WW streamlined the idea. JX, SF, and WW proofread and provided intellectual guidance. All authors read and approved the article.
Funding
This work was supported by the National Natural Science Foundation of China (No. 31971928), the Central Public-interest Scientific Institution Basal Research Fund (S2021ZD01), the CAAS Innovative Team Award to BF and WW, the Hainan Provincial Joint Project of Sanya Yazhou Bay Science and Technology City (320LH044).
Conflict of Interest
The authors declare that the research was conducted in the absence of any commercial or financial relationships that could be construed as a potential conflict of interest.
Publisher’s Note
All claims expressed in this article are solely those of the authors and do not necessarily represent those of their affiliated organizations, or those of the publisher, the editors and the reviewers. Any product that may be evaluated in this article, or claim that may be made by its manufacturer, is not guaranteed or endorsed by the publisher.
Acknowledgments
We are thankful to Editage (https://www.editage.com/) for providing with English language editing and proofread services. Secondly, the author’s apologies for being unable to cite the scientific contribution of several researchers in present review due to limited space.
Supplementary Material
The Supplementary Material for this article can be found online at: https://www.frontiersin.org/articles/10.3389/fgene.2022.822516/full#supplementary-material
Supplementary Figure 1 | Linkage disequilibrium (LD) decay and comparison. The genome‐wide LD decay comparison between Geng, Xian, and whole populations.
Supplementary Figure 2 | Correlations between the measured traits; intensity of blue and red colors indicates positive and negative correlations, respectively.
Supplementary Figure 3 | Manhattan plot of important QTL and haplotype analysis of candidate genes. These genes are related to corresponding QTL including analysis of candidate genes done by using SAS general linear model approach ((A): qBM9a, (B): qSGr3, (C): qAGr4, (D): qCL9b, (E): qAGr9). Each point was a gene in the 200-kb region of the peak SNP of QTL. Dot line showed the threshold to determine candidate genes. The suggested significance of ANOVA at p < 0.01. The letters on histogram (a and b) show multiple comparisons result at the significant level of 0.01. The value on top of histogram was the number ofindividuals for each haplotype, and histogram length shows the mean value of these individuals for each haplotype.
Supplementary Figure 4 | Gene Ontology (GO) terms that enrich significant genes. The color indicates the degree of enrichment from red (highly enriched and significant) to white (not enriched).
Supplementary Figure 5 | Gene Ontology (GO) comparison of GO terms for biological processes is significantly associated with the traits of AGT, SGT and ASGT. The term overlap shows the four ways of constructing graphs.
References
Alexandrov, N., Tai, S., Wang, W., Mansueto, L., Palis, K., Fuentes, R. R., et al. (2015). SNP-seek Database of SNPs Derived from 3000 rice Genomes. Nucleic Acids Res. 43, D1023–D1027. doi:10.1093/nar/gku1039
Angaji, S. A., Septiningsih, E. M., Mackill, D. J., and Ismail, A. M. (2010). QTLs Associated with Tolerance of Flooding during Germination in rice (Oryza Sativa L.). Euphytica 172 (2), 159–168. doi:10.1007/s10681-009-0014-5
Baba, S. A., Vishwakarma, R. A., and Ashraf, N. (2017). Functional Characterization of CsBGlu12, a β-Glucosidase from Crocus Sativus, Provides Insights into its Role in Abiotic Stress through Accumulation of Antioxidant Flavonols. J. Biol. Chem. 292 (11), 4700–4713. doi:10.1074/jbc.M116.762161
Bradbury, P. J., Zhang, Z., Kroon, D. E., Casstevens, T. M., Ramdoss, Y., and Buckler, E. S. (2007). TASSEL: Software for Association Mapping of Complex Traits in Diverse Samples. Bioinformatics 23 (19), 2633–2635. doi:10.1093/bioinformatics/btm308
Chadchawan, S., Chokwiwatkul, R., Tantipirom, N., Khunpolwatatna, N., Imyim, A., Suriya-aroonroj, D., et al. (2017). Identification of Genes Involving in Salt Tolerance Using GWAS Data Based on Na+ Content in Local Thai rice Leaves. Genomics Genet. 10 (1&2), 27–37. doi:10.14456/gag.2017.5
Chen, Y., Li, F., Ma, Y., Chong, K., and Xu, Y. (2013). Overexpression of OrbHLH001, a Putative helix-loop-helix Transcription Factor, Causes Increased Expression of AKT1 and Maintains Ionic Balance under Salt Stress in rice. J. Plant Physiol. 170 (1), 93–100. doi:10.1016/j.jplph.2012.08.019
Cui, Y., Wang, M., Zhou, H., Li, M., Huang, L., Yin, X., et al. (2016). OsSGL, a Novel DUF1645 Domain-Containing Protein, Confers Enhanced Drought Tolerance in Transgenic rice and Arabidopsis. Front. Plant Sci. 7, 2001. doi:10.3389/fpls.2016.02001
Dalal, V. K., and Tripathy, B. C. (2012). Modulation of Chlorophyll Biosynthesis by Water Stress in rice Seedlings during Chloroplast Biogenesis*. Plant Cel Environ. 35 (9), 1685–1703. doi:10.1111/j.1365-3040.2012.02520.x
de Silva, K., Laska, B., Brown, C., Sederoff, H. W., and Khodakovskaya, M. (2011). Arabidopsis thaliana Calcium-dependent Lipid-Binding Protein (AtCLB): a Novel Repressor of Abiotic Stress Response. J. Exp. Bot. 62 (8), 2679–2689. doi:10.1093/jxb/erq468
Du, H., Liu, L., You, L., Yang, M., He, Y., Li, X., et al. (2011). Characterization of an Inositol 1,3,4-trisphosphate 5/6-kinase Gene that Is Essential for Drought and Salt Stress Responses in rice. Plant Mol. Biol. 77 (6), 547–563. doi:10.1007/s11103-011-9830-9
Flowers, T., and Yeo, A. (1995). Breeding for Salinity Resistance in Crop Plants: where Next? Funct. Plant Biol. 22 (6), 875–884. doi:10.1071/PP9950875
Ghosal, S., Quilloy, F. A., Casal, C., Septiningsih, E. M., Mendioro, M. S., and Dixit, S. (2020). Trait-based Mapping to Identify the Genetic Factors Underlying Anaerobic Germination of rice: Phenotyping, GXE, and QTL Mapping. BMC Genet. 21 (1), 6. doi:10.1186/s12863-020-0808-y
Hsu, S.-K., and Tung, C.-W. (2015). Genetic Mapping of Anaerobic Germination-Associated QTLs Controlling Coleoptile Elongation in Rice. Rice 8, 38. doi:10.1186/s12284-015-0072-3
Huang, X., Wei, X., Sang, T., Zhao, Q., Feng, Q., Zhao, Y., et al. (2010). Genome-wide Association Studies of 14 Agronomic Traits in rice Landraces. Nat. Genet. 42 (11), 961–967. doi:10.1038/ng.695
Hwang, J.-U., Song, W.-Y., Hong, D., Ko, D., Yamaoka, Y., Jang, S., et al. (2016). Plant ABC Transporters Enable many Unique Aspects of a Terrestrial Plant's Lifestyle. Mol. Plant 9 (3), 338–355. doi:10.1016/j.molp.2016.02.003
Ismail, A. M., Ella, E. S., Vergara, G. V., and Mackill, D. J. (2008). Mechanisms Associated with Tolerance to Flooding during Germination and Early Seedling Growth in rice (Oryza Sativa). Ann. Bot. 103 (2), 197–209. doi:10.1093/aob/mcn211
Jena, K. K., and Nissila, E. A. J. (2017). “Genetic Improvement of Rice (Oryza Sativa L.),” in Genetic Improvement of Tropical Crops. Ist ed. (Cham: Springer), 111–127. doi:10.1007/978-3-319-59819-2_4
Jing, Y., and Lin, R. (2015). The VQ Motif-Containing Protein Family of Plant-specific Transcriptional Regulators. Plant Physiol. 169 (1), 371–378. doi:10.1104/pp.15.00788
Judson, R., Salisbury, B., Schneider, J., Windemuth, A., and Stephens, J. C. (2002). How many SNPs Does a Genome-wide Haplotype Map Require? Pharmacogenomics 3 (3), 379–391. doi:10.1517/14622416.3.3.379
Kamoshita, A., Zhang, J., Siopongco, J., Sarkarung, S., Nguyen, H. T., and Wade, L. J. (2002). Effects of Phenotyping Environment on Identification of Quantitative Trait Loci for rice Root Morphology under Anaerobic Conditions. Crop Sci. 42, 255–265. doi:10.2135/cropsci2002.2550
Kang, H. M., Sul, J. H., Service, S. K., Zaitlen, N. A., Kong, S.-y., Freimer, N. B., et al. (2010). Variance Component Model to Account for Sample Structure in Genome-wide Association Studies. Nat. Genet. 42 (4), 348–354. doi:10.1038/ng.548
Khush, G. S. (2001). Green Revolution: the Way Forward. Nat. Rev. Genet. 2 (10), 815–822. doi:10.1038/35093585
Khush, G. S. (2005). What it Will Take to Feed 5.0 Billion rice Consumers in 2030. Plant Mol. Biol. 59 (1), 1–6. doi:10.1007/s11103-005-2159-5
Kong, D., Li, M., Dong, Z., Ji, H., and Li, X. (2015). Identification of TaWD40D, a Wheat WD40 Repeat-Containing Protein that Is Associated with Plant Tolerance to Abiotic Stresses. Plant Cel Rep 34 (3), 395–410. doi:10.1007/s00299-014-1717-1
Kretzschmar, T., Pelayo, M. A. F., Trijatmiko, K. R., Gabunada, L. F. M., Alam, R., Jimenez, R., et al. (2015). A Trehalose-6-Phosphate Phosphatase Enhances Anaerobic Germination Tolerance in rice. Nat. Plants 1 (9), 15124. doi:10.1038/nplants.2015.124
Kumar, G., Kushwaha, H. R., Panjabi-Sabharwal, V., Kumari, S., Joshi, R., Karan, R., et al. (2012). Clustered Metallothionein Genes Are Co-regulated in rice and Ectopic Expression of OsMT1e-Pconfers Multiple Abiotic Stress Tolerance in Tobacco via ROS Scavenging. BMC Plant Biol. 12 (1), 107. doi:10.1186/1471-2229-12-107
Kumar, V., and Ladha, J. K. (2011). Direct Seeding of Rice. Adv. Agron. 111, 297–413. doi:10.1016/b978-0-12-387689-8.00001-1
Kurniasih, B., Greenway, H., and Colmer, T. D. (2013). Tolerance of Submerged Germinating rice to 50-200 mMNaCl in Aerated Solution. Physiol. Plantarum 149 (2), 222–233. doi:10.1111/ppl.12029
Lee, K.-J., and Kim, K. (2015). The rice Serine/threonine Protein Kinase OsPBL1 (Oryza Sativa Arabidopsis PBS1-LIKE 1) Is Potentially Involved in Resistance to rice Stripe Disease. Plant Growth Regul. 77 (1), 67–75. doi:10.1007/s10725-015-0036-z
Liu, A.-L., Zou, J., Liu, C.-F., Zhou, X.-Y., Zhang, X.-W., Luo, G.-Y., et al. (2013). Over-expression of OsHsfA7 Enhanced Salt and Drought Tolerance in Transgenic rice. BMB Rep. 46 (1), 31–36. doi:10.5483/BMBRep.2013.46.1.090
M, A. H., A, S. J., M, B., M, M. H., Mohd, R. I., and A, S. (2010). Effect of Salt Stress on Germination and Early Seedling Growth of rice (Oryza Sativa L.). Afr. J. Biotechnol. 9 (13), 1911–1918. doi:10.5897/AJB09.1526
Manavalan, L. P., Chen, X., Clarke, J., Salmeron, J., and Nguyen, H. T. (2011). RNAi-Mediated Disruption of Squalene Synthase Improves Drought Tolerance and Yield in rice. J. Exp. Bot. 63 (1), 163–175. doi:10.1093/jxb/err258
Mishra, S., Singh, B., Panda, K., Singh, B. P., Singh, N., Misra, P., et al. (2016). Association of SNP Haplotypes of HKT Family Genes with Salt Tolerance in Indian Wild rice Germplasm. Rice 9 (1), 15. doi:10.1186/s12284-016-0083-8
Munns, R., and Tester, M. (2008). Mechanisms of Salinity Tolerance. Annu. Rev. Plant Biol. 59, 651–681. doi:10.1146/annurev.arplant.59.032607.092911
Myles, S., Peiffer, J., Brown, P. J., Ersoz, E. S., Zhang, Z., Costich, D. E., et al. (2009). Association Mapping: Critical Considerations Shift from Genotyping to Experimental Design. Plant Cell 21 (8), 2194–2202. doi:10.1105/tpc.109.068437
Naveed, S. A., Zhang, F., Zhang, J., Zheng, T.-Q., Meng, L.-J., Pang, Y.-L., et al. (2018). Identification of QTN and Candidate Genes for Salinity Tolerance at the Germination and Seedling Stages in rice by Genome-wide Association Analyses. Sci. Rep. 8, 1–11. doi:10.1038/s41598-018-24946-3
Nie, D.-M., Ouyang, Y.-D., Wang, X., Zhou, W., Hu, C.-G., and Yao, J. (2013). Genome-wide Analysis of Endosperm-specific Genes in rice. Gene 530 (2), 236–247. doi:10.1016/j.gene.2013.07.088
Niu, T. (2004). Algorithms for Inferring Haplotypes. Genet. Epidemiol. 27 (4), 334–347. doi:10.1002/gepi.20024
Obata, T., Kitamoto, H. K., Nakamura, A., Fukuda, A., and Tanaka, Y. (2007). Rice Shaker Potassium Channel OsKAT1 Confers Tolerance to Salinity Stress on Yeast and rice Cells. Plant Physiol. 144 (4), 1978–1985. doi:10.1104/pp.107.101154
Qi, W., Sun, F., Wang, Q., Chen, M., Huang, Y., Feng, Y.-Q., et al. (2011). Rice Ethylene-Response AP2/ERF Factor OsEATB Restricts Internode Elongation by Down-Regulating a Gibberellin Biosynthetic Gene. Plant Physiol. 157 (1), 216–228. doi:10.1104/pp.111.179945
Ray, S., Vijayan, J., and Sarkar, R. K. (2016). Germination Stage Oxygen Deficiency (GSOD): an Emerging Stress in the Era of Changing Trends in Climate and rice Cultivation Practice. Front. Plant Sci. 7, 671. doi:10.3389/fpls.2016.00671
Remy, E., Cabrito, T. R., Baster, P., Batista, R. A., Teixeira, M. C., Friml, J., et al. (2013). A Major Facilitator Superfamily Transporter Plays a Dual Role in Polar Auxin Transport and Drought Stress Tolerance in Arabidopsis. Plant Cell 25, 901–926. doi:10.1105/tpc.113.110353
Ren, M. Y., Feng, R. J., Shi, H. R., Lu, L. F., Yun, T. Y., Peng, M., et al. (2017). Expression Patterns of Members of the Ethylene Signaling-Related Gene Families in Response to Dehydration Stresses in Cassava. PloS one 12 (5), e0177621. doi:10.1371/journal.pone.0177621
Sharma, E., Sharma, R., Borah, P., Jain, M., and Khurana, J. P. (2015). “Emerging Roles of Auxin in Abiotic Stress Responses,” in Elucidation of Abiotic Stress Signaling in Plants (Springer), 299–328. doi:10.1007/978-1-4939-2211-6_11
Shi, Y., Gao, L., Wu, Z., Zhang, X., Wang, M., Zhang, C., et al. (2017). Genome-wide Association Study of Salt Tolerance at the Seed Germination Stage in rice. BMC Plant Biol. 17 (1), 92. doi:10.1186/s12870-017-1044-0
Shin, J.-H., Yoshimoto, K., Ohsumi, Y., Jeon, J.-s., and An, G. (2009). OsATG10b, an Autophagosome Component, Is Needed for Cell Survival against Oxidative Stresses in rice. Mol. Cell 27 (1), 67–74. doi:10.1007/s10059-009-0006-2
Tumino, G., Voorrips, R. E., Rizza, F., Badeck, F. W., Morcia, C., Ghizzoni, R., et al. (2016). Population Structure and Genome-wide Association Analysis for Frost Tolerance in Oat Using Continuous SNP Array Signal Intensity Ratios. Theor. Appl. Genet. 129 (9), 1711–1724. doi:10.1007/s00122-016-2734-y
Wang, C. C., Yu, H., Huang, J., Wang, W. S., Faruquee, M., Zhang, F., et al. (2020). Towards a Deeper Haplotype Mining of Complex Traits in rice with RFGB v2.0. Plant Biotechnol. J. 18 (1), 14–16. doi:10.1111/pbi.13215
Wang, M., Zhang, T., Peng, H., Luo, S., Tan, J., Jiang, K., et al. (2018). Rice Premature Leaf Senescence 2, Encoding a Glycosyltransferase (GT), Is Involved in Leaf Senescence. Front. Plant Sci. 9, 560. doi:10.3389/fpls.2018.00560
Wang, W., Mauleon, R., Hu, Z., Chebotarov, D., Tai, S., Wu, Z., et al. (2018). Genomic Variation in 3,010 Diverse Accessions of Asian Cultivated rice. Nature 557 (7703), 43–49. doi:10.1038/s41586-018-0063-9
You, J., and Chan, Z. (2015). ROS Regulation during Abiotic Stress Responses in Crop Plants. Front. Plant Sci. 6, 1092. doi:10.3389/fpls.2015.01092
Yu, J., and Buckler, E. S. (2006). Genetic Association Mapping and Genome Organization of maize. Curr. Opin. Biotechnol. 17, 155–160. doi:10.1016/j.copbio.2006.02.003
Zhang, H., Li, Z., Li, J., Ruan, J., Yu, H., Xu, J., et al. (2015). Rice Functional Genomics and Breeding Database (RFGB)-3K-rice SNP and InDel Sub-database. Chin. Sci. Bull. 60 (4), 367–371. doi:10.1360/N972014-01231
Zhang, J., Chen, K., Pang, Y., Naveed, S. A., Zhao, X., Wang, X., et al. (2017). QTL Mapping and Candidate Gene Analysis of Ferrous Iron and Zinc Toxicity Tolerance at Seedling Stage in rice by Genome-wide Association Study. BMC Genomics 18 (1), 828. doi:10.1186/s12864-017-4221-5
Zhang, M., Lu, Q., Wu, W., Niu, X., Wang, C., Feng, Y., et al. (2017). Association Mapping Reveals Novel Genetic Loci Contributing to Flooding Tolerance during Germination in Indica rice. Front. Plant Sci. 8, 678. doi:10.3389/fpls.2017.00678
Keywords: direct seeding, QTL mapping, salinity, anaerobic, GWAS
Citation: Islam MR, Naveed SA, Zhang Y, Li Z, Zhao X, Fiaz S, Zhang F, Wu Z, Hu Z, Fu B, Shi Y, Shah SM, Xu J and Wang W (2022) Identification of Candidate Genes for Salinity and Anaerobic Tolerance at the Germination Stage in Rice by Genome-Wide Association Analyses. Front. Genet. 13:822516. doi: 10.3389/fgene.2022.822516
Received: 25 November 2021; Accepted: 03 January 2022;
Published: 23 February 2022.
Edited by:
Muhammad Abdul Rehman Rashid, Government College University Faisalabad, PakistanReviewed by:
Dawei Xue, Hangzhou Normal University, ChinaJoong Hyoun Chin, Sejong University, South Korea
KOTB Attia, King Saud University, Saudi Arabia
Copyright © 2022 Islam, Naveed, Zhang, Li, Zhao, Fiaz, Zhang, Wu, Hu, Fu, Shi, Shah, Xu and Wang. This is an open-access article distributed under the terms of the Creative Commons Attribution License (CC BY). The use, distribution or reproduction in other forums is permitted, provided the original author(s) and the copyright owner(s) are credited and that the original publication in this journal is cited, in accordance with accepted academic practice. No use, distribution or reproduction is permitted which does not comply with these terms.
*Correspondence: Jianlong Xu, eHVqaWFubG9uZ0BjYWFzLmNu; Wensheng Wang, d2FuZ3dlbnNoZW5nMDJAY2Fhcy5jbg==
†These authors have contributed equally to this work