 Zongliang Yue
 Radomir Slominski1,2
 Samuel Bharti
 Jake Y. Chen
- 1Informatics Institute in the School of Medicine, The University of Alabama at Birmingham, Birmingham, AL, United States
- 2Graduate Biomedical Sciences Program, The University of Alabama at Birmingham, Birmingham, AL, United States
Functional genomics studies have helped researchers annotate differentially expressed gene lists, extract gene expression signatures, and identify biological pathways from omics profiling experiments conducted on biological samples. The current geneset, network, and pathway analysis (GNPA) web servers, e.g., DAVID, EnrichR, WebGestaltR, or PAGER, do not allow automated integrative functional genomic downstream analysis. In this study, we developed a new web-based interactive application, “PAGER Web APP”, which supports online R scripting of integrative GNPA. In a case study of melanoma drug resistance, we showed that the new PAGER Web APP enabled us to discover highly relevant pathways and network modules, leading to novel biological insights. We also compared PAGER Web APP’s pathway analysis results retrieved among PAGER, EnrichR, and WebGestaltR to show its advantages in integrative GNPA. The interactive online web APP is publicly accessible from the link, https://aimed-lab.shinyapps.io/PAGERwebapp/.
Introduction
Functional genomics analysis is widely performed to characterize genes and intergenic regulatory regions in the genome that contribute to different biological processes (Yang et al., 2020; Angeloni et al., 2021). Essentially, functional genomics provides a way to reveal the molecules’ coordination in mechanisms due to a specific phenotype (Raamsdonk et al., 2001; Rahaman et al., 2015). By tracking the molecular activities in the specific biological conditions, we could identify those driver and passenger genes working in a model linking genotype to phenotype. Numerous studies have shown that the molecules working in pathways could help in disease diagnosis (Zhang and Chen, 2010; Drier et al., 2013; Livshits et al., 2015; Bock and Ortea, 2020; Pian et al., 2021), cancer subtyping (Zhang and Chen, 2013; Mallavarapu et al., 2020; Lafferty et al., 2021), and personalized medicine (Chen et al., 2007; Hamburg and Collins, 2010; Raghavan et al., 2017). Additionally, multi-omics analysis provides a complex map linking transcriptomics, proteomics, and metabolomics (Subramanian et al., 2020; Andrieux and Chakraborty, 2021). In multi-omics studies, the challenges for functional genomics are the coverage of contents, the rendering of the complex network-based models, and the easy-to-use software with advanced features. Therefore integrative geneset, network, and pathway analysis (GNPA) have emerged in the past decade to lessen the burden of multi-omics data analysis users (Wu et al., 2014). Pathway analysis, especially topology-based approaches that exploit all the knowledge about how genes and proteins interact in a pathway, have been developed to discover the mechanical changes through pathway-level scoring and pathway significance assessment (Draghici et al., 2007; Mitrea et al., 2013; Nguyen et al., 2018). To better understand the impact of perturbations or genetic modifications in a system-level, System-level PAThway Impact AnaLysis using map (SPATIAL), Signaling Pathway Impact Analysis - Global Perturbation Factor (SPIA-GPF), and SPATIAL-GPF have been introduced (Bokanizad et al., 2016).
During the last decade, several GNPA web servers have been developed (Subramanian et al., 2005; Khatri et al., 2012), including DAVID (Jiao et al., 2012), EnrichR (Kuleshov et al., 2016), WebGestalt (Liao et al., 2019), and pathways, annotated gene lists and gene signatures electronic repository (PAGER) (Yue et al., 2018). The highlights of those webservers are interactive and comprehensive data coverage. The first version of the DAVID tool was published in 2003 (Dennis et al., 2003), and it is one of the earliest geneset enrichment analysis webservers. The most updated version of DAVID implements many advanced features such as gene ranking, which gives a quick focus on the most likely important candidate genes, gene with annotation in each single view, and gene extension to make functional inferences (Jiao et al., 2012). EnrichR was initially developed in 2013, and its merits come from comprehensive data coverage and interactive visualization panel (Chen et al., 2013). EnichR provides 190 libraries and adds Appyter to visualize EnrichR results in different styles (Kuleshov et al., 2016). WebGestalt was introduced in 2005 (Zhang et al., 2005), and it highlights the visualization of gene ontology hierarchy structure and pathway view of wikiPathway. WebGestaltR implemented with R language in the recent updates (Liao et al., 2019).
PAGER was initially conceived in 2014 (Harini et al., 2008) and subsequently developed in 2015 (Yue et al., 2015) with a standardized concept called “PAGs” (Pathways, Annotated gene lists, and Gene signatures) that integrates different levels of gene-sets. PAGER highlights the measurement of biological relevance using normalized Cohesion Coefficient (nCoCo) and advances the network interpretation of functional genomics results in several aspects. Additionally, PAGER introduced the computational strategies in generating m-type (co-membership) or r-type (regulatory) PAG-to-PAG relationships. PAGER also provides gene prioritization in each PAG. For the intra-PAG network construction, PAGER adopts the protein-protein interactions from the HAPPI database (Chen et al., 2017), a comprehensive and high-quality map of Human annotated and predicted protein interactions, and gene regulations validated in vitro experiment. Hence, PAGER enables gene prioritization using the network topology in each PAG (Yue et al., 2018). All four web servers support API (Application Programming Interface) services.
In this study, we developed the PAGER Web APP, an interactive online application to perform the gene set enrichment analysis and network interpretation of the functional genomics result. PAGER Web APP provides preprocessed RNA-seq data from UALCAN-processed TCGA data (Chandrashekar et al., 2017) and a melanoma drug resistant-sensitive case study (Snyder et al., 2014) from cBioPortal (Gao et al., 2013). We illustrated how the PAGER Web APP enhances the potential to discover biological insights using network-based computational strategy by comparing the enriched pathways from the three leading web servers using their application programming interfaces (APIs). We performed three additional case studies, multiple sclerosis (MS), colonic mucosa in Crohn’s disease (CD), and ulcerative colitis (UC) study, to compare the three web server performances and further validate the pathways using PubMed co-citations. We intend for PAGER Web APP to become a popular application for researchers interested in integrative GNPA.
Methods
Workflow and User Interface
We developed a four-step procedure in performing the functional genomics analysis in PAGER Web APP for Human genomics results (Figure 1). Firstly, users need to either load Demo data or upload their data. In the Demo data, PAGER Web APP provides a melanoma dataset, a multiple sclerosis dataset, a Crohn’s disease dataset, an ulcerative colitis dataset and 16 cancer types collected from UALCAN TCGA data (Chandrashekar et al., 2017). If users need to upload the data, we ask users to provide a tab-delimited.txt format file, check the log2 fold change column and p-value column, and click on the “proceed” button. Secondly, PAGER Web APP will generate a volcano plot using the gene’s log2 fold changes and colors the over-expressed candidate genes red and under-expressed candidate genes blue using the default threshold p-value ≤ 0.05 and absolute log2 fold change ≥1. PAGER Web APP allows users to adjust the log2foldchange and negative log2-based p-value to optimize the candidate gene list. Users need to click on the proceed button to the next step. Thirdly, PAGER Web APP will perform the gene-set enrichment analysis with the pathway type geneset sources (P-type PAGs) in default. Users can add or remove the source name in the source multiple-choice field. PAGER Web APP also allows users to change the minimum number of overlapped genes, similarity score, and “-log2p-value” cutoff. The similarity score is based on the combination of overlap coefficient and Jaccard index using the methods described previously (Huang et al., 2012). In the table of enriched genesets results, users can use the column “PAGER link” to navigate to the web-hosted PAGER entries of the given PAG, including the metadata, gene members, and gene networks. PAGER Web APP offers two additional leading gene set enrichment analysis tools (EnrichR and WebGestaltR) using the API service. We didn’t include DAVID due to the API failure. Lastly, PAGER Web APP summarizes the similarity of the terms and displays a Venn diagram of the overlapped terms. PAGER Web APP also provides the corresponding tables to deliver similar terms with similarity scores by comparing the three tools. All the tables and plots are downloadable.
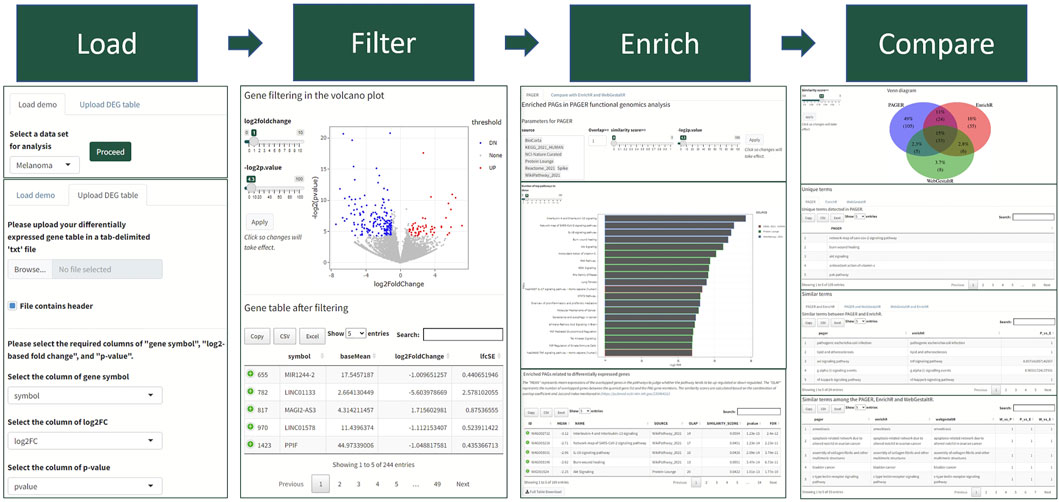
FIGURE 1. The PAGER Web APP data analysis workflow. The workflow consists of four steps with visualization panels to help biologists quickly understand the results.
Term to Term Distance-Based Similarity of Terms Enriched From the Three Tools
The term similarity is generated based on a string metric using the Stringdist library (https://cran.r-project.org/web/packages/stringdist/index.html). We clean up the terms or names by removing irrelevant content, such as species, identifier, etc., and making all the terms lower case. We also remove the redundant terms enriched from different data sources, such as “MAPK signaling pathway” may come from KEGG and wikiPathway at the same time. Then we apply the string similarity using optimal string alignment (OSA) distance (Boytsov, 2011) to generate the similarity matrix between two sets of terms, set A and set B.
Assume there are two terms regarded as two strings
The string similarity is calculated by:
where
After generating the similarity matrix between the two lists of terms, we check each row (a term from the set A) and take the highest score with the term as the most similar term. Therefore, we generate a list of pairwise term-to-term similarities. Finally, we use the default or customized similarity cutoff to filter low similar term-to-term pairs.
Apply Louvain Clustering in m-Type PAG-To-PAG Networks to Identify PAG Communities
We apply the Louvain clustering function in the igraph library in R (https://cran.r-project.org/web/packages/igraph/index.html) to find the community structure in m-type PAG-to-PAG networks. The Louvain clustering is based on the modularity in a scale between -0.5 (non-modular clustering) to 1 (fully modular clustering) described in the paper (Blondel et al., 2008).
Extract the Critical Concepts From Pathways and Show Them in Word-Clouds
We create bag-of-words from the space-separated PAG names to present the frequently appearing words in each PAG for any enriched PAG set. We create word corpus, remove the potential punctuation such as comma, colon, etc., make all the words lower case, remove both irrelevant words and common words, “pathway,” “signaling,” “human,” “homo,” “sapiens,” “has,” “or,” and “and”. Finally, we apply wordcloud2 function in the wordcloud2 library in R (https://cran.r-project.org/web/packages/wordcloud2/index.html) for the visualization.
Implementing the Software
The PAGER Web Application user interface is designed using bs4Dash (https://cran.r-project.org/web/packages/bs4Dash/index.html) package in R. The application is supported by R Shiny (https://shiny.rstudio.com/) framework. In addition to data processing and statistical analysis, GNPA Analysis are implemented using PAGER API, EnrichR API and WebGestaltR API. Graphing libraries like Plotly (https://plotly.com/r/), igraph in R (https://igraph.org/r/), ggplot2, wordcloud2, and VennDiagram have been used.
Prepare the Melanoma Drug Resistant-Sensitive Data From cBioPortal
We downloaded the melanoma dataset of 64 patient samples from cBioPortal, and it was initially published in a paper in the New England Journal of Medicine (Snyder et al., 2014). We identified a cohort from the patients who are in the metastasis stage (m1c) with Neuroblastoma RAS Viral Oncogene Homolog (NRAS gene) or/and v-Raf murine sarcoma viral oncogene homolog B (BRAF gene) mutations. Hence, we obtained three drug response patients, two drug weakly response patients and seven non-response patients. We applied the DEseq2 library in R (https://bioconductor.org/packages/release/bioc/html/DESeq2.html) to generate the differentially expressed genes that compared drug-resistant patients to drug-sensitive patients. The output file is stored in the PAGER Web APP as a demo.
Prepare the Multiple Sclerosis Data From the EMBL-EBI Database
We loaded the differentially expressed gene table, “extdata/E-GEOD-21942.topTable.RData”, preprocessed in the ROntoTools library (Ansari et al., 2016). This dataset contains a genome-wide array expression study in peripheral blood mononuclear cells (PBMC) from 12 multiple sclerosis (MS) patients and 15 controls (Kemppinen et al., 2011). We selected differentially expressed genes using adjusted p-value ≤ 0.01 (2,864 genes) and saved their fold changes as input of ROntoTools. We set the adjusted p-value ≤ 0.01 and the absolute logFC >0.5 to get the 1,470 candidate genes as the input of PAGER, EnrichR and WebGestaltR.
Prepare the Colonic Mucosa Data From the EMBL-EBI Database
We downloaded the transcription profiling by array of RNA from inflamed and non-inflamed colonic mucosa (E-MTAB-2967). In Crohn’s disease, there are 15 inflamed colonic mucosa and 15 controls. In ulcerative colitis, there are 14 inflamed colonic mucosa and 14 controls. We performed the normalization and linear regression using the limma library in R (https://bioconductor.org/packages/release/bioc/html/limma.html). We set the cutoffs of adjusted p-value ≤ 0.05 and the absolute logFC >0.5 to get the 518 candidate genes in Crohn’s disease and the 528 candidate genes in the ulcerative colitis study.
Validation of Pathways Using the Co-citations in PubMed Literature
To demonstrate the significance of the keywords in pathways related to a disease, we applied a co-citation enrichment analysis using the hypergeometric test and odds ratio. We applied the NCBI e-utils application programming interface (API) that implements semantic searches of PubMed abstracts to report biomedical literature citations (Sayers, 2008). We implied that the likelihood of observing articles co-mentioning disease names and the keywords from pathways is statistically higher than random using the PubMed score (Yue et al., 2019a). In this study, the background citations using the word “disease” denoted as
We calculated the odds ratio based on the formula
To evaluate how well the method can identify “correct” pathways, we introduced a new hybrid validation technique. It involves first defining the ground truth and subsequently developing a statistical model to assess the significance of results retrieved using a receiver operating characteristics (ROC) curve and the area-under-the-curve (AUC) value. The hybrid technique also includes performing a literature co-citation-based assessment. We constructed the ground truth using ROntoTools, the best performing method reported in the review paper (Nguyen et al., 2019), in three steps. Firstly, we took the candidate genes from the differential expression analysis using the adjusted p-value cutoff 0.05 and the absolute gene’s log fold-changes larger than or equal to 0.5. Secondly, we performed pathway enrichment analysis using the ROntoTools. Thirdly, we defined the “true” data set as the significantly enriched pathways with adjusted combined p-values ≤ 0.05 (combined p-values were generated by the function “comb.pv.func” (Kemppinen et al., 2011) in ROntoTools) and the “false” data set as the retrieved pathways with adjusted combined p-values > 0.05 but with at least one gene overlapping with the input gene list.
In the literature co-citation validation, we developed a t-test based statistical model on evaluating how significant the p-value ranked pathways can be supported by the PubMed scores. Particularly, we ranked the PAGs based on adjusted p-values, and compared the top n% PAGs’ PubMed scores to the bottom (100-n)% PAGs’ PubMed scores for each method, where n ranges from 10 to 90 with a step increment of 10. And then, we reported their average p-values, respectively. The smaller p-values are, the better performance the methods have.
Results
Comparison of Data Coverage and Features Among the Three Web Servers
Compared to EnrichR and WebGestalt, PAGER progresses the network interpretation of functional genomics results. Although there are 35 unique geneset libraries reported in most updated PAGER, which are less than EnrichR, each of PAG in PAGER contains metadata other than EnrichR and WebGestalt, including PAG-type (pathways, annotated gene lists and gene signatures), PAG descriptions, source link, publication reference, curator, and nCoCo score (described in PAGER 2.0). In addition, PAGER provides geneset intra-network views, including the protein-protein interaction network and gene-gene regulation network members in each geneset, while WebGestalt reports pathway maps in wikiPathway source only. For the geneset’s inter-network, WebGestalt inherits the Gene Ontology (GO) hieratical structure from the GO consortium. We extent the relationship concepts by introducing m-type (co-membership) PAG-to-PAG relationships and r-type (regulatory) PAG-to-PAG relationships described in PAGER. The m-type PAG-to-PAG relationships represent co-memberships between two PAGs, which reveals signaling cross-talk between PAGs that share signaling components within signal transduction pathways in response to external stimuli. The r-type PAG-to-PAG relationships represent the PAG causal ordering inferred from gene-to-gene regulations by adapting our method previously described in PAGER (Yue et al., 2018). The PAGER Web APP fulfills all the additional features in Table 1, such as term searching and API service.
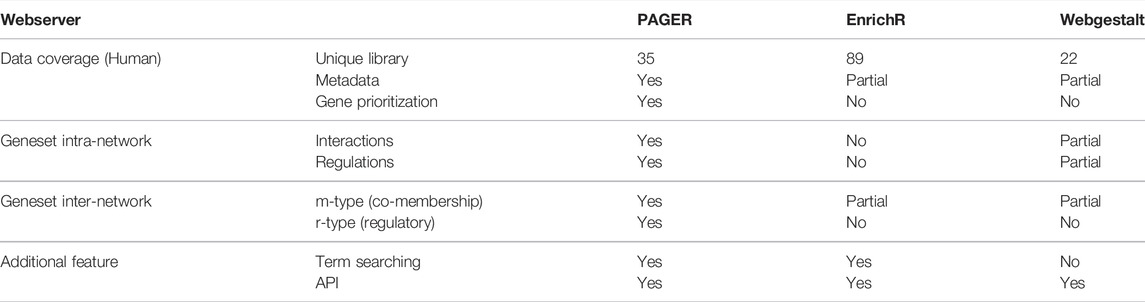
TABLE 1. A comparison of data coverage and features among PAGER, EnrichR, and WebGestalt web servers.
Melanoma Drug Resistant-Sensitive Patients Enriched Pathway Case Study in Demo
To better identify the cohorts in melanoma cancer to improve the treatment, functional genomics has been applied to the next-generation sequencing data for an in-depth understanding of the molecular mechanisms in the drug resistance cases. We collected the transcriptomes from the cBioPortal database in this study. In the result, we found 164 P-type PAGs (pathways) to be significantly enriched.
In the 164 P-type PAGs, they are two PAGs that are derived from more than one data source, i.e., “PI3K-Akt signaling pathway” and “Bladder cancer”, each of which is simultaneously recorded in both “WikiPathway_2021” and “KEGG_2021_HUMAN” data sources. Compared to the results from EnrichR and WebGestaltR, PAGER had the greatest number of enriched pathways, which is 164, EnrichR has 98, and WebGestaltR has 52 (Figure 2A). PAGER also had the greatest number of unique pathways, which is 101 (48%). We found 33 (16%) overlapped pathways among the three tools. In addition, 23 (11%) pathways were shared between PAGER and EnrichR, 5 (2.4%) pathways were shared between PAGER and WebGestaltR, and 6 (2.8%) pathways were shared between EnrichR and WebgestaltR.
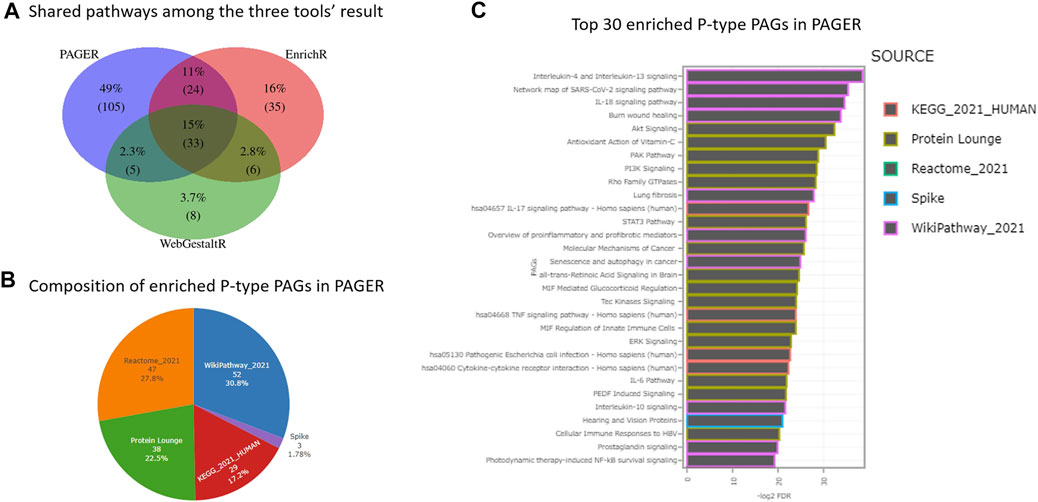
FIGURE 2. The enriched pathway results for melanoma drug resistant-sensitive patients. (A) The consensus pathways among PAGER, EnrichR and WebGestaltR results. (B) The composition of P-type PAGs enriched in PAGER. (C) The top-30 enriched P-type PAGs are ordered by FDR in PAGER.
In the 164 P-type PAGs reported by PAGER, there were 4 major sources and 1 minor source (Figure 2B). 50 (30.5%) are from wikiPathway, 46 (28%) are from Reactome, 37 (22.6%) are from Protein Lounge, 28 (17.1%) are from KEGG, and 3 (1.83%) are from Spike. We showed the top-30 enriched P-type PAGs colored by the sources in the horizontal bar-plot in Figure 2C, and the details of the enriched PAGs are in Supplementary Table S1.
Critical Terms Extraction From the Louvain Clustered PAGs in the m-Type PAG-To-PAG Networks
The 164 P-type PAGs form a densely connected m-type PAG-to-PAG network (2,749 m-type PAG-to-PAG relationships) with an average degree of 18. After the community detection using Louvain clustering, we found 5 PAG clusters in the m-type PAG-to-PAG network (Figure 3). The extracted concepts reveal the general pathway functions in the clusters. Cluster 1 consists of 3 pathways with represented terms “FAM20C” protein (Golgi-associated secretory pathway kinase), “IGF” protein (insulin-like growth factor). Cluster 2 has 7 pathways related to the Gi-activating and ligand-receptor bindings. Cluster 3 is formed by 43 pathways related to collagen formation and binding events. Cluster 4 has 37 pathways related to inflammasome responses in cancer or infection. Cluster 5 contains 66 pathways with the regulation of several inflammatory and cytokine responses through the receptor interactions. Hence, PAGER Web APP enables screening for the critical terms and quickly identifying the specific molecular mechanism communities in the m-type PAG-to-PAG network.
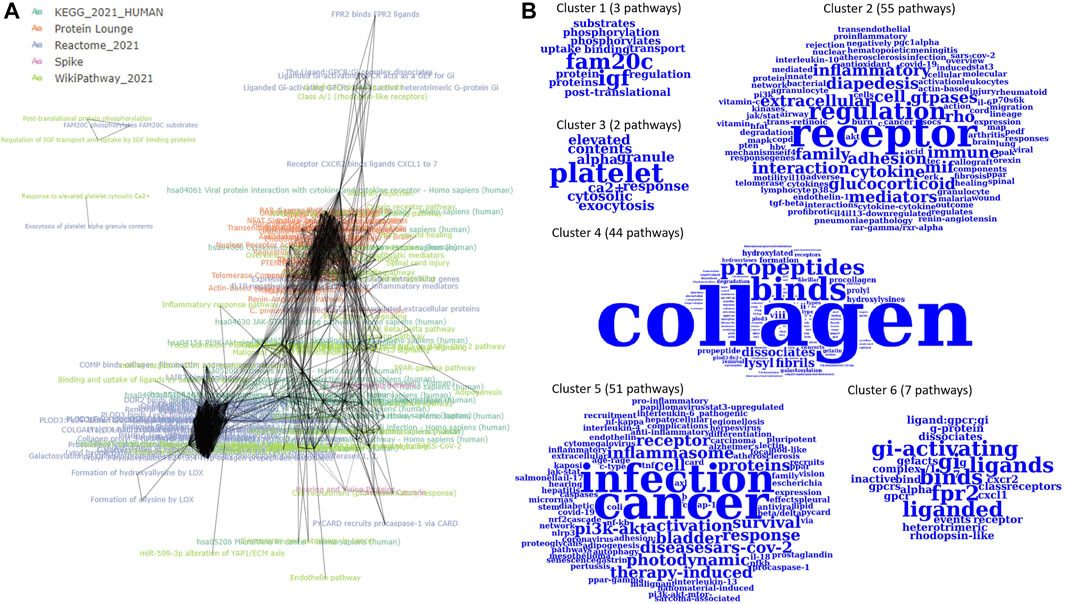
FIGURE 3. The m-type PAG-to-PAG network of enriched P-type PAGs in PAGER for melanoma drug resistant-sensitive patients. (A) The m-type PAG-to-PAG network overview and (B) The extracted word clouds from the Louvain clusters in the network.
Validation of the Enriched Pathways Using Literature Support in the Melanoma Drug Resistant-Sensitive Study
We found all of them relevant to melanoma cancer for the 33 consensus pathways among PAGER, EnrichR, and WebGestaltR results. We listed the results using pathway name, the pairwise term similarities, keywords used for co-citation retrieval, number of co-citations, odds ratio, PubMed score, one of PubMed IDs, and BEERE validation (in Table 2; Supplementary Table S2). All the pathways were determined to be related to Melanoma with PubMed literature support. For the 23 consensus pathways between PAGER and EnrichR results, we found that all of them have at least one literature support (Table 3). We showed all the BEERE-identified semantic relationships in Supplementary Table S3. We found that all the 5 consensus pathways between PAGER and WebGestaltR results to be supported by PubMed literature citations, and we ranked them based on the PubMed score (Table 4; Supplementary Table S4). Each of the six consensus pathways between EnrichR and WebGestaltR also had at least one literature citation support (Supplementary Table S5).
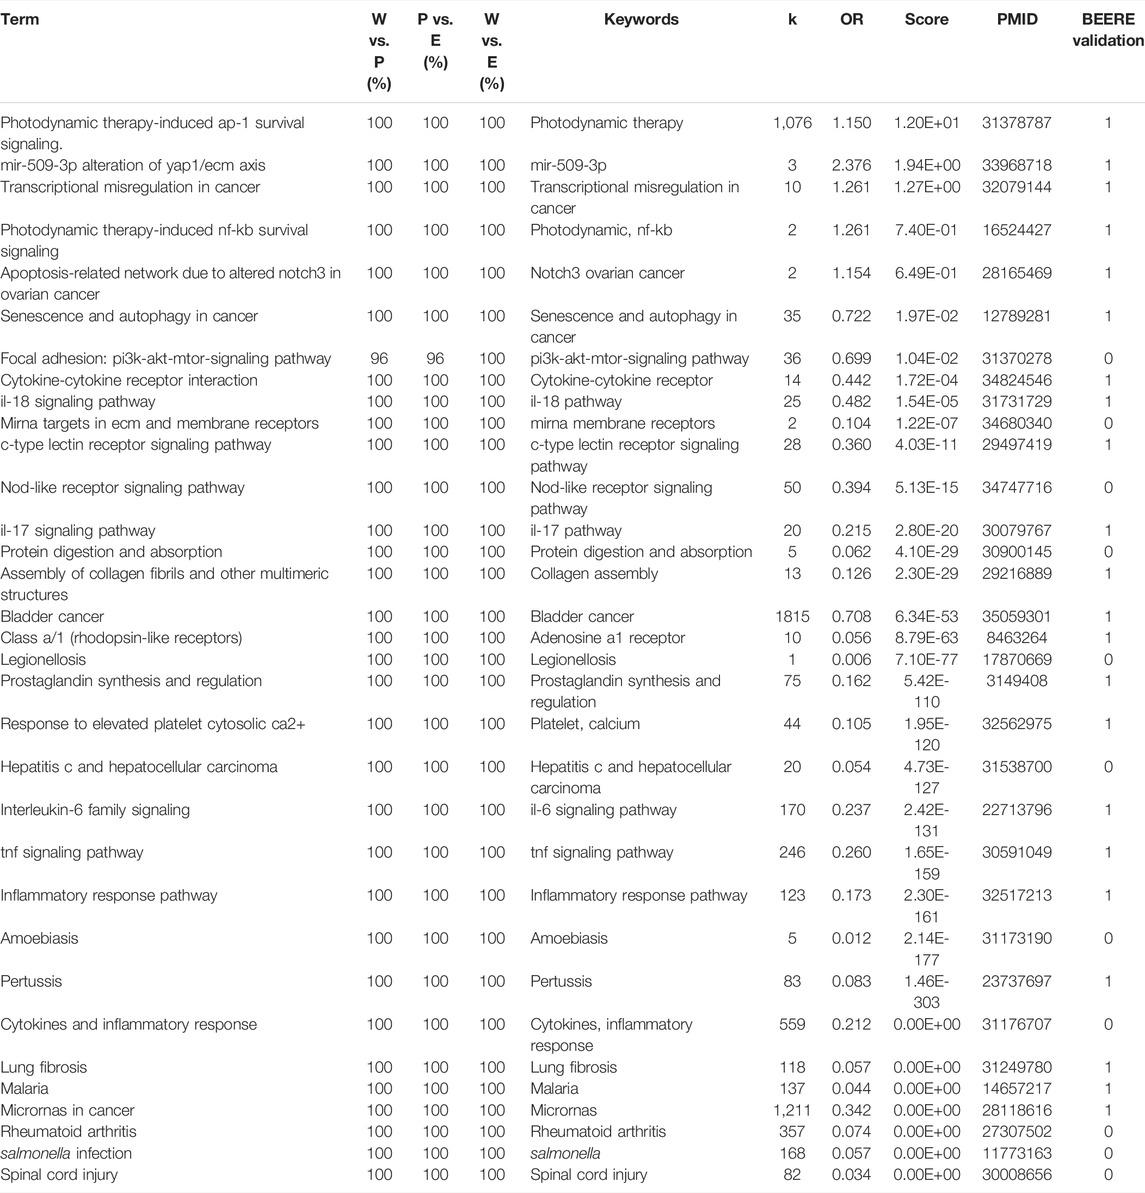
TABLE 2. The 33 consensus pathways among PAGER, EnrichR, and WebGestaltR results with PubMed literature support. W vs. P represents the term similarities between WebGestaltR and PAGER results. P vs. E represents the term similarities between PAGER and EnrichR results. W vs. E represents the term similarities between WebGestaltR and EnrichR.
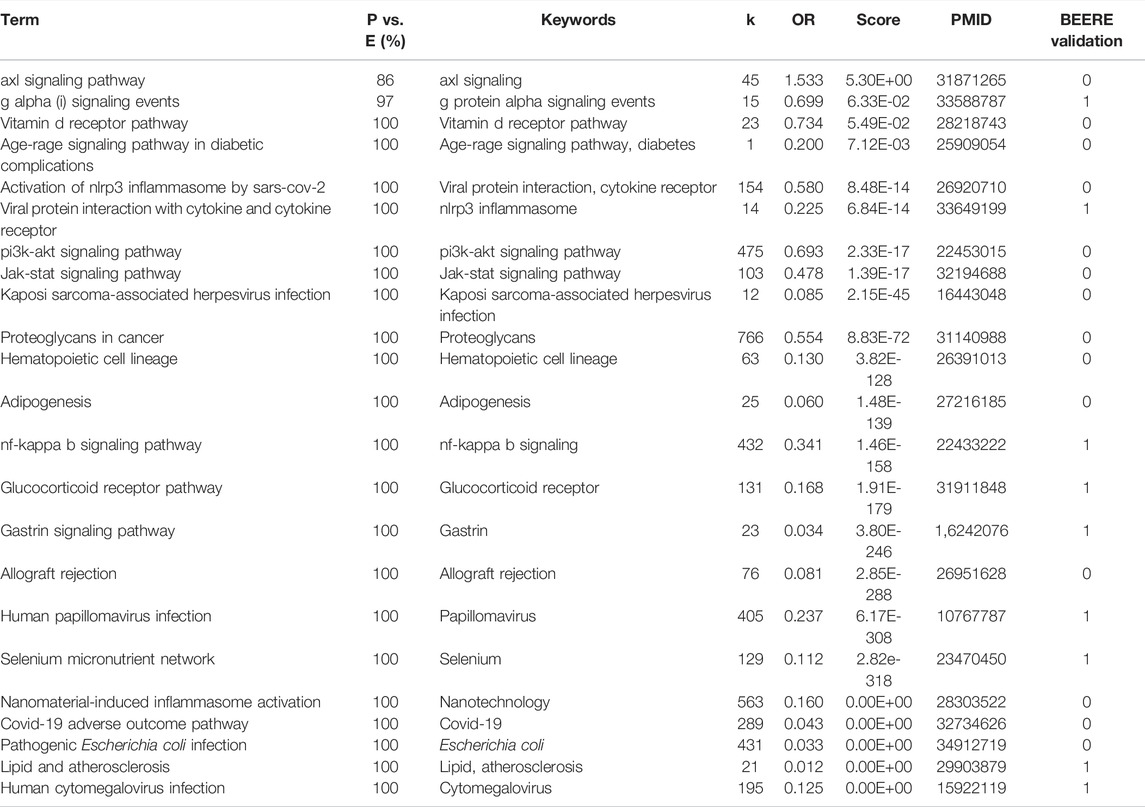
TABLE 3. The 23 consensus pathways between PAGER, EnrichR results with PubMed literature support.
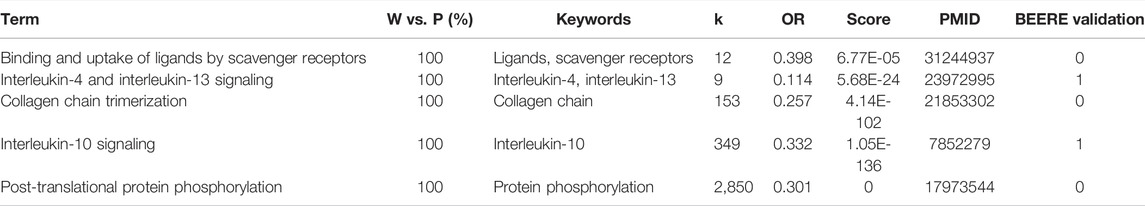
TABLE 4. The 5 consensus pathways between PAGER, WebGestaltR results with PubMed literature support.
We ranked the pathways based on the
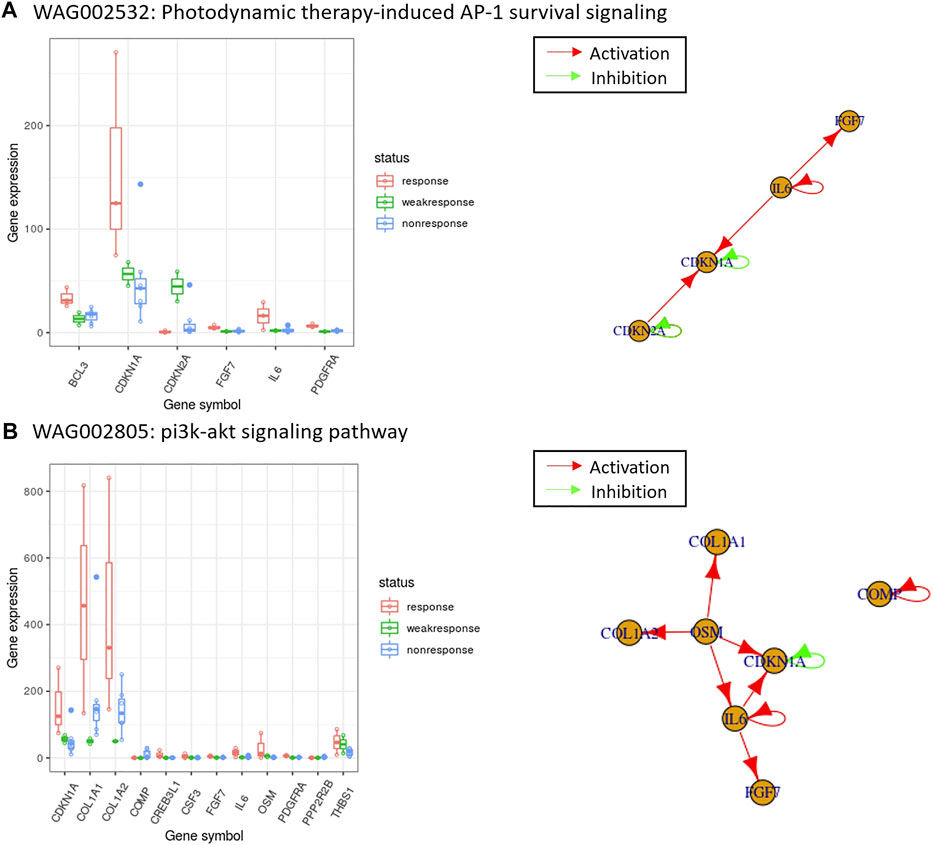
FIGURE 4. The top-ranked enriched pathways using the PubMed score and the expression of those overlapped genes with gene regulatory networks for melanoma drug resistant-sensitive patients. In the box plots, the x-axis are the overlapped genes between differentially expressed gene candidates and pathway gene members, and the y-axis are the gene expression values. In the gene regulatory networks, a red arrow indicates the direction of activation, and a green arrow indicates the direction of inhibition. WAG002532 and WAG002805 are the PAG IDs of the enriched pathways shown in (A) The pathway with the highest PubMed score in Table 2, and (B) one of the PubMed literature validated pathways in Table 3. The details of pathways shown can be retrieved online from: http://discovery.informatics.uab.edu/PAGER/index.php/geneset/view/[PAG ID].
Another intriguing pathway, the interleukin 10 (IL-10) signaling pathway, reported in PAGER also shows how literature supports its involvement in melanoma. IL-10’s role in immune system biology is that it acts as an immunomodulator, which means that it regulates how the immune system behaves (Terai et al., 2012). Terai et al. found that metastatic melanoma cells can produce IL-10 and that this product can prevent the immune cells from attacking it (Terai et al., 2012). The group also found that IL-6 may play a role in the stimulation of IL-10 production in melanoma cells (Terai et al., 2012). Thus, the PAGER analysis can help give hints to researchers as far as finding potential disease mechanisms is concerned.
We applied precision to measure the performance among the three tools using different cutoffs (Table 5). To evaluate the co-citation coverage in the literature, we tested the result’s precision using different cutoffs. When we set the co-citation (
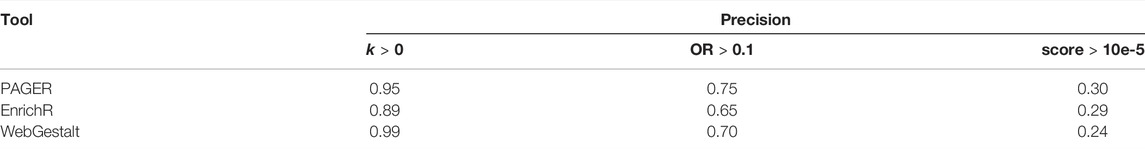
TABLE 5. The performance of the three tools.
Validation of the Enriched Pathways Using the Topology-Based Method and Literature Support in Multiple Sclerosis (MS), Colonic Mucosa in Crohn’s Disease (CD), and Ulcerative Colitis (UC) Studies
In the sclerosis study, we found 20 pathways in the true set and 203 pathways in the false set using ground truth discovered by the topology-based method, ROntoTools (Figure 5A). The PAGER led by giving the AUC 0.88, EnrichR came the next with AUC to be 0.87, and the WebGestaltR’s AUC was 0.77. In the t-test curve, We found PAGER had the lowest average p-value (0.318) compared with ROntoTools (0.319), EnrichR (0.319) and WebgestaltR (0.319). In the inflamed colonic mucosa vs. non-inflamed colonic mucosa in Crohn’s disease study (Figure 5B), we found 40 pathways in the true set and 161 pathways in the false set. Both EnrichR and PAGER had the highest AUC of 0.98, and the WebGestaltR’s AUC was 0.87. We found EnrichR had the lowest average p-value (0.316) compared with ROntoTools (0.317), PAGER (0.322) and WebgestaltR (0.322). In the inflamed colonic mucosa vs. non-inflamed colonic mucosa in the ulcerative colitis study (Figure 5C), we found 6 pathways in the true set and 199 pathways in the false set. The EnrichR had the highest AUC of 0.99, PAGER came the next with AUC to be 0.98, and the WebGestaltR’s AUC was 0.85. We found PAGER and EnrichR tied with the lowest average p-value (0.317) compared with ROntoTools (0.321) and WebgestaltR (0.322). Overall, PAGER was among the best.
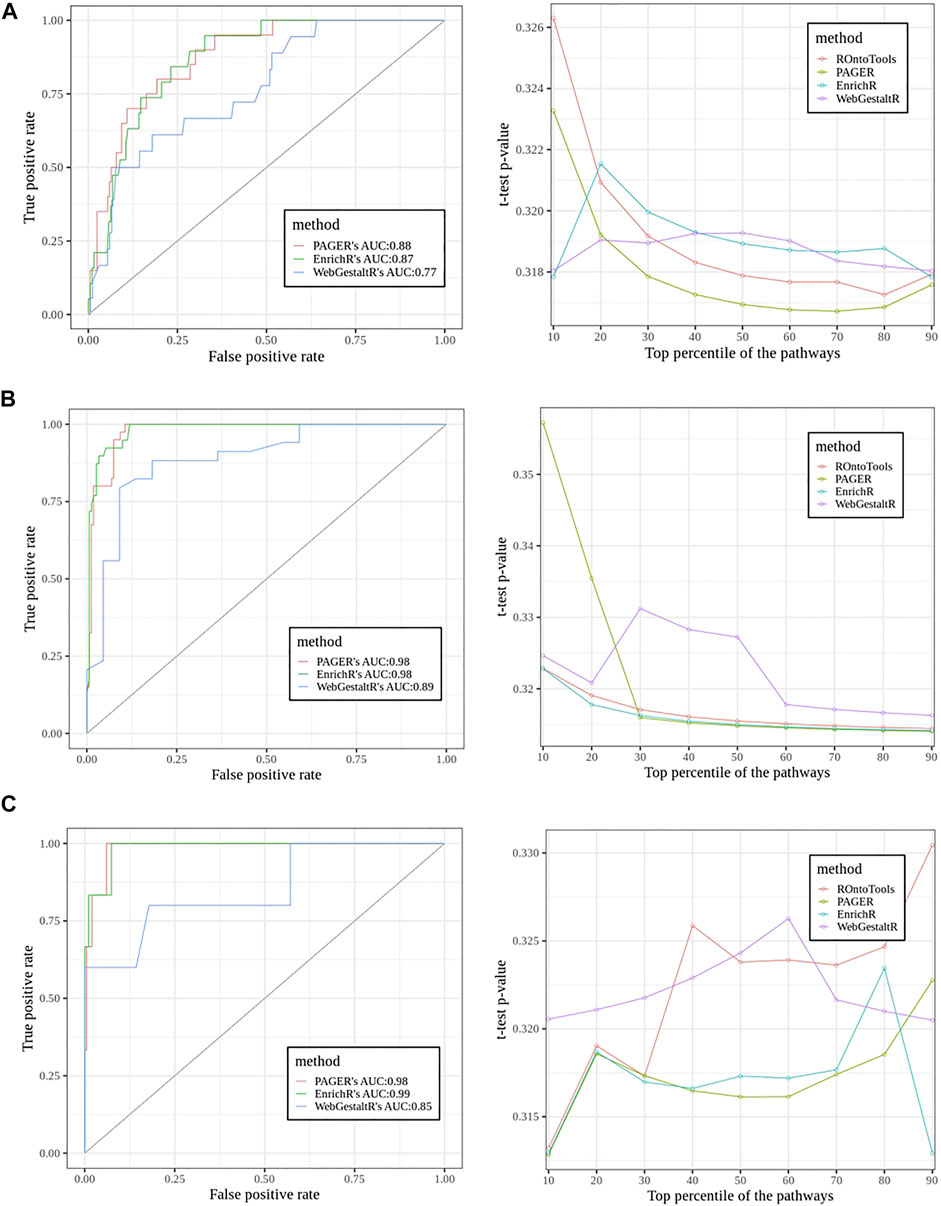
FIGURE 5. The performance comparisons among PAGER, EnrichrR and WebGestaltR using Receiver Operator Characteristic (ROC) curve and the t-test curve. The pathways’ adjusted p-values were applied to generate the ROC curves. The PubMed scores were used for the t-test curve. (A) The sclerosis study (E-GEOD-21942). (B) The inflamed colonic mucosa vs. non-inflamed colonic mucosa in Crohn’s disease study. (C) The inflamed colonic mucosa vs. non-inflamed colonic mucosa in the ulcerative colitis study.
Discussion and Conclusion
To summarize, we developed an interactive online functional genomics analysis tool, PAGER Web APP. The tool can provide new and significant insights into functional genomics studies and may support precision medicine in delivering the candidate targets. In the melanoma drug-resistant-sensitive case study, we observed that the P-type PAGs (pathways) reported in PAGER lead to insights into molecular mechanisms validated in literature support. PAGER web server supports the feature of r-type PAG-to-PAG network generation.
There are two potential explanations for the differences in the enrichment results among the three tools. First, we noticed that the database versions might vary. As reported in the EnrichR and PAGER Web APP, the KEGG data was processed in 2021, and the WebgestaltR’s KEGG data was processed in 2018. Newer database processing time may suggest more freshly updated content of databases—variability that we couldn’t control in this case study. Second, the enrichment algorithms used in these three tools are different. PAGER adapts hypergeometric test to perform the enrichment analysis and applies adjusted p-value using
In the future, we expect to implement features to enhance the usage of PAGER Web APP, which can be plugged in geneset, network, and pathway analysis (GNPA) to improve the use. In the current version, we observed that the user interface, especially, in the enriched results, the enriched PAGs’ result is not that interactive enough for users to select a certain number of PAGs or arbitrarily remove some of the records to generate PAG-to-PAG networks. We will implement the interactive panels in the future release. PAGER Web APP calls the PAGER API, which implements an over-representation analysis (ORA) technique by default. In general, advanced functional class scoring (FCS) techniques, e.g., Gene Set Enrichment Analysis (GSEA) (Subramanian et al., 2005), Gene Set Analysis (GSA) (Efron and Tibshirani, 2007) and Pathway Analysis with Down-weighting of Overlapping Genes (PADOG) (Tarca et al., 2012), can better detect the significant effects on pathways led by large changes in individual genes and the weaker coordinated. Other pathway analysis tools may also incorporate network topology information to integrate signaling interactions among genes in a pathway, e.g., Pathway-Express (Khatri et al., 2007), SPIA (Tarca et al., 2009), Pathway-Guide (Advaita Bioinformatics, http://www.advaitabio.com), TopoGSA (Glaab et al., 2010), Bayesian Pathway Analysis (BPA) (Isci et al., 2011), and PathNet (Dutta et al., 2012), etc. We plan to implement additional advanced topology-based pathway GSEA analysis techniques into the PAGER APIs, and adopt comprehensive benchmark data sets (Tarca et al., 2012; Tarca et al., 2013; Nguyen et al., 2019) to guide users in selecting the proper method for the right application scenario in future releases. Thus, PAGER Web APP will offer users more expanded analysis choices than today.
Data Availability Statement
The original contributions presented in the study are included in the article/Supplementary Material, further inquiries can be directed to the corresponding author.
Author Contributions
ZY developed the PAGER Web APP, processed the melanoma data, performed all the case studies, and wrote the manuscript. RS processed the melanoma data, performed the literature validation of the results. SB helped in the framework design and processed the multiple sclerosis, Crohn’s disease and ulcerative colitis case studies. JC conceptualized the ideas, helped design the analytical experiments, provided feedback throughout the project, and revised the final manuscript. All authors read, edited, and approved the manuscript.
Funding
The work was in part supported by the internal University of Alabama at Birmingham research grants to JC and the National Institutes of Health grant awards U54TR001005 in which JC serves as a co-investigator.
Conflict of Interest
The authors declare that the research was conducted in the absence of any commercial or financial relationships that could be construed as a potential conflict of interest.
Publisher’s Note
All claims expressed in this article are solely those of the authors and do not necessarily represent those of their affiliated organizations, or those of the publisher, the editors and the reviewers. Any product that may be evaluated in this article, or claim that may be made by its manufacturer, is not guaranteed or endorsed by the publisher.
Acknowledgments
All authors thank the following general technical support that made case studies included for this work possible: Saghapour Ehsan for testing the PAGER Web APP and providing suggestions. Nishant Batra for testing scripts in the project. Jelai Wang for managing the data management and data analysis computing framework. Hiren Desai from UAB Information Technology groups for supporting the backend Oracle database 19c management.
Supplementary Material
The Supplementary Material for this article can be found online at: https://www.frontiersin.org/articles/10.3389/fgene.2022.820361/full#supplementary-material
References
Abramova, O. B., Kaplan, M. A., Grin, M. A., Yuzhakov, V. V., Suvorov, N. V., Mironov, A. F., et al. (2021). Photodynamic Therapy of Melanoma B16 with Chlorin E6 Conjugated with a PSMA-Ligand. Bull. Exp. Biol. Med. 171, 468–471. doi:10.1007/s10517-021-05252-x
Andrieux, G., and Chakraborty, S. (2021). Editorial: Integration of Multi-Omics Techniques in Cancer. Front. Genet. 12, 733965. doi:10.3389/fgene.2021.733965
Angeloni, M., Thievessen, I., Engel, F. B., Magni, P., and Ferrazzi, F. (2021). Functional Genomics Meta-Analysis to Identify Gene Set Enrichment Networks in Cardiac Hypertrophy. Biol. Chem. 402, 953–972. doi:10.1515/hsz-2020-0378
Ansari, S., Voichita, C., Donato, M., Tagett, R., and Draghici, S. (2016). A Novel Pathway Analysis Approach Based on the Unexplained Disregulation of Genes. Proc. IEEE 105, 1–14. doi:10.1109/JPROC.2016.2531000
Blondel, V. D., Guillaume, J.-L., Lambiotte, R., and Lefebvre, E. (2008). Fast Unfolding of Communities in Large Networks. J. Stat. Mech. 2008, P10008. doi:10.1088/1742-5468/2008/10/p10008
Bock, J.-O., and Ortea, I. (2020). Re-analysis of SARS-CoV-2-Infected Host Cell Proteomics Time-Course Data by Impact Pathway Analysis and Network Analysis: a Potential Link with Inflammatory Response. Aging 12, 11277–11286. doi:10.18632/aging.103524
Bokanizad, B., Tagett, R., Ansari, S., Helmi, B. H., and Draghici, S. (2016). SPATIAL: A System-Level PAThway Impact AnaLysis Approach. Nucleic Acids Res. 44, 5034–5044. doi:10.1093/nar/gkw429
Boytsov, L. (2011). Indexing Methods for Approximate Dictionary Searching: Comparative Analysis. ACM J. Exp. Algorithmics 16, 1–91. Article 1.1. doi:10.1145/1963190.1963191
Chandrashekar, D. S., Bashel, B., Balasubramanya, S. A. H., Creighton, C. J., Ponce-Rodriguez, I., Chakravarthi, B. V. S. K., et al. (2017). UALCAN: A Portal for Facilitating Tumor Subgroup Gene Expression and Survival Analyses. Neoplasia 19, 649–658. doi:10.1016/j.neo.2017.05.002
Chen, J. Y., Yan, Z., Shen, C., Fitzpatrick, D. P. G., and Wang, M. (2007). A Systems Biology Approach to the Study of Cisplatin Drug Resistance in Ovarian Cancers. J. Bioinform. Comput. Biol. 05, 383–405. doi:10.1142/s0219720007002606
Chen, E. Y., Tan, C. M., Kou, Y., Duan, Q., Wang, Z., Meirelles, G. V., et al. (2013). Enrichr: Interactive and Collaborative HTML5 Gene List Enrichment Analysis Tool. BMC Bioinformatics 14, 128. doi:10.1186/1471-2105-14-128
Chen, J. Y., Pandey, R., and Nguyen, T. M. (2017). HAPPI-2: a Comprehensive and High-Quality Map of Human Annotated and Predicted Protein Interactions. BMC Genomics 18, 182. doi:10.1186/s12864-017-3512-1
de Waal Malefyt, R., Haanen, J., Spits, H., Roncarolo, M. G., te Velde, A., Figdor, C., et al. (1991). Interleukin 10 (IL-10) and Viral IL-10 Strongly Reduce Antigen-specific Human T Cell Proliferation by Diminishing the Antigen-Presenting Capacity of Monocytes via Downregulation of Class II Major Histocompatibility Complex Expression. J. Exp. Med. 174, 915–924. doi:10.1084/jem.174.4.915
Dennis, G., Sherman, B. T., Hosack, D. A., Yang, J., Gao, W., Lane, H. C., et al. (2003). DAVID: Database for Annotation, Visualization, and Integrated Discovery. Genome Biol. 4, P3. doi:10.1186/gb-2003-4-5-p3
Draghici, S., Khatri, P., Tarca, A. L., Amin, K., Done, A., Voichita, C., et al. (2007). A Systems Biology Approach for Pathway Level Analysis. Genome Res. 17, 1537–1545. doi:10.1101/gr.6202607
Drier, Y., Sheffer, M., and Domany, E. (2013). Pathway-based Personalized Analysis of Cancer. Proc. Natl. Acad. Sci. U.S.A. 110, 6388–6393. doi:10.1073/pnas.1219651110
Dutta, B., Wallqvist, A., and Reifman, J. (2012). PathNet: a Tool for Pathway Analysis Using Topological Information. Source Code Biol. Med. 7, 10. doi:10.1186/1751-0473-7-10
Efron, B., and Tibshirani, R. (2007). On Testing the Significance of Sets of Genes. Ann. Appl. Stat. 1, 107–129. doi:10.1214/07-aoas101
Gao, J., Aksoy, B. A., Dogrusoz, U., Dresdner, G., Gross, B., Sumer, S. O., et al. (2013). Integrative Analysis of Complex Cancer Genomics and Clinical Profiles Using the cBioPortal. Sci. Signal. 6, pl1. doi:10.1126/scisignal.2004088
Glaab, E., Baudot, A., Krasnogor, N., and Valencia, A. (2010). TopoGSA: Network Topological Gene Set Analysis. Bioinformatics 26, 1271–1272. doi:10.1093/bioinformatics/btq131
Hamburg, M. A., and Collins, F. S. (2010). The Path to Personalized Medicine. N. Engl. J. Med. 363, 301–304. doi:10.1056/NEJMp1006304
Harini, N. K., Xiaogang, W., and Jake Yue, C. (2008). “Towards an Integrative Human Pathway Database for Systems Biology Applications,” in Proceedings of the 2008 ACM symposium on Applied computing, Fortaleza, Ceara, Brazil, March, 2008 (ACM), 1297–1301.
Huang, H., Wu, X., Sonachalam, M., Mandape, S. N., Pandey, R., MacDorman, K. F., et al. (2012). PAGED: a Pathway and Gene-Set Enrichment Database to Enable Molecular Phenotype Discoveries. BMC Bioinformatics 13 (Suppl. 15), S2. doi:10.1186/1471-2105-13-S15-S2
Isci, S., Ozturk, C., Jones, J., and Otu, H. H. (2011). Pathway Analysis of High-Throughput Biological Data within a Bayesian Network Framework. Bioinformatics 27, 1667–1674. doi:10.1093/bioinformatics/btr269
Jiao, X., Sherman, B. T., Huang, D. W., Stephens, R., Baseler, M. W., Lane, H. C., et al. (2012). DAVID-WS: a Stateful Web Service to Facilitate Gene/protein List Analysis. Bioinformatics 28, 1805–1806. doi:10.1093/bioinformatics/bts251
Kemppinen, A. K., Kaprio, J., Palotie, A., and Saarela, J. (2011). Systematic Review of Genome-wide Expression Studies in Multiple Sclerosis. BMJ Open 1, e000053. doi:10.1136/bmjopen-2011-000053
Khatri, P., Draghici, S., Tarca, A. L., Hassan, S. S., and Romero, R. (2007). “A System Biology Approach for the Steady-State Analysis of Gene Signaling Networks,” in Iberoamerican Congress on Pattern Recognition, Valparaiso, Chile, November 13–16, 2007, 32–41.
Khatri, P., Sirota, M., and Butte, A. J. (2012). Ten Years of Pathway Analysis: Current Approaches and Outstanding Challenges. Plos Comput. Biol. 8, e1002375. doi:10.1371/journal.pcbi.1002375
Kuleshov, M. V., Jones, M. R., Rouillard, A. D., Fernandez, N. F., Duan, Q., Wang, Z., et al. (2016). Enrichr: a Comprehensive Gene Set Enrichment Analysis Web Server 2016 Update. Nucleic Acids Res. 44, W90–W97. doi:10.1093/nar/gkw377
Lacreusette, A., Nguyen, J.-M., Pandolfino, M.-C., Khammari, A., Dreno, B., Jacques, Y., et al. (2007). Loss of Oncostatin M Receptor β in Metastatic Melanoma Cells. Oncogene 26, 881–892. doi:10.1038/sj.onc.1209844
Lafferty, A., O'Farrell, A. C., Migliardi, G., Khemka, N., Lindner, A. U., Sassi, F., et al. (2021). Molecular Subtyping Combined with Biological Pathway Analyses to Study Regorafenib Response in Clinically Relevant Mouse Models of Colorectal Cancer. Clin. Cancer Res. 27, 5979–5992. doi:10.1158/1078-0432.CCR-21-0818
Liao, Y., Wang, J., Jaehnig, E. J., Shi, Z., and Zhang, B. (2019). WebGestalt 2019: Gene Set Analysis Toolkit with Revamped UIs and APIs. Nucleic Acids Res. 47, W199–W205. doi:10.1093/nar/gkz401
Livshits, A., Git, A., Fuks, G., Caldas, C., and Domany, E. (2015). Pathway-Based Personalized Analysis of Breast Cancer Expression Data. Mol. Oncol. 9, 1471–1483. doi:10.1016/j.molonc.2015.04.006
Mallavarapu, T., Hao, J., Kim, Y., Oh, J. H., and Kang, M. (2020). Pathway-Based Deep Clustering for Molecular Subtyping of Cancer. Methods 173, 24–31. doi:10.1016/j.ymeth.2019.06.017
Mitrea, C., Taghavi, Z., Bokanizad, B., Hanoudi, S., Tagett, R., Donato, M., et al. (2013). Methods and Approaches in the Topology-Based Analysis of Biological Pathways. Front. Physiol. 4, 278. doi:10.3389/fphys.2013.00278
Nguyen, T., Mitrea, C., and Draghici, S. (2018). Network-Based Approaches for Pathway Level Analysis. Curr. Protoc. Bioinformatics 61, 1–8. doi:10.1002/cpbi.42
Nguyen, T.-M., Shafi, A., Nguyen, T., and Draghici, S. (2019). Identifying Significantly Impacted Pathways: a Comprehensive Review and Assessment. Genome Biol. 20, 203. doi:10.1186/s13059-019-1790-4
Pian, C., He, M., and Chen, Y. (2021). Pathway-Based Personalized Analysis of Pan-Cancer Transcriptomic Data. Biomedicines 9, 1502. doi:10.3390/biomedicines9111502
Raamsdonk, L. M., Teusink, B., Broadhurst, D., Zhang, N., Hayes, A., Walsh, M. C., et al. (2001). A Functional Genomics Strategy that Uses Metabolome Data to Reveal the Phenotype of Silent Mutations. Nat. Biotechnol. 19, 45–50. doi:10.1038/83496
Raghavan, S., Mehta, P., Ward, M. R., Bregenzer, M. E., Fleck, E. M. A., Tan, L., et al. (2017). Personalized Medicine-Based Approach to Model Patterns of Chemoresistance and Tumor Recurrence Using Ovarian Cancer Stem Cell Spheroids. Clin. Cancer Res. 23, 6934–6945. doi:10.1158/1078-0432.CCR-17-0133
Rahaman, M. M., Chen, D., Gillani, Z., Klukas, C., and Chen, M. (2015). Advanced Phenotyping and Phenotype Data Analysis for the Study of Plant Growth and Development. Front. Plant Sci. 6, 619. doi:10.3389/fpls.2015.00619
Shivashankarappa, A., and Sanjay, K. R. (2019). Photodynamic Therapy on Skin Melanoma and Epidermoid Carcinoma Cells Using Conjugated 5-aminolevulinic Acid with Microbial Synthesised Silver Nanoparticles. J. Drug Target. 27, 434–441. doi:10.1080/1061186X.2018.1531418
Snyder, A., Makarov, V., Merghoub, T., Yuan, J., Zaretsky, J. M., Desrichard, A., et al. (2014). Genetic Basis for Clinical Response to CTLA-4 Blockade in Melanoma. N. Engl. J. Med. 371, 2189–2199. doi:10.1056/NEJMoa1406498
Subramanian, A., Tamayo, P., Mootha, V. K., Mukherjee, S., Ebert, B. L., Gillette, M. A., et al. (2005). Gene Set Enrichment Analysis: a Knowledge-Based Approach for Interpreting Genome-wide Expression Profiles. Proc. Natl. Acad. Sci. U.S.A. 102, 15545–15550. doi:10.1073/pnas.0506580102
Subramanian, I., Verma, S., Kumar, S., Jere, A., and Anamika, K. (2020). Multi-omics Data Integration, Interpretation, and its Application. Bioinform Biol. Insights 14, 117793221989905. doi:10.1177/1177932219899051
Tarca, A. L., Draghici, S., Khatri, P., Hassan, S. S., Mittal, P., Kim, J.-s., et al. (2009). A Novel Signaling Pathway Impact Analysis. Bioinformatics 25, 75–82. doi:10.1093/bioinformatics/btn577
Tarca, A. L., Draghici, S., Bhatti, G., and Romero, R. (2012). Down-weighting Overlapping Genes Improves Gene Set Analysis. BMC Bioinformatics 13, 136. doi:10.1186/1471-2105-13-136
Tarca, A. L., Bhatti, G., and Romero, R. (2013). A Comparison of Gene Set Analysis Methods in Terms of Sensitivity, Prioritization and Specificity. PLoS One 8, e79217. doi:10.1371/journal.pone.0079217
Terai, M., Eto, M., Young, G. D., Berd, D., Mastrangelo, M. J., Tamura, Y., et al. (2012). Interleukin 6 Mediates Production of Interleukin 10 in Metastatic Melanoma. Cancer Immunol. Immunother. 61, 145–155. doi:10.1007/s00262-011-1084-5
Turkoglu, E. B., Pointdujour-Lim, R., Mashayekhi, A., and Shields, C. L. (2019). Photodynamic Therapy as Primary Treatment for Small Choroidal Melanoma. Retina 39, 1319–1325. doi:10.1097/IAE.0000000000002169
Wei, C.-H., Kao, H.-Y., and Lu, Z. (2013). PubTator: a Web-Based Text Mining Tool for Assisting Biocuration. Nucleic Acids Res. 41, W518–W522. doi:10.1093/nar/gkt441
Wei, C.-H., Allot, A., Leaman, R., and Lu, Z. (2019). PubTator central: Automated Concept Annotation for Biomedical Full Text Articles. Nucleic Acids Res. 47, W587–W593. doi:10.1093/nar/gkz389
Wu, X., Hasan, M. A., and Chen, J. Y. (2014). Pathway and Network Analysis in Proteomics. J. Theor. Biol. 362, 44–52. doi:10.1016/j.jtbi.2014.05.031
Yang, T.-L., Shen, H., Liu, A., Dong, S.-S., Zhang, L., Deng, F.-Y., et al. (2020). A Road Map for Understanding Molecular and Genetic Determinants of Osteoporosis. Nat. Rev. Endocrinol. 16, 91–103. doi:10.1038/s41574-019-0282-7
Yordi, S., Soto, H., Bowen, R. C., and Singh, A. D. (2021). Photodynamic Therapy for Choroidal Melanoma: What Is the Response Rate? Surv. Ophthalmol. 66, 552–559. doi:10.1016/j.survophthal.2020.09.006
Yue, Z., Kshirsagar, M. M., Nguyen, T., Suphavilai, C., Neylon, M. T., Zhu, L., et al. (2015). PAGER: Constructing PAGs and New PAG-PAG Relationships for Network Biology. Bioinformatics 31, i250–i257. doi:10.1093/bioinformatics/btv265
Yue, Z., Zheng, Q., Neylon, M. T., Yoo, M., Shin, J., Zhao, Z., et al. (2018). PAGER 2.0: an Update to the Pathway, Annotated-List and Gene-Signature Electronic Repository for Human Network Biology. Nucleic Acids Res. 46, D668–D676. doi:10.1093/nar/gkx1040
Yue, Z., Nguyen, T., Zhang, E., Zhang, J., and Chen, J. Y. (2019a). WIPER: Weighted In-Path Edge Ranking for Biomolecular Association Networks. Quant Biol. 7, 313–326. doi:10.1007/s40484-019-0180-y
Yue, Z., Willey, C. D., Hjelmeland, A. B., and Chen, J. Y. (2019b). BEERE: a Web Server for Biomedical Entity Expansion, Ranking and Explorations. Nucleic Acids Res. 47, W578–W586. doi:10.1093/nar/gkz428
Zhang, F., and Chen, J. Y. (2010). Discovery of Pathway Biomarkers from Coupled Proteomics and Systems Biology Methods. BMC Genomics 11 (Suppl. 2), S12. doi:10.1186/1471-2164-11-S2-S12
Zhang, F., and Chen, J. Y. (2013). Breast Cancer Subtyping from Plasma Proteins. BMC Med. Genomics 6 (Suppl. 1), S6. doi:10.1186/1755-8794-6-S1-S6
Keywords: PAGER, melanoma, functional genomics, geneset analysis, network visualization and analysis, PAGER Web APP, GNPA
Citation: Yue Z, Slominski R, Bharti S and Chen JY (2022) PAGER Web APP: An Interactive, Online Gene Set and Network Interpretation Tool for Functional Genomics. Front. Genet. 13:820361. doi: 10.3389/fgene.2022.820361
Received: 22 November 2021; Accepted: 17 March 2022;
Published: 12 April 2022.
Edited by:
Sorin Draghici, Wayne State University, United StatesReviewed by:
Bhanwar Lal Puniya, University of Nebraska-Lincoln, United StatesParul Gupta, Oregon State University, United States
Copyright © 2022 Yue, Slominski, Bharti and Chen. This is an open-access article distributed under the terms of the Creative Commons Attribution License (CC BY). The use, distribution or reproduction in other forums is permitted, provided the original author(s) and the copyright owner(s) are credited and that the original publication in this journal is cited, in accordance with accepted academic practice. No use, distribution or reproduction is permitted which does not comply with these terms.
*Correspondence: Jake Y. Chen, amFrZWNoZW5AdWFiLmVkdQ==