 Guangyuan Zhou
 Tianfei Liu
 Yan Wang2
 Xinzheng Jia
- 1Guangdong Provincial Key Laboratory of Animal Molecular Design and Precise Breeding, School of Life Sciences and Engineering, Foshan University, Foshan, China
- 2State Key Laboratory of Livestock and Poultry Breeding, Guangdong Key Laboratory of Animal Breeding and Nutrition, Institute of Animal Science, Guangdong Academy of Agricultural Sciences, Guangzhou, China
Hyperpigmentation of the visceral peritoneum (HVP) has been becoming one of the most challenging problems in yellow-feathered chicken production, which seriously affected chicken carcass quality traits. Detecting which genes dominantly impact pigmentation in the peritoneum tissues is of great benefit to the genetic improvement of HVP. To investigate the genetic mechanism of HVP in yellow-feathered broilers, genome-wide association studies (GWASs) were conducted in the F2 generation of a cross broiler population with 395 birds. A total of 115,706 single-nucleotide polymorphisms (SNPs) of 122,415 were retained to identify quantitative trait loci (QTL) associated to HVP in chicken. The GWAS results based on the logistic mixed model (LMM) revealed that a narrow genomic location on chromosomes 1 (49.2–51.3 Mb) was significantly associated (p ≤ 4.32 × 10⁻⁷) with HVP, which contained 23 SNP makers related to 14 functional genes (MFNG, POLDIP3, POLR2F, PICK1, PDXP, SGSM3, RANGAP1, MYH9, RPL3, GALP3, LGALS1, MICALL1, ATF4, and CYP2D6). Four highly associated (p < 10−5) haplotype blocks of 0.80 kb (two SNPs), 0.06 kb (two SNPs), 0.95 kb (two SNPs), and 0.03 kb (two SNPs) were identified with two, two, four, and four distinct haplotypes, respectively. As a melanoma-associated gene, CYP2D6 were also possibly involved in the development of HVP occurring in chicken with two significant variations (rs314284996 and rs317955795) in the promoter regions. Further tests revealed that the expression of CYP2D6 was obviously higher in the visceral peritoneum tissue of chicken with HVP than that in the normal group (p < 0.05). Our results provide a novel clue to understand the genetic mechanism of HVP generation in chicken, and the mapped QTL or candidate genes might serve for genomic selection to improve carcass quality in the yellow-feathered chicken industry.
Introduction
All breeds of domestic fowl may have hyperpigmentation in the skin of the shanks and abdominal fascia, resulting in a decline in the appearance of the carcass (Crespo and Pizarro, 2006). Hyperpigmentation of the visceral peritoneum (HVP) has been becoming one of the most important problems impacting carcass quality in the commercial yellow-feathered chicken industry in China, with up to 90% occurs in some indigenous breeds, causing serious economic losses to the broiler production (Wang et al., 2014). To some extent, the generation of HVP was similar to fibromelanosis. However, the pigmentation dominantly occurred in chicken peritoneum tissues with HVP issues, resulting in an abnormal navy-blue skin color (Figure 1). The genetic causes of HVP occurring are still unknown. It was possibly caused by melanocytes producing the pigment melanin, similar to Silkie chicken peritoneum melanin (Wang et al., 2014).
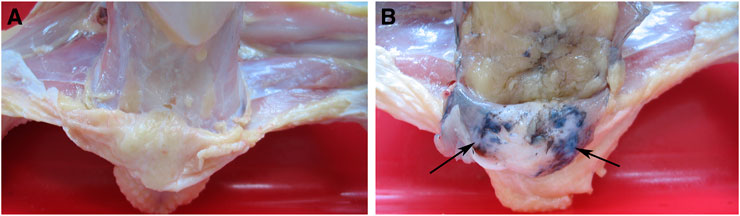
FIGURE 1. Visceral peritoneum of the normal chicken (A) and HVP chicken (B).
Genome-wide association studies (GWASs) were proved to be a viable and successful approach to explore phenotype-to-genotype connections (Visscher et al., 2017), which have been widely utilized in livestock and poultry breeding (Yang et al., 2015; Tian et al., 2020). Currently, a large amount of candidate genes were identified as causal markers associated with growth performance, meat quality, carcass traits, feather colors, and disease resistance ability in the Chinese indigenous chicken population (Luo et al., 2014; Zhang et al., 2015; Mao et al., 2019; Guo et al., 2020; Zhang et al., 2020). For example, GWAS in an F2 resource population was conducted to identify two novel candidate genes related to three single-nucleotide polymorphisms (SNPs) associated with avian influenza antibody titers (Sun et al., 2016). Another study reported that 21 candidate genes were proved to be associated with chicken bone growth based on GWAS in an F2 crossbred experimental population (Li et al., 2021). For the HVP performance, our previous studies have preliminary detected three highly associated QTL regions (GGA1:50.5–54.0 Mb, GGA1:58.5–60.5 Mb, and GGA20:10.5–12.0 Mb) using Illumina Chicken 60 K SNP Beadchip in an F2 cross broiler population (Luo et al., 2013).
When melanin formed in melanocytes is abnormally produced, skin hyperpigmentation disorder develops (Roselan et al., 2020). Dermal hyperpigmentation, also known as fibromelanosis (FM), is a typical skin pigmentation trait in chickens, and FM is linked to higher EDN3 expression (Arora et al., 2011). However, the EDN3 gene may not be a crucial gene for the black phenotype in sheep, which is marked by black pigmentation throughout the body and on internal organs (Darwish et al., 2018). Lentigines and freckles are common skin hyperpigmentations in humans. The quantity of melanocytes in lentigines and freckles differs. The number of melanocytes in freckles remains constant, but the amount of melanin produced increases; on the other hand, lentigines are caused by a rise in the number of melanocytes (Kumari et al., 2018).
In this study, a fine-mapping GWAS based on the F2 resource population was conducted to explore the genetic variations or genome segments controlling HVP occurring in Chinese yellow chicken. The candidate genes and markers associated with HVP can help elucidate the genetic architecture of carcass traits involved in hyperpigmentation distribution and can subsequently be used for marker-assisted selection or genomic selection in poultry breeding.
Materials and Methods
Ethical Statement
The animal experiments were performed with the approval of the Animal Care Committee of the Institute of Animal Science, Guangdong Academy of Agricultural Sciences (Guangzhou, China) and Use Committee (GAAS-IAS-2009-73).
Experimental Animals
The experimental population was a three-generation cross-breeding population construction from two different meat-type chicken lines. The first founder line was Huiyang Bearded Chicken (HB), which is an indigenous breed in China. The second founder line was the commercial broiler breed “High Quality Chicken A Line” (HQLA). The ratio of HVP of Huiyang Bearded Chicken is much higher than that of HQLA. A total of 395 individuals from the F2 population were used for GWAS, including 212 cocks and 183 hens from eight half-sib families. At 91 days of age, venous blood was collected and slaughtered. As shown in Figure 1, HVP is evaluated by peeling: chickens with visceral peritoneum pigmentation are HVP chickens, and chickens with no peritoneal pigmentation are normal chickens. Among the 395 birds, 124 individuals had HVP and 271 individuals had absent HVP. Heritability estimation was carried out by GAPIT (Wang and Zhang, 2021) software. We used a linear mixed model to estimate genetic variance based on genomic information.
Genotyping and Quality Control
Genomic DNA was extracted from venous blood using the phenol/chloroform method as described before (Jia et al., 2016). All the birds were genotyped using the 10X SLAF-seq (Specific-Locus Amplified Fragment Sequencing), which was performed by Biomarker Technologies (Beijing, China) Co., Ltd. For enzyme cutting site prediction, the genome of Gallus gallus 5.0 (ftp://ftp.ncbi.nlm.nih.gov/genomes/all/GCF/000/002/315/GCF_000002315.4_Gallus_gallus-5.0) was used as the reference genome. The qualifying DNA of the sampled individuals was digested using HaeIII restriction enzymes. The length of paired-end reads was 125 bp, while the sequencing insert size was 364–444 bp. The consistent part of the variation obtained by GATK (DePristo et al., 2011) and samtools (Li et al., 2009) was used as the final variation site for subsequent analysis. After quality control, 115,706 SNP markers remained with call rate >70% and MAF> 0.01. BEAGLE version 5.2 was used to impute missing SNPs (Browning and Browning, 2013). The 30X SLAF-seq data were obtained from 22 F0, with individuals as a reference panel. r2 of LD was calculated using PLINK 2.0 (Chang et al., 2015); then, regrouping was done, and the mean of LD and the LD decay plot were obtained using the ggplot2 package. The SNP distribution is shown in Figure 2A. The LD decay line quickly decreased first; after 50 kb, the distance tended to be slow (Figure 2B). These values thus indicate that the F2 population has relatively short LD distances and quick LD decay.
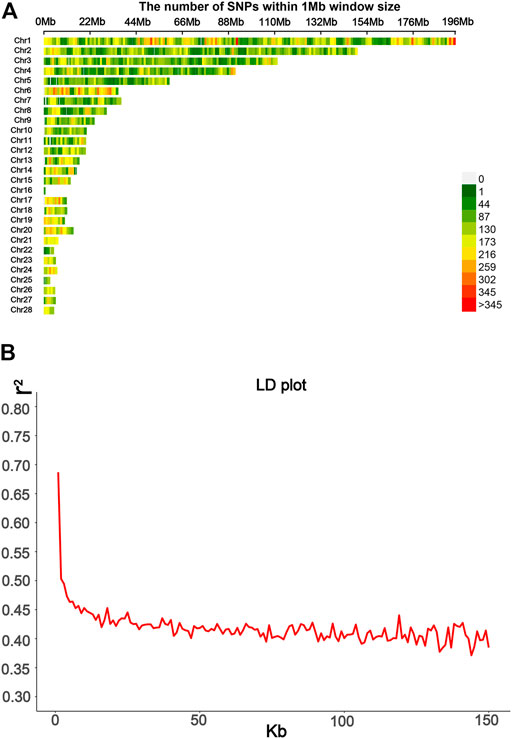
FIGURE 2. Information from SLAF-seq genotyping was used in this study. (A) SNPs’ density distribution on 28 autosomes; the SNP density based on a 1 Mbp window was estimated. (B) Average distance between SNPs was used to calculate the LD decay plot.
Statistical Analysis
GWAS was performed using the logistic mixed model (LMM); the statistical model is
where
The Bonferroni correction (Benjamini and Hochberg, 1995) was used to control the false positive rate in the GWAS analyses, namely, p = 0.05/N, where N is the number of SNP loci. In this study, we used a genome-wide significance threshold p-value of 4.32*10−7 (i.e., p = 0.05/115,706). Quantile–quantile (QQ) plots and Manhattan plots were plotted using the R package CMplot (Yin et al., 2021). Use of a web-based platform ensemble (URL:http://archive.ensembl.org/Gallus_gallus/Info/Index) translated the significant SNPs from Gallus gallus 5.0 to Gallus gallus 6.0.
The population structure was analyzed using Admixture software (Alexander et al., 2009), and admixture proportions were visualized with the R package pophelper (Francis, 2017). The genomic inflation factor (λ), defined as the ratio of the genome-wide chi-squared statistics mean (or median) to the expected distribution of this statistic under the null hypothesis, was used to assess the impact of population stratification on association analyses. Generally, the more the value of genomic inflation factor deviates from 1, the higher the rates of false positive errors in GWAS analyses (Devlin et al., 2001). The formula for the genomic inflation factor is as follows:
where
Linkage disequilibrium (LD) of SNP loci significantly associated with HVP was performed with the software haploview (Barrett et al., 2005). After the haplotypes significantly associated with HVP are identified, candidate genes in the haplotype blocks are detected. The statistical analysis of haplotypes with HVP was performed with the R package haplo.stats (Schaid et al., 2002).
Gene Identification and Annotation
The nearest genes present within 50 kb upstream or 50 kb downstream of the SNP loci significantly associated with HVP were identified as potential candidate genes based on the Gallus gallus 6.0 reference genome (http://archive.ensembl.org/Gallus_gallus/Info/Index).
Quantity of mRNA Expression by qRT-PCR
The visceral peritoneum tissues were collected from adult chicken with extremely different HVP performance with no peritoneal pigmentation (n = 5) (absent HVP control group) and five HVP-positive (severe HVP) chickens. The total RNA was extracted with RNA TRIzol (Lin et al., 2019) reagents according to standard protocols. An M-MLV RTase cDNA Synthesis Kit was used to prepare cDNA. The visceral peritoneum MFNG, MYH9, RANGAP1, and CYP2D6 gene expression was determined by quantitative real-time polymerase chain reaction (qRT–PCR). qRT–PCR primers were designed using NCBI Primer-Blast. The reactions of qRT–PCR were performed in 20 µL volumes. Parameters of RT-PCR were as follows: 3 min 95°C, followed by 40 cycles of 30 s at 95°C, 30 s at 60°C, and 45 s at 72°C. The relative gene expression levels of the target genes MFNG, MYH9, RANGAP1, and CYP2D6 were calculated using the 2−△△CT method and normalized with housekeeping genes: GAPDH. The differential expression of MFNG, MYH9, RANGAP1, and CYP2D6 in the visceral peritoneum tissue, between the normal and HVP-positive, was determined using a t-test with the software Graphpad Prism 8 (Knapek et al., 2020).
Results
Population Structure Analysis
The visualization of population stratification was performed by principal component analysis (PCA) for the first three principal components (PCs) (Figure 3). The first two PCs, gender, and batch were used as covariates in the GWAS to avoid the false positive caused by population stratification. The genomic inflation factor of the logistic mixed model is 1.006, indicating that the rates of false positive errors are well controlled. The decay of LD was the strongest within the first 50 kb (Figure 2B). These SNPs corresponding to the nearest genes within the LD decay range were selected for identification of the candidates.
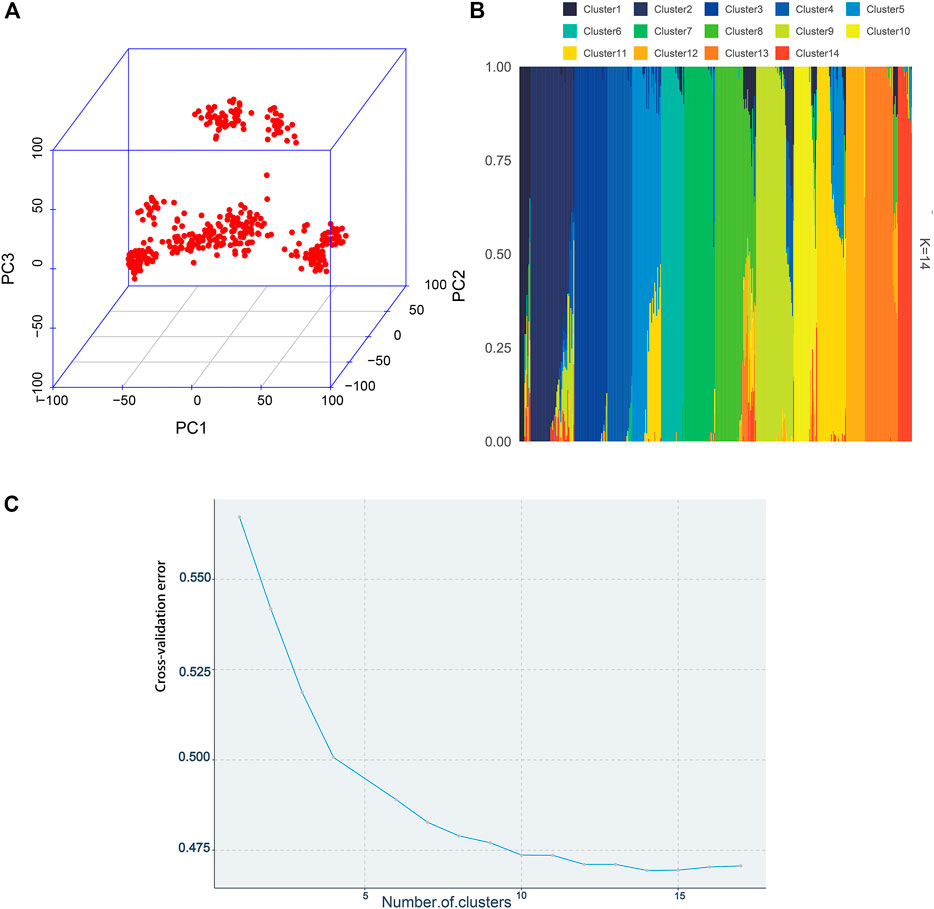
FIGURE 3. Population structure plots demonstrated by the 395 individuals. (A) By constructing the 3D plot, the first three PCs were chosen to depict the population structure. (B) Admixture analysis. Each bar represents an individual. Different colors represent various genetic clusters, and the proportion of the color represents the likelihood of an individual being allocated to that genetic cluster. The individuals were sorted by aligning clusters using the alink function of R package pophelper. (C) Cross-validation errors across 17 ancestral genetic clusters.
GWAS on HVP Trait
The HVP heritability was 0.32 in this F2 population of yellow chicken, which illustrated that the HVP trait could be potentially improved by selective breeding. GWAS performed on HVP showed that 23 consistent SNPs were identified as the most significantly associated loci with HVP performance, which was analyzed by the logistic mixed model (Figure 4). Meanwhile, these SNPs were all from a narrow genomic location on chromosomes 1 (49.2–51.8 Mb). To some extent, the results were partly overlapped with our previous study (Luo et al., 2013).
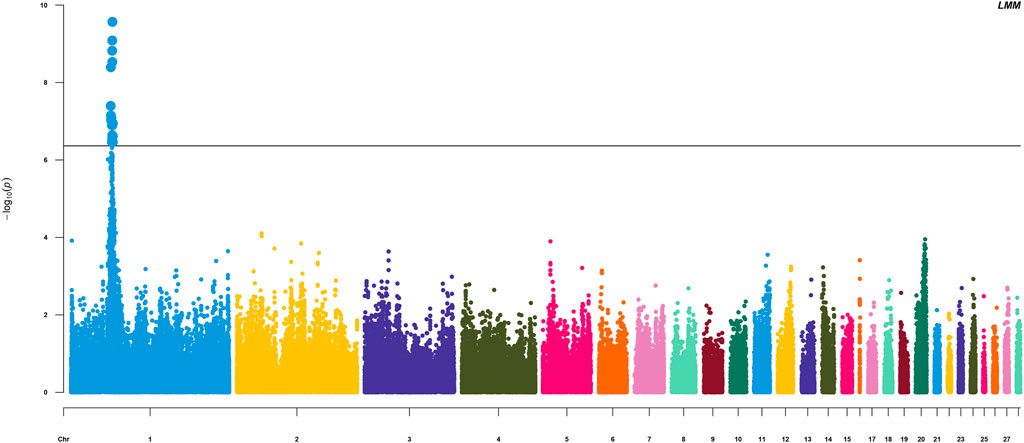
FIGURE 4. Manhattan plots for analyzing the results of HVP. Significant SNP loci are indicated in bold.
There were 23 potential candidate genes located in this region, including MFNG, POLDIP3, POLR2F, PICK1, PDXP, SGSM3, RANGAP1, MYH9, RPL3, GALP3, LGALS1, MICALL1, ATF4, and CYP2D6 (Table 1). Of which, rs314284996 and rs317955795 were located in the promoter regions of CYP2D6 (less than 1.3 kb distance from 5′UTR). Interestingly, CYP2D6 was identified as a biomarker associated with increased susceptibility to melanoma, which is coded for another enzyme that may play a role in detoxifying potentially carcinogenic compounds (Bose et al., 2018). A quantile–quantile plot of the logistic mixed model analyzed for HVP traits showed that the observed and expected p-values of the GWAS fitted very well (Figure 5).
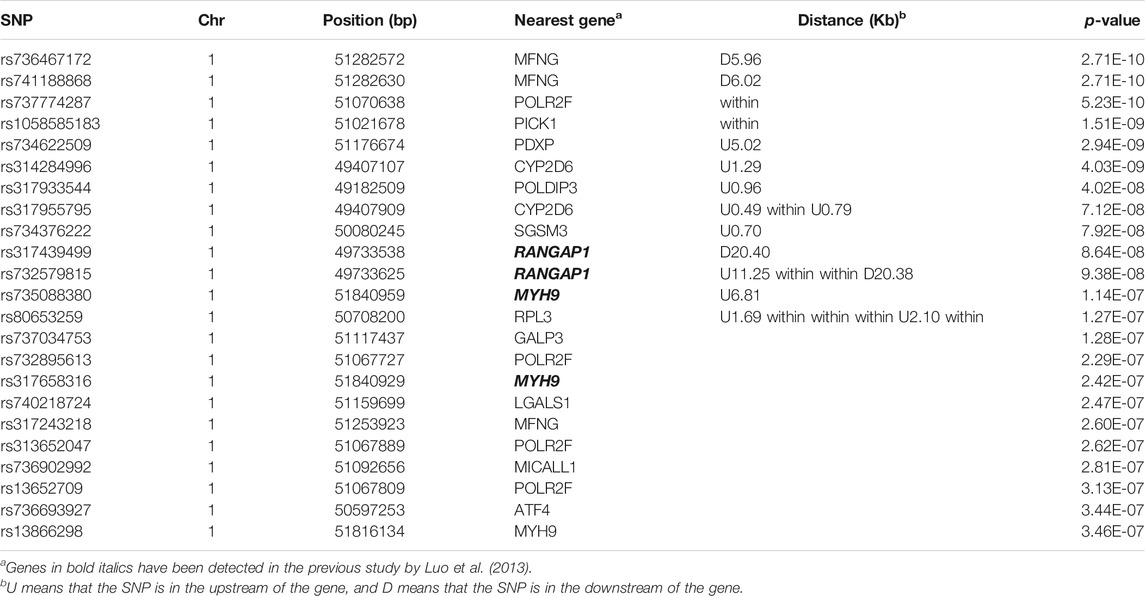
TABLE 1. Significant SNPs with p ≤ 4.32 × 10⁻⁷ from GWAS.
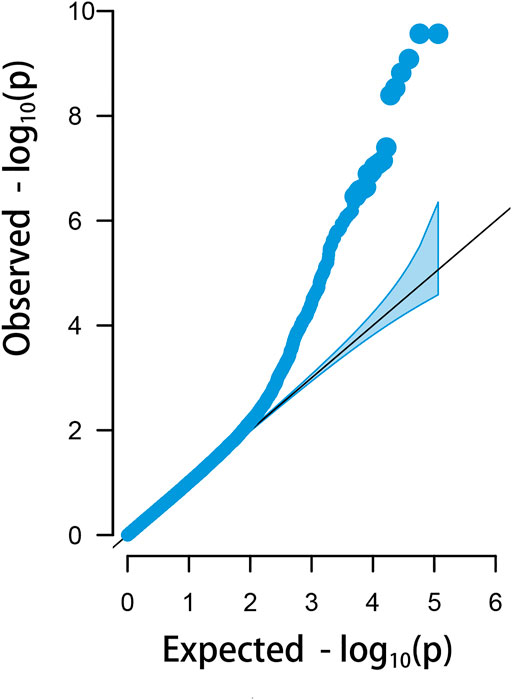
FIGURE 5. Quantile–quantile plots of the logistic mixed model (LMM) analyzed for HVP traits in China yellow chickens.
Haplotype-Based Associated Analysis on HVP Traits
There were four haplotype blocks, which spanned 0.80, 0.09, 0.06, and 0.03 kb genomic regions (Table 2), and they were identified to have significant association with HVP traits (Figure 6), with a conservative LD threshold (r2 = 0.8). As shown in Table 3, the haplotypic Block 1 included two significant SNPs, with only two SNP haplotypes constructed. The AG haplotype has a significant minus effect on HVP (p < 0.01), and the GT haplotype has a great plus effect on HVP (p < 0.01). However, a total of two haplotypes were generated in Block 2, and the two haplotypes were significantly associated with HVP. The AT haplotype has a significant minus effect on HVP (p < 0.01), and the GC haplotype has a great plus effect on HVP (p < 0.01). The haplotypic Block 3 included four significant SNPs, with only two SNP haplotypes constructed. The TG haplotype has a significant minus effect on HVP (p < 0.01), and the CA haplotype displayed a plus effect on HVP (p < 0.01). However, a total of four haplotypes were generated in Block 4 with two haplotypes significantly associated with HVP traits. The CT haplotype has a significant minus effect on HVP (p < 0.01), and the TC haplotype has a great plus effect on HVP (p < 0.01).

TABLE 2. Significant SNPs in the LD Block.
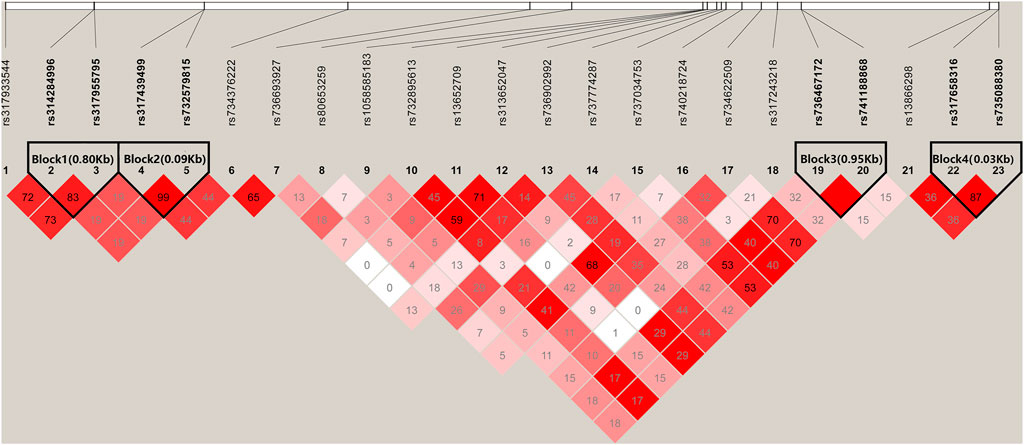
FIGURE 6. Linkage disequilibrium analysis of significant SNPs. Values in boxes are LD (r2) between SNP pairs. The absence of the r2 value within the boxes means r2 = 1, complete linkage disequilibrium (LD). The LD color display is based on the D′/LOD score ratio.
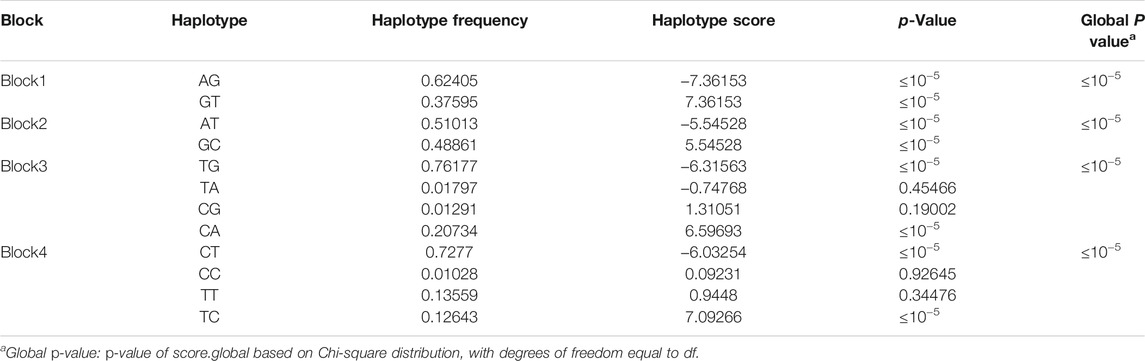
TABLE 3. Results of haplotype association analysis.
Analysis of the Expression Patterns of HVP Candidate Genes
Exploring expression level changes in candidate genes was proved to be helpful to identify major genes following GWAS analysis. Here, five birds were randomly chosen from both the severe HVP and absent HVP groups and were utilized for detecting transcriptional expression profiles of CYP2D6, MYH9, RANGAP1, and MFNG by qRT-PCR. The primers are listed in Table 4. The results showed that both these functional genes were expressed in the visceral peritoneum tissues (Figure 7). Only the CYP2D6 gene was greatly differentially expressed between the birds from the absent and severe HVP groups (p < 0.05), and CYP2D6 had a much high level in the server individuals, which was consistent with the studies in humans that CYP2D6 genotypes were associated with the hair color, Breslow thickness, and malignant melanoma (Strange et al., 1999). For the MFNG gene, coding an oncogene through Notch-mediated signaling (Kakuda et al., 2020), there was no statistically significant difference in birds with various HVP performances (p > 0.05). For the MYH9 gene, which encodes the non-muscle myosin heavy-chain IIA protein (Pecci et al., 2018), there was no statistically significant difference in birds with various HVP performances (p > 0.05). For the RANGAP1 gene, a crucial component of the RanGTPase system (Lin et al., 2016), there was no statistically significant difference in birds with various HVP performances (p > 0.05).
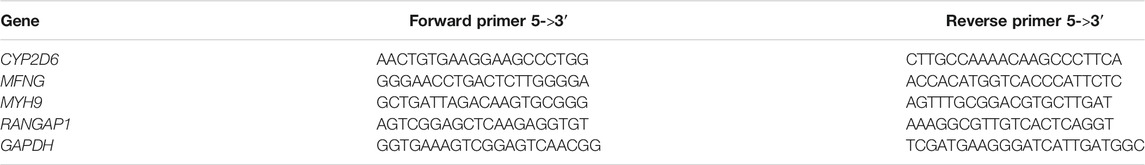
TABLE 4. Primer sequences for qRT-PCR.
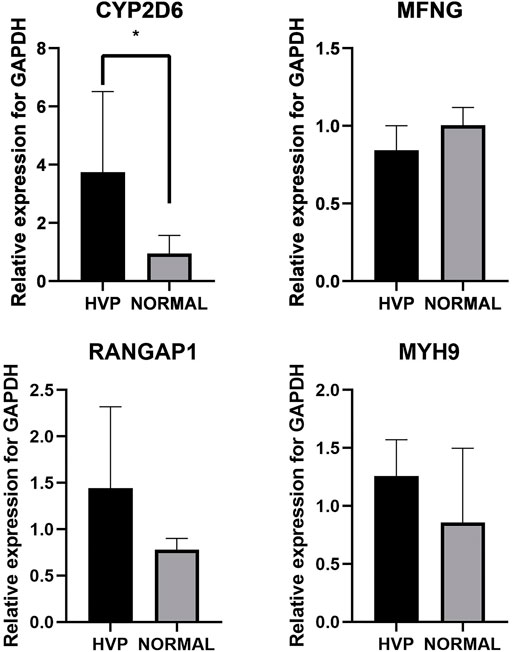
FIGURE 7. Expression of chickens CYP2D6, MYH9, RANGAP1, and MFNG; * indicates significant differences at p < 0.05.
Discussion
HVP is one of the most important carcass traits in the production of chilled carcass broilers, which made it difficult to carry out breeding selection at the early age of yellow-feathered chickens in China with a longer production cycle. However, our studies showed that HVP has a medium heritability in the F2 cross population, indicating that it is possible to improve HVP performance through molecular breeding selection with the precious understanding knowledge of the genetic mechanism on this trait. A recent study found that designed populations, such as F2 populations for GWASs, were very beneficial in enhancing QTL mapping accuracy (Ledur et al., 2010). Designed GWAS on the F2 population presented great power to identify the causal genetic markers and genes controlling complex economic traits. Based on GWAS investigation, a narrow QTL on chromosome 1 was identified to have significant genomic architectures associated with HVP traits. Joint analysis between GWAS and gene expression patterns showed that CYP2D6 was a potential genetic marker for breeding selection on HVP. Our results provided novel clues to understand the genetic mechanism of HVP generation in chicken and improved conduction of genomic selection on HVP traits in the yellow-feathered chicken industry.
The broiler chicken population used in this study was constructed by crossing a Huiyang Beard chicken and a Chinese commercial broiler breed. Huiyang Beard chickens are one of the indigenous Chinese chicken breeds. There were several problems for breeding in most local breeds, such as smaller effective population numbers, which resulted in lower diversity in breeds and a higher LD level and larger fraction of SNPs with fixed alleles (Munoz et al., 2019). However, there was a clear genetic diversity among these indigenous Chinese chicken breeds such as in Beard chickens, Chahua chickens, and Silkie and Langshan chickens (Yuan et al., 2018). The LD analysis (Figure 2B) showed a small distance of LD decay in this F2 population, which could be helpful for QTL mapping on HVP traits in our study with high genetic diversity. Our GWAS results proved very clear associated signals between a narrow QTL and HVP performance (p ≤ 4.32 × 10⁻⁷).
Improvements in the density of SNPs at the whole genome level have allowed more accuracy in mapping resolution of common variant associations in GWAS. Based on the same broiler population, Liu et al. (2020) revealed that the accuracy of genomic prediction using SLAF-seq was higher than that using SNP chips. These results indicate that SLAF-seq covers more important SNPs with effects. As the marker density increases, the accuracy of QTN identification in GWAS also increases (Liu et al., 2018). The previous study by Luo et al. (2013) used a medium-density chip with only 46 K SNPs, while SLAF-seq has 115 K SNPs in the current study, and the distributions of the two types of markers are different. The use of more markers is expected to detect more genes that associate with HVP. The aim of the present study is to find new candidate genes for HVP based on SLAF-seq. The results in the current study validated part of the results of the previous study and detected 11 new candidate genes for HVP, and joint analysis of haplotype association and gene expression pattern changes indicated that CYP2D6 was a novel potential gene for HVP. It suggested that the SNP density has great power to improve QTL mapping, and even twice the size of SNP number was obtained in this study.
Fine-mapping analysis indicated that the correlation between gene expression patterns and genotypes based on GWAS QTL mapping has more accuracy to identify QTNs regulating complex traits in livestock (Liu et al., 2018). A large number of GWASs also proved that combining multiple approaches had a great advantage in improved QTL identification and interpretation (Abed and Belzile, 2019). Here, based on GWAS results with the LMM model, 23 significant SNPs were discovered at the first step. Then, haplotype-based association analysis was employed to narrow down effectiveness of taking into account the linkage disequilibrium (Epstein and Satten, 2003), resulting in four significant haplotype blocks related to CYP2D6, MYH9, RANGAP1, and MFNG. Finally, the gene expression pattern between case-control groups was utilized to explore the candidate genes. CYP2D6 was identified as a major candidate gene for HVP by integrating all these tests. Moreover, the functional of CYP2D6 also contributed to our conclusion. CYP2D6 encodes a highly polymorphic gene in the family of cytochrome P450, and its function is highly variable (Li et al., 2019). Strange et al. (1999) revealed that there was an association between CYP2D6 genotypes with tumor thickness in human cutaneous melanoma, and polymorphisms in CYP2D6 are associated with hair color. In melanoma, CYP2D6 was thought to be related to prognosis and risk (Howell, 2004). CYP2D6 genetic polymorphism may provide an entry point to explore propranolol in the management of melanoma (De Giorgi et al., 2018; Patane, 2018). Sun et al. (2019) analyzed the RNA-seq data in melanoma from TCGA (The Cancer Genome Atlas) database through the Kyoto Encyclopedia of Genes and Genomes (KEGG) pathway enrichment analyses, and CYP2D6 was found to be enriched in the cytochrome P450 pathway. Therefore, either GWAS or molecular function annotation indicated that CYP2D6 could be a novel genetic marker for HVP performance in chickens.
As the sequencing technology improves, the possibility of the causal mutations being incorporated in the genomic selection model increases. However, needless to say, more variant diversity was much better for genomic selection (Broeckx et al., 2017; Jung et al., 2020). The significantly associated loci discovered by GWAS can be used to construct genomic prediction models and achieve genetic gains through genomic selection (Sehgal et al., 2015; McGowan et al., 2020). GWAS-assisted genomic selection has yielded promising results in several research studies. In a simulation study, when the genomic association matrix was weighted on the causative mutations, the results showed a 167% improvement in prediction accuracy (Fragomeni et al., 2017). In real data analysis, the genomic prediction models integrating two or more GWAS markers as fixed effects can substantially improve the accuracy (Odilbekov et al., 2019). When meta-GWAS significantly associated loci were added as fixed effect factors in GS models assessing height in Jersey and Holstein bulls, the prediction accuracies increased (Raymond et al., 2018). Therefore, our study is useful for marker-assisted selection or genomic selection in poultry breeding.
Conclusion
In this study, GWAS in the F2 cross broiler population was conducted for investigating the genetic basis of HVP traits based on a proper genotyping by SLAF-seq. A narrow QTL region of 2.1 Mb (49.2–51.3 Mb) on chromosome 1 (GGA1) was identified clearly associated with HVP, related to 23 significantly associated SNPs. Gene annotations revealed that 14 genes (MFNG, POLDIP3, POLR2F, PICK1, PDXP, SGSM3, RANGAP1, MYH9, RPL3, GALP3, LGALS1, MICALL1, ATF4, and CYP2D6) could be primary candidate genes for HVP occurring in chicken. Joint analysis of haplotype association and gene expression pattern changes indicated that CYP2D6 was a novel potential genetic marker for HVP performance in chicken with much higher expression in the birds of severe HVP, which was in agreement with previous studies in humans that CYP2D6 genotypes were highly associated with tumor thickness in cutaneous melanoma. Our results provide a new insight to understand the genetic basis of HVP generation in chicken and improve the accuracy of genomic selection for carcass quality in the poultry breeding.
Data Availability Statement
The original contributions presented in the study are included in the article/Supplementary Material, and further inquiries can be directed to the corresponding authors.
Ethics Statement
The animal study was reviewed and approved by the Animal Care Committee of the Institute of Animal Science, Guangdong Academy of Agricultural Sciences (Guangzhou, China) and Use Committee (GAAS-IAS-2009-73). Written informed consent was obtained from the owners for the participation of their animals in this study.
Author Contributions
Conception and design of the experiment: TL, XJ, and CL. Performing the experiment: GZ, YW, XJ, and CL. Data analysis: GZ, TL, XJ, and CL. Acquisition of funding: TL, HQ, DS, and CL. Writing of the manuscript: GZ, TL, YW, HQ, DS, XJ, and CL. All authors have read and agreed to the published version of the manuscript.
Funding
This research was funded by the Key-Area Research and Development Program of Guangdong Province (2018B020203001, 2020B020222002), the Science and Technology Program of Guangdong (2017B020201006, 2017B020232003), the Guangdong Basic and Applied Basic Research Foundation (2020A1515011277), the Technical System of Poultry Industry of Guangdong Province (2021KJ128), the Modern Agricultural Science and Technology Innovation Alliance of Guangdong (2021KJ106), and the China Agriculture Research System of MOF and MARA (CARS-41).
Conflict of Interest
The authors declare that the research was conducted in the absence of any commercial or financial relationships that could be construed as a potential conflict of interest.
Publisher’s Note
All claims expressed in this article are solely those of the authors and do not necessarily represent those of their affiliated organizations or those of the publisher, the editors, and the reviewers. Any product that may be evaluated in this article or claim that may be made by its manufacturer is not guaranteed or endorsed by the publisher.
Acknowledgments
We thank the Key Laboratory of Poultry Genetics and Breeding, Ministry of Agriculture, China.
Supplementary Material
The Supplementary Material for this article can be found online at: https://www.frontiersin.org/articles/10.3389/fgene.2022.820297/full#supplementary-material
References
Abed, A., and Belzile, F. (2019). Comparing Single-SNP, Multi-SNP, and Haplotype-Based Approaches in Association Studies for Major Traits in Barley. Plant Genome 12 (3), 1–14. doi:10.3835/plantgenome2019.05.0036
Alexander, D. H., Novembre, J., and Lange, K. (2009). Fast Model-Based Estimation of Ancestry in Unrelated Individuals. Genome Res. 19 (9), 1655–1664. doi:10.1101/gr.094052.109
Arora, G., Mishra, S. K., Nautiyal, B., Pratap, S. O., Gupta, A., Beura, C. K., et al. (2011). Genetics of Hyperpigmentation Associated with the Fibromelanosis Gene (Fm) and Analysis of Growth and Meat Quality Traits in Crosses of Native Indian Kadaknath Chickens and Non-indigenous Breeds. Br. Poult. Sci. 52 (6), 675–685. doi:10.1080/00071668.2011.635637
Barrett, J. C., Fry, B., Maller, J., and Daly, M. J. (2005). Haploview: Analysis and Visualization of LD and Haplotype Maps. Bioinformatics 21 (2), 263–265. doi:10.1093/bioinformatics/bth457
Benjamini, Y., and Hochberg, Y. (1995). Controlling the False Discovery Rate: a Practical and Powerful Approach to Multiple Testing. J. R. Stat. Soc. Ser. B (Methodological) 57 (1), 289–300. doi:10.1111/j.2517-6161.1995.tb02031.x
Bose, A., Petsko, G. A., and Eliezer, D. (2018). Parkinson's Disease and Melanoma: Co-occurrence and Mechanisms. Jpd 8 (3), 385–398. doi:10.3233/JPD-171263
Broeckx, B. J. G., Derrien, T., Mottier, S., Wucher, V., Cadieu, E., Hédan, B., et al. (2017). An Exome Sequencing Based Approach for Genome-wide Association Studies in the Dog. Sci. Rep. 7 (1), 15680. doi:10.1038/s41598-017-15947-9
Browning, B. L., and Browning, S. R. (2013). Improving the Accuracy and Efficiency of Identity-By-Descent Detection in Population Data. Genetics 194 (2), 459–471. doi:10.1534/genetics.113.150029
Chang, C. C., Chow, C. C., Tellier, L. C., Vattikuti, S., Purcell, S. M., and Lee, J. J. (2015). Second-generation PLINK: Rising to the challenge of Larger and Richer Datasets. GigaSci 4, 7. doi:10.1186/s13742-015-0047-8
Chen, H., Wang, C., Conomos, M. P., Stilp, A. M., Li, Z., Sofer, T., et al. (2016). Control for Population Structure and Relatedness for Binary Traits in Genetic Association Studies via Logistic Mixed Models. Am. J. Hum. Genet. 98 (4), 653–666. doi:10.1016/j.ajhg.2016.02.012
Crespo, R., and Pizarro, M. (2006). Skin and Abdominal Fascia Melanization in Broiler Chickens. Avian Dis. 50 (2), 309–311. doi:10.1637/7425-082405R.1
Darwish, H. Y. A., Zhang, Y., Cui, K., Yang, Z., Han, D., Dong, X., et al. (2018). Molecular Cloning and Characterization of the Endothelin 3 Gene in Black Bone Sheep. J. Anim. Sci Biotechnol 9, 57. doi:10.1186/s40104-018-0272-y
De Giorgi, V., Grazzini, M., Benemei, S., Marchionni, N., Botteri, E., Pennacchioli, E., et al. (2018). Propranolol for Off-Label Treatment of Patients with Melanoma. JAMA Oncol. 4 (2), e172908. doi:10.1001/jamaoncol.2017.2908
DePristo, M. A., Banks, E., Poplin, R., Garimella, K. V., Maguire, J. R., Hartl, C., et al. (2011). A Framework for Variation Discovery and Genotyping Using Next-Generation DNA Sequencing Data. Nat. Genet. 43 (5), 491–498. doi:10.1038/ng.806
Devlin, B., Roeder, K., and Wasserman, L. (2001). Genomic Control, a New Approach to Genetic-Based Association Studies. Theor. Popul. Biol. 60 (3), 155–166. doi:10.1006/tpbi.2001.1542
Epstein, M. P., and Satten, G. A. (2003). Inference on Haplotype Effects in Case-Control Studies Using Unphased Genotype Data. Am. J. Hum. Genet. 73 (6), 1316–1329. doi:10.1086/380204
Fragomeni, B. O., Lourenco, D. A. L., Masuda, Y., Legarra, A., and Misztal, I. (2017). Incorporation of Causative Quantitative Trait Nucleotides in Single-step GBLUP. Genet. Sel Evol. 49 (1), 59. doi:10.1186/s12711-017-0335-0
Francis, R. M. (2017). Pophelper: an R Package and Web App to Analyse and Visualize Population Structure. Mol. Ecol. Resour. 17 (1), 27–32. doi:10.1111/1755-0998.12509
Guo, J., Qu, L., Dou, T.-C., Shen, M.-M., Hu, Y.-P., Ma, M., et al. (2020). Genome-wide Association Study Provides Insights into the Genetic Architecture of Bone Size and Mass in Chickens. Genome 63 (3), 133–143. doi:10.1139/gen-2019-0022
Jia, X., Lin, H., Nie, Q., Zhang, X., and Lamont, S. J. (2016). A Short Insertion Mutation Disrupts Genesis of miR-16 and Causes Increased Body Weight in Domesticated Chicken. Sci. Rep. 6, 36433. doi:10.1038/srep36433
Jung, M., Roth, M., Aranzana, M. J., Auwerkerken, A., Bink, M., Denancé, C., et al. (2020). The Apple REFPOP-A Reference Population for Genomics-Assisted Breeding in Apple. Hortic. Res. 7 (1), 189. doi:10.1038/s41438-020-00408-8
Kakuda, S., Lopilato, R. K., Ito, A., and Haltiwanger, R. S. (2020). Canonical Notch Ligands and Fringes Have Distinct Effects on NOTCH1 and NOTCH2. J. Biol. Chem. 295, 14710–14722. doi:10.1074/jbc.RA120.014407
Knapek, K. J., Georges, H. M., Van Campen, H., Bishop, J. V., Bielefeldt-Ohmann, H., Smirnova, N. P., et al. (2020). Fetal Lymphoid Organ Immune Responses to Transient and Persistent Infection with Bovine Viral Diarrhea Virus. Viruses 12 (8), 816. doi:10.3390/v12080816
Kumari, S., Thng, S., Verma, N., and Gautam, H. (2018). Melanogenesis Inhibitors. Acta Derm Venerol 98 (10), 924–931. doi:10.2340/00015555-3002
Ledur, M. C., Navarro, N., and Pérez-Enciso, M. (2010). Large-scale SNP Genotyping in Crosses between Outbred Lines: How Useful Is it? Heredity 105 (2), 173–182. doi:10.1038/hdy.2009.149
Li, H., Handsaker, B., Wysoker, A., Fennell, T., Ruan, J., Homer, N., et al. (2009). The Sequence Alignment/Map Format and SAMtools. Bioinformatics 25 (16), 2078–2079. doi:10.1093/bioinformatics/btp352
Li, M., Li, A., He, R., Dang, W., Liu, X., Yang, T., et al. (2019). Gene Polymorphism of Cytochrome P450 Significantly Affects Lung Cancer Susceptibility. Cancer Med. 8 (10), 4892–4905. doi:10.1002/cam4.2367
Li, Y. D., Liu, X., Li, Z. W., Wang, W. J., Li, Y. M., Cao, Z. P., et al. (2021). A Combination of Genome-wide Association Study and Selection Signature Analysis Dissects the Genetic Architecture Underlying Bone Traits in Chickens. Animal 15 (8), 100322. doi:10.1016/j.animal.2021.100322
Lin, S., Zhang, Z., Xie, T., Hu, B., Ruan, Z., Zhang, L., et al. (2019). Identification of a Novel Antisense RNA that Regulates Growth Hormone Receptor Expression in Chickens. RNA Biol. 16 (5), 626–638. doi:10.1080/15476286.2019.1572440
Lin, T.-Y., Chen, K.-C., Liu, H.-J. E., Liu, A.-J., Wang, K.-L., and Shih, C.-M. (2016). MicroRNA-1301-Mediated RanGAP1 Downregulation Induces BCR-ABL Nuclear Entrapment to Enhance Imatinib Efficacy in Chronic Myeloid Leukemia Cells. PLoS One 11 (5), e0156260. doi:10.1371/journal.pone.0156260
Liu, R., Gong, J., Xiao, X., Zhang, Z., Li, J., Liu, A., et al. (2018). GWAS Analysis and QTL Identification of Fiber Quality Traits and Yield Components in Upland Cotton Using Enriched High-Density SNP Markers. Front. Plant Sci. 9, 1067. doi:10.3389/fpls.2018.01067
Liu, T., Luo, C., Ma, J., Wang, Y., Shu, D., Su, G., et al. (2020). High-Throughput Sequencing with the Preselection of Markers Is a Good Alternative to SNP Chips for Genomic Prediction in Broilers. Front. Genet. 11, 108. doi:10.3389/fgene.2020.00108
Luo, C., Qu, H., Ma, J., Wang, J., Hu, X., Li, N., et al. (2014). A Genome-wide Association Study Identifies Major Loci Affecting the Immune Response against Infectious Bronchitis Virus in Chicken. Infect. Genet. Evol. 21, 351–358. doi:10.1016/j.meegid.2013.12.004
Luo, C., Qu, H., Wang, J., Wang, Y., Ma, J., Li, C., et al. (2013). Genetic Parameters and Genome-wide Association Study of Hyperpigmentation of the Visceral Peritoneum in Chickens. BMC Genomics 14, 334. doi:10.1186/1471-2164-14-334
Mao, H., Wang, X., Fan, Y., Cheng, D., Chen, K., Liu, S., et al. (2019). Whole‐genomeSNPdata Unravel Population Structure and Signatures of Selection for Black Plumage of Indigenous Chicken Breeds from Jiangxi Province, China. Anim. Genet. 50 (5), 475–483. doi:10.1111/age.12827
Martin Howell, W. (2004). Epidermal Growth Factor Gene Polymorphism and Development of Cutaneous Melanoma. J. Invest. Dermatol. 123 (4), xx–xxi. doi:10.1111/j.0022-202X.2004.23308.x
McGowan, M., Wang, J., Dong, H., Liu, X., Jia, Y., Wang, X., et al. (2020). Ideas in Genomic Selection with the Potential to Transform Plant Molecular Breeding: A Review. Preprints 2020, 2020100460. doi:10.20944/preprints202010.0460.v2
Muñoz, M., Bozzi, R., García-Casco, J., Núñez, Y., Ribani, A., Franci, O., et al. (2019). Genomic Diversity, Linkage Disequilibrium and Selection Signatures in European Local Pig Breeds Assessed with a High Density SNP Chip. Sci. Rep. 9 (1), 13546. doi:10.1038/s41598-019-49830-6
Odilbekov, F., Armoniené, R., Koc, A., Svensson, J., and Chawade, A. (2019). GWAS-assisted Genomic Prediction to Predict Resistance to Septoria Tritici Blotch in Nordic Winter Wheat at Seedling Stage. Front. Genet. 10, 1224. doi:10.3389/fgene.2019.01224
Patanè, S. (2018). Improving the Propranolol Treatment of Melanoma. JAMA Oncol. 4 (7), 1013. doi:10.1001/jamaoncol.2018.0598
Pecci, A., Ma, X., Savoia, A., and Adelstein, R. S. (2018). MYH9: Structure, Functions and Role of Non-muscle Myosin IIA in Human Disease. Gene 664, 152–167. doi:10.1016/j.gene.2018.04.048
Raymond, B., Bouwman, A. C., Schrooten, C., Houwing-Duistermaat, J., and Veerkamp, R. F. (2018). Utility of Whole-Genome Sequence Data for Across-Breed Genomic Prediction. Genet. Sel Evol. 50 (1), 27. doi:10.1186/s12711-018-0396-8
Roselan, M. A., Ashari, S. E., Faujan, N. H., Mohd Faudzi, S. M., and Mohamad, R. (2020). An Improved Nanoemulsion Formulation Containing Kojic Monooleate: Optimization, Characterization and In Vitro Studies. Molecules 25 (11), 2616. doi:10.3390/molecules25112616
Schaid, D. J., Rowland, C. M., Tines, D. E., Jacobson, R. M., and Poland, G. A. (2002). Score Tests for Association between Traits and Haplotypes when Linkage Phase Is Ambiguous. Am. J. Hum. Genet. 70 (2), 425–434. doi:10.1086/338688
Sehgal, D., Vikram, P., Sansaloni, C. P., Ortiz, C., Pierre, C. S., Payne, T., et al. (2015). Exploring and Mobilizing the Gene Bank Biodiversity for Wheat Improvement. PLoS One 10 (7), e0132112. doi:10.1371/journal.pone.0132112
Strange, R. C., Ellison, T., Ichii-Jones, F., Bath, J., Hoban, P., Lear, J. T., et al. (1999). Cytochrome P450 CYP2D6 Genotypes. Pharmacogenetics 9 (3), 269–276. doi:10.1097/00008571-199906000-00001
Sun, L., Guan, Z., Wei, S., Tan, R., Li, P., and Yan, L. (2019). Identification of Long Non-coding and Messenger RNAs Differentially Expressed between Primary and Metastatic Melanoma. Front. Genet. 10, 292. doi:10.3389/fgene.2019.00292
Sun, Y., Li, Q., Hu, Y., Sun, Y., Liu, R., Zheng, M., et al. (2016). Genomewide Association Study of Immune Traits in Chicken F2 Resource Population. J. Anim. Breed. Genet. 133 (3), 197–206. doi:10.1111/jbg.12186
Tian, D., Wang, P., Tang, B., Teng, X., Li, C., Liu, X., et al. (2020). GWAS Atlas: a Curated Resource of Genome-wide Variant-Trait Associations in Plants and Animals. Nucleic Acids Res. 48 (D1), D927–D932. doi:10.1093/nar/gkz828
Visscher, P. M., Wray, N. R., Zhang, Q., Sklar, P., McCarthy, M. I., Brown, M. A., et al. (2017). 10 Years of GWAS Discovery: Biology, Function, and Translation. Am. J. Hum. Genet. 101 (1), 5–22. doi:10.1016/j.ajhg.2017.06.005
Wang, J., Wang, Y., Luo, C., Qu, H., and Shu, D. (2014). Accumulation of Melanin in the Peritoneum Causes Black Abdomens in Broilers. Poult. Sci. 93 (3), 742–746. doi:10.3382/ps.2013-03433
Wang, J., and Zhang, Z. (2021). GAPIT Version 3: Boosting Power and Accuracy for Genomic Association and Prediction. Genomics, Proteomics & Bioinformatics S1672-0229 (21), 00177–7. doi:10.1016/j.gpb.2021.08.005
Yang, J., Bakshi, A., Bakshi, A., Zhu, Z., Hemani, G., Vinkhuyzen, A. A. E., et al. (2015). Genetic Variance Estimation with Imputed Variants Finds Negligible Missing Heritability for Human Height and Body Mass index. Nat. Genet. 47 (10), 1114–1120. doi:10.1038/ng.3390
Yin, L., Zhang, H., Tang, Z., Xu, J., Yin, D., Zhang, Z., et al. (2021). rMVP: A Memory-Efficient, Visualization-Enhanced, and Parallel-Accelerated Tool for Genome-wide Association Study. Genomics, Proteomics & Bioinformatics S1672-0229 (21), 00050–00054. doi:10.1016/j.gpb.2020.10.007
Yuan, Y., Peng, D., Gu, X., Gong, Y., Sheng, Z., and Hu, X. (2018). Polygenic Basis and Variable Genetic Architectures Contribute to the Complex Nature of Body Weight -A Genome-wide Study in Four Chinese Indigenous Chicken Breeds. Front. Genet. 9, 229. doi:10.3389/fgene.2018.00229
Zhang, G. X., Fan, Q. C., Zhang, T., Wang, J. Y., Wang, W. H., Xue, Q., et al. (2015). Genome-wide Association Study of Growth Traits in the Jinghai Yellow Chicken. Genet. Mol. Res. 14 (4), 15331–15338. doi:10.4238/2015.November.30.10
Keywords: genome-wide association studies, hyperpigmentation, chicken, carcass traits, high-throughput sequencing
Citation: Zhou G, Liu T, Wang Y, Qu H, Shu D, Jia X and Luo C (2022) Genome-Wide Association Studies Provide Insight Into the Genetic Determination for Hyperpigmentation of the Visceral Peritoneum in Broilers. Front. Genet. 13:820297. doi: 10.3389/fgene.2022.820297
Received: 22 November 2021; Accepted: 09 February 2022;
Published: 01 March 2022.
Edited by:
Xiangdong Ding, China Agricultural University, ChinaReviewed by:
Zhiwu Zhang, Washington State University, United StatesFuping Zhao, Institute of Animal Sciences (CAAS), China
Feng Zhu, China Agricultural University, China
Copyright © 2022 Zhou, Liu, Wang, Qu, Shu, Jia and Luo. This is an open-access article distributed under the terms of the Creative Commons Attribution License (CC BY). The use, distribution or reproduction in other forums is permitted, provided the original author(s) and the copyright owner(s) are credited and that the original publication in this journal is cited, in accordance with accepted academic practice. No use, distribution or reproduction is permitted which does not comply with these terms.
*Correspondence: Xinzheng Jia, eGluemhlbmdqaWFAZm9zdS5lZHUuY24=; Chenglong Luo, bHVvY2hlbmdsb25nQGdkYWFzLmNu
†These authors have contributed equally to this work