 Gabrielle M. Becker
 Julia L. Woods
 Christopher S. Schauer2
 Whit C. Stewart
 Brenda M. Murdoch
95% of researchers rate our articles as excellent or good
Learn more about the work of our research integrity team to safeguard the quality of each article we publish.
Find out more
ORIGINAL RESEARCH article
Front. Genet. , 23 January 2023
Sec. Livestock Genomics
Volume 13 - 2022 | https://doi.org/10.3389/fgene.2022.1081175
This article is part of the Research Topic Genetic Markers Identification for Animal Production and Disease Resistance View all 14 articles
Introduction: Fine wool production is an important source of revenue, accounting for up to 13% of total revenue in extensively managed wool sheep production systems of the United States. The Rambouillet are a predominant breed that excels in wool quality characteristics. Understanding the genetic basis of wool quality characteristics would aid in the development of genomic breeding strategies to facilitate genetic improvement.
Methods: Wool characteristics and DNA were collected for rams enrolled in the North Dakota State University and University of Wyoming annual central performance ram tests over a three-year period (2019–2021, N = 313). The relationships of wool quality characteristics including grease fleece weight adjusted 365 days (wt. 365 adj.), clean fleece wt. 365 adj., staple length 365 adj., average fiber diameter, face wool cover, amount of skin wrinkles and belly wool were evaluated through genome-wide association studies (GWAS), Pearson correlation and ANOVA.
Results: The GWAS identified four genome-wide significant genetic markers (p-value <1.19e-06) and five chromosome-wide significant markers (p-value <1.13e-05) on chromosomes 1, 2, 4, 15, and 19. Significant markers were associated with genes notable for relevant wool biological functions, including the gene ABCC8 which codes for SUR1, an ATP-sensitive potassium channel known to affect hair growth and 60S ribosomal protein L17-like, previously found to be expressed during follicle formation. The strongest Pearson correlation coefficients were identified between clean fleece wt. 365 adj. and grease fleece wt. 365 adj. (r = 0.83) and between clean fleece wt. 365 adj. and staple length 365 adj. (r = 0.53). Additionally, clean fleece wt. 365 adj. was correlated with final body weight (r = 0.35) and scrotal circumference (r = 0.16). Staple length 365 adj. (p-value = 5e-04), average fiber diameter (p-value = .0053) and clean fleece wt. 365 adj. (p-value = .014) were significantly associated with belly wool score.
Discussion: The results of this study provide important insight into the relationships between wool quality characteristics and report specific markers that Rambouillet sheep producers may use to help inform selection and breeding decisions for improved wool quality.
Rambouillet are a predominant United States breed in extensive and semi-extensive production systems. This breed is commonly used in arid and semi-arid rangeland systems as a dual-purpose breed excelling in both fine wool and meat products (Lupton et al., 2007; Burton et al., 2015). Wool production is an important source of strategically timed revenue for sheep producers and fine wool receipts account for up to 13% of total revenue from sheep production in the United States (Liver Marketing Information Center, 2016; Murphy et al., 2019). Wool quality characteristics are well studied in Rambouillet and other fine-wool breeds, yet the genomic mechanisms underpinning these traits are still poorly defined and underutilized in genomic breeding strategies.
Wool quality is driven by clean fleece weight and fiber diameter (Khan et al., 2012) but many characteristics can contribute to the overall economic worth. Central performance ram tests have been developed as a way to systematically evaluate ram growth and performance traits under comparable environmental conditions with demonstration and outreach value for sheep producers (Shelton et al., 1954; Burton et al., 2015). Ram tests are held annually at North Dakota State University (NDSU) and the University of Wyoming (UWY) to evaluate Rambouillet and other wool breeds enrolled by local sheep producers.
Much progress has been made in sheep production through the identification and utilization of genetic markers for disease susceptibility risk or carrier identification (Westaway et al., 1994; Cockett et al., 1999), reproduction traits (Ivanova et al., 2021) and carcass and milk traits (Clop et al., 2006; Selvaggi et al., 2015). Wool quality characteristics have been previously estimated to be moderately to highly heritable, indicating that trait variation is greatly influenced through genetic effects and progress may be made through genomic selectin (Bromley et al., 2000; Burton et al., 2015). Despite such promising heritability estimates, few validated markers exist for use with Rambouillet genomic breeding strategies.
The aim of this study was to utilize data collected during NDSU and UWY central performance ram tests over a three-year period to characterize relationships between traits and with genomic single nucleotide polymorphism (SNP) markers. Pearson correlation and analysis of variance (ANOVA) testing were conducted with wool characteristics grease fleece weight adjusted to 365 days (wt. 365 adj.), clean fleece wt. 365 adj., staple length 365 adj., average fiber diameter, face wool score, skin wrinkle and belly wool scores and production traits including initial and final weights, 140-day average daily gain (ADG) and scrotal circumference. Wool traits were evaluated in individual GWAS with 50 k genotype data to identify markers for use in genomic breeding strategies.
Ram lambs 7 ± 3 months of age from regional (WY, ND, SD, MT, CO) seedstock producers were brought to the University of Wyoming—Laramie Research and Extension Center (Laramie, WY; 41°17′ N, −105°40′ W) or North Dakota State University—Hettinger Research and Extension Center (Hettinger, ND; 46°01′ N, −102°65’ W). Initial body weights were measured and animals were managed as one cohort. Rams were provided ad libitum textured diets (15%–17% crude protein, dry matter basis; 68%–73% total digestible nutrients dry matter basis) for 140 days in a dry-lot management system.
Rams were shorn after a 7–10-day acclimation period and once again at the conclusion of the 140-day feeding period. Upon conclusion of the performance test, scrotal circumference was obtained and wool staple length was measured on shoulder, side and britch, the three measurements averaged, and adjusted from 140-day to 365-day lengths in accordance with the standard practice of the National Sheep Improvement Program (NSIP) for this trait (Wilson and Morrical, 1991). This was calculated by dividing the average staple length by 140, to calculate staple length/day, and then multiplying by 365.
The presence of belly-type wool (belly wool) was scored from 1 to 4. In brief, belly wool is that which grows on the ventral region of the sheep and is characterized as uneven, tender in tensile strength, and compressed in staple length. Phenotypic selection pressure against this “belly wool” fiber type extending beyond the ventral portions of the sheep has been employed to avoid the resultant reduction in overall wool quality (Lupton et al., 2007; Naidoo et al., 2016). Thus, a subjective 1 to 4 scoring system was assigned in the fleece to rams at the end of the test period where: 1 = belly wool restricted to ventral portion, 2 = belly wool restricted to lower 1/3rd of side of fleece, 3 = belly wool extending from 1/3rd to ½ of the side of fleece, 4 = wool extending above ½ of the side of the fleece. Rams were scored linearly between these thresholds with a score of 1 being the minimum and a score of 4 being the highest possible (e.g., a ram with belly wool extending midway between the ventral portion and 1/3 of the side would be scored 1.5).
Similarly, a subjective 1 to 4 scoring system was assigned for face cover where: 1 = no wool cover over top of the head and on the side of muzzle, nor between eyes and ears, 2 = minimal wool cover over top of the head and on side of muzzle, and between eyes and ears, 3 = moderate wool cover over top of the head and on side of muzzle, and between eyes and ears, 4 = heavy wool cover over top of the head and on side of muzzle, and between eyes and ears. A skin wrinkle score was assessed once wool was shorn, where: 1 = no observable wrinkles on body surface 2 = minimal observable wrinkles on body surface 3 = moderate observable wrinkles on body and 4 = heavy wrinkles on body surface.
At shearing, whole fleeces were weighed and then individually cored in a custom-built apparatus (Gerbers of Montana, Inc., Great Falls, MT) consisting of 16 coring tubes (2.2 cm in diameter) that were plunged into and retracted from compacted fleeces by hydraulic cylinders. Cores were split into duplicate 25-g sub-samples for each animal to determine average laboratory scoured yield (American Society for Testing and Materials, 1990) from which clean fleece weight (CFW) was also estimated (Grease Fleece Weight x LSY). Grease and clean fleece weights were adjusted from 140-day to 365-day lengths in the same manner described for staple length (Wilson and Morrical, 1991). A single washed core subsample was analyzed on an Optical-based Fibre Diameter Analyser 2000 (OFDA; BSC Electronics Pty. Ltd., Attadale, Western Australia) to quantify average fiber diameter (A-FD) (IWTO, 2013).
Wool characteristics analyzed included grease fleece weight adjusted to 365 days (wt. 365 adj.) and clean fleece wt. 365 adj. (pounds), average fiber diameter (micron), staple length 365 adj. (inches), face wool score and skin wrinkle score as continuous variables and belly wool score as a categorical variable. All traits were tested for normality using the Shapiro Wilks test in R version 4.2.1 (R Core Team 2021); face and skin wrinkle scores were transformed using a log10 transformation to improve normality. Belly wool scores were grouped into the variable “belly wool category” with rams with no belly-type wool comprising category one (n = 273), rams with belly wool on less than one-third of the side comprising category two (n = 25) and rams with belly wool from one-third of the side to over one-half of the side comprising category three (n = 15). Wool characteristics were analyzed against other production traits including initial body weight and final body weight (pounds), 140-day average daily gain (140 days ADG) and scrotal circumference (centimeters).
The relationships between continuous wool quality characteristics and production traits were investigated with Pearson correlation to describe the strength and direction of linear correlation. One-way analysis of variance (ANOVA) testing was utilized to compare production trait and continuous wool quality trait means between belly wool categories. All ANOVA tests were further analyzed with post hoc Tukey HSD testing to compare p-values between categories (Abdi and Williams, 2010). Ram test location (North Dakota or Wyoming) was evaluated by Welch’s two-sample t-test and ram test year (2019, 2020, 2021) was tested by ANOVA to determine significance for potential GWAS fixed effects (Table 1). Pearson correlation testing were conducted and visualized using the corrplot package in R (Wei and Simko, 2021). ANOVA and Tukey HSD were conducted with the rstatix package and visualized with ggplot2, ggpubr and patchwork in R (Kassambara 2020a; Kassambara 2020b; Pedersen 2020).

Table 1. p-values for location and year against wool characteristics. Wool characteristics were tested against location (NDSU or UWY) with t-test and year (2019, 2020, 2021) with ANOVA.
Ram DNA samples were extracted from either whole blood samples or ear tissue samples stored in tissue sampling units (TSU) collected by University of Wyoming or North Dakota State University personnel. DNA was isolated from blood at the University of Idaho using the phenol-chloroform method described previously (Sambrook et al., 1989) and TSU were provided to AgResearch for DNA extraction. Ram DNA samples were genotyped with either the Applied Biosystems™ Axiom™ Ovine Genotyping Array (50K) consisting of 51,572 single nucleotide polymorphism (SNP) markers (Thermo Fisher Scientific, catalog number 550898) or the AgResearch Sheep Genomics 60K SNP chip consisting of 68,848 SNP markers (GenomNZ, AgResearch, New Zealand). Duplicate markers designed for the same genomic position within a panel were filtered to retain the marker with the highest call rate (CR). Compatible markers were matched by marker name and genome position resulting in a consensus dataset of 44,431 markers in common between the genotype platforms (Davenport et al., 2020). Plink v1.9 was used to merge genotype array data and correct markers designed for opposite strands (Purcell et al., 2007; https://pngu.mgh.harvard.edu/purcell/plink/). Markers were filtered for quality control in the following order: non-autosomal markers (1,019 SNPs), markers with a call rate (CR) <90% (87 SNPs), markers with a minor allele frequency (MAF) <0.01 (1,407 SNPs) and markers with Hardy-Weinberg Equilibrium p-values <1e-50 (30 SNPs) were excluded, for a total of 41,888 high-quality autosomal SNPs retained for final analyses. All rams had a CR of 95% or greater.
Principal component analysis (PCA) was carried out to investigate population structure. Analysis was conducted with plinkv1.9 and visualized with the package ggplot2 in R (Purcell et al., 2007; https://pngu.mgh.harvard.edu/purcell/plink/; Kassambara 2020b; R Core Team 2021). Principal components were plotted PC1 (x-axis) versus PC2 (y-axis). Separate plots were generated for each continuous wool characteristic and rams were color-coded on a gradient scale to indicate their position within the trait distribution.
Continuous wool characteristics were evaluated in genome-wide association studies (GWAS) using the Efficient Mixed-Model Association eXpedited (EMMAX) in SNP and Variation Suite™ v8.9.1 (Golden Helix, Inc., Bozeman, MT, www.goldenhelix.com). The EMMAX models estimated the proportion of variance explained (PVE) for each marker as previously described (Kang et al., 2010). Each trait was initially tested in additive, dominant and recessive inheritance models to identify the model of best fit to be carried through for final analysis. A genomic relationship matrix was fitted as a random effect to account for population structure and sample relatedness in each model (Kang et al., 2010). Ram test location and ram test year were fitted as fixed effects as warranted by t-test or ANOVA p-value for each trait (Table 1) and GWAS results were visualized with the CMplot package in R (Yin 2022). Genome-wide significance was determined by the Bonferroni threshold (p-values <1.19e-06) and a chromosome-wide significance threshold was determined by Bonferroni-adjustment of the number of markers on the largest chromosome (4,412 markers; p-values <1.13e-05). The trait distributions of significant markers were visualized using boxplot figures and significance was further evaluated through analysis of covariance (ANCOVA) and Tukey HSD testing in R with the rstatix, ggplot2, ggpubr, multcomp and patchwork packages (Hothorn et al., 2008; Abdi and Williams, 2010; Kassambara 2020a; Kassambara 2020b; Pedersen 2020; R Core Team 2021). Each ANCOVA model included the same covariate(s) as included in the corresponding GWAS model.
The genomic contexts of significant markers were investigated using GenomeBrowser in NCBI (NCBI Resource Coordinators 2016) for the reference genome ARS-UI_Ramb_v2.0 (Davenport et al., 2022). For each genome-wide and chromosome-wide significant SNP, the reference sequence comprising 100 kb upstream and 100 kb downstream of the marker were evaluated. Markers positioned within a gene were further evaluated for predicted transcription factor binding site (TFBS) score differences between major and minor alleles. The online software FABIAN (Steinhaus et al., 2022) was utilized to test query sequences against detailed transcription factor flexible models (TFFM) compiled within the JASPAR 2022 database (Kahn et al., 2018). Query sequences were comprised of 11 bp, including the five nucleotides flanking the marker on the 5′ and 3′ side in the reference genome. Reference sequences were tested with the major allele as the “wild-type” sequence and the minor allele as “variant” sequence. Where applicable, the Homo sapiens ortholog of each associated gene was queried through ProteomeHD and STRING databases to identify potential interactions between genes/proteins implicated in the study results (Szklarczyk et al., 2015; Kustatscher et al., 2019).
Descriptive statistics of wool characteristics are reported for the 313 rams (Table 2), by test location (Supplementary Table S1) and by test year (Supplementary Table S2). Relationships between continuous wool characteristics were evaluated using Pearson correlation tests. The strongest relationship was identified between clean fleece wt. 365 adj. and grease fleece wt. 365 adj. (r = 0.83; p-value = 3.22e-80) (Table 3). Grease fleece wt. 365 adj. was significantly correlated (p-value <.05) with all traits tested. Average fiber diameter was found to have significant positive correlations with both clean and grease fleece 365 adj. weights (r = 0.19; r = 0.24 and p-value = 6.27e-04; p-value = 1.55e-05) respectively, and clean fleece wt. 365 adj. had significant positive correlations with staple length 365 adj. (r = 0.53; p-value = 6.42e-24) and skin wrinkle score (r = 0.14; p-value = 1.40e-02). Skin wrinkle and face wool scores had a significant positive correlation (r = 0.26; p-value = 4.09e-06). Clean and grease fleece 365 adj. weights were significantly correlated with initial body weight (r = 0.23; r = 0.18), final body weight (r = 0.35; r = 0.43), 140 days ADG (r = 0.25; r = 0.39) and scrotal circumference (r = 0.16; r = 0.24).
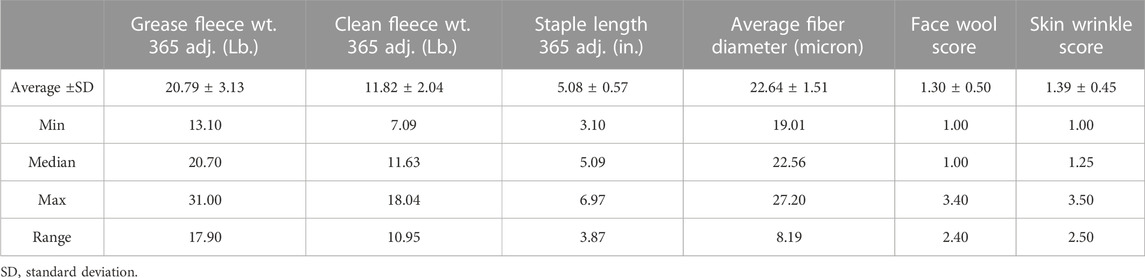
Table 2. Descriptive statistics of wool quality characteristics. Wool quality characteristics of the 313 study rams collected from NDSU and UWY central performance ram tests over 3 years.
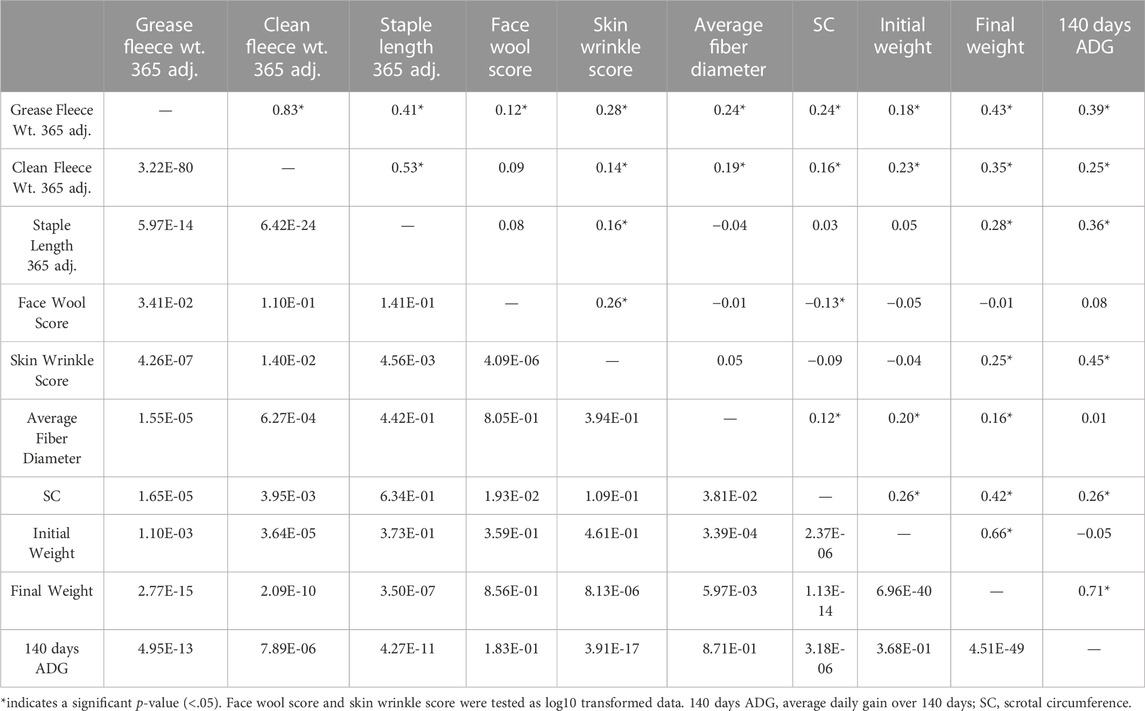
Table 3. Pearson correlation results for ram production and wool characteristics. Correlation coefficients (r) are reported on the upper diagonal and p-values are reported on the lower diagonal.
Belly wool score was found to have significant relationships with initial body weight and final body weight, with rams in category three tending to have greater weights than rams in category one (Tukey HSD p-value ∼0.01) (Figure 1). Significant relationships were identified with wool characteristics staple length 365 adj. (p-value = 5e-04), average fiber diameter (p-value = 0.5.3e-3) and clean fleece wt. 365 adj. (p-value = 1.4e-2). Post hoc Tukey HSD tests revealed that rams within belly wool category two had significantly longer staple length 365 adj. than category one (p-value = 2.93e-4) and category three (p-value = 3.47e-2) rams. Rams with belly wool scores in category three had significantly finer average fiber diameter than rams in category one (p-value = 1.54e-2), although there was no significant difference between rams in categories three and two or two and one. For clean fleece wt. 365 adj., rams in belly wool category two had significantly greater measurements than rams in category one (p-value = 1.05e-2) (Figure 2). The relationships between belly wool and grease fleece wt. 365 adj., face wool score, skin wrinkle score, scrotal circumference and 140 days ADG were also investigated and were not found to be significant.
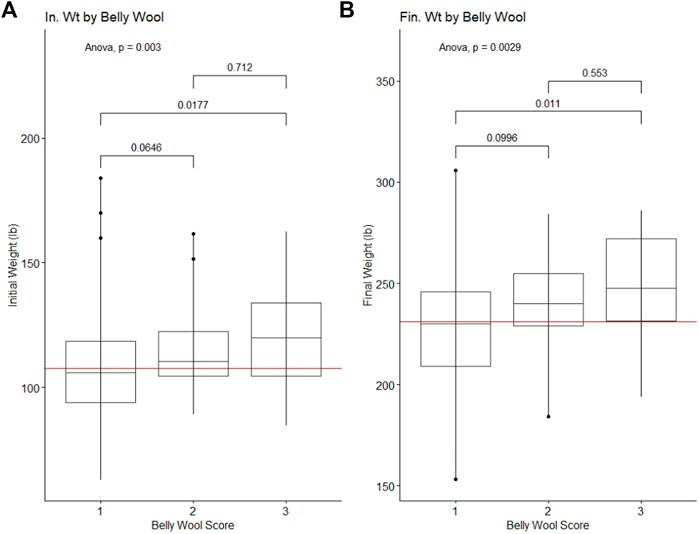
Figure 1. Significant ANOVA results and post-hoc Tukey HSD p-values for production traits tested against belly wool categories. (A) Initial on-test weight, (B) Final test weight. Horizontal red lines indicate the trait mean.
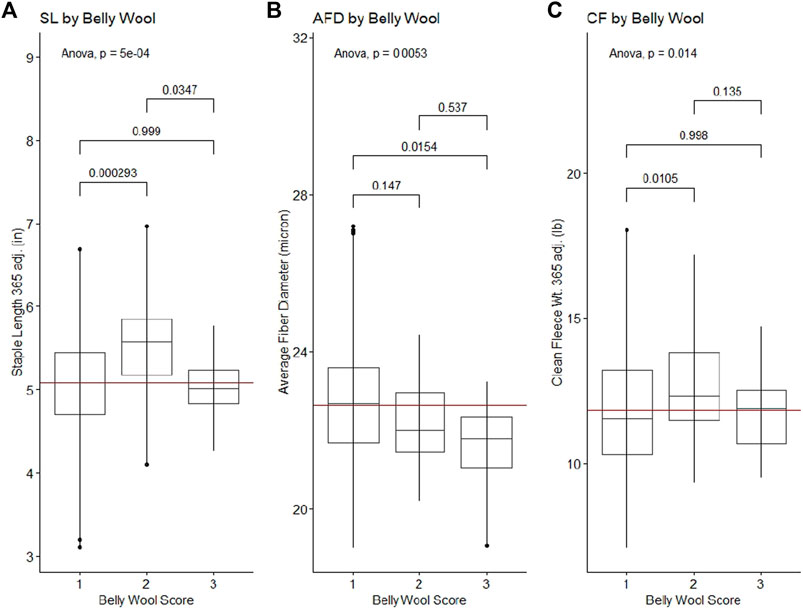
Figure 2. Significant ANOVA results and post-hoc Tukey HSD p-values for wool quality characteristics tested against belly wool categories. (A) Staple length 365 adj., (B) average fiber diameter, (C) clean fleece wt. 365 adj. Horizontal red lines indicate the trait mean.
Principal component analysis (PCA) was used to investigate the population structure as it related to wool quality characteristics. Plots were constructed with principal component 1 (PC1) on the x-axis and principal component 2 (PC2) on the y-axis. PC1 had an eigenvalue of 8.57 and explained 11.17% of the total variance, PC2 had an eigenvalue of 6.91 and explained 9.00% of the total variance (Figure 3). There does not appear to be any specific clustering of phenotypically similar rams in the first or second PC for the wool traits examined. Color-coding of rams by wool quality characteristic distributions indicates these specific characteristics do not segregate with any particular genetic relationships.
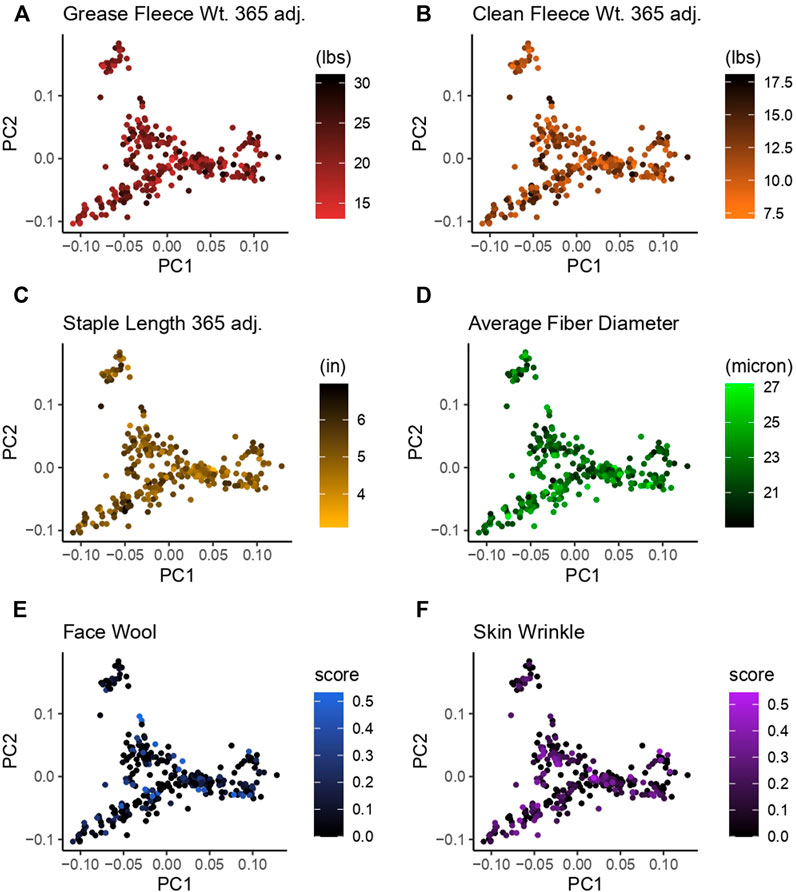
Figure 3. Principal component analysis (PCA) for 313 Rambouillet rams. Each panel represents PC1 plotted on the x-axis and PC2 plotted on the y-axis. Rams are color-coded based on their position within the trait distribution, with the most desirable end of the distribution represented by black. Each panel is color-coded low to high: (A) grease fleece wt. 365 adj., red to black; (B) clean fleece wt. 365 adj., orange to black; (C) staple length 365 adj., yellow to black; (D) average fiber diameter, black to green; (E) face wool score, black to blue, (F) skin wrinkle score, black purple. Face wool and skin wrinkle are colored based on log10 transformed data.
Genome-wide association studies (GWAS) were conducted for each of the six continuous wool quality characteristics. Ram test location and/or ram test year were included as fixed effects for traits with significant (p-value <0.05) ANOVA or t-test results. The results of GWAS are displayed in a multi-trait Manhattan plot (Figure 4A) and individual quantile-quantile (QQ) plots (Figure 4B) and unadjusted p-values are reported (Table 4). Three SNPs on chromosome 1 reached genome-wide significance, including two SNPs associated with average fiber diameter and one SNP associated with clean fleece wt. 365 adj. Significant SNPs for average fiber diameter were identified in a dominant inheritance model (rs404487383 with p-value = 2.53e-07; rs406184307 with p-value = 5.11e-07) and were estimated to explain 8.25% and 7.85% of phenotypic variance. The significant SNP rs420943224 was found to be significant for clean fleece wt. 365 adj. by genome-wide threshold and for grease fleece wt. 365 adj. by chromosome-wide threshold in the corresponding additive inheritance models (rs420943224; p-value = 1.16e-06; p-value = 4.27e-06) with 7.40% and 6.60% proportion of variance explained (PVE), respectively. Two significant SNPs were identified on chromosome 15 for skin wrinkle score (rs402689377; additive) and staple length (OAR15_66653722.1; recessive) and three significant SNPs on chromosomes 2, 4, and 19 were associated with face wool score in a recessive inheritance model (OAR2_197807108.1; rs429550684; OAR19_14805437.1). The PVE for significant SNPs ranged from 6.13% to 8.25% and MAF ranged from 5.13% to 48.40%.
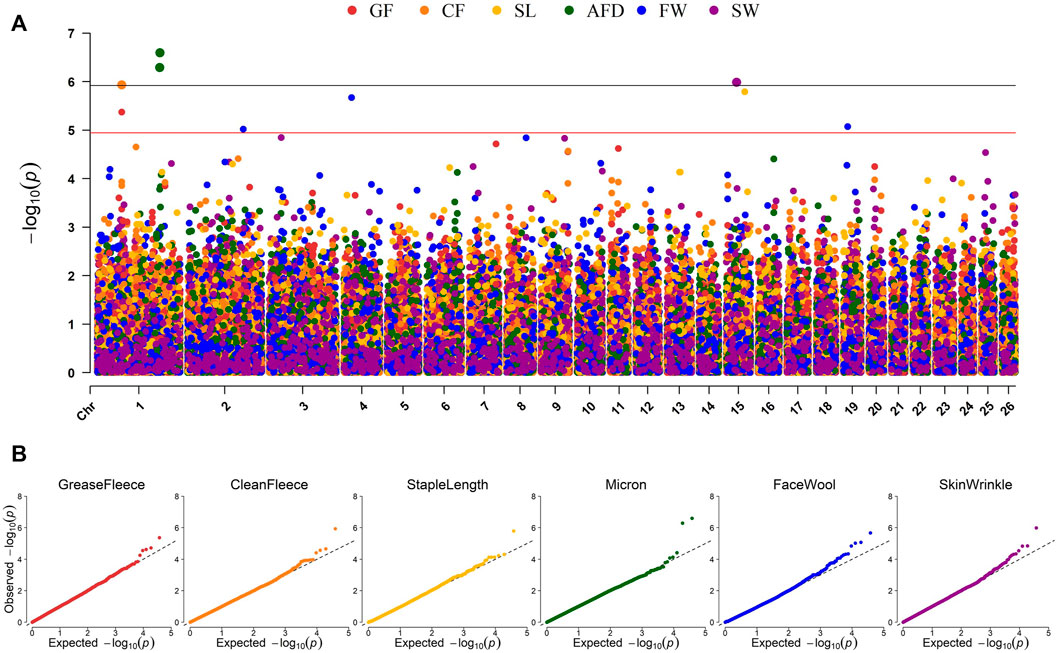
Figure 4. Manhattan and QQ plots representing EMMAX GWAS results for six continuous wool characteristics. (A) Manhattan plot representing the GWAS results of six wool traits. p-values are represented by: grease fleece wt. 365 adj., red; clean fleece wt. 365 adj., orange; staple length 365 adj., yellow; average fiber diameter, green; face wool score, blue; skin wrinkle score, violet. Genome-wide significance is given by p-values <1.19e-06 (black line) and chromosome-wide significance is given by p-values <1.13e-05 (red line). (B) Quantile-Quantile (QQ) plots for each GWAS displaying the expected versus observed–log10 (p-value).
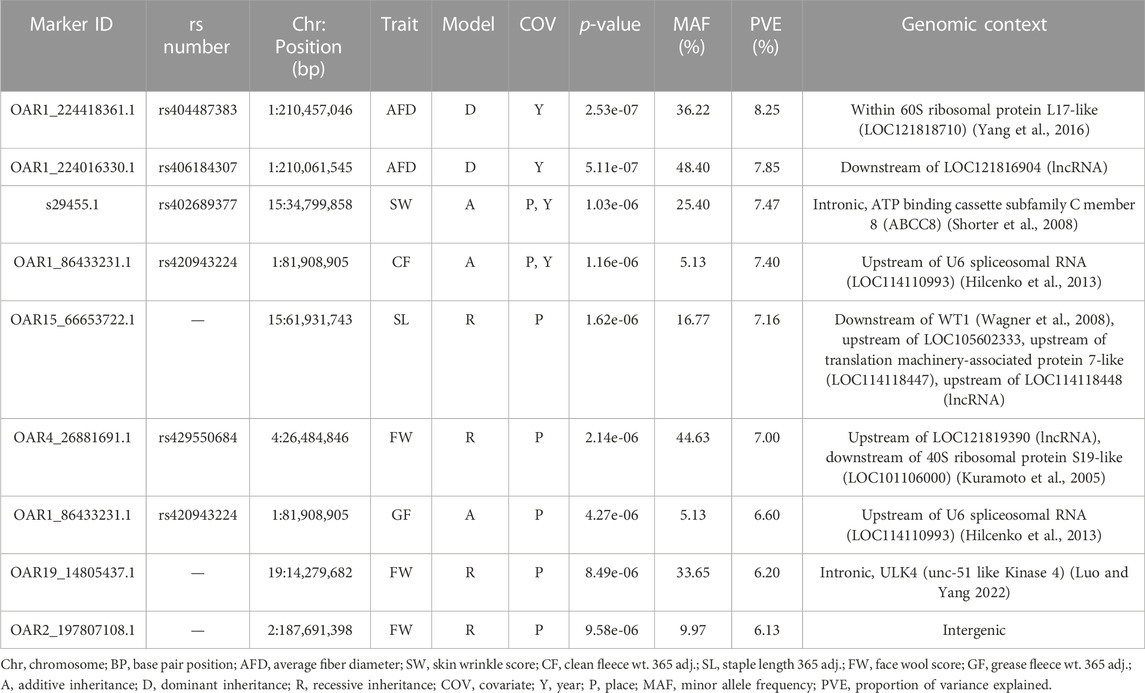
Table 4. Results of GWAS for wool quality characteristics. Each trait was tested individually in an EMMAX model and significant markers (genome-wide, p-values <1.19e-06; chromosome-wide, p-values <1.13e-05) are reported.
The relationships between significant GWAS SNP genotypes and their associated wool quality characteristics were further evaluated through ANCOVA and Tukey HSD tests. The mean trait values for the alternate homozygous genotype, heterozygous genotype and reference homozygous genotype of each SNP are reported (Supplementary Table S3). Rams homozygous for the major allele (CC) at rs406184307 were found to have significantly lower average fiber diameter measurements than rams heterozygous (CT; p-value < 1e-04) or homozygous for the minor allele (TT; p-value = 2.35e-04) (Figure 5A). Presence of one or two copies of the C allele at rs420943224 had significantly greater mean clean fleece wt. 365 adj. than rams homozygous for the major allele (TT) with p-value = 3.49e-04 and 1.79e-02, respectively (Figure 5B). Boxplot figures for remaining significant SNPs are located in Supplementary Figures S1, S2.
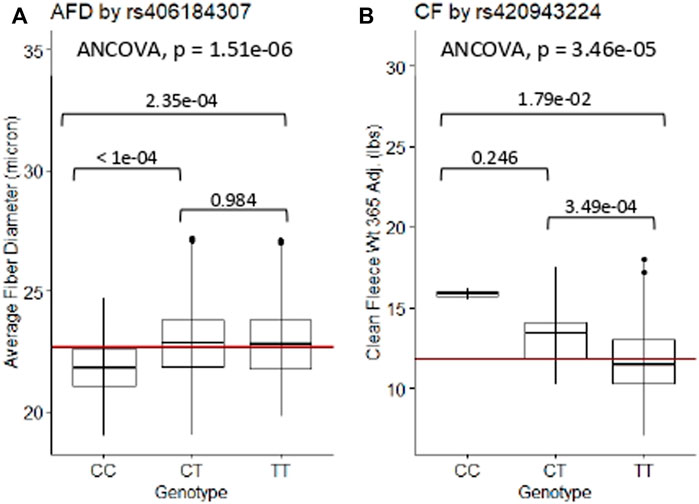
Figure 5. ANCOVA and post-hoc Tukey HSD test results of selected significant SNPs. (A) Average fiber diameter against SNP rs406184307, and (B) Clean fleece wt. 365 adj. against significant SNP rs420943224. The red horizontal lines indicate the trait means. AFD, average fiber diameter; CF, clean fleece wt. 365 adj.
To investigate the genomic context of GWAS results, the reference genome sequence was evaluated for the presence of known or predicted genes (Table 4). The functional consequences of SNPs within genes were further investigated through TFBS prediction analysis. Reference genome sequence for the markers rs404487383 within 60S ribosomal protein L17-like (LOC121818710), rs402689377 within ATP binding cassette subfamily C member 8 (ABCC8) and OAR19_14805437.1 within unc-51 like Kinase 4 (ULK4) were queried for TFBS differences. Score difference between reference and alternate allele sequences of 0.3 or −0.3 or greater are recorded (Table 5). Four SOX family TFBS and a TCF7 TFBS were predicted at rs404487383. Three TFBS with a score difference of +3/-3 or greater were predicted at both rs402689377 and SNP OAR19_14805437.1. Query of Homo sapiens ortholog genes through ProteomeHD and STRING databases revealed a known interaction between human proteins RPL17 and RPS19 with a co-regulation percentile score of 0.9998 (https://www.proteomehd.net/proteomehd/P18621/0.989988).
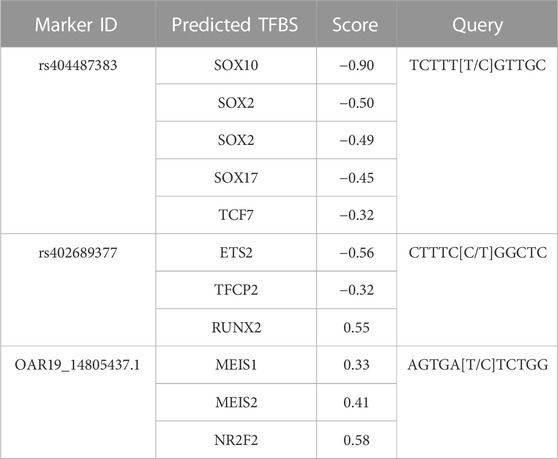
Table 5. Predicted TFBS for SNPs located within genes. Query sequences were analyzed with the major allele as “wild type” and the minor allele as “variant” sequence. The score depicts the difference of wild type versus variant predictiosns.
To the authors’ knowledge, this study represents the first GWAS conducted for wool quality characteristics of Rambouillet sheep. Genetic markers for wool quality traits have been previously identified through GWAS for other breeds of sheep, including Merino and Chinese fine-wool sheep (Wang et al., 2014; Zhao et al., 2021a; Bolormaa et al., 2021; Zhao B. et al., 2021), North-Caucasian sheep (Krivoruchko et al., 2022) and Baluchi sheep (Ebrahimi et al., 2017). Of note, the marker rs410503867 reported for association with super-elite rams (Krivoruchko et al., 2022) was positioned 2.3 Mb from a marker significant for face wool (rs429550684) in the current study. Additionally, Zhao et al. (2021a) reported markers within candidate genes USP13 and NLGN1 associated with staple length and positioned 1.8 Mb and 3.3 Mb, respectively, from markers identified for average fiber diameter (rs404487383; rs406184307) in the present study. Genetic markers for wool quality in sheep have also been suggested through candidate gene studies, including markers associated with genes MTR (Rong et al., 2015), FST (Ma et al., 2017), DKK1 (Mu et al., 2017), KIF16B (Zhao et al., 2021c), FGF5 (Zhao et al., 2021d) and keratin-associated proteins (Gong et al., 2016; Itenge, 2021). In candidate gene studies within the Rambouillet breed, several keratin intermediate filament (KRT) and keratin-associated protein (KAP) genes have been suggested for genomic selection (Mahajan et al., 2017a; Mahajan et al., 2017b; Mahajan et al., 2019; Singh et al., 2022). Despite this body of literature, there is still a need for robust genome-wide investigations for markers associated with wool characteristics of Rambouillet sheep.
The current study investigated a genome-wide distribution of SNP markers for significance against six wool quality characteristics. Of the eight significant SNPs identified, seven markers were located in proximity to at least one gene, and three of these markers were located within a gene. Genes containing significant SNPs have been previously associated with biological functions relevant to follicle growth (Figure 6). The marker rs402689377 associated with skin wrinkle score was located within the gene ATP binding cassette subfamily C member 8 (ABCC8) which codes for SUR1, an ATP-sensitive potassium channel known to affect fiber growth (Shorter et al., 2008). Although ABCC8 has not been previously associated with wool quality in sheep, another potassium voltage-gated channel-related gene (KCNIP4) has been suggested to be related to sheep growth (Mohammadi et al., 2020). The marker OAR19_14805437.1 associated with face wool score was within unc-51 like Kinase 4 (ULK4). Overexpression of the gene ULK4 has been shown to inhibit apoptosis (Luo and Yang 2022). Fiber producing follicles undergo a cycle including active growth, apoptosis-driven involution (catagen), shedding and resting in humans and mice (Botchkareva et al., 2006). The wool follicles of sheep are known to undergo similar cyclic activity with periods of catagen (Liu et al., 2013). The most significant SNP for average fiber diameter, rs404487383, was within 60S ribosomal protein L17-like. This gene was previously found to be one of the 50 most highly expressed genes within regenerating velvet skin of Red deer (Yang et al., 2016), suggesting a potential role in the sheep skin transcriptome.
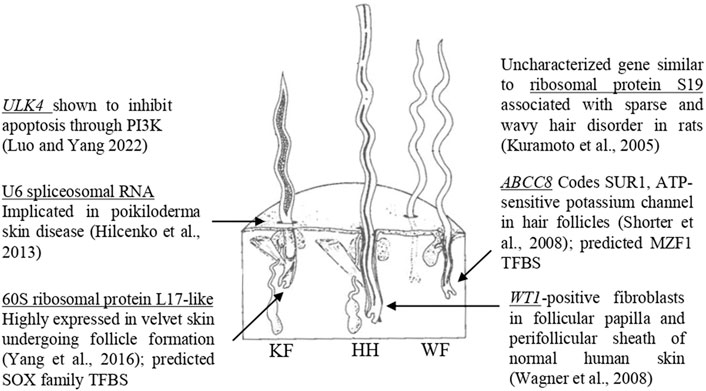
Figure 6. Genes with biological functions relevant to follicular growth. Significant SNPs identified in GWAS are located within or near genes with known biological roles relevant to skin and follicular growth, including ULK4 (Luo and Yang, 2022), U6 spliceosomal RNA (Hilcenko et al., 2013), 60S ribosomal protein L17-like (Yang et al., 2016), ribosomal protein S19 (Kuramoto et al., 2005), ABCC8 (Shorter et al., 2008) and WT1 (Wagner et al., 2008). The figure illustrates the three types of fibers which comprise sheep’s wool, adapted from Bradford and Fitzhugh (1983). KF, kemp fiber; HH, heterotype hair; WF, wool fiber.
Significant SNPs were located in regions containing biologically relevant genes. The marker rs429550684 was significant for face wool score and was located downstream of 40S ribosomal protein S19-like (LOC121818710). The gene similar to ribosomal protein S19 (LOC364797) was identified within the sparse and wavy hair (swh) locus of rats (Kuramoto et al., 2005), although annotation for this gene has since been withdrawn from the Rattus norvegicus assembly as it was not predicted in a later annotation (NCBI Gene ID: 364797). The Homo sapiens orthologs of 40S ribosomal protein S19-like and 60S ribosomal protein L17-like have known protein interactions, suggesting a potential for similar interaction of these proteins in sheep. The swh locus is known to be associated with follicle hypoplasia, as well as impaired development of the sebaceous glands and mammary glands (Kuramoto et al., 2005). The marker rs420943224 associated with clean fleece wt. 365 adj. and grease fleece wt. 365 adj. was located upstream of U6 spliceosomal RNA (LOC114110993). A spliceosomal U6 small nuclear RNA has been previously indicated in poikiloderma with neutropenia (Hilcenko et al., 2013). Finally, the marker OAR15_66653722.1 associated with staple length 365 adj. was located downstream of WT1, which has been identified in fibroblast cells that can induce and support hair growth (Wagner et al., 2008). The proximity of significant SNPs to these genes suggests the possibility for linkage disequilibrium with untested causative markers, or the possibility for identified SNPs to be positioned within transcriptional regulatory elements. Further work is needed to elucidate the implications of these associations.
Prediction analysis for TFBS suggested binding motifs for SOX2, SOX3, SOX10 and/or SOX17 may have less specific binding abilities between the alternate and reference alleles at rs404487383. SOX2 is expressed in mesenchymal cells during skin development (Sarkar and Hochedlinger, 2013), and both SOX2 and SOX3 are involved in the development of inner-ear hair cells in zebrafish (Gou et al., 2018). The gene SOX10 has been shown to play an important role in the development of vestibular hair cells in the pig (Qi et al., 2022). These data suggest potential functional ramifications of variant alleles associated with wool quality characteristics.
The trait correlations reported in the current study largely agree with previously published work for Rambouillet sheep. Clean fleece wt. 365 adj. is a component of grease fleece wt. 365 adj., which is reflected in their robust correlation in this study and previous (Vesely et al., 1970). Clean fleece wt. 365 adj. was significantly correlated with both staple length 365 adj. and average fiber diameter, which agrees with relationships previously reported for clean fleece and fiber diameter (Lupton et al., 2002; Hanford et al., 2005; Mahajan et al., 2018). This study found no significant correlation between staple length 365 adj. and average fiber diameter, although staple length and fiber diameter (wool grade) have been previously reported to be either favorably or unfavorably related (Lupton et al., 2002; Hanford et al., 2005). There was a significant positive relationship between clean fleece wt. 365 adj. and scrotal circumference, which was similar to observations made in Merino rams and in other central performance ram tests (Duguma et al., 2002; Lupton et al., 2002). The presence of significant correlations between wool quality characteristics indicates that progress in one trait may either positively or negatively impact progress in another trait; for instance, gains in clean fleece weight may come at the expense of fiber diameter.
Similar associations as those reported between belly wool category and wool quality characteristics in the present study have been previously noted in Merino sheep (Naidoo et al., 2016). Genetic correlation between wool quality and ‘creeping belly’ scores, representing the extent of belly-type wool on the side of the sheep, were reported to be −0.55 ± 0.27. This relationship was interpreted as sheep with more acceptable wool quality also tended to have less acceptable scores for creeping belly. Creeping belly has been reported to be correlated with body weight in Afrino sheep (Snyman and Olivier, 2002), and importantly, has been reported to have an unfavorable correlation with reproduction (Snyman and Olivier, 2002). The current study suggested potential positive phenotypic associations between belly score category two and staple length 365 adj., average fiber diameter, clean fleece wt. 365 adj. and ram initial and final body weights, although further evaluation is needed to understand other important associations with belly wool in Rambouillet sheep.
The PCA investigated in this study indicated an overall lack of segregation of genetically similar animals with any of the specific wool quality characteristics tested by PC1 or PC2, suggesting an opportunity for genetic progress for wool quality characteristics. Previously reported heritabilities suggest that genetics are a major factor in wool quality phenotypes and genetic improvements should be possible even in the short term (Medrado et al., 2021). This study suggests specific genetic markers that may be used in marker-assisted selection programs for wool quality in Rambouillet sheep to make gains in economically important traits such as average fiber diameter and clean fleece weight. Interpretation of the current study is somewhat limited by sample size, as some genotype categories (such as CC at rs420943224) have as few as two rams observed. Improving sample sizes in underrepresented genotypes would improve statistical power and overall understanding of genotypic relationships with traits.
The datasets have been deposited to EVA repository: https://urldefense.com/v3/__https://www.ebi.ac.uk/eva/?eva-study=PRJEB58836__;!!JYXjzlvb!gEHSLvJ5dvR-1g4UW6svxSQlbb8v0CZDShYTgf1HgGPLj3rxwSZ0_u0CaQFKVS5cKDCOr7UFqZw7zvCuQZ4qjmD-Q$ Accession Details are: Project: PRJEB58836, Analyses: ERZ15609617.
The animal study was reviewed and approved by North Dakota State University Institute for Animal Care and Use Committee (# 20210012). Written informed consent was obtained from the owners for the participation of their animals in this study.
CS, WS, and BM conceived the study, WS and CS and University staff oversaw animal care, handling and data collection, GB, JW, CS, WS, and BM conducted research work and contributed to manuscript writing and editing. All authors read and agree to the manuscript.
This research was funded by the Idaho Global Entrepreneurial Mission and USDA-NIFA-IDA1566 and Hatch-Multistate “Increased Efficiency of Sheep Production” project accession no. 1025808 from the USDA National Institute of Food and Agriculture.
The authors would like to thank the sheep producers who contributed to the success of this study and acknowledge AgResearch and the Animal Genomics team for access to the AgResearch Sheep Genomics 60K SNP chip.
The authors declare that the research was conducted in the absence of any commercial or financial relationships that could be construed as a potential conflict of interest.
All claims expressed in this article are solely those of the authors and do not necessarily represent those of their affiliated organizations, or those of the publisher, the editors and the reviewers. Any product that may be evaluated in this article, or claim that may be made by its manufacturer, is not guaranteed or endorsed by the publisher.
The Supplementary Material for this article can be found online at: https://www.frontiersin.org/articles/10.3389/fgene.2022.1081175/full#supplementary-material
365 adj., adjusted to 365 days; CO, Colorado; MT, Montana; ND, North Dakota; SD, South Dakota; WY, Wyoming.
Abdi, H., and Williams, L. J. (2010). Tukey’s honestly significant difference (HSD) test. Encycl. Res. Des. 3 (1), 1–5.
American Society for Testing and Materials (ASTM) (1990). Annual book of ASTM standards. Standard test method D584. Wool content of raw wool-laboratory scale. Philadelphia, PA: ASTM, 193–197. Sec. 7, Vol. 07.01.
Bolormaa, S., Swan, A. A., Stothard, P., Khansefid, M., Moghaddar, N., Duijvesteijn, N., et al. (2021). A conditional multi-trait sequence GWAS discovers pleiotropic candidate genes and variants for sheep wool, skin wrinkle and breech cover traits. Genet. Sel. Evol. 53 (1), 58–14. doi:10.1186/s12711-021-00651-0
Botchkareva, N. V., Ahluwalia, G., and Shander, D. (2006). Apoptosis in the hair follicle. J. Investigative Dermatology 126 (2), 258–264. doi:10.1038/sj.jid.5700007
Bradford, G. E., and Fitzhugh, H. A. (1983). “Hair sheep: A general description,” in Hair sheep of western africa and the americas: A genetic Resource for the tropics. Editors H. A. Fitzhugh, and G. E. Bradford (Boulder, CO: Westview Press), 3. doi:10.1201/9780429049118
Bromley, C. M., Snowder, G. D., and Van Vleck, L. D. (2000). Genetic parameters among weight, prolificacy, and wool traits of Columbia, Polypay, Rambouillet, and Targhee sheep. J. Animal Sci. 78 (4), 846–858. doi:10.2527/2000.784846x
Burton, D. J., Ludden, P. A., Stobart, R. H., and Alexander, B. M. (2015). 50 years of the Wyoming ram test: How sheep have changed. J. Animal Sci. 93 (3), 1327–1331. doi:10.2527/jas.2014-8150
Clop, A., Marcq, F., Takeda, H., Pirottin, D., Tordoir, X., Bibé, B., et al. (2006). A mutation creating a potential illegitimate microRNA target site in the myostatin gene affects muscularity in sheep. Nat. Genet. 38 (7), 813–818. doi:10.1038/ng1810
Cockett, N. E., Shay, T. L., Beever, J. E., Nielsen, D., Albretsen, J., Georges, M., et al. (1999). Localization of the locus causing Spider Lamb Syndrome to the distal end of ovine Chromosome 6. Mamm. Genome 10 (1), 35–38. doi:10.1007/s003359900938
Davenport, K. M., Bickhart, D. M., Worley, K., Murali, S. C., Salavati, M., Clark, E. L., et al. (2022). An improved ovine reference genome assembly to facilitate in-depth functional annotation of the sheep genome. GigaScience 11, giab096. doi:10.1093/gigascience/giab096
Davenport, K. M., Hiemke, C., McKay, S. D., Thorne, J. W., Lewis, R. M., Taylor, T., et al. (2020). Genetic structure and admixture in sheep from terminal breeds in the United States. Anim. Genet. 51 (2), 284–291. doi:10.1111/age.12905
Dong, S., Ying, S., Kojima, T., Shiraiwa, M., Kawada, A., Méchin, M. C., et al. (2008). Crucial roles of MZF1 and Sp1 in the transcriptional regulation of the peptidylarginine deiminase type I gene (PADI1) in human keratinocytes. J. investigative dermatology 128 (3), 549–557. doi:10.1038/sj.jid.5701048
Duguma, G., Cloete, S. W. P., Schoeman, S. J., and Jordaan, G. F. (2002). Genetic parameters of testicular measurements in Merino rams and the influence of scrotal circumference on total flock fertility. South Afr. J. animal Sci. 32 (2), 76–82. doi:10.4314/sajas.v32i2.3748
Ebrahimi, F., Gholizadeh, M., Rahimi-Mianji, G., and Farhadi, A. (2017). Detection of QTL for greasy fleece weight in sheep using a 50 K single nucleotide polymorphism chip. Trop. animal health Prod. 49 (8), 1657–1662. doi:10.1007/s11250-017-1373-x
Gong, H., Zhou, H., Forrest, R. H., Li, S., Wang, J., Dyer, J. M., et al. (2016). Wool keratin-associated protein genes in sheep—A review. Genes 7 (6), 24. doi:10.3390/genes7060024
Gou, Y., Vemaraju, S., Sweet, E. M., Kwon, H. J., and Riley, B. B. (2018). sox2 and sox3 Play unique roles in development of hair cells and neurons in the zebrafish inner ear. Dev. Biol. 435 (1), 73–83. doi:10.1016/j.ydbio.2018.01.010
Hanford, K. J., Van Vleck, L. D., and Snowder, G. D. (2005). Estimates of genetic parameters and genetic change for reproduction, weight, and wool characteristics of Rambouillet sheep. Small Ruminant Res. 57 (2-3), 175–186. doi:10.1016/j.smallrumres.2004.07.003
Hilcenko, C., Simpson, P. J., Finch, A. J., Bowler, F. R., Churcher, M. J., Jin, L., et al. (2013). Aberrant 3' oligoadenylation of spliceosomal U6 small nuclear RNA in poikiloderma with neutropenia. J. Am. Soc. Hematol. 121 (6), 1028–1038. doi:10.1182/blood-2012-10-461491
Hothorn, T., Bretz, F., and Westfall, P. (2008). Simultaneous inference in general parametric models. Biometrical J. 50 (3), 346–363. doi:10.1002/bimj.200810425
International Wool Textile Organization (IWTO) (2013). IWTO-47–2013 measurement of the mean and distri- bution of fibre diameter of wool using an Optical Fibre Diameter Analyser (OFDA). Brussels, Belgium: IWTO.
Itenge, T. O. (2021). Application of PCR technique to detect polymorphism of the KRTAP1. 1 gene in three sheep breeds-A review. Anal. Chemistry-Advancement, Perspect. Appl. doi:10.5772/intechopen.96941
Ivanova, T., Stoikova-Grigorova, R., Bozhilova-Sakova, M., Ignatova, M., Dimitrova, I., and Koutev, V. (2021). Phenotypic and genetic characteristics of fecundity in sheep. A review. Bulg. J. Agric. Sci. 27 (5), 1002–1008.
Kang, H. M., Sul, J. H., Service, S. K., Zaitlen, N. A., Kong, S. Y., Freimer, N. B., et al. (2010). Variance component model to account for sample structure in genome-wide association studies. Nat. Genet. 42 (4), 348–354. doi:10.1038/ng.548
Kassambara, A. (2020b). Ggpubr: 'ggplot2' based publication ready plots. R package version 0.4.0 Available at: https://CRAN.R-project.org/package=ggpubr.
Kassambara, A. (2020a). rstatix: Pipe-friendly framework for basic statistical tests. R package version 0.6. 0.
Khan, A., Fornes, O., Stigliani, A., Gheorghe, M., Castro-Mondragon, J. A., Van Der Lee, R., et al. (2018). Jaspar 2018: Update of the open-access database of transcription factor binding profiles and its web framework. Nucleic acids Res. 46 (D1), D260–D266. doi:10.1093/nar/gkx1126
Khan, M. J., Abbas, A., Ayaz, M., Naeem, M., Akhter, M. S., and Soomro, M. H. (2012). Factors affecting wool quality and quantity in sheep. Afr. J. Biotechnol. 11 (73), 13761–13766. doi:10.5897/AJBX11.064
Krivoruchko, A., Yatsyk, O., and Kanibolockaya, A. (2022). New candidate genes of high productivity in North-Caucasian sheep using genome-wide association study (GWAS). Anim. Gene 23, 200119. doi:10.1016/j.angen.2021.200119
Kuramoto, T., Morimura, K., Nomoto, T., Namiki, C., Hamada, S., Fukushima, S., et al. (2005). Sparse and wavy hair: A New model for hypoplasia of hair follicle and mammary glands on rat chromosome 17. J. Hered. 96 (4), 339–345. doi:10.1093/jhered/esi053
Kustatscher, G., Grabowski, P., Schrader, T. A., Passmore, J. B., Schrader, M., and Rappsilber, J. (2019). Co-regulation map of the human proteome enables identification of protein functions. Nat. Biotechnol. 37 (11), 1361–1371. doi:10.1038/s41587-019-0298-5
Liu, G., Liu, R., Li, Q., Tang, X., Yu, M., Li, X., et al. (2013). Identification of microRNAs in wool follicles during anagen, catagen, and telogen phases in Tibetan sheep. PloS one 8 (10), e77801. doi:10.1371/journal.pone.0077801
Liver Marketing Information Center (LMIC) (2016). Sheep cost of production study. Available at: http://lmic.info/page/cost-sheep-produc- tion-budget-sponsored-american-sheep-industry. [accessed October 10, 2022].
Luo, W., and Yang, J. (2022). Schizophrenia predisposition gene Unc-51-like kinase 4 for the improvement of cerebral ischemia/reperfusion injury. Mol. Biol. Rep. 49, 2933–2943. doi:10.1007/s11033-021-07108-z
Lupton, C. J., Huston, J. E., Craddock, B. F., Pfeiffer, F. A., and Polk, W. L. (2007). Comparison of three systems for concurrent production of lamb meat and wool. Small Ruminant Res. 72 (2-3), 133–140. doi:10.1016/j.smallrumres.2006.10.002
Lupton, C. J., Waldron, D. F., and Pfeiffer, F. A. (2002). Interrelationships of traits measured on fine-wool rams during a central performance test. Sheep Goat Res. J. 18, 1–7.
Ma, G. W., Chu, Y. K., Zhang, W. J., Qin, F. Y., Xu, S. S., Yang, H., et al. (2017). Polymorphisms of FST gene and their association with wool quality traits in Chinese Merino sheep. PLoS One 12 (4), e0174868. doi:10.1371/journal.pone.0174868
Mahajan, V., Das, A. K., Taggar, R. K., Kumar, D., and Khan, N. (2019). Keratin-associated protein (kap) 8 gene polymorphism and its association with wool traits in rambouillet sheep. Int. J. Life Sci. Appl. Sci. 1 (1), 50.
Mahajan, V., Das, A. K., Taggar, R. K., Kumar, D., Khan, N., Sharma, R., et al. (2018). Effect of non-genetic factors on some wool traits in Rambouillet sheep. Int. J. Curr. Microbiol. Appl. Sci. 7, 3958–3965.
Mahajan, V., Das, A. K., Taggar, R. K., Kumar, D., and Sharma, R. (2017a). Association of polymorphic variants of KAP 1.3 gene with wool traits in Rambouillet sheep. Indian J. Animal Sci. 87 (10), 1237–1242.
Mahajan, V., Das, A. K., Taggar, R. K., Kumar, D., and Sharma, R. (2017b). Polymorphism of keratin-associated protein (KAP) 7 gene and its association with wool traits in Rambouillet sheep. Indian J. Animal Sci. 88, 206–209.
Medrado, B. D., Pedrosa, V. B., and Pinto, L. F. B. (2021). Meta-analysis of genetic parameters for economic traits in sheep. Livest. Sci. 247, 104477. doi:10.1016/j.livsci.2021.104477
Mohammadi, H., Rafat, S. A., Moradi Shahrbabak, H., Shodja, J., and Moradi, M. H. (2020). Genome-wide association study and gene ontology for growth and wool characteristics in Zandi sheep. J. Livest. Sci. Technol. 8 (2), 45–55. doi:10.22103/JLST.2020.15795.1317
Mu, F., Rong, E., Jing, Y., Yang, H., Ma, G., Yan, X., et al. (2017). Structural characterization and association of ovine Dickkopf-1 gene with wool production and quality traits in Chinese Merino. Genes 8 (12), 400. doi:10.3390/genes8120400
Murphy, T. W., Stewart, W. C., Notter, D. R., Mousel, M. R., Lewis, G. S., and Taylor, J. B. (2019). Evaluation of rambouillet, polypay, and romanov–white Dorper× rambouillet ewes mated to terminal sires in an extensive rangeland production system: Body weight and wool characteristics. J. Animal Sci. 97 (4), 1568–1577. doi:10.1093/jas/skz070
Naidoo, P., Olivier, J. J., Cloete, S. W. P., and Morris, J. (2016). Does selecting for finer wool result in higher incidence of creeping belly in the South African Dohne Merino sheep breed? Agriprobe 13 (2), 49–53.
NCBI Resource Coordinators (2016). Database resources of the national center for biotechnology information. Nucleic acids Res. 44 (D1), D7–D19. doi:10.1093/nar/gkv1290
Pedersen, T. (2020). patchwork: The composer of plots. R package version 1.1.1 Available at: https://CRAN.R-project.org/package=patchwork.
Purcell, S., Neale, B., Todd-Brown, K., Thomas, L., Ferreira, M. A. R., Bender, D., et al. (2007). Plink: A tool set for whole-genome association and population-based linkage analyses. Am. J. Hum. Genet. 81 (3), 559–575. doi:10.1086/519795
Qi, J. C., Jiang, Q. Q., Ma, L., Yuan, S. L., Sun, W., Yu, L. S., et al. (2022). Sox10 gene is required for the survival of saccular and utricular hair cells in a porcine model. Mol. Neurobiol. 59 (6), 3323–3335. doi:10.1007/s12035-021-02691-5
R Core Team (2021). R: A language and environment for statistical computing. Vienna, Austria: R Foundation for Statistical Computing.
Rong, E. G., Yang, H., Zhang, Z. W., Wang, Z. P., Yan, X. H., Li, H., et al. (2015). Association of methionine synthase gene polymorphisms with wool production and quality traits in Chinese Merino population. J. animal Sci. 93 (10), 4601–4609. doi:10.2527/jas.2015-8963
Sambrook, J., Fritsch, E. F., and Maniatis, T. (1989). Molecular Cloning: A Laboratory Manual. 2nd Edn Cold Spring Harbor, NY: Cold Spring Harbor Laboratory Press.
Sarkar, A., and Hochedlinger, K. (2013). The sox family of transcription factors: Versatile regulators of stem and progenitor cell fate. Cell stem Cell 12 (1), 15–30. doi:10.1016/j.stem.2012.12.007
Selvaggi, M., Laudadio, V., Dario, C., and Tufarelli, V. (2015). β-Lactoglobulin gene polymorphisms in sheep and effects on milk production traits: A review. Adv. Anim. Vet. Sci. 3 (9), 478–484. doi:10.14737/journal.aavs/2015/3.9.478.484
Shelton, M., Miller, J. C., Magee, W. T., and Hardy, W. T. (1954). A summary of four years work in ram progeny and performance testing. J. animal Sci. 13 (1), 215–228. doi:10.2527/jas1954.131215x
Shorter, K., Farjo, N. P., Picksley, S. M., and Randall1, V. A. (2008). Human hair follicles contain two forms of ATP-sensitive potassium channels, only one of which is sensitive to minoxidil. FASEB J. 22 (6), 1725–1736. doi:10.1096/fj.07-099424
Singh, V. P., Taggar, R. K., Chakraborty, D., Pratap, B., Singh, P. K., Singh, S., et al. (2022). KRT 1.2 gene polymorphism & its association with wool traits in Rambouillet sheep. Pharma Innovation J. SP- 11 (6), 2619–2621.
SNP (2022), Snp & variation suite ™, Version 8.9.1, [Software]. Bozeman, MT: Golden Helix, Inc. Available at: http://www.goldenhelix.com.
Snyman, M. A., and Olivier, W. J. (2002). Correlations of subjectively assessed fleece and conformation traits with production and reproduction in Afrino sheep. South Afr. J. Animal Sci. 32 (2), 88–96. doi:10.4314/sajas.v32i2.3750
Szklarczyk, D., Franceschini, A., Wyder, S., Forslund, K., Heller, D., and Huerta-Cepas, J. (2015). STRING v10: protein–protein interaction networks, integrated over the tree of life. Nucleic acids research 43 (D1), D447–D452. doi:10.1093/nar/gku1003
Vesely, J. A., Peters, H. F., Slen, S. B., and Robison, O. W. (1970). Heritabilities and genetic correlations in growth and wool traits of Rambouillet and Romnelet sheep. J. animal Sci. 30 (2), 174–181. doi:10.2527/jas1970.302174x
Wagner, N., Panelos, J., Massi, D., and Wagner, K. D. (2008). The Wilms’ tumor suppressor WT1 is associated with melanoma proliferation. Pflügers Archiv-European J. Physiology 455 (5), 839–847. doi:10.1007/s00424-007-0340-1
Wang, Z., Zhang, H., Yang, H., Wang, S., Rong, E., Pei, W., et al. (2014). Genome-wide association study for wool production traits in a Chinese Merino sheep population. PloS one 9 (9), e107101. doi:10.1371/journal.pone.0107101
Wei, T., and Simko, V. (2021). R package 'corrplot': Visualization of a correlation matrix. Version 0.92.
Westaway, D., Zuliani, V., Cooper, C. M., Da Costa, M., Neuman, S., Jenny, A. L., et al. (1994). Homozygosity for prion protein alleles encoding glutamine-171 renders sheep susceptible to natural scrapie. Genes & Dev. 8 (8), 959–969. doi:10.1101/gad.8.8.959
Wilson, D. E., and Morrical, D. G. (1991). The national sheep improvement program: A review. J. animal Sci. 69 (9), 3872–3881. doi:10.2527/1991.6993872x
Yang, X., Chen, Y., Liu, X., Liu, Q., Pi, X., Liu, Y., et al. (2016). De novo characterization of velvet skin transcriptome at the antlers tips of red deer (Cervus elaphus) and analysis of growth factors and their receptors related to regeneration. Pak. J. Zoology 48 (1).
Yin, L. (2022). CMplot: Circle manhattan plot. R package version 4.1.0 Available at: https://CRAN.R-project.org/package=CMplot.
Zhao, H., Guo, T., Lu, Z., Liu, J., Zhu, S., Qiao, G., et al. (2021a). Genome-wide association studies detects candidate genes for wool traits by re-sequencing in Chinese fine-wool sheep. BMC genomics 22, 127. doi:10.1186/s12864-021-07399-3
Zhao, B., Luo, H., Huang, X., Wei, C., Di, J., Tian, Y., et al. (2021b). Integration of a single-step genome-wide association study with a multi-tissue transcriptome analysis provides novel insights into the genetic basis of wool and weight traits in sheep. Genet. Sel. Evol. 53 (1), 56–14. doi:10.1186/s12711-021-00649-8
Zhao, H., Hu, R., Li, F., and Yue, X. (2021c). Two strongly linked blocks within the KIF16B gene significantly influence wool length and greasy yield in fine wool sheep (Ovis aries). Electron. J. Biotechnol. 53, 23–32. doi:10.1016/j.ejbt.2021.05.003
Keywords: 60S ribosomal protein L17-like, ABCC8, central performance ram test, GWAS, sheep production
Citation: Becker GM, Woods JL, Schauer CS, Stewart WC and Murdoch BM (2023) Genetic association of wool quality characteristics in United States Rambouillet sheep. Front. Genet. 13:1081175. doi: 10.3389/fgene.2022.1081175
Received: 26 October 2022; Accepted: 20 December 2022;
Published: 23 January 2023.
Edited by:
Adnan Khan, Agricultural Genomics Institute at Shenzhen (CAAS), ChinaReviewed by:
Sangang He, Xinjiang Academy of Animal Science, ChinaCopyright © 2023 Becker, Woods, Schauer, Stewart and Murdoch. This is an open-access article distributed under the terms of the Creative Commons Attribution License (CC BY). The use, distribution or reproduction in other forums is permitted, provided the original author(s) and the copyright owner(s) are credited and that the original publication in this journal is cited, in accordance with accepted academic practice. No use, distribution or reproduction is permitted which does not comply with these terms.
*Correspondence: Brenda M. Murdoch, Ym11cmRvY2hAdWlkYWhvLmVkdQ==
Disclaimer: All claims expressed in this article are solely those of the authors and do not necessarily represent those of their affiliated organizations, or those of the publisher, the editors and the reviewers. Any product that may be evaluated in this article or claim that may be made by its manufacturer is not guaranteed or endorsed by the publisher.
Research integrity at Frontiers
Learn more about the work of our research integrity team to safeguard the quality of each article we publish.