 Shasthree Taduri1,2
 Raju Bheemanahalli1Chathurika Wijewardana1
 Ajaz A. Lone1
 Stephen L. Meyers3
 Mark Shankle4
 Wei Gao5
 K. Raja Reddy1*
- 1Department of Plant and Soil Sciences, Mississippi State University, Mississippi State, MS, United States
- 2Department of Biotechnology, Kakatiya University, Warangal, India
- 3Department of Horticulture and Landscape Architecture, Purdue University, West Lafayette, IN, United States
- 4Pontotoc Ridge-Flatwoods Branch Experiment Station, North Mississippi Research and Extension Center, Mississippi State University, Pontotoc, MS, United States
- 5USDA UVB Monitoring and Research Program, Natural Resource Ecology Laboratory, Department of Ecosystem Science and Sustainability, Colorado State University, Fort Collins, CO, United States
Plants are sensitive to changes projected in climates, such as elevated carbon dioxide (eCO2), high temperature (T), and drought stress (DS), which affect crop growth, development, and yield. These stresses, either alone or in combination, affect all aspects of sweetpotato plant growth and development, including storage root development and yield. We tested three sweetpotato cultivars (Beauregard, Hatteras, and LA1188) responses to eight treatments (Control, DS, T, eCO2, DS + T, T + eCO2, DS + eCO2, DS + T + eCO2). All treatments were imposed 36 days after transplanting (DAP) and continued for 47 days. Treatments substantially affected gas exchange, photosynthetic pigments, growth, and storage root components. Cultivars differed considerably for many of the measured parameters. The most significant negative impact of DS was recorded for the shoot and root weights. The combination of DS + T had a significant negative effect on storage root parameters. eCO2 alleviated some of the damaging effects of DS and high T in sweetpotato. For instance, eCO2 alone or combined with DS increased the storage root weights by 22% or 42% across all three cultivars, respectively. Based on the stress response index, cultivar “Hatteras” was most tolerant to individual and interactive stresses, and “LA 1188” was sensitive. Our findings suggest that eCO2 negates the negative impact of T or DS on the growth and yield of sweetpotato. We identified a set of individual and interactive stress-tolerant traits that can help select stress cultivars or breed new lines for future environments.
1 Introduction
Sweetpotato [Ipomoea batatas (L.) Lam.], a member of the Convolvulaceae, is the seventh most important food crop globally with more than 100 million tons annual production, grown over 8.62 million ha and in over 100 countries (FAO, 2016). In the US, the harvested sweetpotato area had increased from 36,219 ha in 1990 to 63,455 ha in 2020 (https://quickstats.nass.usda.gov). Simultaneously, the average sweetpotato yield increased from 19.5 to 27.1 tons ha−1. The sweetpotato production contributed c.a. $500 million to the United States economy in 2012 (USDA, 2016). Sweetpotato commercial output is concentrated in the Southeast region and California within the United States. Although sweetpotato can adapt to various environmental conditions, its productivity can be reduced by specific abiotic stresses. Environmental conditions such as drought stress (DS), high temperature (T), and elevated carbon dioxide (eCO2), either alone or in combination, can affect both the plant health and yields of sweetpotato (Gajanayake et al., 2014; Liu, 2017; Wijewardana et al., 2018; Heider et al., 2021).
Plants are sensitive to environmental changes such as atmospheric CO2, T, and DS, which affect crop growth, development, and yield. The average global temperature on Earth has increased by about 1.1°C since 1880 [https://www.climate.gov/news-features/understanding-climate/climate-change-atmospheric-carbon-dioxide]. Moreover, it is predicted by climatologists that by the end of the 21st century, the temperature is likely to increase by another 3°C–4°C, and the atmospheric CO2 will increase from 410 ppm to 900 ppm (Birch, 2014; Intergovernmental Panel on Climate Change, 2018). Under such scenarios, it is necessary to quantify the impacts of climate change on current crop production to meet the demands of the burgeoning world population. High temperature is one of the most critical stress factors affecting plant growth, development, and yield (Gajanayake et al., 2014; Bheemanahalli et al., 2016, 2019; Reddy et al., 2017). Recently, studies showed the adverse effects of temperature on sweetpotato early establishment and storage root initiation. High T significantly reduced storage root production by 80%–90% in sweetpotato and formed more pencil roots (Gajanayake et al., 2014; Wijewardana et al., 2018). High T can cause a reduction in the formation and growth of storage roots through the changes in phytohormone synthesis and activation and the alteration of gas exchange and other physiological processes (Kooman and Haverkort, 1995). However, most of these studies have focused on one or two stress factors. They have given little attention to storage root formation and morpho-physiological changes during crop growth and development.
Along with high T, DS is another essential environmental stress factor affecting crop production globally (Saini and Westgate, 1999; Birch, 2014). Optimum leaf water potential is vital for normal physiological activities and membrane transport processes in plants, and thus, it is essential for plant growth and development. A lack of sufficient soil moisture limits photosynthetic activity, ultimately affecting storage root development, yield, and quality (Gollifer, 1980; van Heerden and Laurie, 2008; Lewthwaite and Triggs, 2012; Laurie et al., 2014). The storage root bulking of sweetpotato was affected by combination of stresses (Lewthwaite and Triggs, 2012; Omotobora et al., 2014; Heider et al., 2021). DS decreased photosynthesis during the initial vegetative growth phase by lowering stomatal and mesophyll conductance or causing oxidative damage to the chloroplast (Flexas et al., 2004; Medeiros et al., 2016). Severe drought impairs the regeneration of ribulose bisphosphate (RuBP) and decreases the activity of ribulose 1, 5-bisphosphate carboxylase/oxygenase (Rubisco), resulting in lower photosynthesis (Bota et al., 2004). Early studies evaluated photosynthesis variability under water stress using sweetpotato varieties consumed in Africa (van Heerden and Laurie, 2008), but the association between storage root initiation and yield was not determined.
Increases in atmospheric CO2 concentration will, directly and indirectly, affect crop plants at different developmental stages. eCO2 generally increases plant productivity, photosynthesis, and water-use efficiency (Drake et al., 1997; Fleisher et al., 2008; Baker et al., 1989; Kimball, 1983). The yield of crops will increase under eCO2, with productivity rising from 15% to 41% for C3 plants and 5%–10% for C4 crops (Kimball, 1983; Lotze-Campen and Schellnhuber, 2009; Brand et al., 2016). Even though eCO2 positively impacts plant growth and crop yield, little information is available on sweetpotato, especially when the plants are grown in combination with high temperature and drought stress. To the best of our awareness, the present study is the first to evaluate the interactive effects of high T, DS, and eCO2 on the growth and development of three sweetpotato cultivars. Here, we compare the performance of three sweetpotato cultivars for varying climatic conditions by changing the temperature, moisture content, and CO2. We hypothesized that sweetpotato growth and development would be modified by the individual (T or DS) and combined T and DS under ambient and eCO2. Hence, the objective of this study was to examine the phenotypic responses of sweetpotato cultivars to high T, DS, and eCO2 alone and in combination.
2 Materials and methods
2.1 Experimental conditions
This study was conducted in sunlit plant growth chambers known as Soil-Plant-Atmosphere-Research (SPAR) units located at the Rodney Foil Plant Science Research facility, Mississippi State University, Mississippi State, MS, United States (33°28′ N, 88°47′ W). “Beauregard” and ‘Hatteras’ slips were obtained from the Pontotoc Ridge-Flatwoods Branch Experiment Station, Pontotoc, MS, and “Louisiana 1188” (LA1188) slips were obtained from the Louisiana State University Sweetpotato Research Station, Chase, LA. Sweetpotato slips (vine tip cuttings) were planted into polyvinyl chloride pots (20 cm diameter and 35 cm high) and were filled with a 1:3 (v/v) mix of topsoil and sand on 15 July 2016. Plants were irrigated three times daily with full-strength Hoagland’s solution (Hewitt, 1952) delivered at 08:00, 12:00, and 16:00 h to maintain good nutrient requirements and soil-water conditions for plant growth through an automated and computer-controlled drip irrigation system. Air temperature, CO2, and soil moisture content in each chamber were monitored and adjusted every 10 s. The daytime temperature was initiated at sunrise and returned to the nighttime temperature 1 h after sunset. The relative humidity of each chamber was monitored with a sensor (HMV 70Y, Vaisala Inc., San Jose, CA) installed in the return air duct. The vapor pressure deficit (VPD) was calculated based on the percentage-of-evapotranspiration (ET) values recorded the previous day (Murray, 1967) of water provided to each for treatment. The specification and details of SPAR operation and control algorithms have been detailed in Reddy et al. (2001). The chambers consisted of an upper Plexiglas unit 2.5 m tall by 2 m long by 1.5 m wide and a lower steel soil bin 1 m deep by 2 m long by 0.5 m wide. The chambers allowed 97% of the visible solar radiation to pass without spectral variability in absorption while blocking solar UV radiation (100% of UV-B and 88% of UV-A). During the experiment, the ambient solar radiation measured with a pyranometer (Model 4-48, The Eppley Laboratory Inc., Newport, Rhode Island, United States) was 21.26 ± 0.5 MJ m−2 d−1. Variable density shade cloth was placed around the edges of plants at transplanting. It was adjusted regularly to match plant heights, simulating natural shading by other plants, and eliminating the need for border plants.
2.2 Treatments
Eight SPAR chambers were utilized for this experiment, one per treatment. All environmental treatments were imposed at planting except soil moisture treatments, which were set at 36 DAP and continued through the termination of the study at 83 DAP (Table 1). The pots were randomly arranged within each unit to avoid the positional effect. In this study, 144 plants (3 cultivars × 8 treatments × 6 replications) were used to explore temperature (30/22°C day/night, control and 38/30°C day/night, high temperature, T), 2 levels of CO2 (410 ppm, CO2 and 760 ppm, eCO2), 2 levels of soil moisture (100%, control and 50% ET, drought stress-DS), and three (“Beauregard,” “Hatteras,” and “LA1188”) different sweetpotato cultivars (CUL).
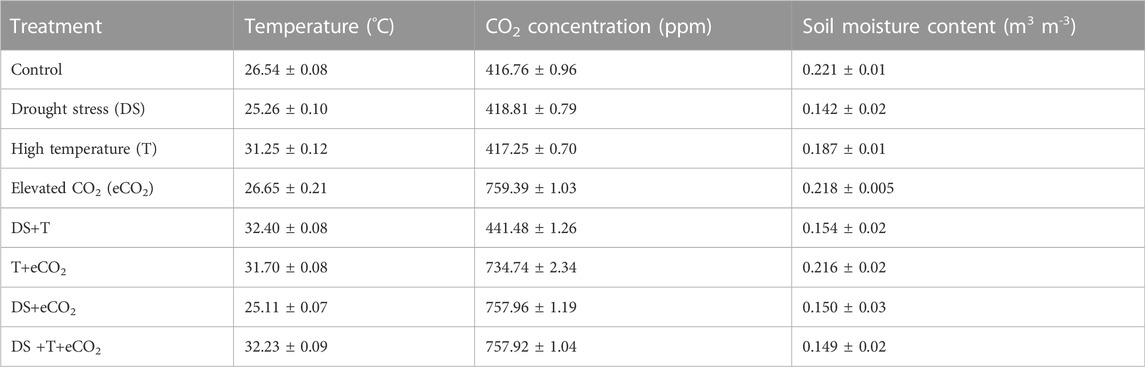
TABLE 1. The treatments mean day and night temperatures, daytime CO2, and day and night soil moisture content for each unit. Temperature (T), carbon dioxide concentration (CO2), elevated CO2 (eCO2), drought (DS), and cultivars (CUL). Values in the mean ± standard deviation of the mean.
2.3 Data collection
2.3.1 Gas exchange and fluorescence
At 78 DAP, leaf net photosynthesis (Pn), stomatal conductance (gs), transpiration (Tr), electron transport rate (ETR), and chlorophyll fluorescence (Fv′/Fm′) measurements were taken on the youngest, fully expanded primary vine leaf between 10:00 and 13:00 h using a portable photosynthesis system with an integrated fluorescence chamber head (Li-COR 6400 leaf chamber fluorometer). The temperature and internal CO2 concentration were set to the respective environments in each SPAR chamber. While measuring photosynthesis, the photosynthetically active radiation (PAR) was set to 1500 μmol m−2 s−1 (6400-02 LED light source), and the relative humidity inside the cuvette was maintained at approximately 50%. Fluorescence measurements were taken using the in-built leaf chamber fluorometer, which used two red LEDs with a center wavelength of 630 nm and detector radiation of 715 nm in the photosystem-II fluorescence band. A flash of light >7,000 mmol m−2 s−1 was achieved using 27 red LEDs to measure the maximal fluorescence (Fm′). The rapid dark adaptation to measure minimal fluorescence (Fo′) was performed by turning off the actinic light using the far-red LED with a center wavelength of 740 nm. The software in the instrument provided data on the Pn, gs, Tr, and calculated the quantum efficiency by open photosystem-II reaction centers in the light as the ratio of variable/maximal fluorescence (Fv′/Fm′). Plant water use efficiency (iWUE) was calculated as the ratio between Pn and Tr.
2.3.2 Photosynthetic pigments
Photosynthetic pigments such as chlorophyll a, chlorophyll b, and carotenoid content were measured at 78 DAP. Within each chamber, three leaves from each of the six plants were collected. Discs with 2.0 cm2 size were cut from leaves and placed in vials containing 5 ml of dimethyl sulphoxide for chlorophyll extraction. The absorbance of the supernatant was measured with a Bio-Rad ultraviolet/VIS spectrophotometer (Bio-Rad Laboratories, Hercules, CA) at 470, 648, and 663 nm. Total chlorophyll and carotenoid content were estimated (Lichtenthaler, 1987; Chappelle et al., 1992) and expressed on a leaf area basis (µg cm−2).
2.3.3 Relative cell membrane injury
The leaf cell membrane thermostability was evaluated at 78 DAP (Martineau et al., 1979). Leaf samples were collected as described in 2.3.2. Eighteen leaf discs with 1.3 cm2 were placed in test tubes with 10 ml of deionized water. The leaf discs were thoroughly rinsed three times with deionized water to remove electrolytes, adhering to the leaf surface and leaching from the leaf disc’s cut surfaces. After the final rinse, all the test tubes with leaf discs were filled with 10 mL of deionized water and capped with aluminum foil to prevent the evaporation of water. One set of test tubes was incubated for 20 min at 55°C in a temperature-controlled water bath, whereas the other set was left at room temperature of 25°C. After incubation, the sets of test tubes were brought to 25°C and the initial measurement of the conductance of the control (CEC1) and the treatment (TEC1) was measured by an electrical conductivity meter (Corning Checkmate II; Corning Inc., Corning, NY) at room temperature. Tubes were then autoclaved at 0.1 MPa for 12 min to kill tissues completely, releasing all the electrolytes. Tubes were then cooled to 25°C, and final conductance was measured (CEC2 and TEC2). Finally, the ratio of the initial to the last electrolyte leakage caused by the elevated temperature was estimated, giving a measure of the extent of damage to cellular membranes using the following equation.
Finally, the inverse value of cell membrane thermostability was used to determine the relative cell membrane injury (RI) across stress treatments.
2.3.4 Growth and development
Replicated plants from each cultivar per chamber were evaluated for main vine length, measured from the soil surface to the most recently unfolded leaf and node number. Above-ground plant parts were separated (stems and leaves) to record weights. The leaf area was measured using the LI-COR leaf area meter (LI-3100: LI-COR, Inc., Lincoln, NE). According to Meyers et al., 2017, the below-ground plant portions were removed from pots and separated into storage, pencil, and fibrous roots. The number and fresh weight of each type of root were recorded. All plant parts were dried in a forced-air oven at 75°C for 72 h to estimate plant-component dry weights.
2.4 Data analysis
The measured parameters were subjected to factorial ANOVA using JMP software (Statistical Institute, Inc., Cary, NC). Summary of source of variance, degrees of freedom and sum of squares of all traits are in given Supplementary Table S1. In the present study, stress response index (SRI) values for all measured were calculated for each treatment (DS or T or eCO2 or DS + T or T + CO2 or T + CO2 or DS + CO2 or DS + T + CO2) as the value of a parameter (Pl) for a given cultivar at the stress divided by the value of the same parameter at the control (Po). The degree of tolerance among cultivars or parameters responses was assessed by comparing the cultivar relative to their control treatment. The genotypes with a high value indicate better performance in response to treatment.
SRI values calculated across cultivars were to evaluate the vegetative, physiological, and biochemical responses of sweetpotato to the treatments under study (eCO2, T, DS, DS + T, T + eCO2, DS + eCO2, DS + T + eCO2). Traits with high or low values of SRI indicate positive or negative responses to treatment, respectively. Finally, SRI values were used to identify a set of individual and interactive stress tolerance traits in sweetpotato. Graphical analysis was performed with SigmaPlot 14.5 (Systat Software Inc., San Jose, CA).
3 Results
3.1 Gas exchange parameters
The effects of DS, T, eCO2, cultivar (CUL) × eCO2, DS × eCO2, CUL × DS × eCO2, and CUL × T × DS interactions had a significant impact on net photosynthesis (Table 2). Averaged across all cultivars, eCO2 alone or combinations with the high T had a 52% (eCO2) to 78% (T + eCO2) increase in Pn (Figure 1A). Photosynthesis of LA1188 increased across all treatments compared to control (Figure 1A, Supplementary Table S2). Cultivar Beauregard recorded the highest reduction in Pn under DS + eCO2 (70%), followed by DS + eCO2+T treatments (15%) compared to control (Table 3). Averaged across cultivar, the eCO2 alone and in combination with T or DS decreased the gs (46%, 45%, and 9%) and Tr (33%, 27%, and 16%) in comparison with control (Supplementary Table S3). The gs and Tr of Hatteras decreased under DS, while the iWUE was increased (Figures 1B, C). Although some treatment effects were non-significant, iWUE increased across treatments except for DS (Table 2). The individual (eCO2, DS, and T) and combined (DS + eCO2, DS + T + eCO2) treatments significantly affected the iWUE and chlorophyll fluorescence (Fv'/Fm') measurements. Across cultivars, a substantial reduction in electron transport rate and Fv'/Fm' were observed in four out of six treatments (eCO2, DS + T, T + eCO2, and DS + eCO2). An increase in iWUE was associated with decreased gs and Tr under eCO2, DS + T, T + eCO2, D + eCO2, and DS + T + eCO2 than control in LA 1188 (Figure 1C).
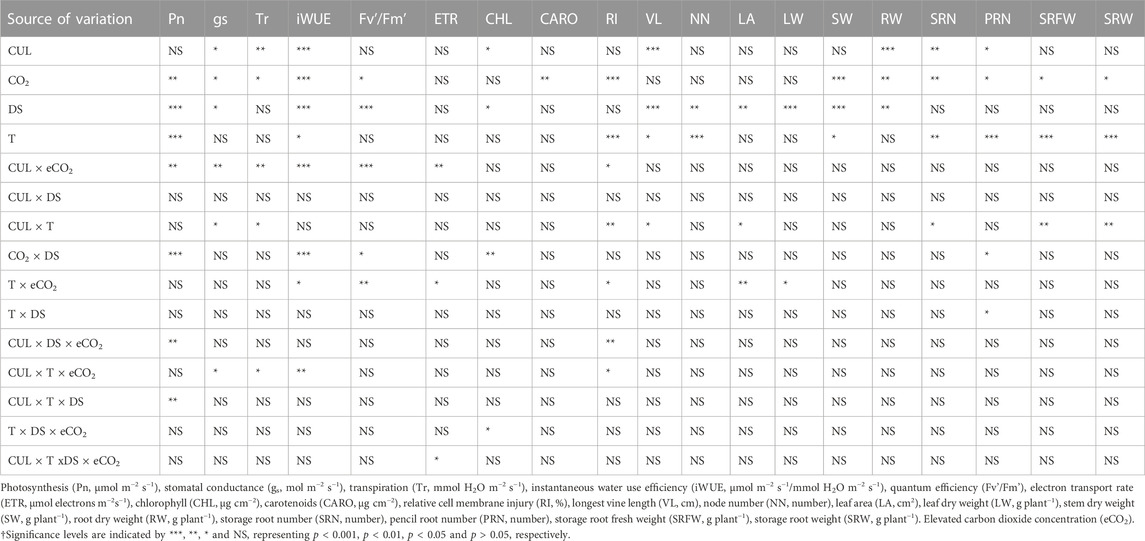
TABLE 2. The analysis of variance across the treatments of temperature (T), carbon dioxide concentration ([CO2]), drought (DS), and cultivars (CUL), and their interactions on sweetpotato vegetative, physiological, and photosynthetic parameters.
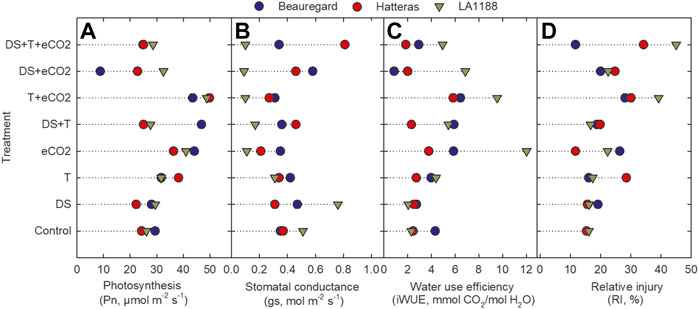
FIGURE 1. Effects of temperature (T), carbon dioxide concentration ([CO2]), drought (DS), and their interaction on (A) photosynthesis rate, (B) stomatal conductance, (C) water use efficiency and (D) relative injury of the cell membrane (RI) of three sweetpotato cultivars (Beauregard, Hatteras, and LA 1188). Each data point indicates the mean ± standard error.
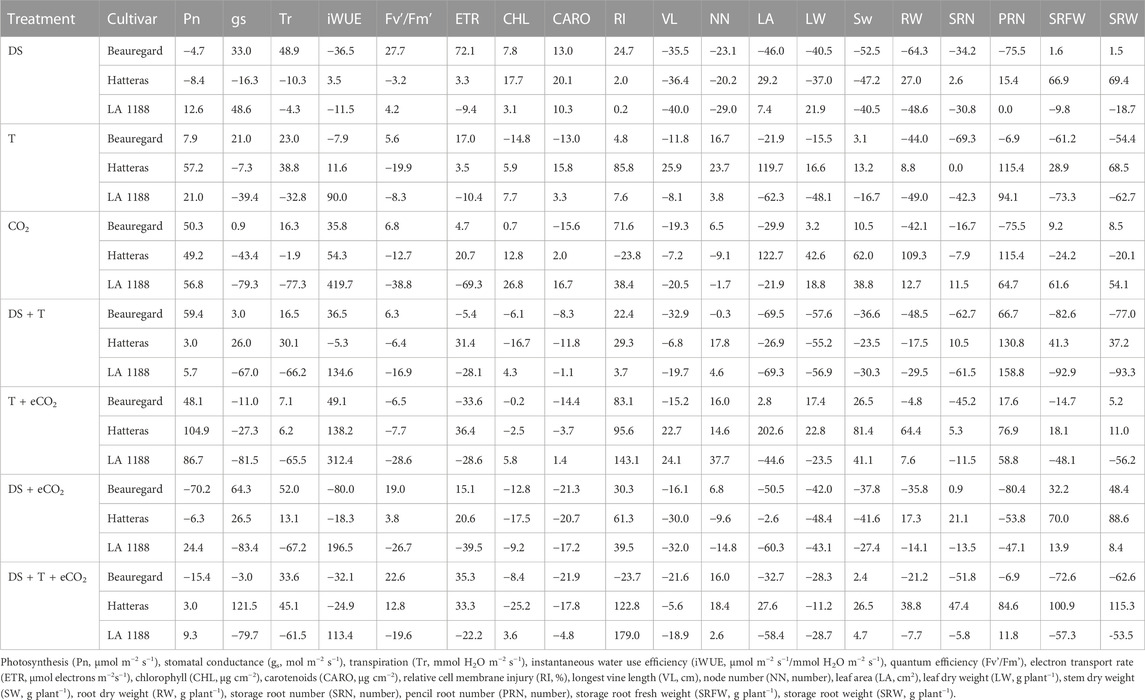
TABLE 3. Percentage changes in the vegetative, physiological, and photosynthetic parameters of three sweetpotato cultivars (drought, DS; high temperature, T; elevated CO2, eCO2) and their interactions. Data for each cultivar are the mean (n = 6). Values indicate treatment-induced decrease (“−”) or increase (“+”) compared to control.
3.2 Pigments and relative cell membrane injury
Significant effects of eCO2 and T were observed for relative cell membrane injury (Table 2). The interaction of CUL × eCO2, CUL × T, T × eCO2, CUL × DS × eCO2, and DS × T × eCO2 significantly affected membrane injury (Table 2). Averaged across cultivars, relative injury increased to a greater extent under T + eCO2 (2-fold) and DS + T + eCO2 (94%) than individual stress treatments. “Hatteras” exhibited 24% higher membrane stability (minor injury) under eCO2 than the control (Figure 1D). When subjected to DS + T + CO2, ‘Hatteras’ and ‘LA1188’ recorded the maximum membrane injury compared to other treatments (Figure 1D; Table 3). Total chlorophyll content demonstrated a significant response to CUL, DS, and the interactions of eCO2 × DS and T × DS × eCO2 (Table 2). The CHL increased (9.5%) significantly under DS and decreased under eCO2 × DS (13%) and T × DS × eCO2 (10%) across cultivars. In response to treatments, cultivars increased the CHL, ranging from 1% (in Beauregard under eCO2) to 27% (in LA 1188 under eCO2), while leaf carotenoid content of all the cultivars decreased under combined stresses, ranging from 1% (in LA 1188 under DS + T) to 22% in Beauregard under combined treatment, DS + T + eCO2 (Supplementary Tables S2, S3).
3.3 Vine length, node number
Significant CUL, DS, T, and CUL × T interactions were observed for vine length, whereas significant treatments (DS and T) impacts were observed for node number (Table 2). DS alone and in combination with eCO2 (DS + eCO2) resulted in 37% and 25% reductions in the mean value of vine length than control (Figure 2A; Table 3). The combination of T + eCO2 resulted in a 23.5% (24% in LA1188 and 23% in Hatteras) increase in main vine length compared to the control (Figure 2A; Supplementary Table S3). Interestingly, high T alone and DS, eCO2, and DS + eCO2 positively affected node number among the cultivars (Table 3).
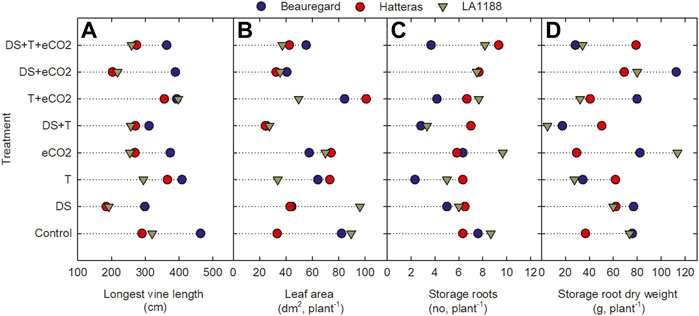
FIGURE 2. Effects of temperature (T), carbon dioxide concentration ([CO2]), drought (DS), and their interaction on (A) vine length (B) leaf area, (C) storage roots, and (D) storage root dry weight for three sweetpotato cultivars (Beauregard, Hatteras, and LA1188). Each data point indicates the mean ± standard error.
3.4 Plant biomass components
Leaf area showed significant responses to DS, CUL × T, and T × eCO2 (Table 2). Averaged across cultivars, eCO2 in combination with DS decreased the leaf area by 47%, and T increased leaf area by 14% compared to the control (Figure 2B, Supplementary Table S2). The combination of DS + T caused the most significant reduction in leaf area (62%) in all the cultivars. In comparison, ‘Hatters’ had shown a minimum decrease (30%) in leaf area compared to the control (Figure 2B; Table 3). The leaf area of ‘Hatteras’ and “LA1188” was increased significantly under DS compared to the control. ‘Beauregard’ decreased leaf area by 46% under DS than control (Table 3). The shoot and roots’ dry weights were affected by eCO2 and DS (Table 3). Averaged across cultivars, eCO2 increased leaf weight by 20% (3% in Beauregard; 43% in Hatteras) and shoot dry weight by 34% (11% in Beauregard; 62% in Hatteras) (Table 3). Shoot dry weight declined more with the DS (41% in LA1188 to 53% in Beauregard) than combined the DS + T (23% in Hatters to 37% in Beauregard). Averaged over the cultivars, plants grown under DS + T showed 62%, 57%, and 31% less leaf area, leaf weight, and shoot weight than the control, respectively (Table 3). However, plants grown under eCO2 alone or combined with high T showed an overall increase (34% or 47%) in shoot biomass in all the cultivars.
3.5 Storage roots and pencil roots
Storage and pencil root number were significantly varied by CUL, T, and eCO2 treatments. However, CUL × T and CUL × DS interactions were observed only for storage and pencil root numbers, respectively (Table 2). Sweetpotato cultivars grown under high T conditions exhibited a 40% reduction in their storage root number (Figure 2C) and a 59% increase in pencil roots (Supplementary Table S3). Storage root dry weight ranged from 5 (under T + DS) to 114 g plant−1 (eCO2). Plants grown under DS + T had the least storage root dry weight (∼24.5 g), while those produced under eCO2 (75 g) and eCO2 + DS (87 g) had the most (Figure 2D). The reduction of storage root dry weight under T, DS + T, T + eCO2, and DS + T + eCO2 treatments were 31%, 60%, 20%, and 21%, respectively, compared to the control (Table 3). Cultivar ‘LA1188’ with the highest number of pencil roots, accumulated the lowest storage root weight (5 g) under DS + T, 93% less than the control and the other cultivars. In contrast, cultivar “Hatteras” with high storage root production had a 37% higher storage root weight under DS + T than the control. Individual (eCO2 or T) or combined (DS + T, T+ eCO2, DS + T + eCO2) treatments resulted in more pencil roots in all three cultivars (Supplementary Table S2). Meanwhile, the formation of pencil roots in all three cultivars under DS + eCO2 was decreased by 62% compared to the control and increased the storage root weight by 42% (Table 3).
3.6 Stress response index
To understand how vegetative, physiological, and photosynthetic parameters of sweetpotato respond to treatments, the stress response index (SRI) of all measured parameters were calculated across seven treatments (Supplementary Table S3; Figure 3). Among the studied traits, DS had higher adverse effects (see heat map Figure 3, value < 1) on the shoot and root parameters, while eCO2 had a favorable impact on root-related parameters. In contrast, DS + T negatively affected gas exchange (except Pn) and pigment parameters. Storage roots were the most severely affected parameters due to high T and combined DS + T. Interestingly, eCO2 alone or in combination with DS treatments increased the sink strength or storage root potential up to 42% compared to control (Figure 3). Based on the SRI, cultivars (Beauregard and LA1188) were sensitive to temperature and drought. The impact was much higher when they occurred together (Supplementary Table S3). On average sweetpotato cultivars had a positive response under eCO2 conditions, and it weakened the damaging effects of high T and DS in cultivar Hatteras (Table 3).
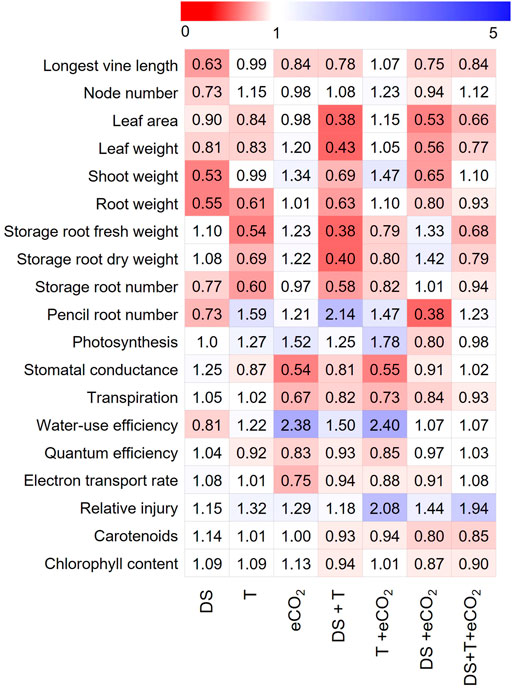
FIGURE 3. Heat map showing individual and combined treatments induced responses of vegetative, physiological, and photosynthetic parameters relative to control treatment. Each column represents a phenotypic response (average of three cultivars) relative to control (Supplementary Table S3), and each row represents the overall parameter response to treatment. The color codes depict the parameter range for each treatment, with “red” indicating a lower value (<1, decreased compared to control), whereas “blue” indicates a higher value (>1, increased compared to control) for a given parameter. Parameter acronyms and units are given in Table 2.
4 Discussion
Sweetpotato is predominately grown in rain-fed conditions or with moderate irrigation at high temperatures (Felix et al., 2015) in the southeastern states of the U.S. and California. Due to this, sweetpotato faces drought or high T during the growing season. On the other hand, a combination of these stresses is reported to occur more often during the growing season. Among all the stages, the storage root formation is most sensitive to drought and high T. Previously studies showed the impact of environmental factors on growth and development of sweetpotato (Pardales and Esquisel, 1996; Gajanayake et al., 2014; Wijewardana et al., 2018). Other studies also reported phenotypic responses of sweetpotato to stressors under ambient CO2, such as low temperature (Gajanayake et al., 2014), heat (Heider et al., 2021), and drought (Laurie et al., 2014). However, no studies have reported the multiple stress interactions to date. This is the first study that explored the interactive effect of three major climate change components, such as high T, DS, and eCO2, on the growth and development of sweetpotato.
Sweetpotato cultivars used in the study were commonly grown in the southern U.S. and varied in their response to abiotic stresses during storage root formation (Table 3). Sweetpotato cultivars exposed to drought stress during the storage root formation stage (36 DAP) for 47 days caused a more significant reduction in shoot biomass and storage root yield (Figure 3). In agreement with earlier studies (van Heerden and Laurie, 2008; Ravi et al., 2014; Meyers et al., 2017), drought stress decreased the vine length, node numbers, and leaf area (Figures 2, 3). Along the same line, DS and combination with high T reduced the leaf area by 16%–62% compared to control (Figure 3). Based on the stress response index, Beauregard and LA 1188 could not be tolerant of the DS (Supplementary Table S3) or showed a high reduction in phenotypic value (Table 3). At the same time, Hatteras could tolerate drought and high T stress during storage root formation (Table 3). However, none of the cultivars could take combined drought and high-temperature stress, resulting in higher growth limitations and storage root formation (Table 3).
As expected, eCO2 positively influenced the leaf area and photosynthesis rate under warmer temperatures (Figure 1). Despite reduced gs, Pn was increased under eCO2. Further, our results showed that eCO2 could mitigate the negative impact of drought and high T stress, particularly by increasing Pn and decreasing gs (Figure 3). The present study hypothesized that eCO2 alone or combined with high T would enhance leaf growth due to the higher photosynthetic rate and iWUE (Figure 3). A potato (Solanum tuberosum) survey reported an increase in shoot biomass and WUE under eCO2, with the most significant increase occurring under irrigated conditions (Fleisher et al., 2008). Similar to our findings, a nearly 2-fold increase in the WUE under eCO2 were observed in alfalfa (De Luis et al., 1999), carrot (Kyei-Boahen et al., 2003), corn (Kim et al., 2006; Wijewardana et al., 2016), cotton (Reddy et al., 1997; Brand et al., 2016), and soybeans (Koti et al., 2005), including potato crops (Lee et., 2020). At the same time, the eCO2 alone or in combination with high T increased the biomass and Pn (Figure 3). A positive impact of CO2 on storage root weight was observed under DS (Figure 3); thus, dissecting the biochemical or molecular pathways could help develop cultivar tolerant to combined stresses. A similar increase in dry matter production and growth under eCO2 has been observed in corn (Wijewardana et al., 2016), soybeans (Koti et al., 2005), and cotton (Reddy and Zhao, 2005; Brand et al., 2016) under sunlit plant growth chamber conditions. An increase in biomass may be due to phenotype modifications; however, an apparent molecular regulation is unknown. The eCO2 encouraged higher production of carbohydrates than in ambient CO2 possibly be by reducing photorespiration (Nie et al., 1995; Zhao et al., 2019). Also, air and soil temperatures regulate the tradeoff between shoot and storage root growth in sweetpotato (Gajanayake et al., 2013; Heider et al., 2021; Karan and Şanli, 2021; Zhang et al., 2021). Higher soil or air temperatures decrease the production of productive storage roots (Heider et al., 2021). Our findings also suggest that the eCO2 may negate the negative effect of high T on the growth and yield of sweetpotato (van Heerden and Laurie, 2008; Heider et al., 2021).
Pigments are the central components of the photosystem complex that are directly linked to photosynthesis and plant productivity. On average, across three cultivars, chlorophyll content increased by 9% and 12% under DS and eCO2 compared to control, respectively (Table 3; Figure 3). While it was decreased significantly under interactive DS + eCO2 and DS + T + eCO2 (Figure 3). The transient increase in the chlorophyll content under DS could be due to reduced leaf area or stress-induced inhibition of cell expansion. About a 14% increase in carotenoids in response to DS confirms high carotenoids' role in protecting the photosystem from oxidative damages (Table 3). Cultivar “Hatteras” with 20% high carotenoid under drought had less cell member injury than the other two cultivars (Table 3). Observed plant responses provide clues for choosing a combination trait for cultivar development, which would perform better in current and projected future climatic conditions.
A distinctive variability was observed among all the treatments or combined with cultivars for storage root growth, development, and pencil root production (Figure 3). The high T-induced increase in photosynthesis and iWUE is associated with lower storage root yield under eCO2 (Figure 3). We also observed determinantal effects of high T or combination with eCO2 and DS on storage root number and weight under optimum irrigation conditions. In potatoes, higher T delayed tuber initiation and the onset of tuber bulking, and a smaller fraction of dry matter was partitioned to the tubers (van Heerden and Laurie, 2008). The plants grown under warmer conditions produced more pencil roots than DS treatment (Figure 3). Nevertheless, DS, in combination with eCO2, had a beneficial effect on storage root weight under optimum T. Even though the direction of the stress effects was the same for all three cultivars, the magnitude of trait responses varied among cultivars (Figure 3). Our results suggest that the interactive stress effects or predicted climate change would modify the genetic potential of currently growing cultivars. It should be noted that controlled environment experiments may not represent the field production conditions. However, the phenotypic responses of cultivars will inform the physiological, growth, and development processes that are tolerant or sensitive to unfavorable environmental conditions.
5 Conclusion
The present study provides evidence on individual and interactive stress effects on sweetpotato plant growth and development. Reduced storage root accumulation and increased penciled roots are seen under high T, T + DS, and DS + T + eCO2. Taken together, sweetpotato cultivars are susceptible to DS and high T stresses. Based on the stress response index, Hatteras showed relatively higher tolerance to individual and interactive stress than the other two cultivars. The phenotyping approach and traits responses to individual and interactive stresses in this study could form a basis for further phenotyping of diverse genetic resources and mapping genetic loci to develop climate-resilient sweetpotato. Also, changing climate demands climate-ready varieties with a combination of desirable traits for warming, drought, and eCO2 for higher yields. Our findings could be valuable in developing decision-making tools for managing sweetpotato production practices under current and future climatic conditions and developing crop models.
Data availability statement
The original contributions presented in the study are included in the article/Supplementary Material, further inquiries can be directed to the corresponding author.
Author contributions
ST original draft, and data collection. RB revision, review, edited, data analysis and data visualization. KR conceptualization, project administration, methodology, supervision, editing and review, funding acquisition. AL data collection. SM, MS, and WG review and editing. All authors have read and agreed to the published version of the manuscript.
Acknowledgments
We thank David Brand for technical assistance from the Environmental Plant Physiology Laboratory for his help in taking measurements. This article contributes from the Department of Plant and Soil Sciences, Mississippi State University, Mississippi Agricultural and Forestry Experiment Station. The authors would like to thank the University Grants Commission, New Delhi, India, USDA NIFA (2019-34263-30552, 2022-34263-38472, and MIS 043050), and the MAFES-SRI, Mississippi State, MS.
Conflict of interest
The authors declare that the research was conducted in the absence of any commercial or financial relationships that could be construed as a potential conflict of interest.
Publisher’s note
All claims expressed in this article are solely those of the authors and do not necessarily represent those of their affiliated organizations, or those of the publisher, the editors and the reviewers. Any product that may be evaluated in this article, or claim that may be made by its manufacturer, is not guaranteed or endorsed by the publisher.
Supplementary material
The Supplementary Material for this article can be found online at: https://www.frontiersin.org/articles/10.3389/fgene.2022.1080125/full#supplementary-material
References
Baker, J. T., Allen, L. H., Boote, K. J., Jones, P., and Jones, J. W. (1989). Response of soybean to air temperature and carbon dioxide concentration. Crop Sci. 29, 98–105. doi:10.2135/cropsci1989.0011183X002900010024x
Bheemanahalli, R., Sathishraj, R., Tack, J., Nalley, L. L., Muthurajan, R., and Jagadish, K. S. V. (2016). Temperature thresholds for spikelet sterility and associated warming impacts for sub-tropical rice. Agric. For. Meteorol. 221, 122–130. doi:10.1016/j.agrformet.2016.02.003
Bheemanahalli, R., Sunoj, V. J., Saripalli, G., Prasad, P. V., Balyan, H., Gupta, P., et al. (2019). Quantifying the impact of heat stress on pollen germination, seed set, and grain filling in spring wheat. Crop Sci. 59, 684–696. doi:10.2135/cropsci2018.05.0292
Birch, E. L. (2014). A review of “climate change 2014: Impacts, adaptation, and vulnerability” and “climate change 2014: Mitigation of climate change”: Intergovernmental Panel on climate change. (2014). (Contribution of working group II to the fifth assessment report of the intergovernmental Panel on climate change). New york, NY: Cambridge university press. 2, 621 pages. Available online at http://ipcc-wg2.gov/AR5/report/final-drafts/; intergovernmental Panel on climate change. (2014). (Contribution of working group III to the fifth assessment report of the intergovernmental Panel on climate change). New york, NY: Cambridge university press. 1, 967 pages. Available online at https://www.ipcc.ch/report/ar5/wg3/. J. Am. Plan. Assoc. 80, 184–185. doi:10.1080/01944363.2014.954464
Bota, J., Medrano, H., and Flexas, J. (2004). Is photosynthesis limited by decreased Rubisco activity and RuBP content under progressive water stress? New Phytol. 162, 671–681. doi:10.1111/j.1469-8137.2004.01056.x
Brand, D., Wijewardana, C., Gao, W., and Reddy, K. R. (2016). Interactive effects of carbon dioxide, low temperature, and ultraviolet-B radiation on cotton seedling root and shoot morphology and growth. Front. Earth Sci. 10, 607–620. doi:10.1007/s11707-016-0605-0
Chappelle, E. W., Kim, M. S., and McMurtrey, J. E. (1992). Ratio analysis of reflectance spectra (RARS): An algorithm for the remote estimation of the concentrations of chlorophyll A, chlorophyll B, and carotenoids in soybean leaves. Remote Sens. Environ. 39, 239–247. doi:10.1016/0034-4257(92)90089-3
De Luis, I., Irigoyen, J. J., and Sánchez-Díaz, M. (1999). Elevated CO2 enhances plant growth in droughted N2-fixing alfalfa without improving water status. Physiol. Plant. 107, 84–89. doi:10.1034/j.1399-3054.1999.100112.x
Drake, B. G., Gonzàlez-Meler, M. A., and Long, S. P. (1997). More efficient plants: A consequence of rising atmospheric CO2? Annu. Rev. Plant Physiol. Plant Mol. Biol. 48, 609–639. doi:10.1146/annurev.arplant.48.1.609
FAO (2016). FAOSTAT. Food and agriculture organization of the united nations. Available at: http://www.fao.org/faostat/en/#data/QC (Accessed December 2, 2021).
Felix, J., Shock, C. C., Ishida, J., Feibert, E. B. G., and Saunders, L. D. (2015). Irrigation criteria and sweetpotato cultivar performance in the treasure valley of eastern Oregon. HortScience 50, 1011–1017. doi:10.21273/HORTSCI.50.7.1011
Fleisher, D. H., Timlin, D. J., and Reddy, V. R. (2008). Elevated carbon dioxide and water stress effects on potato canopy gas exchange, water use, and productivity. Agric. For. Meteorol. 148, 1109–1122. doi:10.1016/j.agrformet.2008.02.007
Flexas, J., Bota, J., Loreto, F., Cornic, G., and Sharkey, T. D. (2004). Diffusive and metabolic limitations to photosynthesis under drought and salinity in c 3 plants. Plant Biol. 6, 269–279. doi:10.1055/s-2004-820867
Gajanayake, B., Reddy, K. R., Shankle, M. W., and Arancibia, R. A. (2013). Early-season soil moisture deficit reduces sweetpotato storage root initiation and development. HortScience 48, 1457–1462. doi:10.21273/HORTSCI.48.12.1457
Gajanayake, B., Reddy, K. R., Shankle, M. W., Arancibia, R. A., and Villordon, A. O. (2014). Quantifying storage root initiation, growth, and developmental responses of sweetpotato to early season temperature. Agron. J. 106, 1795–1804. doi:10.2134/agronj14.0067
Gollifer, D. E. (1980). A time of planting trial with sweet potatoes. Trop. Agric. 57. Available at: https://journals.sta.uwi.edu/ojs/index.php/ta/article/view/2915 (Accessed December 2, 2021).
Heider, B., Struelens, Q., Faye, É., Flores, C., Palacios, J. E., Eyzaguirre, R., et al. (2021). Intraspecific diversity as a reservoir for heat-stress tolerance in sweet potato. Nat. Clim. Chang. 11, 64–69. doi:10.1038/s41558-020-00924-4
Hewitt, E. J. (1952). Sand and water culture methods used in the study of plant nutrition. Available at: https://www.cabdirect.org/cabdirect/abstract/19531603279 (Accessed December 16, 2020).
Intergovernmental Panel on Climate Change (2018). IPCC. Global Warming of 1.5°C. An IPCC Special Report on the impacts of global warming of 1.5°C above pre-industrial levels and related global greenhouse gas emission pathways, in the context of strengthening the global response to the threat of climate change, sustainable development, and efforts to eradicate poverty. Available at: https://www.ipcc.ch/sr15/(Accessed December 19, 2020).
Karan, Y. B., and Şanli, Ö. G. (2021). The assessment of yield and quality traits of sweet potato (Ipomoea batatas (L.) genotypes in middle black sea region, Turkey. PLoS One 16, e0257703. doi:10.1371/journal.pone.0257703
Kim, S.-H., Sicher, R. C., Bae, H., Gitz, D. C., Baker, J. T., Timlin, D. J., et al. (2006). Canopy photosynthesis, evapotranspiration, leaf nitrogen, and transcription profiles of maize in response to CO2 enrichment. Glob. Chang. Biol. 12, 588–600. doi:10.1111/j.1365-2486.2006.01110.x
Kimball, B. A. (1983). Carbon dioxide and agricultural yield: An assemblage and analysis of 430 prior observations1. Agron. J. 75, 779–788. doi:10.2134/agronj1983.00021962007500050014x
Kooman, P. L., and Haverkort, A. J. (1995). “Modelling development and growth of the potato crop influenced by temperature and daylength: LINTUL-POTATO,” in Potato ecology and modelling of crops under conditions limiting growth current issues in production ecology. Editors A. J. Haverkort, and D. K. L. MacKerron (Dordrecht: Springer Netherlands), 41–59. doi:10.1007/978-94-011-0051-9_3
Koti, S., Reddy, K. R., Reddy, V. R., Kakani, V. G., and Zhao, D. (2005). Interactive effects of carbon dioxide, temperature, and ultraviolet-B radiation on soybean (Glycine max L.) flower and pollen morphology, pollen production, germination, and tube lengths. J. Exp. Bot. 56, 725–736. doi:10.1093/jxb/eri044
Kyei-Boahen, S., Astatkie, T., Lada, R., Gordon, R., and Caldwell, C. (2003). Gas exchange of carrot leaves in response to elevated CO2 concentration. Photosynthetica 41, 597–603. doi:10.1023/B:PHOT.0000027526.48604.09
Laurie, R., Laurie, S., du Plooy, C., Finnie, J., and Staden, J. (2014). Yield of drought-stressed sweet potato in relation to canopy cover, stem length and stomatal conductance. J. Agric. Sci. (Tor). 7, p201. doi:10.5539/jas.v7n1p201
Lewthwaite, S., and Triggs, C. (2012). Sweetpotato cultivar response to prolonged drought. Available at: https://www.semanticscholar.org/paper/Sweetpotato-cultivar-response-to-prolonged-drought.-Lewthwaite-Triggs/8ff9746de55a4d6a8da6c0154ddabeabab61c951 (Accessed December 2, 2021).
Lichtenthaler, H. K. (1987). “[34] Chlorophylls and carotenoids: Pigments of photosynthetic biomembranes,” in Methods in enzymology (Amsterdam, Netherlands: Elsevier), 350–382. doi:10.1016/0076-6879(87)48036-1
Liu, Q. (2017). Improvement for agronomically important traits by gene engineering in sweetpotato. Breed. Sci. 67, 15–26. doi:10.1270/jsbbs.16126
Lotze-Campen, H., and Schellnhuber, H.-J. (2009). Climate impacts and adaptation options in agriculture: What we know and what we don’t know. J. Verbr. Leb. 4, 145–150. doi:10.1007/s00003-009-0473-6
Martineau, J. R., Specht, J. E., Williams, J. H., and Sullivan, C. Y. (1979). Temperature tolerance in soybeans. i. evaluation of a technique for assessing cellular membrane thermostability 1. Crop Sci. 19, 75–78. doi:10.2135/cropsci1979.0011183X001900010017x
Medeiros, D. B., Martins, S. C. V., Cavalcanti, J. H. F., Daloso, D. M., Martinoia, E., Nunes-Nesi, A., et al. (2016). Enhanced photosynthesis and growth in atquac1 knockout mutants are due to altered organic acid accumulation and an increase in both stomatal and mesophyll conductance. Plant Physiol. 170, 86–101. doi:10.1104/pp.15.01053
Meyers, S., Shankle, M. W., and Reddy, K. R. (2017). Sweetpotato storage root initiation. Mississippi State, MS: Mississippi State University Extension Service. Available at: http://extension.msstate.edu/publications/sweetpotato-storage-root-initiation (Accessed December 2, 2021).
Murray, F. W. (1967). On the computation of saturation vapor pressure. J. Appl. Meteor. 6, 203–204. doi:10.1175/1520-0450(1967)006<0203:otcosv>2.0.co;2
Nie, G., Hendrix, D. L., Webber, A. N., Kimball, B. A., and Long, S. P. (1995). Increased accumulation of carbohydrates and decreased photosynthetic gene transcript levels in wheat grown at an elevated co2 concentration in the field. Plant Physiol. 108, 975–983. doi:10.1104/pp.108.3.975
Omotobora, B. O., Adebola, P. O., Modise, D. M., Laurie, S. M., and Gerrano, A. S. (2014). Greenhouse and field evaluation of selected sweetpotato (Ipomoea batatas (l.) lam) accessions for drought tolerance in South Africa. Am. J. Plant Sci. 5, 3328–3339. doi:10.4236/ajps.2014.521348
Pardales, J. R., and Esquisel, C. B. (1996). Effect of drought during the establishment period on the root system development of cassava. Jpn. J. crop Sci. 65, 93–97. doi:10.1626/jcs.65.93
Ravi, V., Chakrabarti, S. K., Makeshkumar, T., and Saravanan, R. (2014). “Molecular regulation of storage root formation and development in sweet potato,” in Horticultural reviews: Volume 42. Editor J. Janick (Hoboken, New Jersey: John Wiley & Sons), 157–208. doi:10.1002/9781118916827.ch03
Reddy, K. R., Brand, D., Wijewardana, C., and Gao, W. (2017). Temperature effects on cotton seedling emergence, growth, and development. Agron. J. 109, 1379–1387. doi:10.2134/agronj2016.07.0439
Reddy, K. R., Hodges, H. F., and McKinion, J. M. (1997). A comparison of scenarios for the effect of global climate change on cotton growth and yield. Funct. Plant Biol. 24, 707–713. doi:10.1071/pp96138
Reddy, K. R., Hodges, H., Read, J., Mckinion, J., Baker, J. T., Tarpley, L., et al. (2001). Soil-plant-atmosphere-research (SPAR) facility: A tool for plant research and modeling. Available at:/paper/SOIL-PLANT-ATMOSPHERE-RESEARCH-(SPAR)-FACILITY%3A-A-Reddy-Hodges/d40ecbb07655c2d25703c65afae63eaefc26d9c5 (Accessed December 16, 2020).
Reddy, K. R., and Zhao, D. (2005). Interactive effects of elevated CO2 and potassium deficiency on photosynthesis, growth, and biomass partitioning of cotton. Field Crops Res. 94, 201–213. doi:10.1016/j.fcr.2005.01.004
Saini, H. S., and Westgate, M. E. (1999). Reproductive development in grain crops during drought. Adv. Agron. 68, 59–96. doi:10.1016/S0065-2113(08)60843-3
USDA (2016). USDA- national agricultural statistics service - statistics by subject. Available at: https://www.nass.usda.gov/Statistics_by_Subject/index.php?sector=CROPS (Accessed December 2, 2021).
van Heerden, P. D. R., and Laurie, R. (2008). Effects of prolonged restriction in water supply on photosynthesis, shoot development and storage root yield in sweet potato. Physiol. Plant. 134, 99–109. doi:10.1111/j.1399-3054.2008.01111.x
Wijewardana, C., Henry, W. B., Gao, W., and Reddy, K. R. (2016). Interactive effects on CO2, drought, and ultraviolet-B radiation on maize growth and development. J. Photochem. Photobiol. B 160, 198–209. doi:10.1016/j.jphotobiol.2016.04.004
Wijewardana, C., Reddy, K. R., Shankle, M. W., Meyers, S., and Gao, W. (2018). Low and high-temperature effects on sweetpotato storage root initiation and early transplant establishment. Sci. Hortic. 240, 38–48. doi:10.1016/j.scienta.2018.05.052
Zhang, G., Tang, R., Niu, S., Si, H., Yang, Q., Rajora, O. P., et al. (2021). Heat-stress-induced sprouting and differential gene expression in growing potato tubers: Comparative transcriptomics with that induced by postharvest sprouting. Hortic. Res. 8, 226–318. doi:10.1038/s41438-021-00680-2
Zhao, X., Li, W.-F., Wang, Y., Ma, Z.-H., Yang, S.-J., Zhou, Q., et al. (2019). Elevated CO2 concentration promotes photosynthesis of grape (Vitis vinifera L. cv. ‘Pinot noir’) plantlet in vitro by regulating RbcS and Rca revealed by proteomic and transcriptomic profiles. BMC Plant Biol. 19, 42. doi:10.1186/s12870-019-1644-y
Keywords: CO2, climate change, drought stress, high temperature, interactive stresses, storage roots
Citation: Taduri S, Bheemanahalli R, Wijewardana C, Lone AA, Meyers SL, Shankle M, Gao W and Reddy KR (2023) Sweetpotato cultivars responses to interactive effects of warming, drought, and elevated carbon dioxide. Front. Genet. 13:1080125. doi: 10.3389/fgene.2022.1080125
Received: 25 October 2022; Accepted: 05 December 2022;
Published: 04 January 2023.
Edited by:
Rajeev K. Varshney, Murdoch University, AustraliaReviewed by:
Muntazir Mushtaq, National Bureau of Plant Genetic Resources (ICAR), IndiaAleksandra Radanovic, Institute of Field and Vegetable Crops, Serbia
Copyright © 2023 Taduri, Bheemanahalli, Wijewardana, Lone, Meyers, Shankle, Gao and Reddy. This is an open-access article distributed under the terms of the Creative Commons Attribution License (CC BY). The use, distribution or reproduction in other forums is permitted, provided the original author(s) and the copyright owner(s) are credited and that the original publication in this journal is cited, in accordance with accepted academic practice. No use, distribution or reproduction is permitted which does not comply with these terms.
*Correspondence: K. Raja Reddy, a3JyZWRkeUBwc3MubXNzdGF0ZS5lZHU=