 Jingxi Xu
 Chaoyang Liang2
 Jiangtao Li
94% of researchers rate our articles as excellent or good
Learn more about the work of our research integrity team to safeguard the quality of each article we publish.
Find out more
ORIGINAL RESEARCH article
Front. Genet. , 28 November 2022
Sec. Computational Genomics
Volume 13 - 2022 | https://doi.org/10.3389/fgene.2022.1078200
This article is part of the Research Topic Bioinformatics Analysis of Omics Data for Biomarker Identification in Clinical Research, Volume II View all 53 articles
Background: Systemic sclerosis-associated pulmonary hypertension (SSc-PH) is one of the most common causes of death in patients with systemic sclerosis (SSc). The complexity of SSc-PH and the heterogeneity of clinical features in SSc-PH patients contribute to the difficulty of diagnosis. Therefore, there is a pressing need to develop and optimize models for the diagnosis of SSc-PH. Signal recognition particle (SRP) deficiency has been found to promote the progression of multiple cancers, but the relationship between SRP and SSc-PH has not been explored.
Methods: First, we obtained the GSE19617 and GSE33463 datasets from the Gene Expression Omnibus (GEO) database as the training set, GSE22356 as the test set, and the SRP-related gene set from the MSigDB database. Next, we identified differentially expressed SRP-related genes (DE-SRPGs) and performed unsupervised clustering and gene enrichment analyses. Then, we used least absolute shrinkage and selection operator (LASSO) regression and support vector machine-recursive feature elimination (SVM-RFE) to identify SRP-related diagnostic genes (SRP-DGs). We constructed an SRP scoring system and a nomogram model based on the SRP-DGs and established an artificial neural network (ANN) for diagnosis. We used receiver operating characteristic (ROC) curves to identify the SRP-related signature in the training and test sets. Finally, we analyzed immune features, signaling pathways, and drugs associated with SRP and investigated SRP-DGs’ functions using single gene batch correlation analysis-based GSEA.
Results: We obtained 30 DE-SRPGs and found that they were enriched in functions and pathways such as “protein targeting to ER,” “cytosolic ribosome,” and “coronavirus disease—COVID-19”. Subsequently, we identified seven SRP-DGs whose expression levels and diagnostic efficacy were validated in the test set. As one signature, the area under the ROC curve (AUC) values for seven SRP-DGs were 0.769 and 1.000 in the training and test sets, respectively. Predictions made using the nomogram model are likely beneficial for SSc-PH patients. The AUC values of the ANN were 0.999 and 0.860 in the training and test sets, respectively. Finally, we discovered that some immune cells and pathways, such as activated dendritic cells, complement activation, and heme metabolism, were significantly associated with SRP-DGs and identified ten drugs targeting SRP-DGs.
Conclusion: We constructed a reliable SRP-related ANN model for the diagnosis of SSc-PH and investigated the possible role of SRP in the etiopathogenesis of SSc-PH by bioinformatics methods to provide a basis for precision and personalized medicine.
Systemic sclerosis (SSc) is a type of connective tissue disease (CTD). There are three main characteristics of SSc: inflammation, fibrosis, and vasculopathy (Denton and Khanna, 2017). In the early stage, the pathological process of SSc is predominantly inflammatory and may manifest as swollen fingers, inflammatory skin disease, and musculoskeletal inflammation (Sticherling, 2019). In the advanced stage, the pathological process of SSc is dominated by fibrosis and vasculopathy, which can manifest as lung fibrosis, cardiac fibrosis, pulmonary hypertension (PH), and even scleroderma renal crisis (Asano, 2020). Among the major complications of SSc, PH significantly impacts the mortality of SSc patients (Xiong et al., 2022). Some studies have shown that the 3-year survival rate for patients with systemic sclerosis-associated pulmonary hypertension (SSc-PH) is between 31% and 52%, while the 5-year survival rate is <50% (Foocharoen et al., 2011; Humbert et al., 2011; Lefèvre et al., 2013). Therefore, it is indispensable to develop methods to predict the risk of complications from PH in SSc patients.
However, SSc-PH is a rare disease that develops insidiously, and the early symptoms of SSc-PH, such as fatigue and dyspnea, are nonspecific, thus making diagnoses difficult (Yorke et al., 2014). Researchers have now made progress in developing methods to screen for SSc-PH. The guidelines of the European Society of Cardiology and European Respiratory Society have identified several methods to screen for PH, such as electrocardiography, cardiopulmonary exercise testing, Doppler transthoracic echocardiography, and pulmonary function tests, which are applicable to SSc patients (Galiè et al., 2016). Meanwhile, several algorithms have been developed to screen for SSc-PH. The DETECT algorithm is a noninvasive, two-step predictive algorithm that can be used to evaluate the risk of PH complications in adult SSc patients (Coghlan et al., 2014). It was demonstrated that the sensitivity, specificity, positive predictive value, and negative predictive value of SSc-PH detection when using the DETECT algorithm were 100%, 42.9%, 68.6%, and 100%, respectively (Guillén-Del Castillo et al., 2017). Meanwhile, the Australian Scleroderma Interest Group developed the ASIG algorithm for screening SSc-PH based on NT-proBNP levels and lung function test results, which yielded sensitivity, specificity, positive predictive value, and negative predictive value of 94.1%, 54.5%, 61.5%, and 92.3%, respectively (Thakkar et al., 2013). Although both algorithms effectively screen SSc-PH, their specificities are suboptimal, and further cost-effective evaluations are needed (Kiely et al., 2019).
Several circulating proteins, such as NT-proBNP, endothelin, and vascular endothelial growth factor, have been determined to be biomarkers of SSc-PH (Hickey et al., 2018). Moreover, several microRNAs, such as miR-424, miR-4632, and miR-193b, showed potential as biomarkers of pulmonary vascular remodeling in SSc patients (Odler et al., 2018). In addition, Bauer et al. (2021) identified a proteomic biomarker signature by using machine learning that could improve the specificity of the DETECT algorithm. Zheng et al. (2020) and Tu et al. (2022) identified hub genes of SSc-PH by multiple bioinformatic methods based on microarray data mining. Lui et al. (2022) constructed and compared the performance features of three SSc-PH prediction models using pulmonary function tests, electrocardiography, and imaging data. However, there is a lack of research on constructing diagnostic models for SSc-PH by machine learning based on microarray data. According to our literature review, no studies predicting SSc-PH risk based on artificial neural network (ANN) models have been reported.
The signal recognition particle (SRP) is a ribonucleoprotein formed by 7SL RNA and six protein subunits (SRP9, SRP14, SRP19, SRP54, SRP68, and SRP72 proteins) (Pool, 2022). The main function of SRP is to cotranslationally target many secretory and membrane proteins to the endoplasmic reticulum (ER) (Kellogg et al., 2022). Studies have shown that SRP depletion leads to protein mislocalization to mitochondria, further leading to mitochondrial dysfunction and decreased cell survival (Karamyshev et al., 2020; Hsieh and Shan, 2021). In addition, SRP depletion also leads to pathological activation of the Regulation of Aberrant Protein Production (RAPP), a process implicated in various diseases, including hepatocellular cancer, colorectal cancer, and Alzheimer’s disease (Kellogg et al., 2022). However, whether SRP depletion functions in the progression of SSc evolving into SSc-PH has not been explored.
In this study, we attempted to construct a novel SRP-related ANN model for the early diagnosis and assessment of SSc-PH and to investigate the role of SRP-related genes in the pathogenesis of SSc-PH. We first revealed two SRP expression patterns in SSc-PH and evaluated the signal transduction and immune characteristics in different SRP expression patterns. Next, we identified SRP-related diagnostic genes (SRP-DGs) for SSc-PH using machine learning algorithms and validated the diagnostic efficacy of these SRP-DGs in the test set. Subsequently, we constructed an SRP scoring system called SRPscore, evaluated the relationship between SRPscore and SRP expression patterns and immune characteristics, and constructed a nomogram model. Finally, we constructed a novel ANN model for SSc-PH diagnosis and validated the accuracy of the ANN model in the test set. Moreover, we also revealed the associations between SRP-DGs with immune signature and SSc-PH-related pathways, explored SRP-DGs’ functions using single gene batch correlation analysis-based GSEA, and screened for drugs that may target and regulate SRP-DGs.
We downloaded the datasets from the GEO database, and those that met the following criteria were included in our study: 1) Studies including both peripheral blood mononuclear cell (PBMC) samples from SSc-PH patients and PBMC samples from SSc patients without pulmonary hypertension. 2) Studies whose data and platform information were complete. Three datasets (GSE19617, GSE3346, and GSE22356) were included in our study. Specifically, GSE19617 contains 17 PBMC samples from SSc-PH patients and 25 PBMC samples from SSc patients without pulmonary hypertension, GSE33463 contains 42 PBMC samples from SSc-PH patients and 19 PBMC samples from SSc patients without pulmonary hypertension, and GSE22356 contains 10 PBMC samples from SSc-PH patients and 10 PBMC samples from SSc patients without pulmonary hypertension. Table 1 presents information about the datasets utilized in this study.
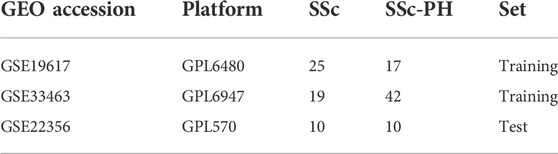
TABLE 1. The information about the datasets utilized in this study.
First, the array probes in the three datasets were transformed into matched gene symbols based on the platform annotation information. Then, to decrease the sample selection bias caused by the different distributions in the training and test sets, it was necessary to make the ratio of the sample size of the treatment group to the sample size of the control group in the training set close to the ratio of the sample size of the treatment group to the sample size of the control group in the test set, so we merged the mRNA expression data in GSE19617 and GSE33463 as the training set and selected GSE22356 as the test set (Bickel et al., 2007). GSE19617 was based on the GPL6480 platform, in which the mRNA expression data had been normalized by the researchers; GSE33463 and GSE22356 were based on the GPL6947 and GPL570 platforms, respectively, in which the mRNA expression data were not normalized (Pendergrass et al., 2010). We used the R package, “limma,” to normalize the mRNA expression data in the GSE33463 and GSE22356 datasets. Subsequently, to remove the batch effect caused by different platforms and different normalization methods, after studying the literature, we found that “ComBat” in the R package, “sva,” can efficiently remove the batch effect among data generated by different laboratories on account of different platforms (Johnson et al., 2007; Thillaiyampalam et al., 2017; Tang et al., 2021). Therefore, we merged the normalized mRNA expression data from GSE19617 and GSE33463 and used “ComBat” in the R package, “sva,” to remove the batch effect (Leek et al., 2012). Through our literature review, we found that among the dimensionality reduction algorithms, both t-distributed stochastic neighbor embedding (tSNE) and uniform manifold approximation and projection (UMAP) can effectively analyze sample-to-sample heterogeneity and detect batch effects (Yang Y. et al., 2021; Xiang et al., 2021). Therefore, we evaluated the efficacy of removing the batch effect by tSNE and UMAP. In addition, we also used these two methods to analyze the difficulty in distinguishing SSc-PH patients from SSc patients without pulmonary hypertension. SangerBox was used to visualize the results (Shen et al., 2022).
We obtained 113 SRP-related genes from the “REACTOME_SRP_DEPENDENT_COTRANSLATIONAL_PROTEIN_TARGETING_TO_MEMBRANE.v7.5.1” gene set in the MSigDB database. We used SSc-PH patients and SSc patients without pulmonary hypertension as the treatment group and control group, respectively, and used the R package, “limma,” with a p-value < 0.05 as the criterion to filter out the differentially expressed SRP-related genes (DE-SRPGs) between the treatment and control groups in the training set (Ritchie et al., 2015). The p values were calculated using the Wilcoxon rank sum test. In addition, we verified the expression patterns of the DE-SRPGs in the test set.
We performed an unsupervised clustering analysis of the SSc-PH patients in the training set based on the DE-SRPGs using the R package, “ConsensusClusterPlus,” (Wilkerson and Hayes, 2010). According to the clustering effect, the clustering stability was higher when k = 2. Therefore, we categorized the SSc-PH patients from the training set into two SRP clusters (SRPcluster A and SRPcluster B) based on the unsupervised clustering results. To further evaluate the relationships among SRPcluster A, SRPcluster B, and the control group, we performed dimensionality reduction of the training set using tSNE and UMAP based on the expression of DE-SRPGs.
To explore the differences in signal transduction between SRPcluster A and SRPcluster B, we downloaded the file, “c2.cp.kegg.v2022.1.Hs.symbols.gmt,” from the MSigDB database for gene set enrichment analysis (GSEA). We performed GSEA using the R package, “clusterProfiler,” and the statistical significance was set to an adjusted p-value of <0.05 (Yu et al., 2012; Wu et al., 2021). Then, GO annotation and KEGG pathway enrichment analysis of the DE-SRPGs were performed using the R package “clusterProfiler.” Significantly enriched signaling pathways were identified using a p-value <0.05 as the criterion. The results were visualized using the R packages, “ggplot2″ and “ComplexHeatmap” (Gu et al., 2016). A single-sample gene set enrichment analysis (ssGSEA) of 29 immune gene sets was performed using the R package, “GSVA” (Hänzelmann et al., 2013). The enrichment scores of 29 immune gene sets in each sample were calculated. Similarly, we obtained 14 SSc-PH-related pathway gene sets from the MSigDB database and performed ssGSEA on 14 SSc-PH-related pathway gene sets. Then, we compared the normalized ssGSEA scores of the treatment and control groups and the normalized ssGSEA scores of SRPcluster A and SRPcluster B. The metagenes of 14 SSc-PH-related pathways are shown in Supplementary Table S1.
For DE-SRPGs, we performed LASSO (least absolute shrinkage and selection operator) regression and SVM-RFE (support vector machine-recursive feature elimination) to identify the optimal signal recognition particle-related diagnostic genes (SRP-DGs) for SSc-PH. For both LASSO regression and SVM-RFE, the seed setting was 123. LASSO regression analysis was performed using the R package, “glmnet,” and SVM-RFE using the R package, “e1071” (Friedman et al., 2010). The SRP-related markers that were identified by the two algorithms were intersected, the intersecting genes were identified as the SRP-DGs, and the accuracy of the SRP-DGs for diagnosis in the training and test sets was evaluated using the receiver operating characteristic curve (ROC). We also compared the expression levels of SRP-DGs in SRPcluster A, SRPcluster B, and the control group.
To further analyze the diagnostic efficacy of the SRP-DGs, we constructed an SRP scoring system based on the SRP-DGs. We referred to the method of previous studies and performed a principal component analysis based on the expression levels of SRP-DGs and used principal component 1 and principal component 2 as feature scores (Sotiriou et al., 2006; Zhang et al., 2020; Zhang et al., 2022). The formula for calculating the SRPscore is:
In the formula, “i” represents the expressions of SRP-DGs. Then, we compared the SRPscore values of the control and treatment groups. Subsequently, we categorized the samples with SRPscore >0 as the high SRPscore group and those with SRPscore ≤0 as the low SRPscore group and analyzed the correlation between SRPscore and SRPcluster. Finally, we compared the normalized ssGSEA scores of 29 immune gene sets in the high SRPscore group with the low SRPscore group. We used ROC to evaluate the accuracy of the SRPscore values for diagnosis in the training and test sets. We then compared SRPscore values in SRPcluster A, SRPcluster B, and the control group.
To predict the risk of SSc-PH, we constructed a nomogram based on the expression levels of the SRP-DGs using the R package, “rms.” We then plotted a calibration curve to determine the extent to which the predicted values corresponded to reality. We carried out a decision curve analysis (DCA) and plotted a clinical impact curve to determine whether clinical decisions based on the nomogram model were beneficial to patients.
We constructed an ANN model using the SRP-DGs. After the gene expression data were normalized using the min-max normalization method, the seed was set to 123. An ANN model was constructed using the R package, “neuralnet.” The ANN consists of three layers: 1) Input layer, which includes the gene expressions of the seven SRP-DGs normalized by the min-max method; 2) hidden layer, which includes the gene expressions of the seven SRP-DGs normalized by the min-max method and the weights of the seven SRP-DGs; 3) output layer, which represents the results of determining whether the samples belong to the control group or treatment group. The number of neurons in the hidden layer should be two-thirds of the number of neurons in the input layer plus two-thirds of the number of neurons in the output layer, and should be in the range between the number of neurons in the input layer and the number of neurons in the output layer (Sheela and Deepa, 2013). Therefore, we set the number of neurons in the hidden layer to six and used the ROC to evaluate the predictive performance of the ANN in the training and test sets.
To assess the correlations between SRP-DGs with immune features and SSc-PH-related pathways, we calculated Spearman’s rank correlation coefficients and p values of the SRP-DGs with normalized ssGSEA scores of 29 immune gene sets and 14 SSc-PH-related pathways, which were visualized using the R package, “ggplot2.”
To further explore SRP-DGs’ functions, we performed GSEA based on single gene batch correlation analysis for each SRP-DG. The idea is to calculate Spearman’s rank correlation coefficients and p values for all genes in the training set with a single gene and to perform GSEA for genes that are significantly positively and negatively correlated with a single gene, respectively, thus simulating the possible involvement of a single gene in activation and suppression of signaling pathways. See Supplementary Table S2 for the code.
Using the Enrichr platform (https://maayanlab.cloud/Enrichr/), we entered the gene names of the SRP-DGs and screened for drugs associated with the SRP-DGs based on the DSigDB database in the “Diseases/Drugs” module with a criterion of p-value < 0.05 (Kuleshov et al., 2016).
Data heterogeneity and batch effects exist between datasets from different studies, which will adversely affect subsequent analyses if not correctly handled. Figures 1A,C show the tSNE plot and UMAP plot of the samples from the GSE19617 and GSE33463 datasets. As shown in Figures 1A,C, there was a clear difference between GSE19617 and GSE33463. Therefore, we must remove the batch effect before proceeding with the analysis. We used the “ComBat” function from the R package, “sva” to remove the batch effect. In the “sva” package, the “sva” function can be used for variable estimation, and the “ComBat” function removes batch effects, thereby reducing dependencies, stabilizing error rate estimates, and improving the reproducibility of the analysis (Leek et al., 2012). Figures 1B,D show the tSNE and UMAP plots for the samples from GSE19617 and GSE33463 after we removed the batch effect using the ComBat function. The results showed that the batch effect between GSE19617 and GSE33463 was removed and the data could then be used for subsequent analyses. In addition, tSNE (Figure 1E) and UMAP (Figure 1F) for the control group (SSc patients without pulmonary hypertension) and treatment group (SSc-PH patients) revealed no significant differences between the control and treatment groups, suggesting diagnostic difficulties.
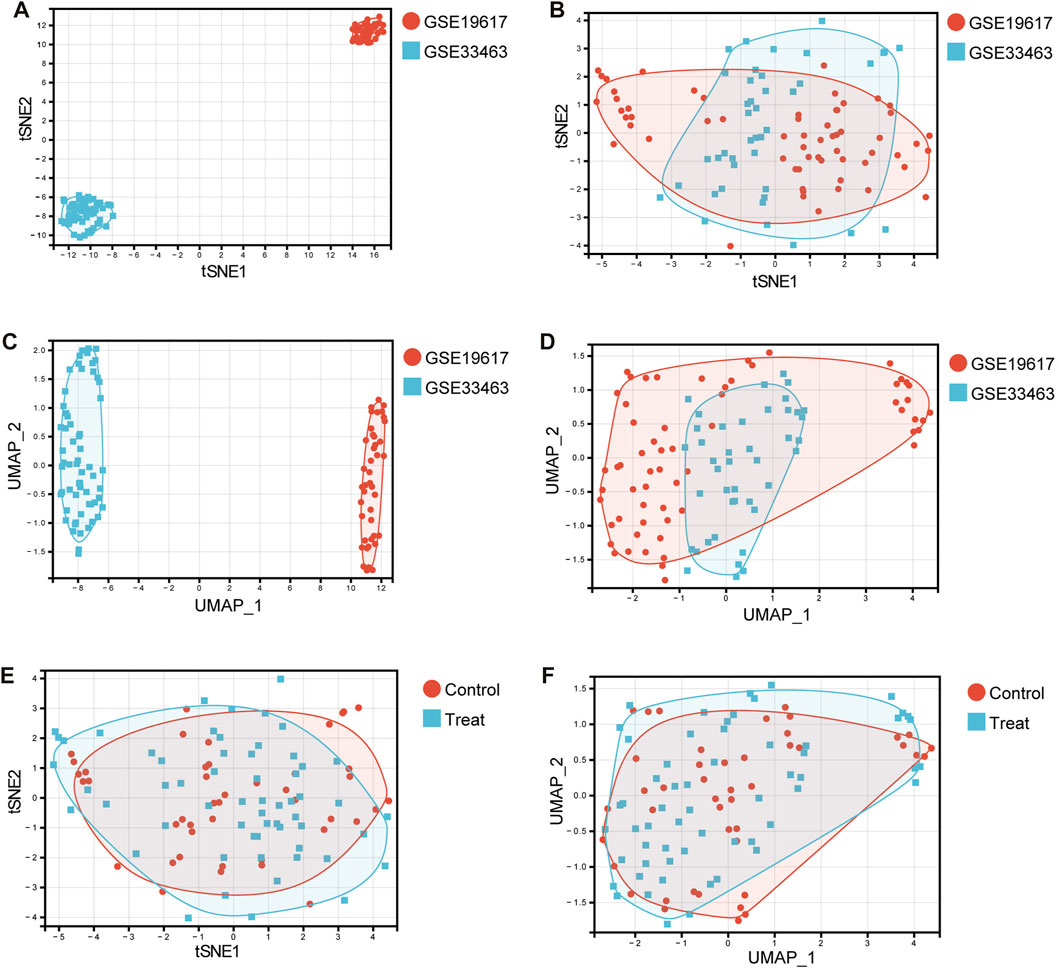
FIGURE 1. Dimensionality reduction using tSNE and UMAP. (A) The tSNE plot before removal of the batch effect. Red dots represent samples in the GSE19617 dataset, and blue squares represent samples in the GSE33463 dataset. (B) The tSNE plot after removal of the batch effect. Red dots represent samples in the GSE19617 dataset, and blue squares represent samples in the GSE33463 dataset. (C) The UMAP plot before removal of the batch effect. Red dots represent samples in the GSE19617 dataset, and blue squares represent samples in the GSE33463 dataset. (D) The UMAP plot after removal of the batch effect. Red dots represent samples in the GSE19617 dataset, and blue squares represent samples in the GSE33463 dataset. (E) The tSNE plot of the control and treatment group samples. Red dots represent control group samples, and blue squares represent treatment group samples. (F) The UMAP plot of the control and treatment group samples. Red dots represent control group samples, and blue squares represent treatment group samples.
We performed a differential analysis of 113 SRP-related genes present in the PBMC samples from SSc-PH patients versus SSc patients without pulmonary hypertension in the training set. The results showed that 30 differentially expressed SRP-related genes (DE-SRPGs) were identified using p < 0.05 as the criterion (Supplementary Table S3). Figure 2A is a box plot of the 30 DE-SRPGs. Notably, all 30 DE-SRPGs were downregulated in SSc-PH. Subsequently, we verified the expression patterns of the DE-SRPGs in the test set. Due to platform differences, the expressions of RPL10, RPL13A, RPL21, RPL23, RPL4, and RPSA were missing in the test set (GSE22356) among the 30 DE-SRPGs. In the test set, all 24 DE-SRPGs were also significantly downregulated in SSc-PH, except for 6 DE-SRPGs that were missing due to platform differences (Figure 2B, Supplementary Table S3). This suggests that SRP-related dysfunctions and defects may occur in the pathogenesis of SSc-PH. For further investigation, we clustered SSc-PH patients based on the DE-SRPGs and performed gene enrichment analysis.
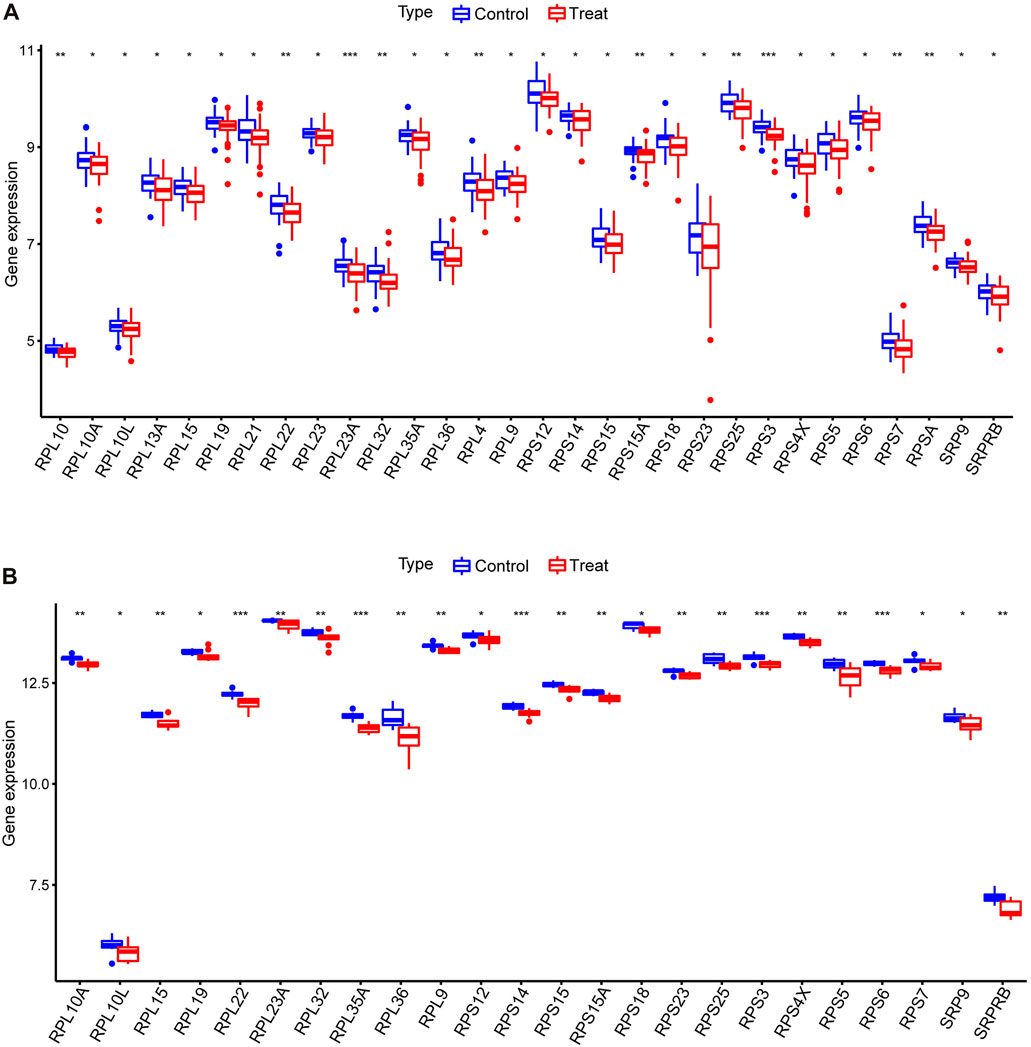
FIGURE 2. Differential analysis of DE-SRPGs. (A) Box plot of 30 DE-SRPGs in the training set. (B) Box plot of the 24 DE-SRPGs (excluding the six missing DE-SRPGs) in the test set. Red denotes the treatment group, and blue denotes the control group. *, p < 0.05; **, p < 0.01; ***, p < 0.001.
To further analyze the role of SRP-related genes in SSc-PH, we performed unsupervised clustering of the PBMC samples from SSc-PH patients in the training set using the expression values of 30 DE-SRPGs with the R package, “ConsensusClusterPlus.” The consensus matrix indicates that at k = 2, the number of patients in each cluster was equally distributed, none of the clusters contained abnormally high or abnormally low numbers of patients, and the correlation between the two clusters was low (Figure 3A). When k = 2, the CDF curve was flat (Figure 3B). Figure 3C shows the variations in the area under the CDF curve for k = 2–9. Finally, SSc-PH patients from the training set were categorized into two clusters: SRPcluster A and SRPcluster B.
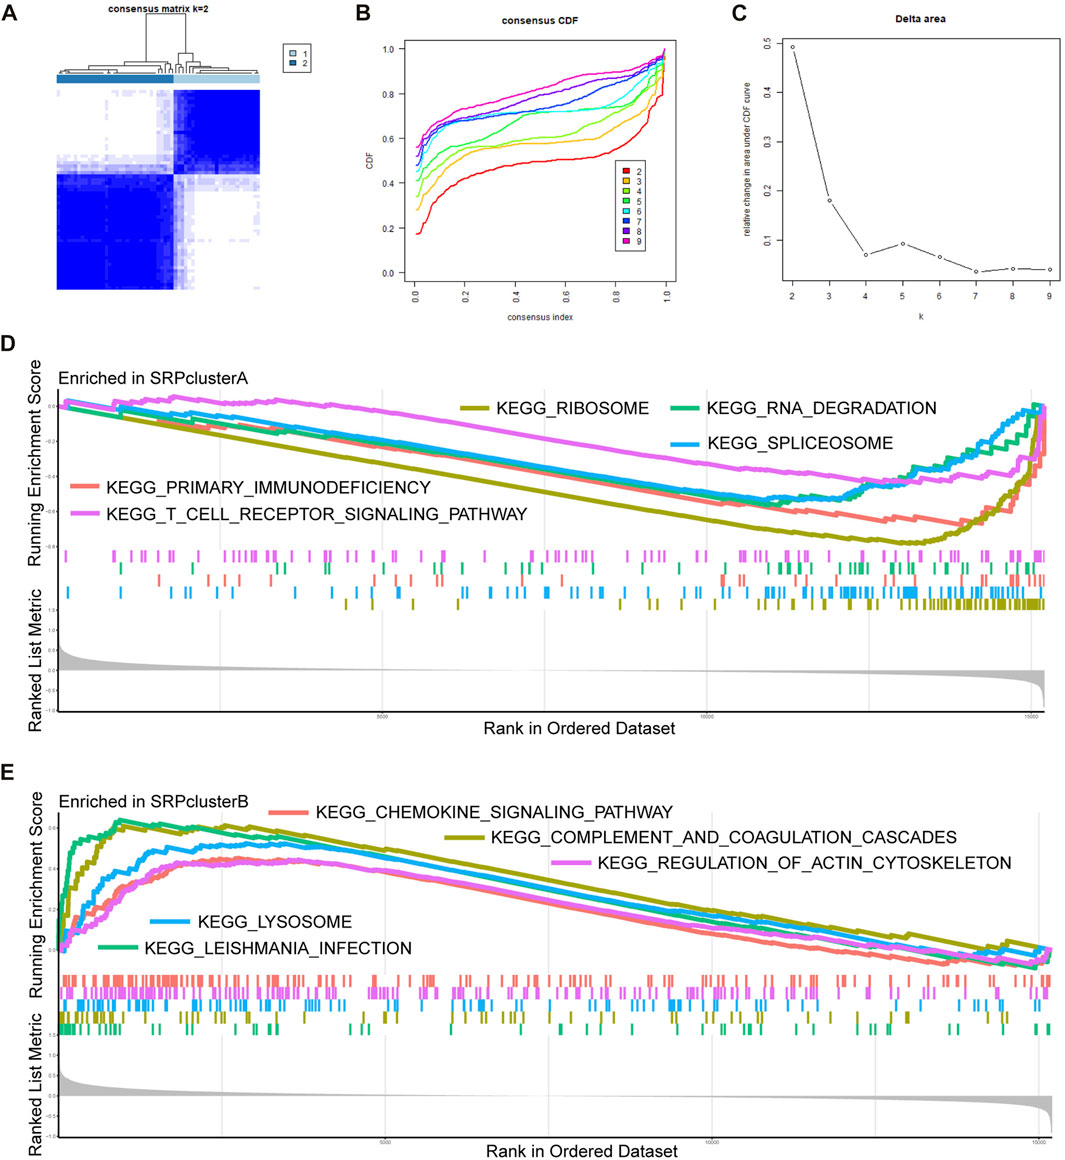
FIGURE 3. Unsupervised clustering and GSEA. (A) Consensus matrix. (B) A CDF graph illustrating the clustering according to DE-SRPGs. (C) Variation of the area under the CDF curve for k = 2–9. (D) The top five enriched KEGG pathways in SRPcluster A.(E) The five most significantly enriched KEGG pathways in SRPcluster B. Adjusted p-value < 0.05 was taken as the criteria. Different colors represent different KEGG pathways, and the names of KEGG pathways are listed in the figure.
We performed dimensionality reduction of the training set using tSNE and UMAP based on the expression of DE-SRPGs. The tSNE plot (Supplementary Figure S1A) and the UMAP plot (Supplementary Figure S1B) indicated that SRPcluster A was closer to the control group than SRPcluster B, suggesting that SRPcluster A may be an SSc-PH subtype closer to the control group in the two clusters.
We performed gene enrichment analysis to explore the potential signaling pathways involved in the SRP gene signature. GSEA indicated that in SRPcluster A, “primary immunodeficiency,” “ribosome,” “RNA degradation,” “spliceosome,” and “T cell receptor signaling pathway” were the significant processes (Figure 3D). In SRPcluster B, the major processes included the “chemokine signaling pathway,” “complement and coagulation cascades,” “Leishmania infection,” “lysosome,” and “regulation of actin cytoskeleton” (Figure 3E).
To further explore the functions of the DE-SRPGs, we performed GO annotation (Figure 4A) and KEGG enrichment analysis (Figure 4B) on 30 DE-SRPGs. Supplementary Table S4 shows the complete GO annotation results, and Supplementary Table S5 shows the complete KEGG enrichment analysis results. The GO annotation results suggested that the 30 DE-SRPGs were predominantly enriched in functions and pathways associated with SRP. The most abundant GO biological process (BP) was protein targeting to ER (Figure 4A). Meanwhile, the most abundant GO cellular component (CC) was cytosolic ribosome (Figure 4A), and the most abundant GO molecular function (MF) was structural constituent of ribosome (Figure 4A). The results of the KEGG enrichment analysis indicated that 30 DE-SRPGs were significantly enriched in three signaling pathways: ribosome, coronavirus disease—COVID-19, and protein export (Figure 4B).
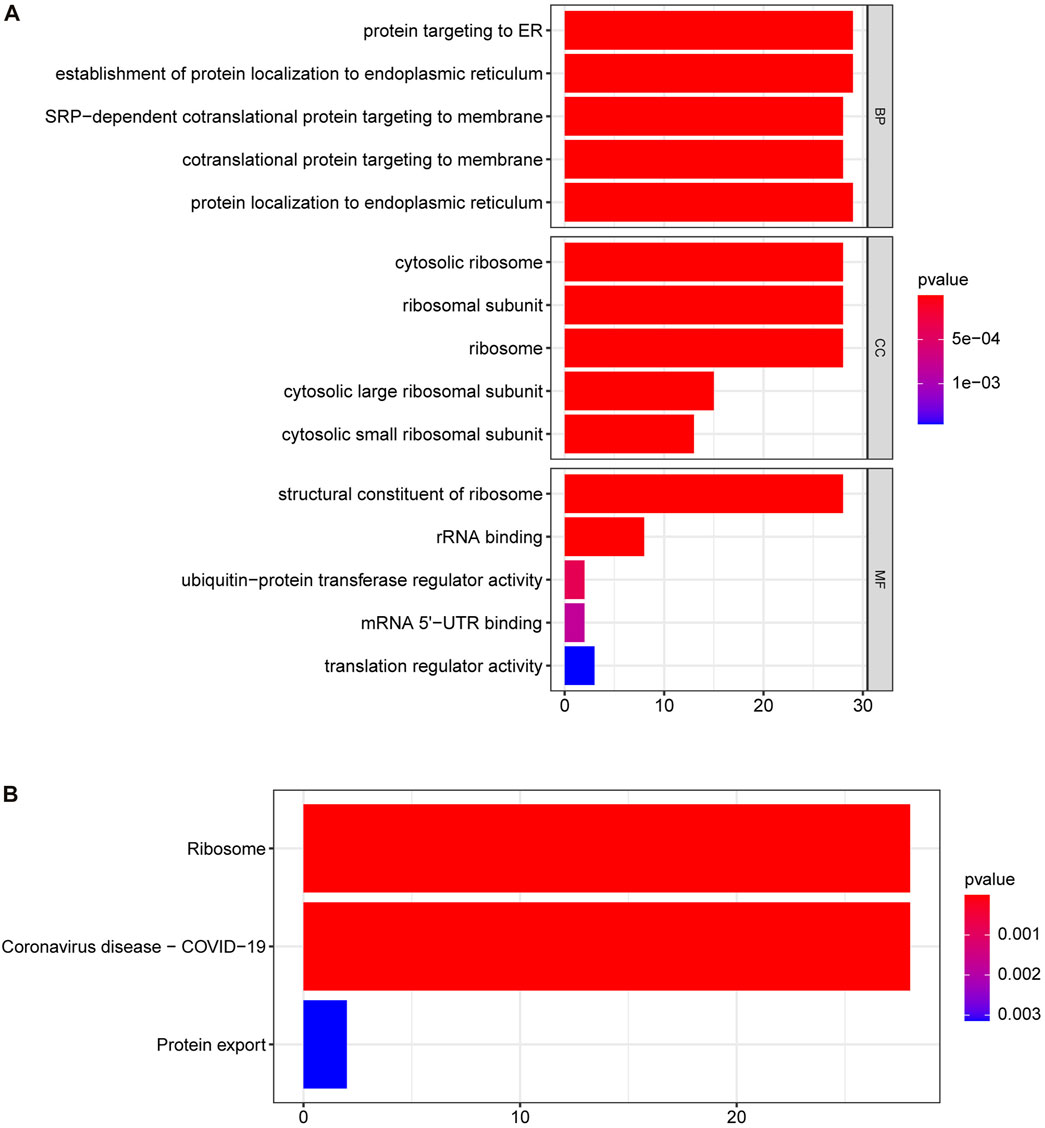
FIGURE 4. GO annotation and KEGG enrichment analysis of 30 DE-SRPGs. (A) Top five enriched biological processes, cellular components, and molecular functions. (B) The significantly enriched KEGG pathways. Using a p-value <0.05 as criteria. BP, biological process; CC, cellular component; MF, molecular function.
Subsequently, to determine the relationships among the DE-SRPG expression patterns and immune characteristics, we quantified the normalized ssGSEA scores of typical immune cells and pathways (Figure 5). Between SRPcluster A and SRPcluster B, there were a series of immune cells and pathways that were significantly upregulated in SRPcluster A, including APC costimulation, B cells, T-cell costimulation, T follicular helper cells (Tfh), and tumor-infiltrating lymphocytes (TIL) (Figure 5A). B cells, dendritic cells (DCs), NK cells, T helper cells, and the type II IFN response showed significant differences between the control group (SSc patients without pulmonary hypertension) and treatment group (SSc-PH patients) (Figure 5B). Among the 14 SSc-PH-related pathways, complement and coagulation cascades, complement system, endothelin, interleukin-1, interleukin-8, and osteopontin were significantly upregulated while immunoglobulin was significantly downregulated in SRPcluster B compared with SRPcluster A (Figure 6A). Complement activation, complement and coagulation cascades, complement system, interleukin-12, and troponin were significantly upregulated, while immunoglobulin and interleukin-5 were significantly downregulated in the treatment group compared to the control group (Figure 6B).
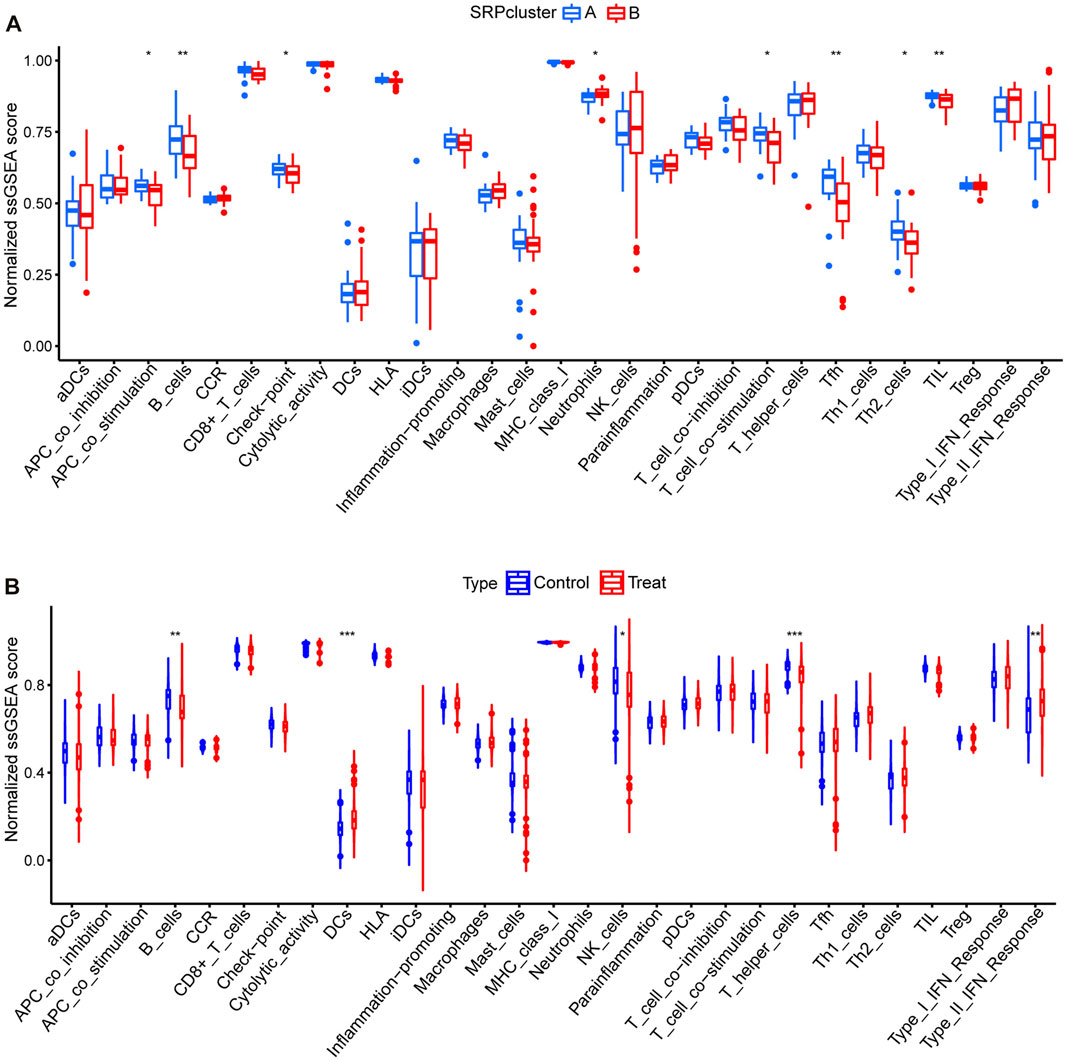
FIGURE 5. ssGSEA for 29 immune gene sets. (A) Comparison of normalized ssGSEA scores of 29 immune gene sets between SRPcluster A and SRPcluster B. (B) Comparison of normalized ssGSEA scores of 29 immune gene sets between treatment and control groups. *, p < 0.05; **, p < 0.01; ***, p < 0.001.
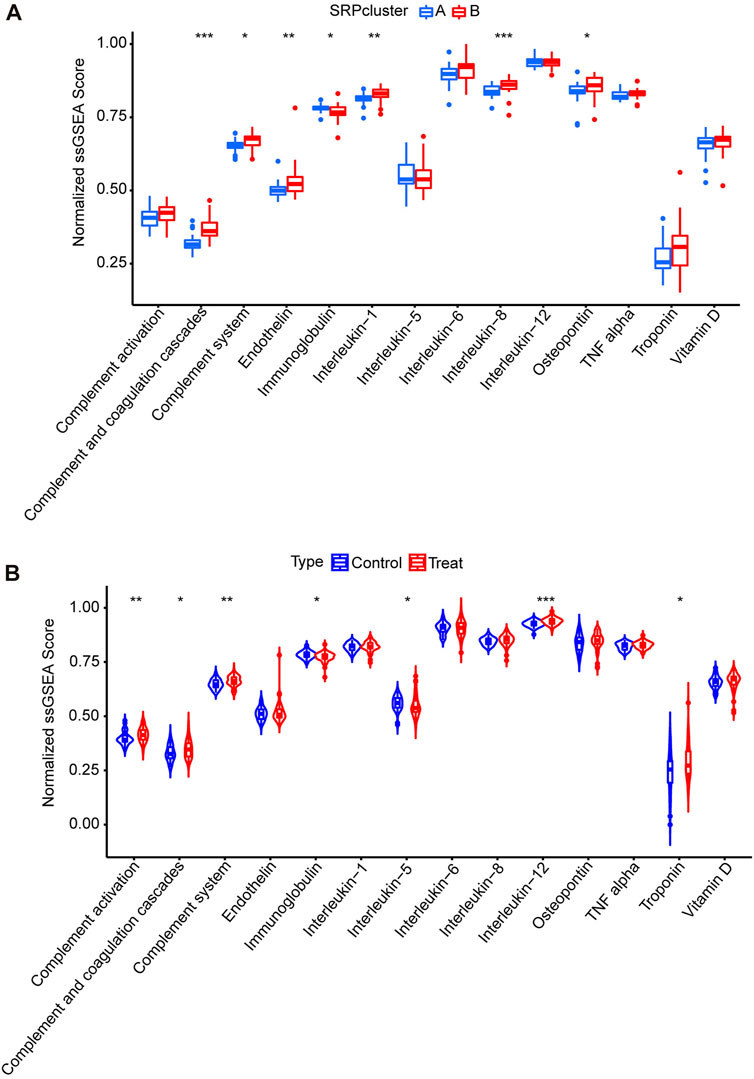
FIGURE 6. ssGSEA for14 SSc-PH-related pathways. (A) Comparison of normalized ssGSEA scores of 14 SSc-PH-related pathways between SRPcluster A and SRPcluster B. (B) Comparison of normalized ssGSEA scores of 14 SSc-PH-related pathways between treatment and control groups. *, p < 0.05; **, p < 0.01; ***, p < 0.001.
We further screened the SRP-related diagnostic genes (SRP-DGs) for SSc-PH in the DE-SRPGs with two machine learning algorithms. The results showed that we identified nine SRP-related potential diagnostic markers with the LASSO regression algorithm (Figure 7A). Meanwhile, 16 SRP-related potential diagnostic markers were identified by the SVM-RFE algorithm (Figure 7B). Finally, they were intersected to obtain eight SRP-related diagnostic genes (SRP-DGs), namely, RPL10, RPL32, RPS12, RPS14, RPS23, RPS3, RPS7, and SRP9 (Figure 7C).
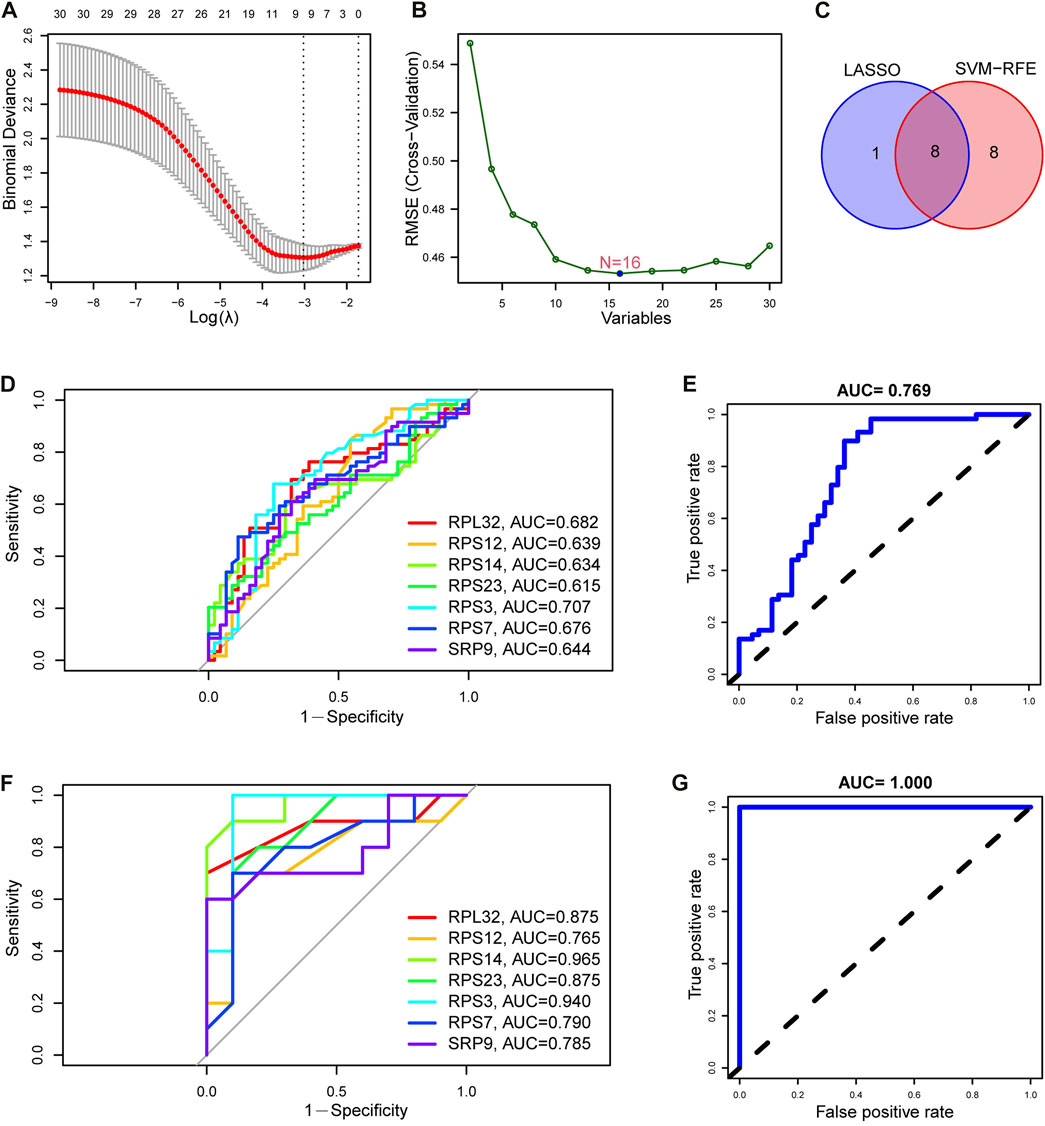
FIGURE 7. Identification and validation of SRP-DGs. (A) Screening of SRP-associated diagnostic markers using the LASSO regression algorithm. (B) Screening of SRP-associated diagnostic markers using the SVM-RFE algorithm. (C) Venn diagram showing the intersection of SRP-associated diagnostic markers screened by both algorithms. (D) ROC curves for the seven SRP-DGs in the training set. (E) The ROC curve for the combined diagnosis of seven SRP-DGs in the training set. (F) ROC curves for the seven SRP-DGs in the test set. (G) The ROC curve for the combined diagnosis of seven SRP-DGs in the test set.
From the previous results, we learned that the expression of RPL10 was missing in the test set (GSE22356) among the eight SRP-DGs due to platform differences. This leads to the fact that if the diagnostic model is constructed using all eight SRP-DGs, it will cause inconsistencies between the model in the training set and test set and cause difficulties in validation. Therefore, we used seven SRP-DGs, namely, RPL32, RPS12, RPS14, RPS23, RPS3, RPS7, and SRP9, to construct the diagnostic model for SSc-PH.
Subsequently, we plotted the ROC curves for the seven SRP-DGs. The results showed that RPL32, RPS12, RPS14, RPS23, RPS3, RPS7, and SRP9 had good diagnostic efficacy in the training set, with area under the ROC curve (AUC) values of 0.682, 0.639, 0.634, 0.615, 0.707, 0.676, and 0.644, respectively (Figure 7D). When the seven SRP-DGs were combined into one signature, the AUC value was 0.769 (Figure 7E). We also validated the diagnostic efficacy of the seven SRP-DGs in the test set. The results showed that the AUC values of RPL32, RPS12, RPS14, RPS23, RPS3, RPS7, and SRP9 were 0.875, 0.765, 0.965, 0.875, 0.940, 0.790, and 0.785 in the test set, respectively (Figure 7F). When the seven SRP-DGs were combined into one signature, the AUC value was 1.000 (Figure 7G).
As a result, these seven SRP-DGs can effectively distinguish SSc-PH patients from SSc patients without pulmonary hypertension and have better diagnostic efficacy when combined.
In addition, we compared the expression levels of seven SRP-DGs in SRPcluster A, SRPcluster B, and the control group (Supplementary Figure S2A–G). The results indicated that the expression levels of seven SRP-DGs in SRPcluster A were closer to those in the control group than in SRPcluster B.
To more accurately quantify the personalized SRP-related gene expression pattern of each patient, we constructed a scoring system, SRPscore, based on the seven SRP-DGs. Supplementary Table S6 shows the SRPscore values of the samples in the training set, and Supplementary Table S7 shows the SRPscore values of the samples in the test set. We visualized the attributes of each SSc-PH patient using alluvial plots (Figure 8A). The results showed that most SSc-PH patients with high SRPscore values belonged to SRPcluster B, whereas the majority of SSc-PH patients with low SRPscore values belonged to SRPcluster A (Figure 8A). The SRPscore values in the treatment group were significantly higher than those in the control group in both the training and test sets (Figures 8B,C).
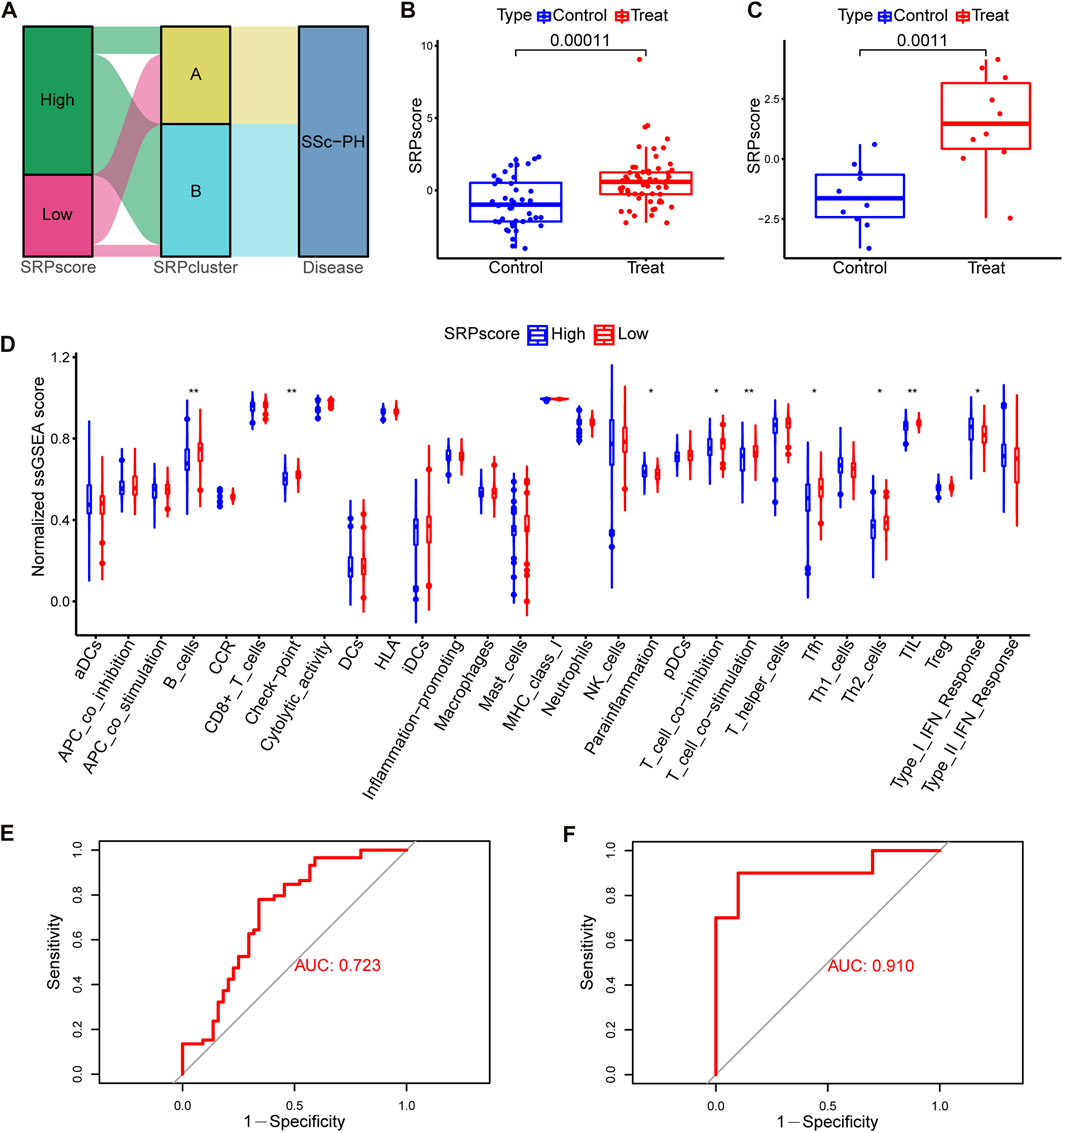
FIGURE 8. Construction and analysis of the SRPscore. (A) An alluvial plot showing SRPcluster, SRPscore, and disease changes. (B) SRPscore difference between the treatment and control groups in the training set. (C) SRPscore difference between the treatment and control groups in the test set. (D) Differences in normalized ssGSEA scores for the 29 immune gene sets between different SRPscore groups. (E) The ROC curve of the SRPscore in the training set. (F) The ROC curve of the SRPscore in the test set. *, p < 0.05; **, p < 0.01; ***, p < 0.001.
Subsequently, we investigated whether patients in the high SRPscore group had a different type of immune cell infiltration than those in the low SRPscore group. The ssGSEA results showed that the patients in the high SRPscore group had significantly lower normalized ssGSEA scores for “B cells,” “check-point,” “T cell co-inhibition,” “T cell co-stimulation,” “Tfh” (T follicular helper cells), “Th2” (T helper 2 cells) and “TIL” (tumor-infiltrating lymphocytes) but significantly higher normalized ssGSEA scores for “parainflammation” and “type I IFN response” than those in the low SRPscore group (Figure 8D).
Then, we tested whether the SRPscore values could be used as an independent diagnostic biomarker to distinguish SSc-PH patients from SSc patients without pulmonary hypertension. The results showed that the AUC values of the SRPscore were 0.723 and 0.910 in the training set (Figure 8E) and test set (Figure 8F), respectively, thus validating the diagnostic efficacy of the SRPscore.
We compared the SRPscore values in SRPcluster A, SRPcluster B, and the control group (Supplementary Figure S2H). The results showed that the SRPscore values in SRPcluster A were closer to the control group than SRPcluster B, further demonstrating that the SRP-related gene expression patterns in SRPcluster A were closer to that of the control group.
To further investigate the relationships among the SRP-DGs and risk of SSc-PH, we constructed a nomogram model using seven SRP-DGs (RPL32, RPS12, RPS14, RPS23, RPS3, RPS7, and SRP9) to predict the risk of pulmonary hypertension complications in patients with SSc (Figure 9A). The calibration curve indicated that the nomogram model was relatively accurate in predicting SSc-PH (Figure 9B). The decision curve demonstrated that the predictions made using the nomogram model could be beneficial to patients (Figure 9C). Moreover, the clinical impact curve indicated the good predictive capacity of the nomogram model (Figure 9D).
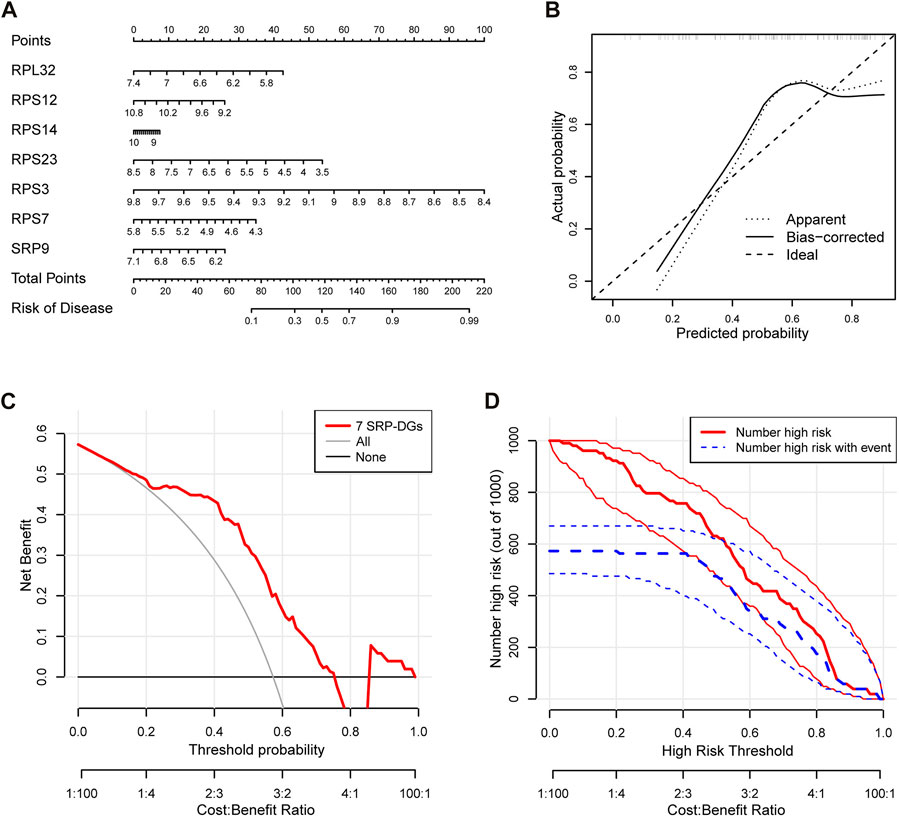
FIGURE 9. Construction of an SSc-PH diagnostic model based on seven SRP-DGs. (A) Nomogram for predicting SSc-PH risk based on seven SRP-DGs. (B) The calibration curve showing the accuracy of predicting SSc-PH. (C) The decision curve for analyzing the benefits of the diagnostic model. (D) The clinical impact curve showing the predicted probability of the diagnostic model.
After normalizing the expressions of the seven SRP-DGs using the min-max method, we constructed an ANN model to predict whether the samples belonged to the control group or treatment group (Figure 10A). The output results of the artificial neural network are shown in Supplementary Table S8. Then, we compared the prediction results of the ANN model with the actual grouping information and evaluated the model prediction accuracy. Subsequently, we performed ROC to evaluate the prediction performances of the ANN in the training and test sets. The results showed that the AUC values for the training and test sets were 0.999 and 0.860, respectively (Figures 10B,C). Table 2 shows the complete results of the prediction accuracies and AUC values of the ANN for the training and test sets. Overall, the ANN model was credible and has potential as an independent diagnostic predictor of SSc-PH. The results also confirmed that SRP-related genes are likely to play an essential role in the pathogenesis of SSc-PH.
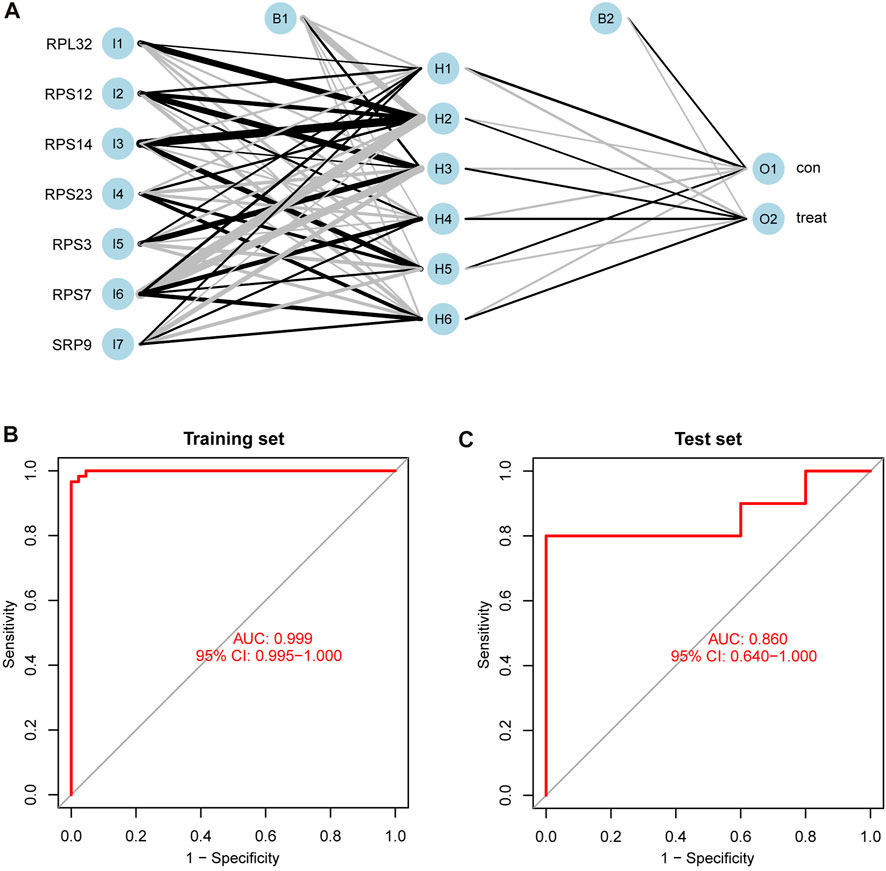
FIGURE 10. Construction and validation of ANN. (A) The process of constructing ANN. (B) ROC curve of ANN in the training set with an AUC value of 0.999. (C) ROC curve of ANN in the test set with an AUC value of 0.860. 95% CI: 95% confidence interval.
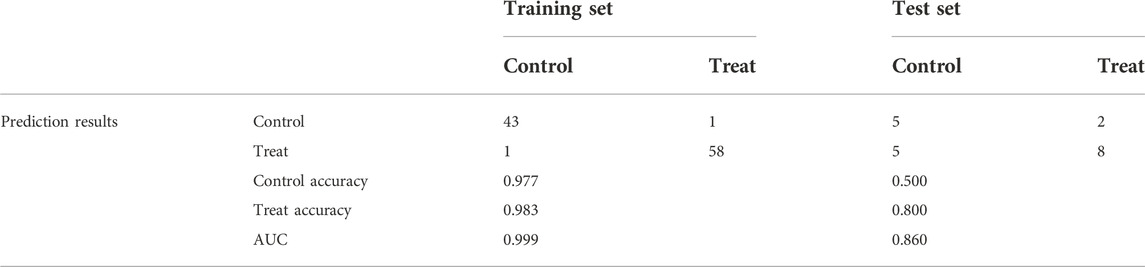
TABLE 2. Neural network diagnostics for the training and test sets.
We calculated Spearman correlation coefficients and p values for the expressions of seven SRP-DGs with normalized ssGSEA scores for 29 immune gene sets and 14 SSc-PH-related pathways. The results showed that the seven SRP-DGs were related to a series of immune cells, functions, and SSc-PH-related pathways (Figure 11).
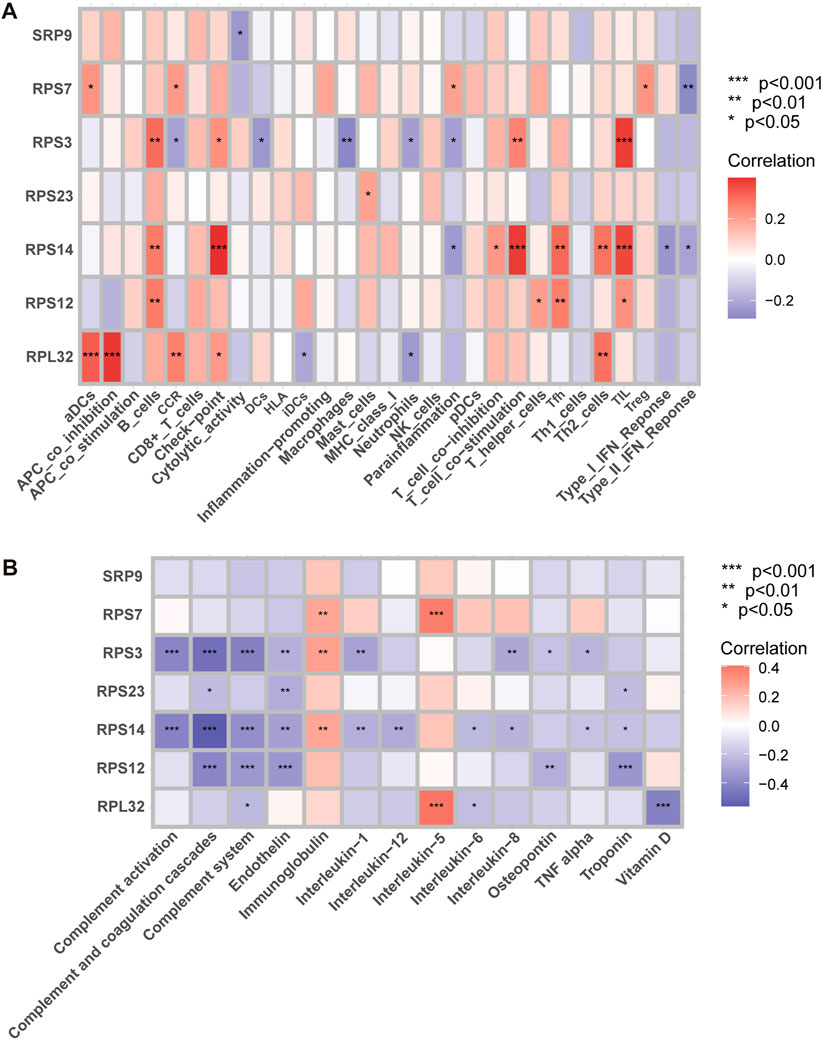
FIGURE 11. Correlation analysis. (A) Correlation analysis between SRP-DGs and immune characteristics. (B) Correlation analysis between SRP-DGs and SSc-PH-related pathways. Red represents positive correlations, and purple represents negative correlations. The deeper the color, the greater the correlation. *, p < 0.05; **, p < 0.01; ***, p < 0.001.
For example, RPL32 was significantly positively correlated with “aDCs” (activated dendritic cells), “APC co-inhibition” (Figure 11A), and “interleukin-5” (Figure 11B) while significantly negatively correlated with “vitamin D” (Figure 11B) (p < 0.001). RPS14 was significantly positively correlated with “check-point,” “T cell co-stimulation,” and “TIL” (Figure 11A) while significantly negatively correlated with “complement activation,” “complement and coagulation cascades,” and “complement system” (Figure 11B) (p < 0.001). RPS3 was significantly positively correlated with “TIL” (Figure 11A) while significantly negatively correlated with “complement activation,” “complement and coagulation cascades,” and “complement system” (Figure 11B) (p < 0.001). RPS12 was significantly negatively correlated with “complement and coagulation cascades,” “complement system,” “endothelin,” and “troponin” (Figure 11B) (p < 0.001). RPS7 was significantly positively correlated with “interleukin-5” (Figure 11B) (p < 0.001). The results suggest that SRP-related genes may influence the immune microenvironments of SSc and SSc-PH patients and disease progression by regulating dendritic cells, T cells, and B cells. Meanwhile, SRP-related genes may regulate functions and pathways that play essential roles in pulmonary vascular remodeling, such as complement activation, the complement system, complement and coagulation cascades, endothelin, troponin, interleukin, and vitamin D.
Supplementary Figure S3 shows the results of single gene batch correlation analysis-based GSEA for RPL32, RPS3, RPS7, and RPS12. Supplementary Figure S4 shows the results of single gene batch correlation analysis-based GSEA for RPS14, RPS23, and SRP9.
The results indicated that all seven SRP-DGs might inhibit heme metabolism. RPS3, RPS7, RPS12, RPS14, RPS23, and SRP9 might inhibit coagulation. RPL32, RPS3, RPS12, RPS14, RPS23, and SRP9 might be involved in the inhibition of interferon-alpha response. RPS3, RPS12, RPS14, RPS23, and SRP9 are likely to be involved in suppressing the interferon-gamma response. RPL32, RPS3, RPS12, and RPS14 may be involved in inhibiting the complement system. RPS3, RPS7, RPS12, and RPS14 potentially activate DNA repair. In addition, the results demonstrated that SRP-DGs might be linked to a series of functions and pathways such as epithelial-mesenchymal transition, IL-6/JAK/STAT3 signaling, TNF alpha signaling, mTORC1, oxidative phosphorylation, inflammatory response, and apoptosis.
Based on the DSigDB database, we used the Enrichr platform to identify drug molecules associated with the seven SRP-DGs with a p-value < 0.05. The combined scores reflect the correlations between drugs and genes, and higher combined scores indicate stronger correlations between drugs and genes. Table 3 lists the drugs with the top ten rankings in their combined score and p values < 0.05. The results indicate that 2,6-DICHLORO-4-NITROPHENOL CTD 00000815 has a strong affinity for RPS3, while Fenbuconazole CTD 00004512 is likely to have a regulatory effect on RPS7.
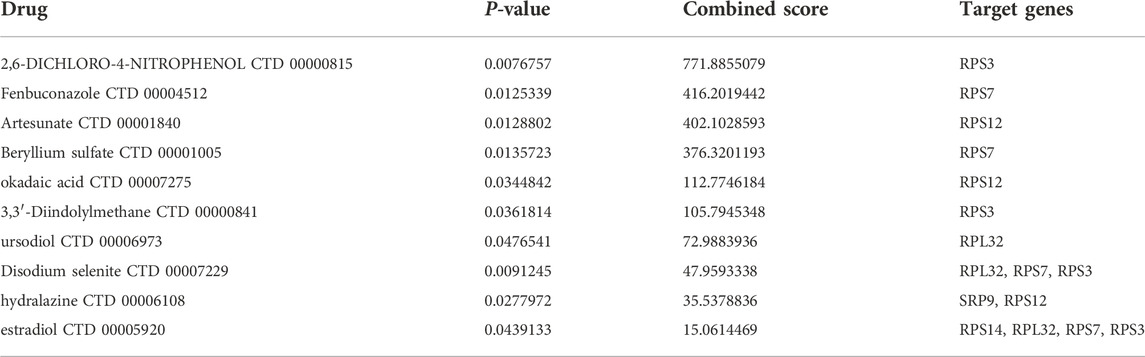
TABLE 3. Potential drugs that may have regulatory effects on the seven SRP-DGs.
The DETECT and ASIG algorithms are routine methods for screening SSc-PH, but the heterogeneity of patient clinical outcomes may limit their application. The entry criteria for the DETECT study were DLCO <60% and SSc durations longer than 3 years, which were designed to ensure that high-risk patients were included; however, in clinical practice, this may have resulted in patients with DLCO ≥60% and patients with early SSc being missed (Hao et al., 2015; Young et al., 2021). It has been shown that the ASIG algorithm has higher specificity than the DETECT algorithm, but it is likely to miss WHO Group 2 PH patients (Hao et al., 2015). Its applicability in different racial populations remains to be explored (Coirier et al., 2021). Therefore, finding new genetic biomarkers and developing more straightforward and objective diagnostic models are necessary. Meanwhile, there is increasing evidence that SRP depletion plays an integral role in autoimmune diseases, cancer, and neurodegenerative diseases (Kellogg et al., 2022). In this study, we identified complex correlations between SRP-related genes and SSc-PH diagnosis. We developed a diagnostic model for SSc-PH containing seven SRP-related genes by using LASSO regression, SVM-RFE, and ANN to effectively distinguish SSc-PH patients from SSc patients and guide SSc-PH diagnosis and treatment.
We obtained 30 DE-SRPGs. In the training set, all 30 DE-SRPGs were significantly downregulated in SSc-PH. Meanwhile, in the test set, except for 6 DE-SRPGs that were missing due to platform differences, all other 24 DE-SRPGs were also significantly downregulated in SSc-PH. This suggests that SRP-dependent cotranslational protein targeting may be dysfunctional in SSc-PH. At the molecular cell biology level, the characteristics of PH include endoplasmic reticulum stress, mitochondrial dysfunction, DNA damage, and transcription factor dysregulation (Lopez-Crisosto et al., 2021). During endoplasmic reticulum stress, the XBP1 protein has a role in increasing the size of the endoplasmic reticulum and reducing endoplasmic reticulum stress. However, the XBP1 protein can only be synthesized when a portion of XBP1 mRNA is cleaved (Park et al., 2021). To cleave this portion of XBP1 mRNA, Ire1α first localizes to the Sec61 channel on the endoplasmic reticulum membrane, while the XBP1 protein is cotranslationally targeted to the Sec61 channel by SRP, and this portion of XBP1 mRNA is cleaved by Ire1α (Plumb et al., 2015). SRP depletion, SRP receptor depletion, and Sec61 depletion all block the above processes. Furthermore, upon SRP depletion, proteins that should be cotranslationally targeted to the endoplasmic reticulum may be mislocalized to the mitochondria, directly leading to mitochondrial dysfunction (Costa et al., 2018). This may also be one reason why SRP depletion leads to SSc-PH. The relationship of SRP with DNA damage and transcription factor dysregulation remains to be explored.
To our surprise, the “coronavirus disease—COVID-19,” was identified in the KEGG enrichment analysis results. It has been demonstrated that two severe acute respiratory syndrome coronavirus 2 (SARS-CoV-2) viral proteins, NSP8 and NSP9, can bind to the 7SL RNA component of SRP, disrupting the function of SRP and inhibiting the transport of membrane proteins, thereby suppressing host immune defenses (Banerjee et al., 2020). Whether this process can lead to pulmonary hypertension in patients with coronavirus disease 2019 (COVID-19) and the potential common pathogenic mechanisms of SSc-PH and COVID-19 remain to be investigated.
In terms of phenotyping, based on different clinical features and pathogenesis, the World Health Organization (WHO) classified PH into five groups (Simonneau et al., 2019). Each group requires a different treatment protocol. SSc-PH may be caused by primary vasculopathy of the small pulmonary arteries (Group 1), left heart failure (Group 2), or interstitial lung disease (Group 3) (Attanasio et al., 2020). However, due to the complexity of SSc-PH, multiple groups of PH are likely to overlap in a single SSc-PH patient, making it challenging to develop a treatment protocol (Attanasio et al., 2020). In this study, we clustered SSc-PH patients based on the SRP-related genes and developed SRPscore, an SRP-related scoring system, to explore the differences in signaling and immune infiltration in SSc-PH patients with different clusters and different scores, which can provide a basis for precision and personalized medicine for SSc-PH. By performing dimensionality reduction by tSNE and UMAP and comparing the expression of SRP-DGs and SRPscore values in SRPcluster A, SRPcluster B, and the control group, we found that the expression patterns of SRP-related genes in SRPcluster A were closer to those in the control group compared with SRPcluster B. Meanwhile, the ssGSEA results indicated that between SRPcluster A and SRPcluster B, the immune responses might be more active in SRPcluster A, while the pathways related to SSc-PH were likely to be more activated in SRPcluster B. However, whether the expression patterns of SRP-related genes and SRPscore are associated with the progression of SSc-PH and have the potential to predict the prognosis of SSc-PH patients needs to be further investigated, which is the direction of a future study.
We identified seven SRP-DGs and constructed a nomogram and ANN model for SSc-PH predictions based on our findings. Among the seven SRP-DGs, downregulation of SRP9 is related to the development and progression of multiple types of cancer. It has been indicated that in breast cancer, deficiencies of SRP9 and SRP14 activate RIG-1, which further causes an interferon response, increases inflammation, and leads to breast cancer metastasis (Nabet et al., 2017). In addition, SRP9 has shown potential as a prognostic marker for colorectal cancer and non-Hodgkin’s lymphoma (Lee et al., 2017; Matsumoto et al., 2021). Among the seven SRP-DGs, RPL32, RPS12, RPS14, RPS23, RPS3, and RPS7 all encode ribosomal proteins. Among them, the protein encoded by RPL32 is part of the large (60S) subunit of ribosomes, while the proteins encoded by RPS12, RPS14, RPS23, RPS3, and RPS7 are involved in structuring the small (40S) subunit of ribosomes (Kang et al., 2021). Ribosomal proteins may regulate SRP-mediated cotranslational protein targeting in two ways. On the one hand, the S domain of SRP binds to the 60S subunit of the ribosome, during which some ribosomal proteins inside the ribosomal tunnel reach the outside of the ribosome, affecting the interaction of the ribosome-nascent chain complex with cytosolic targeting factors, thus regulating SRP and influencing Sec61 channel opening and closing (Schäuble et al., 2012; Denks et al., 2017; Pool, 2022). On the other hand, the N domain of SRP54 also contacts ribosomal proteins, facilitating more timely and efficient recognition of signals, while blocking this process would lead to deficiencies in SRP-dependent cotranslational protein targeting (Dalley et al., 2008). RPS14 haploinsufficiency is associated with myelodysplastic syndrome with chromosome 5q deletion (Schneider et al., 2016). RPS7 may inhibit glycolysis through HIF-1α-related signaling and thus play a protective role in colorectal cancer (Zhang et al., 2016).
Studies have shown that SRP proteins that undergo immune system attack can cause lung and heart diseases (Kassardjian et al., 2015; Milone, 2017). Meanwhile, in a cohort of 460 patients, researchers observed that patients with anti-SRP antibodies developed lung diseases more frequently than those with anti-HMGCR antibodies (Watanabe et al., 2016). Case reports by Below and Bashir (2021) and Baah et al. (2021) also indicated that the early onset of pulmonary hypertension in patients might be associated with SRP proteins. Nevertheless, most of these studies focused on inflammatory myopathies, and the relationships between SRP-DGs and other diseases remain to be explored. Our study suggests that these seven SRP-DGs are important potential biomarkers for SSc-PH, but more studies are needed to validate our results.
Furthermore, we studied the relationships between SRP-DGs and immune characteristics. The results showed that SRP-DGs might affect the immune infiltration microenvironment of SSc-PH by influencing multiple immune cells and pathways, such as activated dendritic cells, B cells, APC coinhibition, and T-cell costimulation. There are few studies on the relationship between SRP and the immune system. It has been demonstrated that anti-SRP antibodies may be involved in the complement cascade and that destruction of SRP subunits by CD5+ B cells and CD4+ T cells contributes to inflammation (Allenbach et al., 2018; Bergua et al., 2019; Kellogg et al., 2022). Correlation analysis for SRP-DGs and 14 SSc-PH-related pathways revealed that SRP-DGs might involve in complement-related biological processes such as complement and coagulation cascades, complement activation, and the complement system, as well as in the regulation of endothelin, troponin, vitamin D, and interleukins. The crucial role of complement activation in pulmonary hypertension has been clarified. Activation of classical and alternative complement pathways has been reported in perivascular lesions (Frid et al., 2020). Meanwhile, the upregulation of granulocyte-macrophage colony-stimulating factor and proliferation of pulmonary vascular tissue can be found downstream of complement activation (Hu et al., 2020). Endothelin levels can reflect the severity of PH and have the potential to predict the response of SSc-PH patients to bosentan treatment (Kawashiri et al., 2014). Troponin is closely correlated with PH and has been identified as a predictive biomarker of mortality in patients with PH (Odler et al., 2018). Reduced serum vitamin D levels are associated with pulmonary involvement in systemic sclerosis (Groseanu et al., 2016). In addition, studies have shown that plasma interleukin-1β, interleukin-6, and interleukin-8 levels are significantly increased in SSc-PH patients, but interleukin-5 levels are not statistically different between SSc-PH and SSc patients (Christmann et al., 2011; McMahan et al., 2015).
Single gene batch correlation analysis-based GSEA revealed that SRP-DGs might be mainly involved in heme metabolism, coagulation, interferon-alpha response, interferon-gamma response, complement system, and DNA repair. In the previous paragraph, we discussed the role of complement in the pathogenesis of SSc-PH. Increased heme metabolism might affect mitochondrial respiration and has been reported to be observed in the lung tissue of patients with advanced PH (Sommer et al., 2022). Coagulation processes have been demonstrated to play an essential role in the pathogenesis of PH (Bazan and Fares, 2018). Hyperactivation of coagulation processes and thrombocytopenia can be observed in patients with PH (Vrigkou et al., 2020). However, the use of anticoagulation reduces mortality in idiopathic PH patients but may increase mortality in SSc-PH patients, and the reasons behind this phenomenon need to be investigated (Khan et al., 2018). George et al. (2014) found elevated levels of interferon-alpha and interferon-gamma in SSc-PH patients compared to SSc patients and demonstrated that type I interferon mediates PH through IFNAR1. DNA damage, genomic instability, and dysregulation of the DNA damage response pathway play a crucial role in the pathogenesis of PH (Sharma and Aldred, 2020). Our study reveals that the expression levels of RPS3, RPS7, RPS12, and RPS14 are positively correlated with DNA repair. Nevertheless, whether SRP-related genes can promote DNA repair and the specific mechanisms involved need to be investigated.
Using the Enrichr platform, we conclude that 2,6-dichloro-4-nitrophenol has a strong affinity for RPS3. 2,6-dichloro-4-nitrophenol is a broad-spectrum inhibitor of sulfotransferases. In hepatocytes, pretreatment with 2,6-dichloro-4-nitrophenol may reduce the hepatotoxicity associated with the application of labetalol hydrochloride (Yang L. et al., 2021). However, whether 2,6-dichloro-4-nitrophenol can be used to treat SSc-PH and its possible interaction pattern with RPS3 still need to be corroborated by more studies.
This study has several limitations. With respect to internal validity, regulation of the immune system by SRP and the role of SRP in the pathogenesis of SSc-PH need more research to be substantiated. We did not filter DE-SRPGs by fold change, which may lead to insufficient stability and interpretability of the results. With respect to external validity, the accuracy of the ANN model needs further investigation, and more basic and clinical studies should be conducted to find more straightforward and cost-effective screening methods for SSc-PH.
The original contributions presented in the study are included in the article/Supplementary Material, further inquiries can be directed to the corresponding author.
JX and CL conceived the idea and designed the study. JX collected, analyzed, and interpreted the data and drafted the manuscript. JL supervised the results of this work and revised the manuscript in detail. All authors discussed the results and contributed to the final manuscript.
We thank the authors of the GSE19617, GSE3346, and GSE22356 datasets for their contribution.
The authors declare that the research was conducted in the absence of any commercial or financial relationships that could be construed as a potential conflict of interest.
All claims expressed in this article are solely those of the authors and do not necessarily represent those of their affiliated organizations, or those of the publisher, the editors and the reviewers. Any product that may be evaluated in this article, or claim that may be made by its manufacturer, is not guaranteed or endorsed by the publisher.
The Supplementary Material for this article can be found online at: https://www.frontiersin.org/articles/10.3389/fgene.2022.1078200/full#supplementary-material
Allenbach, Y., Arouche-Delaperche, L., Preusse, C., Radbruch, H., Butler-Browne, G., Champtiaux, N., et al. (2018). Necrosis in anti-SRP(+) and anti-HMGCR(+)myopathies: Role of autoantibodies and complement. Neurology 90 (6), e507–e517. doi:10.1212/wnl.0000000000004923
Asano, Y. (2020). The pathogenesis of systemic sclerosis: An understanding based on a common pathologic cascade across multiple organs and additional organ-specific pathologies. J. Clin. Med. 9 (9), E2687. doi:10.3390/jcm9092687
Attanasio, U., Cuomo, A., Pirozzi, F., Loffredo, S., Abete, P., Petretta, M., et al. (2020). Pulmonary hypertension phenotypes in systemic sclerosis: The right diagnosis for the right treatment. Int. J. Mol. Sci. 21 (12), E4430. doi:10.3390/ijms21124430
Baah, S., Gorgone, M., and Lachant, D. (2021). Asymptomatic necrotizing myositis in a young male with progressive interstitial lung disease. Respir. Med. Case Rep. 32, 101374. doi:10.1016/j.rmcr.2021.101374
Banerjee, A. K., Blanco, M. R., Bruce, E. A., Honson, D. D., Chen, L. M., Chow, A., et al. (2020). SARS-CoV-2 disrupts splicing, translation, and protein trafficking to suppress host defenses. Cell 183 (5), 1325–1339. doi:10.1016/j.cell.2020.10.004
Bauer, Y., de Bernard, S., Hickey, P., Ballard, K., Cruz, J., Cornelisse, P., et al. (2021). Identifying early pulmonary arterial hypertension biomarkers in systemic sclerosis: machine learning on proteomics from the DETECT cohort. Eur. Respir. J. 57 (6), 2002591. doi:10.1183/13993003.02591-2020
Bazan, I. S., and Fares, W. H. (2018). Hypercoagulability in pulmonary hypertension. Clin. Chest Med. 39 (3), 595–603. doi:10.1016/j.ccm.2018.04.005
Below, S., and Bashir, M. (2021). SRP-positive necrotising myopathy: takes more than just the muscles. BMJ Case Rep. 14 (2), e237647. doi:10.1136/bcr-2020-237647
Bergua, C., Chiavelli, H., Allenbach, Y., Arouche-Delaperche, L., Arnoult, C., Bourdenet, G., et al. (2019). In vivo pathogenicity of IgG from patients with anti-SRP or anti-HMGCR autoantibodies in immune-mediated necrotising myopathy. Ann. Rheum. Dis. 78 (1), 131–139. doi:10.1136/annrheumdis-2018-213518
Bickel, S., Brückner, M., and Scheffer, T. (2007). “Discriminative learning for differing training and test distributions,” in Proceedings of the 24th international conference on Machine learning (USA: Association for Computing Machinery).
Christmann, R. B., Hayes, E., Pendergrass, S., Padilla, C., Farina, G., Affandi, A. J., et al. (2011). Interferon and alternative activation of monocyte/macrophages in systemic sclerosis-associated pulmonary arterial hypertension. Arthritis Rheum. 63 (6), 1718–1728. doi:10.1002/art.30318
Coghlan, J. G., Denton, C. P., Grünig, E., Bonderman, D., Distler, O., Khanna, D., et al. (2014). Evidence-based detection of pulmonary arterial hypertension in systemic sclerosis: the DETECT study. Ann. Rheum. Dis. 73 (7), 1340–1349. doi:10.1136/annrheumdis-2013-203301
Coirier, V., Chabanne, C., Jouneau, S., Belhomme, N., Ballerie, A., Cazalets, C., et al. (2021). Impact of three different algorithms for the screening of SSc-PAH and comparison with the decisions of a multidisciplinary team. Diagn. (Basel) 11 (10), 1738. doi:10.3390/diagnostics11101738
Costa, E. A., Subramanian, K., Nunnari, J., and Weissman, J. S. (2018). Defining the physiological role of SRP in protein-targeting efficiency and specificity. Science 359 (6376), 689–692. doi:10.1126/science.aar3607
Dalley, J. A., Selkirk, A., and Pool, M. R. (2008). Access to ribosomal protein Rpl25p by the signal recognition particle is required for efficient cotranslational translocation. Mol. Biol. Cell 19 (7), 2876–2884. doi:10.1091/mbc.e07-10-1074
Denks, K., Sliwinski, N., Erichsen, V., Borodkina, B., Origi, A., and Koch, H. G. (2017). The signal recognition particle contacts uL23 and scans substrate translation inside the ribosomal tunnel. Nat. Microbiol. 2, 16265. doi:10.1038/nmicrobiol.2016.265
Denton, C. P., and Khanna, D. (2017). Systemic sclerosis. Lancet 390 (10103), 1685–1699. doi:10.1016/s0140-6736(17)30933-9
Foocharoen, C., Nanagara, R., Kiatchoosakun, S., Suwannaroj, S., and Mahakkanukrauh, A. (2011). Prognostic factors of mortality and 2-year survival analysis of systemic sclerosis with pulmonary arterial hypertension in Thailand. Int. J. Rheum. Dis. 14 (3), 282–289. doi:10.1111/j.1756-185X.2011.01625.x
Frid, M. G., McKeon, B. A., Thurman, J. M., Maron, B. A., Li, M., Zhang, H., et al. (2020). Immunoglobulin-driven complement activation regulates proinflammatory remodeling in pulmonary hypertension. Am. J. Respir. Crit. Care Med. 201 (2), 224–239. doi:10.1164/rccm.201903-0591OC
Friedman, J. H., Hastie, T., and Tibshirani, R. (2010). Regularization paths for generalized linear models via coordinate descent. J. Stat. Softw. 33 (1), 1–22. doi:10.18637/jss.v033.i01
Galiè, N., Humbert, M., Vachiery, J. L., Gibbs, S., Lang, I., Torbicki, A., et al. (2016). 2015 ESC/ERS guidelines for the diagnosis and treatment of pulmonary hypertension: The joint task force for the diagnosis and treatment of pulmonary hypertension of the European society of Cardiology (ESC) and the European respiratory society (ERS): Endorsed by: Association for European paediatric and congenital Cardiology (AEPC), international society for heart and lung transplantation (ISHLT). Eur. Heart J. 37 (1), 67–119. doi:10.1093/eurheartj/ehv317
George, P. M., Oliver, E., Dorfmuller, P., Dubois, O. D., Reed, D. M., Kirkby, N. S., et al. (2014). Evidence for the involvement of type I interferon in pulmonary arterial hypertension. Circ. Res. 114 (4), 677–688. doi:10.1161/circresaha.114.302221
Groseanu, L., Bojinca, V., Gudu, T., Saulescu, I., Predeteanu, D., Balanescu, A., et al. (2016). Low vitamin D status in systemic sclerosis and the impact on disease phenotype. Eur. J. Rheumatol. 3 (2), 50–55. doi:10.5152/eurjrheum.2015.0065
Gu, Z., Eils, R., and Schlesner, M. (2016). Complex heatmaps reveal patterns and correlations in multidimensional genomic data. Bioinformatics 32 (18), 2847–2849. doi:10.1093/bioinformatics/btw313
Guillén-Del Castillo, A., Callejas-Moraga, E. L., García, G., Rodríguez-Palomares, J. F., Román, A., Berastegui, C., et al. (2017). High sensitivity and negative predictive value of the DETECT algorithm for an early diagnosis of pulmonary arterial hypertension in systemic sclerosis: application in a single center. Arthritis Res. Ther. 19 (1), 135. doi:10.1186/s13075-017-1327-8
Hänzelmann, S., Castelo, R., and Guinney, J. (2013). GSVA: gene set variation analysis for microarray and RNA-seq data. BMC Bioinforma. 14, 7. doi:10.1186/1471-2105-14-7
Hao, Y., Thakkar, V., Stevens, W., Morrisroe, K., Prior, D., Rabusa, C., et al. (2015). A comparison of the predictive accuracy of three screening models for pulmonary arterial hypertension in systemic sclerosis. Arthritis Res. Ther. 17 (1), 7. doi:10.1186/s13075-015-0517-5
Hickey, P. M., Lawrie, A., and Condliffe, R. (2018). Circulating protein biomarkers in systemic sclerosis related pulmonary arterial hypertension: A review of published data. Front. Med. 5, 175. doi:10.3389/fmed.2018.00175
Hsieh, H. H., and Shan, S. O. (2021). Fidelity of cotranslational protein targeting to the endoplasmic reticulum. Int. J. Mol. Sci. 23 (1), 281. doi:10.3390/ijms23010281
Hu, Y., Chi, L., Kuebler, W. M., and Goldenberg, N. M. (2020). Perivascular inflammation in pulmonary arterial hypertension. Cells 9 (11), E2338. doi:10.3390/cells9112338
Humbert, M., Yaici, A., de Groote, P., Montani, D., Sitbon, O., Launay, D., et al. (2011). Screening for pulmonary arterial hypertension in patients with systemic sclerosis: clinical characteristics at diagnosis and long-term survival. Arthritis Rheum. 63 (11), 3522–3530. doi:10.1002/art.30541
Johnson, W. E., Li, C., and Rabinovic, A. (2007). Adjusting batch effects in microarray expression data using empirical Bayes methods. Biostatistics 8 (1), 118–127. doi:10.1093/biostatistics/kxj037
Kang, J., Brajanovski, N., Chan, K. T., Xuan, J., Pearson, R. B., and Sanij, E. (2021). Ribosomal proteins and human diseases: molecular mechanisms and targeted therapy. Signal Transduct. Target. Ther. 6 (1), 323. doi:10.1038/s41392-021-00728-8
Karamyshev, A. L., Tikhonova, E. B., and Karamysheva, Z. N. (2020). Translational control of secretory proteins in Health and disease. Int. J. Mol. Sci. 21 (7), E2538. doi:10.3390/ijms21072538
Kassardjian, C. D., Lennon, V. A., Alfugham, N. B., Mahler, M., and Milone, M. (2015). Clinical features and treatment outcomes of necrotizing autoimmune myopathy. JAMA Neurol. 72 (9), 996–1003. doi:10.1001/jamaneurol.2015.1207
Kawashiri, S. Y., Ueki, Y., Terada, K., Yamasaki, S., Aoyagi, K., and Kawakami, A. (2014). Improvement of plasma endothelin-1 and nitric oxide in patients with systemic sclerosis by bosentan therapy. Rheumatol. Int. 34 (2), 221–225. doi:10.1007/s00296-013-2861-6
Kellogg, M. K., Tikhonova, E. B., and Karamyshev, A. L. (2022). Signal recognition particle in human diseases. Front. Genet. 13, 898083. doi:10.3389/fgene.2022.898083
Khan, M. S., Usman, M. S., Siddiqi, T. J., Khan, S. U., Murad, M. H., Mookadam, F., et al. (2018). Is anticoagulation beneficial in pulmonary arterial hypertension? Circ. Cardiovasc. Qual. Outcomes 11 (9), e004757. doi:10.1161/circoutcomes.118.004757
Kiely, D. G., Lawrie, A., and Humbert, M. (2019). Screening strategies for pulmonary arterial hypertension. Eur. Heart J. Suppl. 21, K9–K20. doi:10.1093/eurheartj/suz204
Kuleshov, M. V., Jones, M. R., Rouillard, A. D., Fernandez, N. F., Duan, Q., Wang, Z., et al. (2016). Enrichr: a comprehensive gene set enrichment analysis web server 2016 update. Nucleic Acids Res. 44, W90–W97. doi:10.1093/nar/gkw377
Lee, S. H., Kim, H. P., Kang, J. K., Song, S. H., Han, S. W., and Kim, T. Y. (2017). Identification of diverse adenosine-to-inosine RNA editing subtypes in colorectal cancer. Cancer Res. Treat. 49 (4), 1077–1087. doi:10.4143/crt.2016.301
Leek, J. T., Johnson, W. E., Parker, H. S., Jaffe, A. E., and Storey, J. D. (2012). The sva package for removing batch effects and other unwanted variation in high-throughput experiments. Bioinformatics 28 (6), 882–883. doi:10.1093/bioinformatics/bts034
Lefèvre, G., Dauchet, L., Hachulla, E., Montani, D., Sobanski, V., Lambert, M., et al. (2013). Survival and prognostic factors in systemic sclerosis-associated pulmonary hypertension: a systematic review and meta-analysis. Arthritis Rheum. 65 (9), 2412–2423. doi:10.1002/art.38029
Lopez-Crisosto, C., Arias-Carrasco, R., Sepulveda, P., Garrido-Olivares, L., Maracaja-Coutinho, V., Verdejo, H. E., et al. (2021). Novel molecular insights and public omics data in pulmonary hypertension. Biochim. Biophys. Acta. Mol. Basis Dis. 1867 (10), 166200. doi:10.1016/j.bbadis.2021.166200
Lui, J. K., Gillmeyer, K. R., Sangani, R. A., Smyth, R. J., Gopal, M. D. M., Trojanowski, M. A., et al. (2022). A multimodal prediction model for diagnosing pulmonary hypertension in systemic sclerosis. Arthritis Care Res. Hob. [Epub ahead of print]. doi:10.1002/acr.24969 (Accessed 10 June 2022).
Matsumoto, Y., Tsukamoto, T., Chinen, Y., Shimura, Y., Sasaki, N., Nagoshi, H., et al. (2021). Detection of novel and recurrent conjoined genes in non-Hodgkin B-cell lymphoma. J. Clin. Exp. Hematop. 61 (2), 71–77. doi:10.3960/jslrt.20033
McMahan, Z., Schoenhoff, F., Van Eyk, J. E., Wigley, F. M., and Hummers, L. K. (2015). Biomarkers of pulmonary hypertension in patients with scleroderma: a case-control study. Arthritis Res. Ther. 17 (1), 201. doi:10.1186/s13075-015-0712-4
Milone, M. (2017). Diagnosis and management of immune-mediated myopathies. Mayo Clin. Proc. 92 (5), 826–837. doi:10.1016/j.mayocp.2016.12.025
Nabet, B. Y., Qiu, Y., Shabason, J. E., Wu, T. J., Yoon, T., Kim, B. C., et al. (2017). Exosome RNA unshielding couples stromal activation to pattern recognition receptor signaling in cancer. Cell 170 (2), 352–366. doi:10.1016/j.cell.2017.06.031
Odler, B., Foris, V., Gungl, A., Müller, V., Hassoun, P. M., Kwapiszewska, G., et al. (2018). Biomarkers for pulmonary vascular remodeling in systemic sclerosis: A pathophysiological approach. Front. Physiol. 9, 587. doi:10.3389/fphys.2018.00587
Park, S. M., Kang, T. I., and So, J. S. (2021). Roles of XBP1s in transcriptional regulation of target genes. Biomedicines 9 (7), 791. doi:10.3390/biomedicines9070791
Pendergrass, S. A., Hayes, E., Farina, G., Lemaire, R., Farber, H. W., Whitfield, M. L., et al. (2010). Limited systemic sclerosis patients with pulmonary arterial hypertension show biomarkers of inflammation and vascular injury. PLoS One 5 (8), e12106. doi:10.1371/journal.pone.0012106
Plumb, R., Zhang, Z. R., Appathurai, S., and Mariappan, M. (2015). A functional link between the co-translational protein translocation pathway and the UPR. Elife 4. doi:10.7554/eLife.07426
Pool, M. R. (2022). Targeting of proteins for translocation at the endoplasmic reticulum. Int. J. Mol. Sci. 23 (7), 3773. doi:10.3390/ijms23073773
Ritchie, M. E., Phipson, B., Wu, D., Hu, Y., Law, C. W., Shi, W., et al. (2015). Limma powers differential expression analyses for RNA-sequencing and microarray studies. Nucleic Acids Res. 43 (7), e47. doi:10.1093/nar/gkv007
Schäuble, N., Lang, S., Jung, M., Cappel, S., Schorr, S., Ulucan, Ö., et al. (2012). BiP-mediated closing of the Sec61 channel limits Ca2+ leakage from the ER. Embo J. 31 (15), 3282–3296. doi:10.1038/emboj.2012.189
Schneider, R. K., Schenone, M., Ferreira, M. V., Kramann, R., Joyce, C. E., Hartigan, C., et al. (2016). Rps14 haploinsufficiency causes a block in erythroid differentiation mediated by S100A8 and S100A9. Nat. Med. 22 (3), 288–297. doi:10.1038/nm.4047
Sharma, S., and Aldred, M. A. (2020). DNA damage and repair in pulmonary arterial hypertension. Genes (Basel) 11 (10), E1224. doi:10.3390/genes11101224
Sheela, K. G., and Deepa, S. N. (2013). Review on methods to fix number of hidden neurons in neural networks. Math. Problems Eng. 2013, 1–11. doi:10.1155/2013/425740
Shen, W., Song, Z., Zhong, X., Huang, M., Shen, D., Gao, P., et al. (2022). Sangerbox: A comprehensive, interaction-friendly clinical bioinformatics analysis platform. iMeta 1 (3), e36. doi:10.1002/imt2.36
Simonneau, G., Montani, D., Celermajer, D. S., Denton, C. P., Gatzoulis, M. A., Krowka, M., et al. (2019). Haemodynamic definitions and updated clinical classification of pulmonary hypertension. Eur. Respir. J. 53 (1), 1801913. doi:10.1183/13993003.01913-2018
Sommer, N., Theine, F. F., Pak, O., Tello, K., Richter, M., Gall, H., et al. (2022). Mitochondrial respiration in peripheral blood mononuclear cells negatively correlates with disease severity in pulmonary arterial hypertension. J. Clin. Med. 11 (14), 4132. doi:10.3390/jcm11144132
Sotiriou, C., Wirapati, P., Loi, S., Harris, A., Fox, S., Smeds, J., et al. (2006). Gene expression profiling in breast cancer: understanding the molecular basis of histologic grade to improve prognosis. J. Natl. Cancer Inst. 98 (4), 262–272. doi:10.1093/jnci/djj052
Sticherling, M. (2019). Systemic sclerosis - the dermatological perspective. J. Dtsch. Dermatol Ges. 17 (7), 716–728. doi:10.1111/ddg.13887
Tang, K., Ji, X., Zhou, M., Deng, Z., Huang, Y., Zheng, G., et al. (2021). Rank-in: enabling integrative analysis across microarray and RNA-seq for cancer. Nucleic Acids Res. 49 (17), e99. doi:10.1093/nar/gkab554
Thakkar, V., Stevens, W., Prior, D., Youssef, P., Liew, D., Gabbay, E., et al. (2013). The inclusion of N-terminal pro-brain natriuretic peptide in a sensitive screening strategy for systemic sclerosis-related pulmonary arterial hypertension: a cohort study. Arthritis Res. Ther. 15 (6), R193. doi:10.1186/ar4383
Thillaiyampalam, G., Liberante, F., Murray, L., Cardwell, C., Mills, K., and Zhang, S. D. (2017). An integrated meta-analysis approach to identifying medications with potential to alter breast cancer risk through connectivity mapping. BMC Bioinforma. 18 (1), 581. doi:10.1186/s12859-017-1989-x
Tu, J., Jin, J., Chen, X., Sun, L., and Cai, Z. (2022). Altered cellular immunity and differentially expressed immune-related genes in patients with systemic sclerosis-associated pulmonary arterial hypertension. Front. Immunol. 13, 868983. doi:10.3389/fimmu.2022.868983
Vrigkou, E., Tsantes, A. E., Kopterides, P., Orfanos, S. E., Armaganidis, A., Maratou, E., et al. (2020). Coagulation profiles of pulmonary arterial hypertension patients, assessed by non-conventional hemostatic tests and markers of platelet activation and endothelial dysfunction. Diagn. (Basel) 10 (10), E758. doi:10.3390/diagnostics10100758
Watanabe, Y., Uruha, A., Suzuki, S., Nakahara, J., Hamanaka, K., Takayama, K., et al. (2016). Clinical features and prognosis in anti-SRP and anti-HMGCR necrotising myopathy. J. Neurol. Neurosurg. Psychiatry 87 (10), 1038–1044. doi:10.1136/jnnp-2016-313166
Wilkerson, M. D., and Hayes, D. N. (2010). ConsensusClusterPlus: a class discovery tool with confidence assessments and item tracking. Bioinformatics 26 (12), 1572–1573. doi:10.1093/bioinformatics/btq170
Wu, T., Hu, E., Xu, S., Chen, M., Guo, P., Dai, Z., et al. (2021). clusterProfiler 4.0: A universal enrichment tool for interpreting omics data. Innovation. 2 (3), 100141. doi:10.1016/j.xinn.2021.100141
Xiang, R., Wang, W., Yang, L., Wang, S., Xu, C., and Chen, X. (2021). A comparison for dimensionality reduction methods of single-cell RNA-seq data. Front. Genet. 12, 646936. doi:10.3389/fgene.2021.646936
Xiong, A., Liu, Q., Zhong, J., Cao, Y., Xiang, Q., Hu, Z., et al. (2022). Increased risk of mortality in systemic sclerosis-associated pulmonary hypertension: a systemic review and meta-analysis. Adv. Rheumatol. 62 (1), 10. doi:10.1186/s42358-022-00239-2
Yang, L., Xin, L., Shi, J., Li, W., Tian, M., Hu, Z., et al. (2021). Metabolic activation and cytotoxicity of labetalol hydrochloride mediated by sulfotransferases. Chem. Res. Toxicol. 34 (6), 1612–1618. doi:10.1021/acs.chemrestox.1c00060
Yang, Y., Sun, H., Zhang, Y., Zhang, T., Gong, J., Wei, Y., et al. (2021). Dimensionality reduction by UMAP reinforces sample heterogeneity analysis in bulk transcriptomic data. Cell Rep. 36 (4), 109442. doi:10.1016/j.celrep.2021.109442
Yorke, J., Armstrong, I., and Bundock, S. (2014). Impact of living with pulmonary hypertension: a qualitative exploration. Nurs. Health Sci. 16 (4), 454–460. doi:10.1111/nhs.12138
Young, A., Moles, V. M., Jaafar, S., Visovatti, S., Huang, S., Vummidi, D., et al. (2021). Performance of the DETECT algorithm for pulmonary hypertension screening in a systemic sclerosis cohort. Arthritis Rheumatol. 73 (9), 1731–1737. doi:10.1002/art.41732
Yu, G., Wang, L. G., Han, Y., and He, Q. Y. (2012). clusterProfiler: an R package for comparing biological themes among gene clusters. Omics 16 (5), 284–287. doi:10.1089/omi.2011.0118
Zhang, B., Wu, Q., Li, B., Wang, D., Wang, L., and Zhou, Y. L. (2020). m(6)A regulator-mediated methylation modification patterns and tumor microenvironment infiltration characterization in gastric cancer. Mol. Cancer 19 (1), 53. doi:10.1186/s12943-020-01170-0
Zhang, W., Tong, D., Liu, F., Li, D., Li, J., Cheng, X., et al. (2016). RPS7 inhibits colorectal cancer growth via decreasing HIF-1α-mediated glycolysis. Oncotarget 7 (5), 5800–5814. doi:10.18632/oncotarget.6807
Zhang, W., Xiao, P., Tang, J., Wang, R., Wang, X., Wang, F., et al. (2022). m6A regulator-mediated tumour infiltration and methylation modification in cervical cancer microenvironment. Front. Immunol. 13, 888650. doi:10.3389/fimmu.2022.888650
Keywords: systemic sclerosis-associated pulmonary hypertension, signal recognition particle, machine learning, artificial neural network, diagnostic model
Citation: Xu J, Liang C and Li J (2022) A signal recognition particle-related joint model of LASSO regression, SVM-RFE and artificial neural network for the diagnosis of systemic sclerosis-associated pulmonary hypertension. Front. Genet. 13:1078200. doi: 10.3389/fgene.2022.1078200
Received: 24 October 2022; Accepted: 17 November 2022;
Published: 28 November 2022.
Edited by:
Shibiao Wan, University of Nebraska Medical Center, United StatesReviewed by:
Mi Ni, Mount Sinai Hospital, United StatesCopyright © 2022 Xu, Liang and Li. This is an open-access article distributed under the terms of the Creative Commons Attribution License (CC BY). The use, distribution or reproduction in other forums is permitted, provided the original author(s) and the copyright owner(s) are credited and that the original publication in this journal is cited, in accordance with accepted academic practice. No use, distribution or reproduction is permitted which does not comply with these terms.
*Correspondence: Jiangtao Li, aHh5eWxqdEAxNjMuY29t
Disclaimer: All claims expressed in this article are solely those of the authors and do not necessarily represent those of their affiliated organizations, or those of the publisher, the editors and the reviewers. Any product that may be evaluated in this article or claim that may be made by its manufacturer is not guaranteed or endorsed by the publisher.
Research integrity at Frontiers
Learn more about the work of our research integrity team to safeguard the quality of each article we publish.