
95% of researchers rate our articles as excellent or good
Learn more about the work of our research integrity team to safeguard the quality of each article we publish.
Find out more
ORIGINAL RESEARCH article
Front. Genet. , 16 November 2022
Sec. Computational Genomics
Volume 13 - 2022 | https://doi.org/10.3389/fgene.2022.1066118
This article is part of the Research Topic Computational Techniques to Annotate Macro-Molecules for Personalized Medicine View all 4 articles
 Thoraia Shinawi1†
 Khalidah Khalid Nasser1,2,3†
 Fatima Amanullah Moradi2,4†
 Abdulrahman Mujalli5
 Walaa F. Albaqami6
 Haifa S. Almukadi7
 Ramu Elango2,8
 Noor Ahmad Shaik2,8*
 Babajan Banaganapalli2,8*
Background: Prostate cancer (PC) is a fatally aggressive urogenital cancer killing millions of men, globally. Thus, this study aims to identify key miRNAs, target genes, and drug targets associated with prostate cancer metastasis.
Methods: The miRNA and mRNA expression datasets of 148 prostate tissue biopsies (39 tumours and 109 normal tissues), were analysed by differential gene expression analysis, protein interactome mapping, biological pathway analysis, miRNA-mRNA networking, drug target analysis, and survival curve analysis.
Results: The dysregulated expression of 53 miRNAs and their 250 target genes involved in Hedgehog, ErbB, and cAMP signalling pathways connected to cell growth, migration, and proliferation of prostate cancer cells was detected. The subsequent miRNA-mRNA network and expression status analysis have helped us in narrowing down their number to 3 hub miRNAs (hsa-miR-455-3p, hsa-miR-548c-3p, and hsa-miR-582-5p) and 9 hub genes (NFIB, DICER1, GSK3B, DCAF7, FGFR1OP, ABHD2, NACC2, NR3C1, and FGF2). Further investigations with different systems biology methods have prioritized NR3C1, ABHD2, and GSK3B as potential genes involved in prostate cancer metastasis owing to their high mutation load and expression status. Interestingly, down regulation of NR3C1 seems to improve the prostate cancer patient survival rate beyond 150 months. The NR3C1, ABHD2, and GSK3B genes are predicted to be targeted by hsa-miR-582-5p, besides some antibodies, PROTACs and inhibitory molecules.
Conclusion: This study identified key miRNAs (miR-548c-3p and miR-582-5p) and target genes (NR3C1, ABHD2, and GSK3B) as potential biomarkers for metastatic prostate cancers from large-scale gene expression data using systems biology approaches.
Prostate cancer is a urogenital cancer that accounts for 15% of all cancers in men globally (Group, UCSW, 2014; Van Gool and Pearson, 2014). PC is initially asymptomatic (Ratner, 2021), but painful urination, blood in the urine, or pelvic discomfort symptoms commonly arise as the disease progresses over the months and years (Screening and Board, 2002). The known risk factors for PC include increasing age, African-American ethnicity, fat rich diet, positive family history, and obesity (Bostwick et al., 2004). Early clinical testing and an accurate diagnosis of PC are critical in determining treatment options (Greenlee et al., 2001). The most common biomarker used to detect PC is prostate-specific antigen (PSA) test in the blood. However, it fails to distinguish indolent or aggressive cancer stages (Cancer, IAFRO, 2003). Besides this, increased age or an enlarged or inflamed prostate are the other factors that can also elevate serum PSA leading to misdiagnosis or unnecessary and costly treatment. This warrants the need to identify robust biomarkers that are not only specific and sensitive but also improve the overall accurate diagnosis and prognosis of prostate cancer.
Prostate cancer is estimated to have 58% heritability, highest among all major cancers (Lachance et al., 2018). Family-based linkage studies have identified a series of genes responsible for hereditary PC such as HPC1 (Carter et al., 1992; Cooney et al., 1997; Berry et al., 2000a), PCAP (Neuhausen et al., 1999; Berry et al., 2000a; Xu et al., 2001), HPCX (Schleutker et al., 2000), CAPB (Berry et al., 2000a; Xu et al., 2001), HPC20 (Berry et al., 2000b), HOXB13 (Breyer et al., 2012; Xu et al., 2013) etc. Over the last decades, Genome wide associated studies (GWAS) have identified about 160 common risk loci in PC, suggesting a polygenic model of PC (Farashi et al., 2019). Most of these risk loci genes are involved in the cell cycle or DNA repair (ATM, TERT, MYC, and MDM2), inflammatory response (IL8RB), and metabolism (JAZF1 and HNFB). However, under-representation of ethnic diversity necessitates us to look for universally applicable genetic susceptibility biomarkers for PC. Moreover, the molecular basis of PC could not be fully explained by candidate genetic variants alone, but through the global gene expression alterations. Some studies have confirmed the potential contribution of dysregulated gene expression changes in either blood (Wang et al., 1979; Papsidero et al., 1980; Kuriyama et al., 1981) or prostate biopsies (Ragde et al., 1988), and few were correlated with the survival rate of PC patients (Greenlee et al., 2001). These genes were mainly involved in diverse cellular functions like protein kinase binding, enzyme binding, cell activation and proliferation, Wnt regulation mechanisms, wound healing, apoptosis, etc. (Verras and Sun, 2006; Kypta and Waxman, 2012). However, the specific molecular regulators which control the gene expression changes have not been well characterized.
Gene expression is controlled at both post transcription and translation levels. MicroRNAs (miRNAs) are 18–22 bp long, and known to regulate more than 50% of protein-coding genes at post transcriptional level (Bartel, 2009). Few miRNAs have been identified as potential diagnostic biomarkers of tumour development and metastasis (Nikitina et al., 2012; Ilic et al., 2013). PC associated microRNAs in serum have the potential to successfully distinguish cancer and healthy controls. The aggressive PC is known to show over-expression of oncogenic miRNAs; miR-21, miR-125b, miR-221, and miR-222 (Sun et al., 2009). The miR-21 is over-expressed in PC and contribute to tumour growth (Nikitina et al., 2012) by knocking down PTEN and other tumour suppressor genes (Meng et al., 2007). The miR-200 family is regarded as key regulatory molecule in PC due to their down regulated expression tumor suppressive function and regulatory role in initiation and migration of prostate tumors (Feng et al., 2014). Furthermore, these 5 miRNAs when combined with routine PSA test were shown to improve the PC diagnosis (Siegel et al., 2020). However, influence of miRNAs on differentially expressed genes in prostate tissues is not explored in detail till now.
Owing to the sparse data, this study aimed to expand our current understanding of PC pathogenesis by exploring miRNA-mRNA interactions in prostate gland tissues. By involving a series of comprehensive bioinformatics approaches, this study has identified several gene-network clusters involved in cell communication, inflammation, proliferation, and differentiation processes which, are dysregulated in prostate cancers. Our findings provide a novel insight into understanding the mechanisms of PC, besides uncovering genetic markers with potential for disease diagnosis and therapeutic modulation.
The workflow of current work is presented in Figure 1.
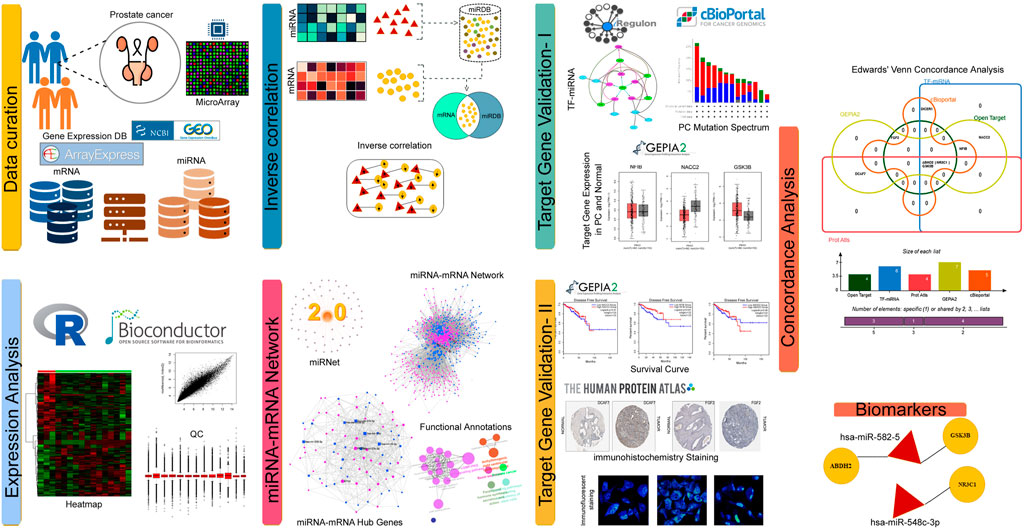
FIGURE 1. Infographics of PC mRNA-miRNA analysis.
The NCBI-GEO and EMBL-EBI Array express databases were initially searched for PC gene expression datasets using keywords like “Prostate Cancer, mRNA, and miRNA.” From the output, one mRNA expression dataset, i.e., GSE6919, and one miRNA expression dataset, i.e., GSE21036, have been selected based on type and number of samples, data quality and expression array method used. The first dataset (GSE6919) consists of the gene expression data of 106 tissue samples (including 25 metastatic prostate tumours and 81 normal prostate tissues) generated on GPL8300 platform (Affymetrix human genome U95 version 2 array). The second dataset, GSE21036, consists of the expression data of miRNAs of 42 Samples (including 14 metastatic prostate tumours and 28 normal prostate tissues) generated on the GPL8227 platform (Agilent-019118 Human miRNA Microarray 2.0 G4470B (miRNA ID version).
We performed differential expression analysis of miRNA and RNA profiles to find the prostate cancer specific dysregulations. We utilized GEO2R (https://www.ncbi.nlm.nih.gov/geo/geo2r/) webtool of NCBI to detect differentially expressed genes (DEGs) and differentially expressed miRNAs (DEMs) in the test datasets. The GEO2R webtool conducts comparative analysis on microarray expression data sets utilizing the GEOquery and limma R packages available in Bioconductor software. The genes or miRNAs showing 1.5-fold changes (FC) at adj. p-values of <0.01 were identified. The expression pattern of these miRNAs and mRNAs were graphically represented in the form of volcano and median mean difference plots.
In the initial phase, miRNA IDs of the DEMs were used to search for their potential target genes in MiRDB webserver (http://mirdb.org/mirdb/mining.html). The target genes showing <70 prediction scores and miRNAs with >2000 predicted targets in the genome were excluded from the output data. Then, keeping the miRDB data as reference, the inverse correlation analysis between miRNA-mRNA expression statuses was performed to screen the miRNA-target gene pairs. The mathematical formula adopted for inverse-correlation of miRNA-mRNA levels is given below (Bima et al., 2022).
In the formula, “n” represents the correlation coefficient, “X” represents DEGs and “Y” represents DEMs.
The miRNA target genes identified from the inverse correlation analysis were further explored with KEGG (Kyoto Encyclopaedia of Genes and Genomes, http://www.genome.jp/kegg/) pathway analysis using ClueGO v2.5., a cytoscape plug-in. KEGG links the genes to functional pathways, with a p-value of <0.05 as an enrichment cut-off measure (Kanehisa and Goto, 2000). ClueGO facilitates the visualization of functionally related genes as a clustered network and overview chart. The statistical test used for the enrichment was based on two-sided hypergeometric option with a Bonferroni step down p-value correction and functional leading group term based on their Kappa score (≥ 0.3).
The prostate cancer genes and miRNA functional interactome network was constructed using miRNET webserver (http://www.mirnet.ca). The miRbase ID and Entrez/Ensembl gene ID were given as input options for miRNAs and DEGs, respectively. The output of this tool is a transcription network along with different network parameters like centrality, betweenness, shortest path etc. The constructed network was visualized through Cytoscape 3.7.1 software. From the network hubs - genes and miRNAs-were selected based on their highest centrality scores (Thul and Lindskog, 2018). Furthermore, the hypergeometric algorithm (option available in functional explorer plugin) was used to identify all KEGG pathways in which the hub genes were involved.
In this step, the hub genes identified from miRNA-target gene pairs were further explored to identify their transcription factor (TF) motifs, and also to assess their drug tractability, expression status and mutational load.
The miRNA-target gene pairs from the network analysis were further explored in iRegulon plugin of Cytoscape to enrich their TF motifs (Janky et al., 2014). The motif prediction parameters were as follows, minimum orthologous gene identity of ≥0.05, the maximal false discovery rate (FDR) on motif similarity of ≤0.001, and normalized enrichment score (NES) of >3. Finally, the miRNA–mRNA-TF regulatory network was constructed utilizing Cytoscape 3.7.1.
The hub genes from miRNA-target gene network were explored in open target platform (http://www.targetvalidation.org). The input option for this tool is query gene ID and the output includes phenotype association characteristics (p = <0.05), predicted tractability (small molecule inhibitors and antibodies) and known drug information (target diseases, mode of action, clinical trials etc.) about the query gene.
All the query hub genes of miRNA-target network were explored in cBioPortal (http://www.cbioportal.org/) to assess their mutational load in prostate cancer tissues. Upon providing the gene ID and cancer type as an input data, oncoprint option available in this webserver visualises the genetic alterations of the queried genes in the form of heatmaps with z-score values. Additionally, the mutation pattern of hub gene pairs in prostate cancers is calculated with Log2 Odds Ratio (OR).
The expression status of query hub genes in normal and cancer tissues, and their disease-free survival curve correlation analysis was performed in GEPIA2 (http://gepia2.cancer-pku.cn/) webserver. The genes showing |log2 fold change| with ≥1 were considered as significant at the p-value of <0.01. Disease-free correlation of hub gene expression status between PC and normal tissues was determined using a log rank test with p < 0.05.
The expression status of hub genes across cell lines and tissues was estimated with Human protein atlas (https://www.proteinatlas.org/) database. This database intake the query gene or protein name and provides the immunocytochemistry/immunofluorescence (ICC-IF) information about the candidate protein’s subcellular location and expression (protein-transcripts per million, pTPM). pTPM, is a normalization method used for comparing the gene expression levels in the same tissue. We also analysed the immunohistochemistry data to enquire the tissue expression status of the query gene. Here the intensity of primary antibody staining between normal and tumour tissues was classified as negative, weak, moderate, or strong based on the detector grain settings used for image acquisition in combination with the visual appearance of the image.
The analysis of GSE6919 dataset has identified the expression of 9,153 genes corresponding to 12,558 probes. A total of 709 genes were found to be differentially expressed (log2 ≥ 1.5 folds), between metastatic prostate tissues compared to normal prostate tissues. Of these DEGs, 290 (40.90%) were upregulated and 419 (59.10%) were down regulated (p < 0.05). Simultaneously, a total of 373 miRNAs corresponding to 373 probes were detected from the analysis of GES21036 dataset. Metastatic prostate tumours have demonstrated the dysregulated expression (log2 ≥ 1.5 folds) of 65 miRNAs, including 28 upregulated and 37 downregulated when compared to normal prostate tissues (p < 0.05) (Figures 2A,B). The details of top 4 genes and miRNAs are listed in Table 1.
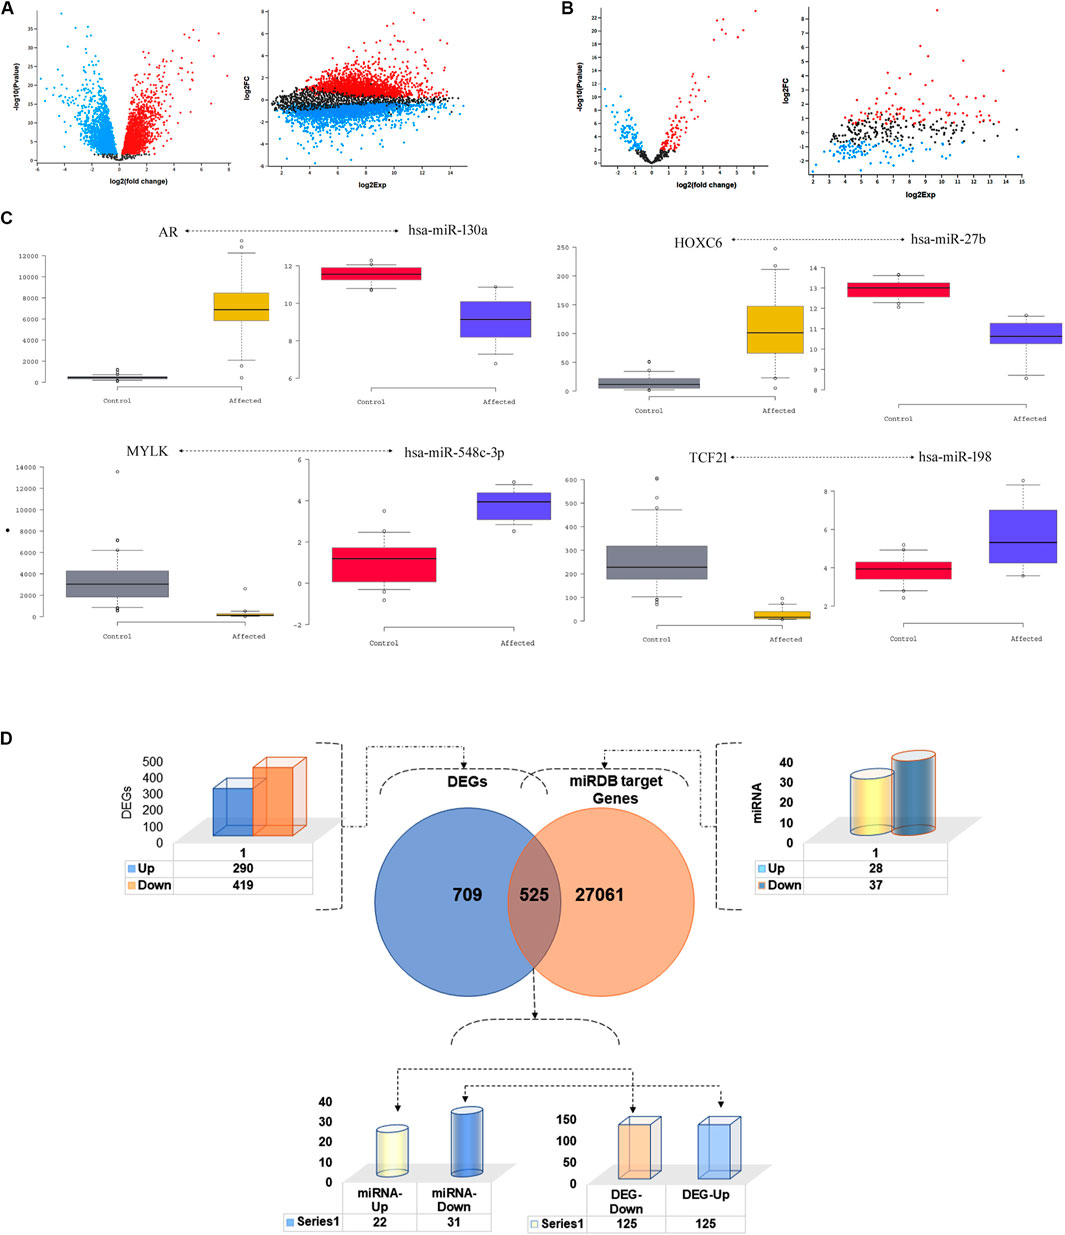
FIGURE 2. Distribution of differentially expressed genes and miRNAs. Volcano plots of (A) GSE6919 and (B) GSE21036 datasets showing the transcript expression profiles mRNA and miRNA respectively, of metastatic prostate cancer and normal prostate tissues. Red and blue dots correspond to the up and down regulated genes, respectively, showing more than 1.5-fold expression difference (p < 0.05). (C) Wesker Box plot of inverse co-related miRNA and their target DEGs (D). DEGs and miRNA target gene filtration method.

TABLE 1. The top four differentially expressed target genes and miRNAs.
The miRDB webserver predicted that, 53 miRNAs (of the 65 differentially expressed miRNAs) modulate the expression of 27,541 target genes at a cut off score of <70. Of these 27,541 target genes, 525 were overlapping with 709 DEGs detected in prostate metastatic tissues. The inverse correlation analysis of miRNA and DEG pair expression statuses have further narrowed down the total number of target genes to 250. Of this list, 125 downregulated genes were targeted by 22 upregulated miRNAs. The remaining 125 upregulated genes were modulated by 31 downregulated miRNAs. The top miRNA-target gene pairs identified in prostate cancer tissues is listed in Table 2; Figures 2C,D.
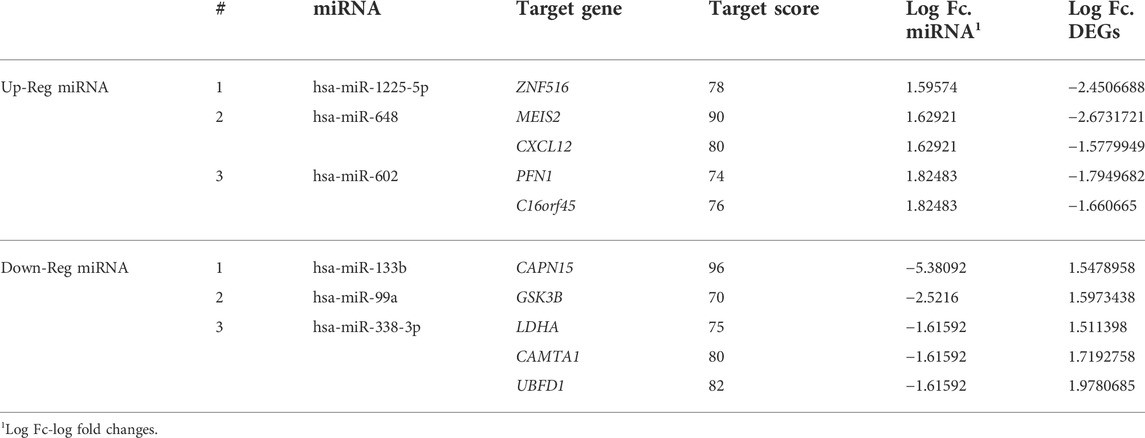
TABLE 2. The top miRNA-target gene pairs of prostate cancer tissues.
The main KEGG pathways enriched for 250 targets genes (125 up and 125 downregulated genes, each) of 53 miRNAs at the p-value threshold of <0.05 are listed in Table 3. The downregulated genes were enriched in prostate cancer, cAMP signalling, signalling pathways regulating pluripotency of stem cells, Th1 and Th2 cell differentiation, and cGMP-PKG signalling pathways. The upregulated genes were enriched in Hedgehog signalling, ErbB signalling, and T-cell receptor signalling pathways.
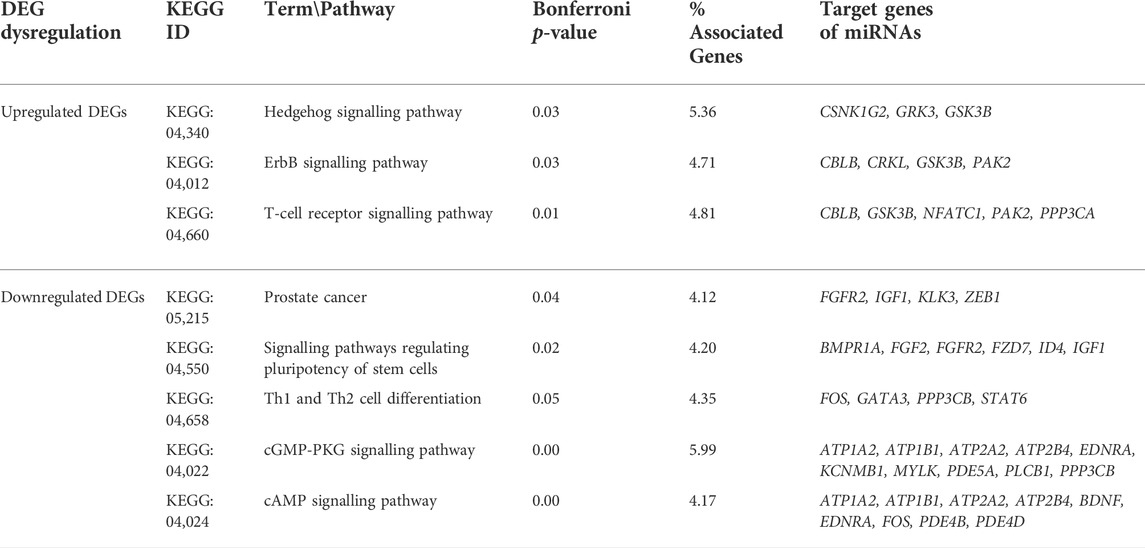
TABLE 3. KEGG pathways enriched for miRNA target genes of prostate cancer tissues.
Molecular networks highlight the physical contacts among protein partners. They are critical in most basic molecular mechanisms involved in cellular function but are often perturbed in disease states. The miRNA-mRNA network of 250 target genes and 53 miRNAs consisted of 9,931 nodes and 34,474 edges (Figure 3A). Considering the network parameters at >150 centrality and betweenness of >254320.9 as filtration criteria, we identified hub genes, of which 32 are target genes and 6 miRNAs (hsa-miR-455-3p, hsa-miR-671-5p, hsa-miR-548c-3p, hsa-miR-125a-3p, hsa-miR-338-3p, and hsa-miR-582-5p) (Figure 3B).

FIGURE 3. The miRNA-Protein interaction network of prostate cancer tissues. (A) The overall network of miRNAs and genes. (B) miRNA (Square)and their target hub genes (circle)with degree of centrality (>150). (C) Regulatory networks of the miRNAs, target genes and transcription factors. Green octagons represent TFs. Purple circles represent target genes regulated by transcription factors and key miRNAs (blue circles).
The functional enrichment of these hub miRNA-target gene pairs has confirmed the strong interaction existing between them. Of the 32 target hub genes, 4 were mapped to cell signalling pathways including ACVR1 and ACVR2B in TGF-beta signalling, CDKN1A and GSK3B in ErbB signalling (adj.P val = 0.016) and CDKN1A and GSK3B genes in Prostate cancer pathways (adj. P val = 0.076). CDKN1A and GSK3B were mapped to Cell cycle pathways as well (adj. P val = 0.02). ACVR1 and ACVR2B are also playing a role in Cytokine-cytokine receptor interaction pathway (adj.P val = 0.062) (Supplementary Table S1). Out of the 6 miRNAs, only 3 (hsa-miR-455-3p, hsa-miR-548c-3p, and hsa-miR-582-5p) were found to target 9/32 (28.1%) genes, while the remaining 3 (hsa-miR-671-5p, hsa-miR-125a-3p, and hsa-miR-338-3p) do not have any targets in the hub genes. So, those three were eliminated from further analysis. The down-regulated hsa-miR-455-3p modulates NFIB gene (upregulated), and hsa-miR-582-5p targets DICER1, GSK3B, DCAF7, FGFR1OP, and ABHD2 genes (upregulated), while upregulated hsa-miR-548c-3p targets NACC2, NR3C1 and FGF2 genes (downregulated).
We performed the functional validation of the 9 hub genes (with inverse regulated miRNAs mentioned above) in the prostate cancers, using different systems biology approaches.
The enrichment findings of TF motifs for nine hub target genes and six miRNAs have predicted that the transcription factors like RARA, CRX, ZNF524, APEX2, and MYBL1 interacts with 6 hub genes, like ABHD2, DICER1, GSK3B, NACC2, NFIB, and NR3C1 (with network enrichment score of >3.5) (Table 4). Although, the miRNAs were not directly connected to TF motifs, but three miRNAs were predicted to regulate the network of TF-target gene network. For example, hsa-mir-548c-3p interacts with NACC2 and NR3C1, hsa-mir-455-3p interacts with NFIB, and hsa-mir-582-5p interacts with ABHD2 and DICER1 (Figure 3C).
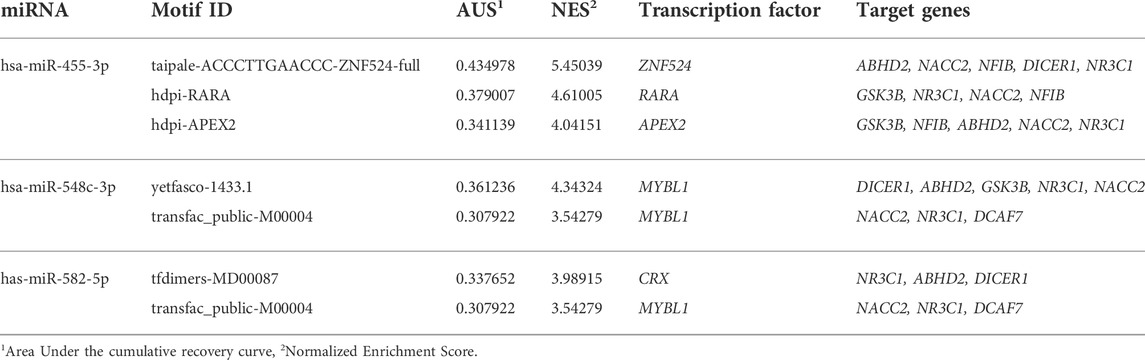
TABLE 4. The network analysis findings of transcriptional factors, and their motifs with miRNA-target genes.
The nine hub genes (9/32; 28%) selected from the topological analysis demonstrated the genotype-phenotype association score of >0.002 in the Open Target Validation Platform analysis. Tractability information for all 9 queried genes was available, with FGF2, GSK3B, and NR3C1 genes were tractable by small molecules, ABHD2, FGF2, and GSK3B genes were tractable by antibody molecules, ABHD2, FGF2, NR3C1, and GSK3B genes were targeted by Proteolysis Targeting Chimeras (PROTACs), while only FGF2 gene was tractable also by enzyme molecules (Table 5). Of note, the FGF2 acts as a molecular target for Muprafostat oligosaccharide agent, which is currently in phase 2 trial in prostate cancer. The GSK3B is targeted by lithium carbonate inhibitor which currently completed phase 1 trial in prostate cancer. The NR3C1 is targeted by several small molecule agonists like Dexamethasone, Prednisolone, and Prednisone which have currently completed phase 4 clinical trials (Supplementary Table S2).
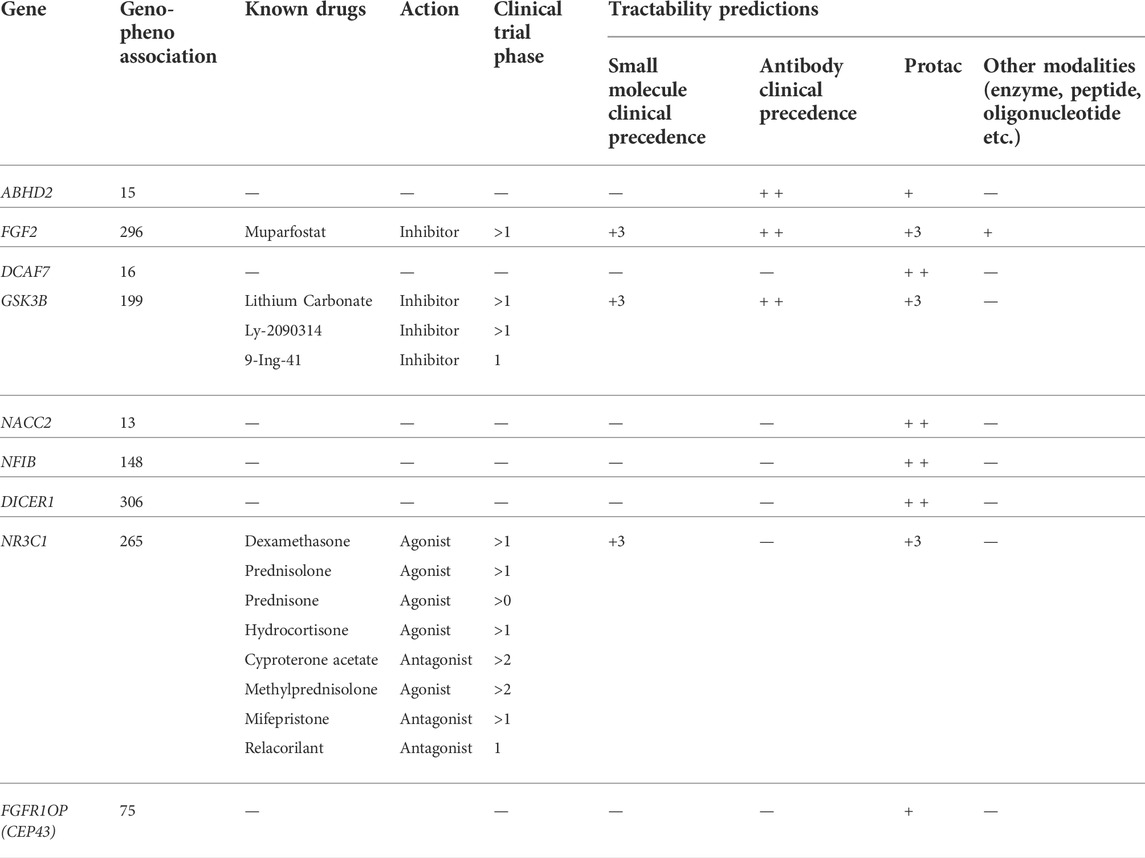
TABLE 5. Open Target Platform output for disease association, known drugs, action and clinical trial, tractability of 9 hub genes.
The cBioPortal for Cancer Genomics analysis has confirmed that all the hub genes carry different types of alterations, including in frameshift, missense, splice, and truncating mutations, structural variants, amplifications, and deep deletions (Figure 4A). Of all the genes, NACC2 gene alterations were reported in 105/4990 (2.1%) prostate cancer samples. The other genes showing molecular alterations in prostate cancer samples from highest to lowest are as follows; FGF2 (94/4990; 1.9%), NFIB (86/4990; 1.7%), CEP43 (62/4990; 1.2%), GSK3B (99/8961; 1.1%), DICER1 (101/8961; 1.1%), NR3C1 (53/4990; 1.1%) and ABHD2 (28/4,990; 0.6%) (Supplementary Table S3). Interestingly, in 5/9 genes (55.5%), i.e., ABHD2, DICER1, GSK3B, NR3C1, and NFIB mutations were localized to functional domains of their corresponding proteins, which suggest them to be highly critical genes for prostate cancers (Figure 4B). The mutations in NFIB gene are also co-occur with NACC2, DCAF7 and FGF2 genes (OR is three; p < 0.001) (Table 6).
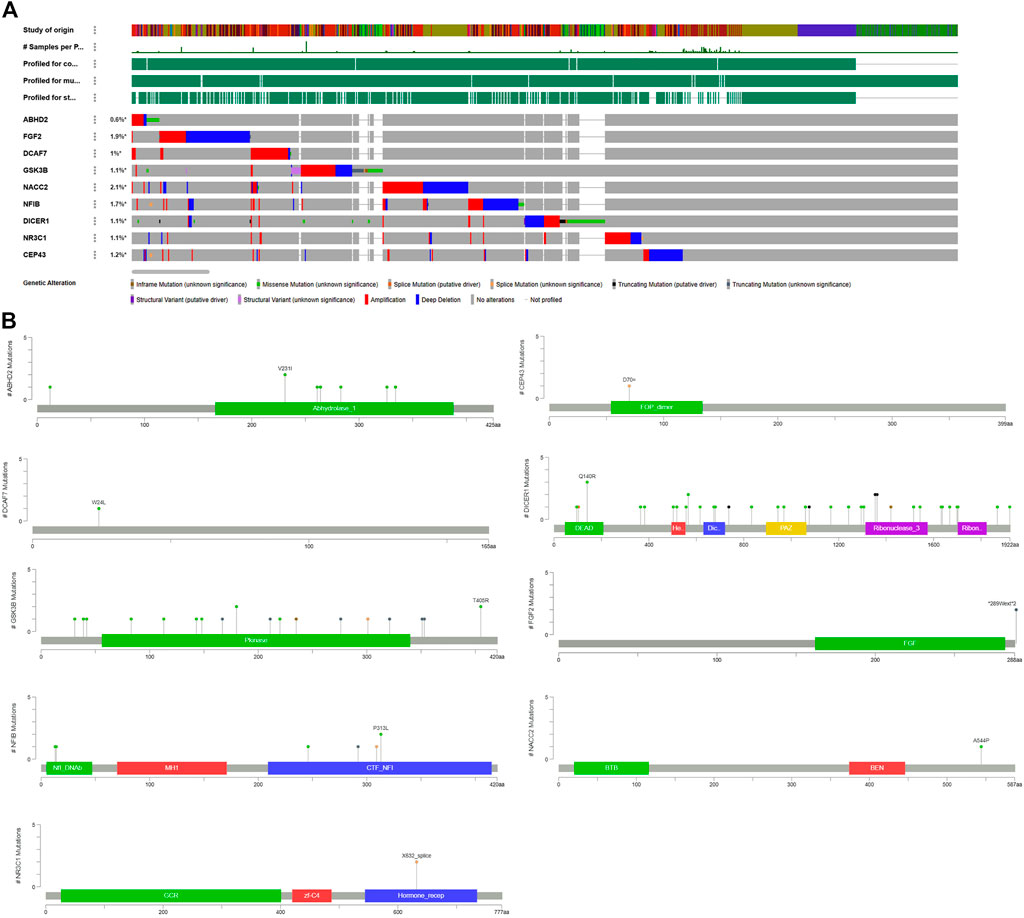
FIGURE 4. Mutation load of hub genes. (A) Distribution and frequency of genetic alternations in PC hub genes. (B) The “lollipop” plot generated by the Mutation Mapper tool of cBioPortal shows the open box of the nine hub genes, as well as the frequency, position, and the domain of mutations in the chromosome.
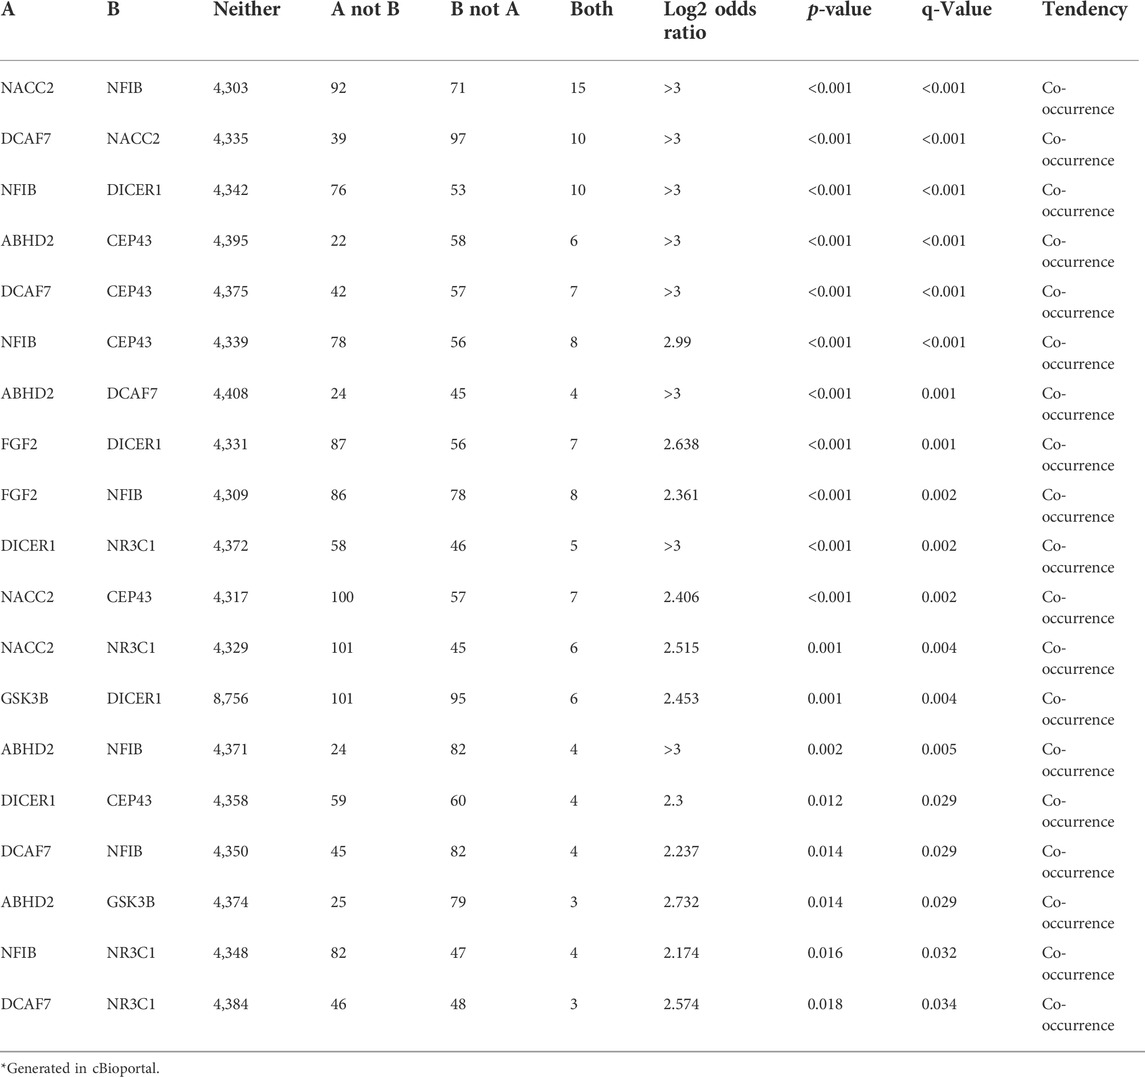
TABLE 6. Co-occurrence analysis of hub genes of prostate cancers*.
The GEPIA results of all the 9 hub genes, have showed that expression levels of ABHD2, DCAF7, and GSK3B were upregulated, FGF2, NACC2, and NR3C1 were downregulated in prostate adenocarcinomas (PRAD) than the normal prostate tissues by more than 1.5 folds (p < 0.01), reinforcing our understanding that these genes have important role in carcinogenesis (Figure 5). On the other hand, DICER1 and FGFR1OP showed contradictory results to GEPIA analysis and the NFIB was non-significant.

FIGURE 5. RNA Expression levels in PC in comparison to normal tissues from GEPIA2. The box plot representation for ABHD2, FGF2, DCAF7, GSK3B, NACC2, and NFIB. The signature score is calculated by mean value of log2 (TPM +1). The |Log2FC| cut-off of the expression of proposed biomarker was 1. The significant cut-off p-value of the expression of proposed biomarker was 0.01. The red box indicates the tumor samples while grey colour indicates the normal tissues. Each dot represents one sample data in the category.
Kaplan-Meier survival curves showed that none of the 9 hub genes had any positive impact on improving overall survival of prostate cancer patients. However, the expression levels NFIB and NR3C1 were indicated to be of predictive for disease-free survival (Figure 6A). The high expression level of NFIB could indicate poor survival rate in more than 50% of prostate cancer patients (p < 0.05). On the other hand, low expression level of NR3C1 could extend the disease-free survival rate in 45% of prostate cancer patients beyond 150 months (p < 0.05). In comparison, there were no obvious associations between the expression levels of ABHD2, FGF2, DCAF7, GSK3B, NACC2, DICER1, and FGFR1OP genes and survival rate in prostate cancer patients.
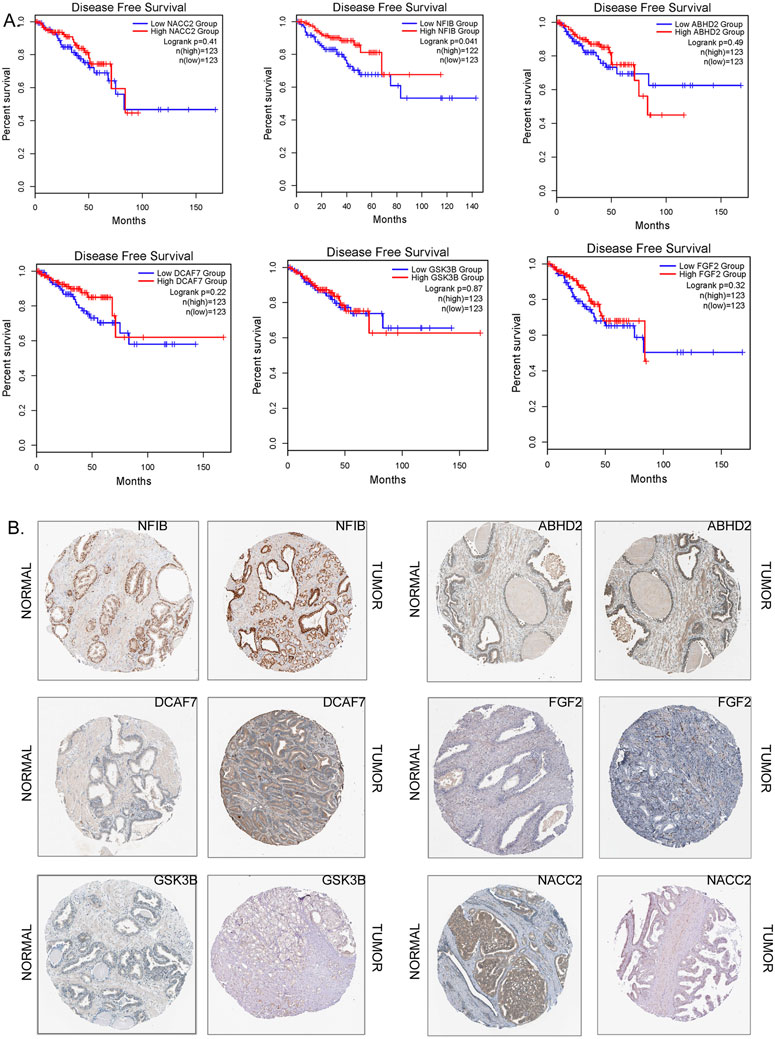
FIGURE 6. (A) The Kaplan-Meier survival curves as prognostic values (disease survival in days) of the hub genes (NACC2 Logrank p = 0.41; NFIB Logrank p = 0.041;ABDH2 Logrank p = 0.49; DCAF7 Logrank p = 0.22; GSK3B Logrank p = 0.87; FGF2 Logrank p = 0.32) of prostate cancer. The correlation of survival status of patients with different prostate cancer subtypes. (B) Immunohistochemistry of hub genes in prostate cancers and in normal prostate tissues (image extracted from https://www.proteinatlas.org/).
The protein expression of 6 hub genes in prostate cancer tissues are presented in Figure 6B. The results showed that ABHD2, DCAF7, and GSK3B were upregulated in cancer tissues compared with normal prostate tissues with high or medium intensity. However, the expression of DICER1, FGF2, NACC2, NFIB, FGFR1OP, and NR3C1 in PC tissues shown low intensity. The HPA indirect immunofluorescence analysis provides the subcellular localization of hub genes in different cell compartments in different human cancer cell lines. Our results showed that majority hub genes DCAF7, FGF2, GSK3B, NACC2, and NFIB were highly expressed and (nTPM >19) localised mainly in the nuclei of the cancer cells. While ABHD2, and DICER1 genes are mainly expressed (>18 nTPM) in the cytosol. Interestingly, the expression of NR3C1 is seen in both nuclear and cytosolic compartments (Supplementary Table S4; Figure 7). Our findings provide spatial information on protein expression patterns of hub genes and define the subcellular localization to cellular organelles and structures at a single cell level. In summary, our results indicated that protein expression levels of 9 hub genes are dysregulated in prostate cancers compared to normal prostate tissues.
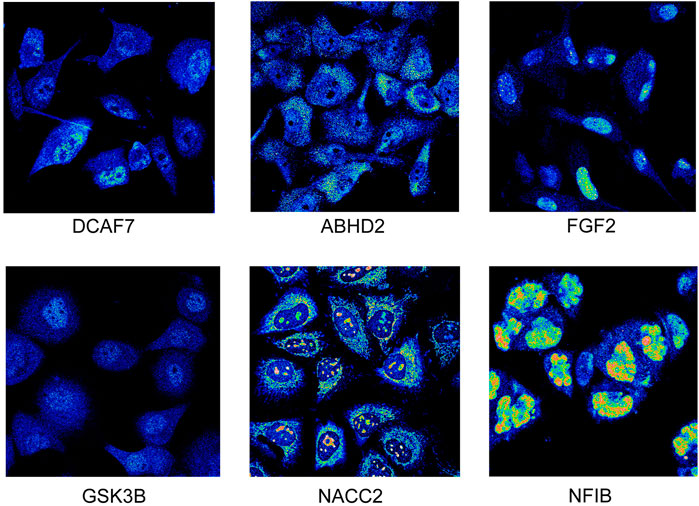
FIGURE 7. Immunofluorescence staining. The expression of prostate cancer hub genes in different cellular locations. (image extracted from https://www.proteinatlas.org/).
Edward Venn diagram in Figure 8 represent a concordance analysis of nine hub genes and five miRNA using different paradigm system biology methods. In the six functional prediction tools, the genes ABDH2, NR3C1, and GSK3B are significantly enriched. Interestingly, TF-miRNA analysis revealed an indirect connection between hsa-miR-582-5 and hsa-miR-548c-3p and TF. These miRNAs have the potential to regulate ABDH2, NR3C1, and GSK3B.
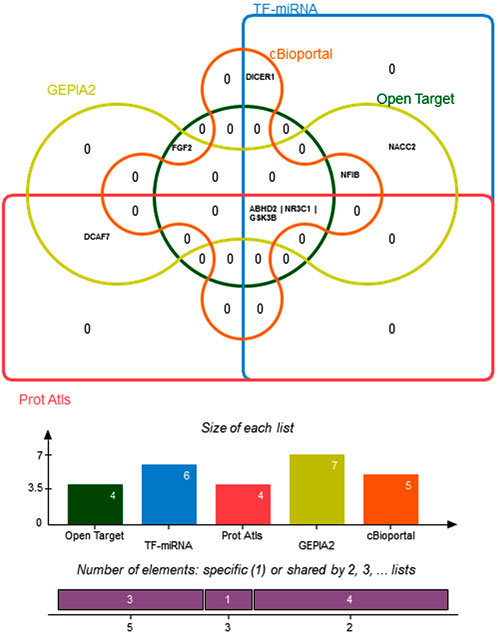
FIGURE 8. Edwards’ Venn diagram demonstrating overlapping of hub genes across six system biology analysis methods. The bar graph represents the number of genes in each prediction tool.
Prostate cancer has a high clinical heterogeneity, ranging from fairly indolent to a fatally aggressive form (Litwin and Tan, 2017). This necessitates the need to search for novel prostate tumour biomarkers that can improve the molecular diagnosis and clinical outcomes. Several investigations have identified unique molecular subtypes of primary prostate tumors as well as important genetic changes that contribute to metastasis (Chen et al., 2021) (Zhao et al., 2021) (De Schaetzen Van Brienen et al., 2021). But these studies differ from each other in sample type, study design, statistical measures, and systems biology methods used. Moreover, the data on the role of miRNAs in regulating gene expression changes in prostate cancer tissues is sparce (Doghish et al., 2021) (Gordanpour et al., 2012) (Watahiki et al., 2011). Therefore, this new study design combined the publicly available expression datasets from different prostate tissues and across different microarray platforms to precisely map the interactions of key genes and miRNA involved in prostate tumorigenesis.
By normalization of expression data and comparison to normal prostate tissues, we detected 250 differentially expressed genes (125 up- and 125 downregulated genes) in the prostate cancer tissues. Pathway enrichment of these key upregulated genes highlight their involvement in Hedgehog signalling and ErbB signalling pathways. The Hedgehog (Hh) signalling network plays an important role in metastatic human prostate tumours that expressed Hh ligands and Hh-target genes at higher levels (Karhadkar et al., 2004). Moreover, chemical inhibitors of Hh signalling have been demonstrated to suppress the growth of PC cell lines (Sanchez et al., 2005). ErbB-2 oncogene contributes to PC progression by regulating numerous signalling pathways, including AKT, ERK1/2 and STATs, by positively influencing cell survival, migration, and proliferation of cancer cells (Miller et al., 2019).
The downregulated genes were enriched in key prostate cancer pathway (KEGG:05,215), which regulates growth factor receptor mediated cytokine-cytokine interactions (Lee and Rhee, 2017). These growth factor receptors indirectly activate the RAS-MAPK signalling that regulates gene expression, cellular growth, and survival of prostate cancer cells (Rodríguez-Berriguete et al., 2012). Increased cell proliferation and resistance to apoptosis may be caused by abnormal MAPK signaling pathway (Dasgupta et al., 2020). cAMP serves as a intermediary messenger molecule in several signaling pathways such as cell growth and differentiation (Kim et al., 2005). In the context of PC, cAMP levels modulate the activity of androgen receptor (AR) signalling, which could negatively impact normal prostate development and function (Yan et al., 2016).
We also identified miRNA alterations targeting genes which are regulating the transition of normal prostate to aggressive cancerous cells. The hub gene is a gene with the highest degree of connectivity (at top 10%) in the key module and identifying the hub genes is shown to improve the molecular dissection of human diseases like obesity (Sabir et al., 2019), autoimmune diseases (Banaganapalli et al., 2020), myocardial infarctions (Mujalli et al., 2020), and cancers (Sahly et al., 2021). So, by constructing the miRNA-mRNA functional network of 250 target genes and 53 miRNAs, we mapped 32 hub target genes and six hub miRNAs showing high degree of network centrality parameter (>150).
The inverse correlation analysis of expression statuses of these target gene-miRNA pairs has narrowed down the total hub genes to 9 (NFIB, DICER1, GSK3B, DCAF7, FGFR1OP, ABHD2, NACC2, NR3C1, and FGF2) and hub miRNAs to 6 (hsa-miR-455-3p, hsa-miR-548c-3p, hsa-miR-582-5p, hsa-miR-671-5p, hsa-miR-125a-3p and hsa-miR-338-3p). Among the hub miRNAs exclusively deregulated in PC, only 3 miRNAs (hsa-miR-455-3p, hsa-miR-548c-3p and hsa-miR-582-5p) were found to target 9 hub genes. The pathway analysis of these hub genes and miRNAs showed their involvement in different pathways connected to cell division or differentiation in response to extracellular signals, and a variety of cellular processes including gene expression, regulation of growth proteins, cell proliferation, oncogenic transformation, cell migration, and membrane trafficking in cancers (Kim et al., 2005). Thus, our findings broadly agree with previous studies, which highlighted differential regulation of key genes and miRNAs involved in the transformation of normal prostate tissue to prostate cancers (Gordanpour et al., 2012) (Chen et al., 2021) (Zhao et al., 2021) (De Schaetzen Van Brienen et al., 2021).
Both miRNAs and TFs regulate the gene expression at post-transcriptional and post-translation levels, respectively. Interestingly, miRNAs and TFs can regulate each other and also co-regulate a common target gene by forming a feed-forward loop (FFL) unit, which further forms gene regulatory networks (Qin et al., 2020). In this study, three miRNAs were predicted to co-regulate the network of TF-target gene network. For example, hsa-mir-548c-3p is shown to coregulate the interaction of NACC2 and NR3C1 with TF-ZNF524; hsa-mir-455-3p co-regulates the interaction of NFIB with TF-ZNF524, and hsa-mir-582-5p coregulate the interaction of ABHD2 and DICER1 with TF-ZNF524 and TF-CRX.
The comprehensive systems biology validation of 9 hub genes has revealed that downregulated miRNA like hsa-miR-582-5p is correlated with the elevated the expression of ABHD2 and GSK3B genes in prostate cancer tissues, and upregulated miRNA like hsa-miR-548c-3p correlates with the lower expression of NR3C1 (glucocorticoid receptor) gene. The hsa-miR-582-5p inhibits metastasis of prostate cancer by repressing multiple components of TGF-β signalling, resulting in the inactivation of TGF-β signalling (Gordanpour et al., 2012) (Huang et al., 2019). Of note, miR-548c-3p acts as regulator in many cancers by significantly affecting both ErbB and Hippo signalling pathways (Feng et al., 2019). Hence, both miRNAs can be potential biomarkers for metastatic prostate cancers. Open target analysis findings have predicted that, Proteolysis Targeting Chimeras (PROTACs) can target all ABHD2, GSK3B, and NR3C1 genes. Additionally, ABHD2 is targeted by antibody molecules, and GSK3B is targeted by lithium carbonate inhibitor which has currently completed phase 1 trial in prostate cancer. NR3C1 agonists like prednisone and dexamethasone are already under usage in lymphoid cancers and can be explored as potential repurposed drug for prostate cancers.
The GSK3B, a central component of PI3K/Akt survival pathway, determines the cancer cell survival through its effects on apoptosis. Expression status of GSK3B is positively correlated with tumor progression in multiple human malignancies (Li et al., 2015). Immunohistochemistry analysis of 499 PC surgical specimens showed higher levels of cytoplasmic (not nuclear) of GSK3B protein, in addition to its correlation with aggressive clinicopathological parameters such as late clinical stage, lymph node metastasis, extracapsular extension, and a high Gleason score, as well as a 2-fold reduction in recurrence-free survival with up to 12-years follow-up (Li et al., 2009). Since it is an androgen-regulated gene that is associated with the development of prostate cancer and its ability to resist chemotherapy, ABHD2 is a promising new target for prostate cancer screening and treatment. Gleason score, pathological node stage, low cancer-specific survival rates, and resistance to docetaxel-based chemotherapy have been linked to ABHD2 levels in prostate cancer specimens by immunohistochemical analysis. (Obinata et al., 2016). The NR3C1encodes a nuclear hormone receptor, acting as a transcription factor and modulate the gene expression across different tissues (Gu et al., 2017). Lower NR3C1 expression levels were found in cancer cells compared to normal tissues of breast (Mamoor, 2021). For lymphoid cancers, acute lymphoblastic leukemia, chronic lymphocytic leukemia and multiple myeloma, NR3C1 activation has been proven to be an effective treatment strategy. There are, however, several lines of evidence suggesting that GR activation has a strong effect on cancer cell behaviours such as invasion, apoptosis resistance and growth (Prekovic et al., 2021). Thus, it is imperative to use therapeutic interventions, whether agonists or antagonists to control the prostate carcinogenesis by regulating the expression of concerned candidate genes.
This study would like to sincerely clarify some limitations. First, we studied the role of miRNA and target expressions in metastatic prostate cancers. Thus, we do not generalise our findings neither blood samples nor primary tumors of prostate cancer patients. Second, we took microarray data of prostate tissue biopsies. Thus, mapping the key miRNAs or genes in body fluids like blood, urine and prostatic fluid is important to develop non-invasive biomarkers for prostate carcinogenesis. Third, the key hub genes and hub miRNAs identified in this study, need to be further validated by targeted approaches like real-time PCR, functional biology assays and on larger number of patient samples.
In conclusion, this study identified the inversely correlated dysregulation of 9 target genes (NFIB, DICER1, GSK3B, DCAF7, FGFR1OP, ABHD2, NACC2, NR3C1, and FGF2) and three key miRNAs (hsa-miR-455-3p, hsa-miR-548c-3p and hsa-miR-582-5p). This study supports the robustness of computational concepts, like protein interactome mapping, functional enrichment of biological pathways and construction of miRNA-mRNA and transcription factor gene networks in identifying prostate cancer biomarkers from large-scale gene expression data. Tissue based prostate cancer markers can be correlated with cancer development, which might offer early clinical interventions and therapy. This study also provides the initial evidence for the future knowledge driven functional studies of these miRNAs and their gene targets in prostate cancer.
The datasets presented in this study can be found in online repositories. The names of the repository/repositories and accession number(s) can be found in the article/Supplementary Material.
Conceptualization, TA, NS, and BB; Methodology, TS, FM, and BB; Software, FM and BB; Formal analysis, TS, KN, FM, WA, NA, and BB; Investigation, TS and KN; Writing—original draft preparation, TS, KN, FM, WA, RE, NA, HA, AM, and BB; Writing—review and editing, KN, TS, NA, BB, MA, and RE; Visualization, FM and BB; Supervision, BB and RE; Project administration, TS; Funding acquisition, TS.
The authors extend their appreciation to the Deputyship for Research and Innovation, Ministry of Education in Saudi Arabia for funding this research work through the project number IFPRC-132-290-2020 and King Abdulaziz University, DSR, Jeddah, Saudi Arabia.
The authors declare that the research was conducted in the absence of any commercial or financial relationships that could be construed as a potential conflict of interest.
All claims expressed in this article are solely those of the authors and do not necessarily represent those of their affiliated organizations, or those of the publisher, the editors and the reviewers. Any product that may be evaluated in this article, or claim that may be made by its manufacturer, is not guaranteed or endorsed by the publisher.
The Supplementary Material for this article can be found online at: https://www.frontiersin.org/articles/10.3389/fgene.2022.1066118/full#supplementary-material
Banaganapalli, B., Mansour, H., Mohammed, A., Alharthi, A. M., Aljuaid, N. M., Nasser, K. K., et al. (2020). Exploring celiac disease candidate pathways by global gene expression profiling and gene network cluster analysis. Sci. Rep. 10, 16290. doi:10.1038/s41598-020-73288-6
Bartel, D. P. (2009). MicroRNAs: Target recognition and regulatory functions. Cell. 136, 215–233. doi:10.1016/j.cell.2009.01.002
Berry, R., Schaid, D. J., Smith, J. R., French, A. J., Schroeder, J. J., Mcdonnell, S. K., et al. (2000a). Linkage analyses at the chromosome 1 loci 1q24-25 (HPC1), 1q42. 2-43 (PCAP), and 1p36 (CAPB) in families with hereditary prostate cancer. Am. J. Hum. Genet. 66, 539–546. doi:10.1086/302771
Berry, R., Schroeder, J. J., French, A. J., Mcdonnell, S. K., Peterson, B. J., Cunningham, J. M., et al. (2000b). Evidence for a prostate cancer–susceptibility locus on chromosome 20. Am. J. Hum. Genet. 67, 82–91. doi:10.1086/302994
Bima, A. I., Elsamanoudy, A. Z., Alamri, A. S., Felimban, R., Felemban, M., Alghamdi, K. S., et al. (2022). Integrative global co-expression analysis identifies key microRNA-target gene networks as key blood biomarkers for obesity. Minerva Med. 113, 532–541. doi:10.23736/S0026-4806.21.07478-4
Bostwick, D. G., Burke, H. B., Djakiew, D., Euling, S., Ho, S.-M., Landolph, J., et al. (2004). Human prostate cancer risk factors. Cancer 101, 2371–2490. doi:10.1002/cncr.20408
Breyer, J. P., Avritt, T. G., Mcreynolds, K. M., Dupont, W. D., and Smith, J. R. (2012). Confirmation of the HOXB13 G84E germline mutation in familial prostate cancer. Cancer Epidemiol. Biomarkers Prev. 21, 1348–1353. doi:10.1158/1055-9965.EPI-12-0495
Carter, B. S., Beaty, T. H., Steinberg, G. D., Childs, B., and Walsh, P. C. (1992). Mendelian inheritance of familial prostate cancer. Proc. Natl. Acad. Sci. U. S. A. 89, 3367–3371. doi:10.1073/pnas.89.8.3367
Chen, Z. J., Guan, H., Wang, S., Xu, B., and Chen, M. (2021). Genes and signaling pathways related to the biochemical recurrence of prostate cancer: An analysis based on the GEO database. Zhonghua Nan Ke Xue 27, 17–25.
Cooney, K. A., Huang, L., Sandler, H. M., Lange, E., Lange, K., Miesfeldt, S., et al. (1997). Prostate cancer susceptibility locus on chromosome 1q: A confirmatory study. J. Natl. Cancer Inst. 89, 955–959. doi:10.1093/jnci/89.13.955
Dasgupta, P., Kulkarni, P., Bhat, N. S., Majid, S., Shiina, M., Shahryari, V., et al. (2020). Activation of the Erk/MAPK signaling pathway is a driver for cadmium induced prostate cancer. Toxicol. Appl. Pharmacol. 401, 115102. doi:10.1016/j.taap.2020.115102
De Schaetzen Van Brienen, L., Miclotte, G., Larmuseau, M., Van Den Eynden, J., and Marchal, K. (2021). Network-based analysis to identify drivers of metastatic prostate cancer using GoNetic. Cancers 13, 5291. doi:10.3390/cancers13215291
Doghish, A. S., Ismail, A., El-Mahdy, H. A., Elkady, M. A., Elrebehy, M. A., and Sallam, A. M. (2021). A review of the biological role of miRNAs in prostate cancer suppression and progression. Int. J. Biol. Macromol. 197, 141–156. doi:10.1016/j.ijbiomac.2021.12.141
Farashi, S., Kryza, T., Clements, J., and Batra, J. (2019). Post-GWAS in prostate cancer: From genetic association to biological contribution. Nat. Rev. Cancer 19, 46–59. doi:10.1038/s41568-018-0087-3
Feng, C., Li, Y., Lin, Y., Cao, X., Li, D., Zhang, H., et al. (2019). CircRNA-associated ceRNA network reveals ErbB and Hippo signaling pathways in hypopharyngeal cancer. Int. J. Mol. Med. 43, 127–142. doi:10.3892/ijmm.2018.3942
Feng, X., Wang, Z., Fillmore, R., and Xi, Y. (2014). MiR-200, a new star miRNA in human cancer. Cancer Lett. 344, 166–173. doi:10.1016/j.canlet.2013.11.004
Gordanpour, A., Nam, R., Sugar, L., and Seth, A. (2012). MicroRNAs in prostate cancer: From biomarkers to molecularly-based therapeutics. Prostate Cancer Prostatic Dis. 15, 314–319. doi:10.1038/pcan.2012.3
Greenlee, R. T., Hill‐Harmon, M. B., Murray, T., and Thun, M. (2001). Cancer statistics, 2001. Ca. Cancer J. Clin. 51, 15–36. doi:10.3322/canjclin.51.1.15
Group, UCSW. (2014). United States cancer statistics: 1999-2011 incidence and mortality web-based report. Atlanta (GA): Department of Health and Human Services, Centers for Disease Control and Prevention and National Cancer Institute. cited 2014 Dec 24".).
Gu, Y., Deng, B., Kong, J., Yan, C., Huang, T., Yang, J., et al. (2017). Functional polymorphisms in NR3C1 are associated with gastric cancer risk in Chinese population. Oncotarget 8, 105312–105319. doi:10.18632/oncotarget.22172
Huang, S., Zou, C., Tang, Y., Wa, Q., Peng, X., Chen, X., et al. (2019). miR-582-3p and miR-582-5p suppress prostate cancer metastasis to bone by repressing TGF-β signaling. Mol. Ther. Nucleic Acids 16, 91–104. doi:10.1016/j.omtn.2019.01.004
Ilic, D., Neuberger, M. M., Djulbegovic, M., and Dahm, P. (2013). Screening for prostate cancer. Cochrane Database Syst. Rev. 2013. doi:10.1002/14651858.cd004720.pub3
Janky, R., Verfaillie, A., Imrichová, H., Van De Sande, B., Standaert, L., Christiaens, V., et al. (2014). iRegulon: from a gene list to a gene regulatory network using large motif and track collections. PLoS Comput. Biol. 10, e1003731. doi:10.1371/journal.pcbi.1003731
Kanehisa, M., and Goto, S. (2000). Kegg: Kyoto encyclopedia of genes and genomes. Nucleic Acids Res. 28, 27–30. doi:10.1093/nar/28.1.27
Karhadkar, S. S., Bova, G. S., Abdallah, N., Dhara, S., Gardner, D., Maitra, A., et al. (2004). Hedgehog signalling in prostate regeneration, neoplasia and metastasis. Nature 431, 707–712. doi:10.1038/nature02962
Kim, J., Jia, L., Stallcup, M. R., and Coetzee, G. A. (2005). The role of protein kinase A pathway and cAMP responsive element-binding protein in androgen receptor-mediated transcription at the prostate-specific antigen locus. J. Mol. Endocrinol. 34, 107–118. doi:10.1677/jme.1.01701
Kuriyama, M., Wang, M. C., Lee, C.-L., Papsidero, L. D., Killian, C. S., Inaji, H., et al. (1981). Use of human prostate-specific antigen in monitoring prostate cancer. Cancer Res. 41, 3874–3876.
Kypta, R. M., and Waxman, J. (2012). Wnt/β-catenin signalling in prostate cancer. Nat. Rev. Urol. 9, 418–428. doi:10.1038/nrurol.2012.116
Lachance, J., Berens, A. J., Hansen, M. E., Teng, A. K., Tishkoff, S. A., and Rebbeck, T. R. (2018). Genetic hitchhiking and population bottlenecks contribute to prostate cancer disparities in men of African descent. Cancer Res. 78, 2432–2443. doi:10.1158/0008-5472.CAN-17-1550
Lee, M., and Rhee, I. (2017). Cytokine signaling in tumor progression. Immune Netw. 17, 214–227. doi:10.4110/in.2017.17.4.214
Li, B., Thrasher, J. B., and Terranova, P. (2015). Glycogen synthase kinase-3: A potential preventive target for prostate cancer management. Urol. Oncol. 33, 456–463. doi:10.1016/j.urolonc.2015.05.006
Li, R., Erdamar, S., Dai, H., Sayeeduddin, M., Frolov, A., Wheeler, T. M., et al. (2009). Cytoplasmic accumulation of glycogen synthase kinase-3beta is associated with aggressive clinicopathological features in human prostate cancer. Anticancer Res. 29, 2077–2081.
Litwin, M. S., and Tan, H. J. (2017). The diagnosis and treatment of prostate cancer: A review. Jama 317, 2532–2542. doi:10.1001/jama.2017.7248
Mamoor, S. (2021). Differential expression of nuclear receptor subfamily 3 group C member 1 in cancers of the breast. Virginia, United States: Center for Open Science.
Meng, F., Henson, R., Wehbe–Janek, H., Ghoshal, K., Jacob, S. T., and Patel, T. (2007). MicroRNA-21 regulates expression of the PTEN tumor suppressor gene in human hepatocellular cancer. Gastroenterology 133, 647–658. doi:10.1053/j.gastro.2007.05.022
Miller, D. R., Ingersoll, M. A., and Lin, M. F. (2019). ErbB-2 signaling in advanced prostate cancer progression and potential therapy. Endocr. Relat. Cancer 26, R195–R209. doi:10.1530/ERC-19-0009
Mujalli, A., Banaganapalli, B., Alrayes, N. M., Shaik, N. A., Elango, R., and Al-Aama, J. Y. (2020). Myocardial infarction biomarker discovery with integrated gene expression, pathways and biological networks analysis. Genomics 112, 5072–5085. doi:10.1016/j.ygeno.2020.09.004
Neuhausen, S. L., Farnham, A. M., Kort, E., Tavtigian, S. V., Skolnick, M. H., and Cannon-Albright, L. A. (1999). Prostate cancer susceptibility locus HPC1 in Utah high-risk pedigrees. Hum. Mol. Genet. 8, 2437–2442. doi:10.1093/hmg/8.13.2437
Obinata, D., Takada, S., Takayama, K., Urano, T., Ito, A., Ashikari, D., et al. (2016). Abhydrolase domain containing 2, an androgen target gene, promotes prostate cancer cell proliferation and migration. Eur. J. Cancer 57, 39–49. doi:10.1016/j.ejca.2016.01.002
Papsidero, L. D., Wang, M. C., Valenzuela, L. A., Murphy, G. P., and Chu, T. M. (1980). A prostate antigen in sera of prostatic cancer patients. Cancer Res. 40, 2428–2432.
Prekovic, S., Schuurman, K., Mayayo-Peralta, I., Manjón, A. G., Buijs, M., Yavuz, S., et al. (2021). Glucocorticoid receptor triggers a reversible drug-tolerant dormancy state with acquired therapeutic vulnerabilities in lung cancer. Nat. Commun. 12, 4360. doi:10.1038/s41467-021-24537-3
Qin, G., Mallik, S., Mitra, R., Li, A., Jia, P., Eischen, C. M., et al. (2020). MicroRNA and transcription factor co-regulatory networks and subtype classification of seminoma and non-seminoma in testicular germ cell tumors. Sci. Rep. 10, 852. doi:10.1038/s41598-020-57834-w
Ragde, H., Aldape, H. C., and Bagley, C. M. (1988). Ultrasound-guided prostate biopsy Biopty gun superior to aspiration. Urology 32, 503–506. doi:10.1016/s0090-4295(98)90029-2
Ratner, S. (2021).Prostate cancer treatment (PDQ®): Treatment-health professional information [NCI].
Rodríguez-Berriguete, G., Fraile, B., Martínez-Onsurbe, P., Olmedilla, G., Paniagua, R., and Royuela, M. (2012). MAP kinases and prostate cancer. J. Signal Transduct. 2012, 169170. doi:10.1155/2012/169170
Sabir, J. S. M., El Omri, A., Shaik, N. A., Banaganapalli, B., Al-Shaeri, M. A., Alkenani, N. A., et al. (2019). Identification of key regulatory genes connected to NF-κB family of proteins in visceral adipose tissues using gene expression and weighted protein interaction network. PLoS One 14, e0214337. doi:10.1371/journal.pone.0214337
Sahly, N. N., Banaganapalli, B., Sahly, A. N., Aligiraigri, A. H., Nasser, K. K., Shinawi, T., et al. (2021). Molecular differential analysis of uterine leiomyomas and leiomyosarcomas through weighted gene network and pathway tracing approaches. Syst. Biol. Reprod. Med. 67, 209–220. doi:10.1080/19396368.2021.1876179
Sanchez, P., Clement, V., and Ruiz I Altaba, A. (2005). Therapeutic targeting of the Hedgehog-GLI pathway in prostate cancer. Cancer Res. 65, 2990–2992. doi:10.1158/0008-5472.CAN-05-0439
Schleutker, J., Matikainen, M., Smith, J., Koivisto, P., Baffoe-Bonnie, A., Kainu, T., et al. (2000). A genetic epidemiological study of hereditary prostate cancer (HPC) in Finland: Frequent HPCX linkage in families with late-onset disease. Clin. Cancer Res. 6, 4810–4815.
Screening, P. D. Q., and Board, P. E. (2002). Prostate cancer screening (PDQ®): Health Professional Version. In: PDQ Cancer Information Summaries [Internet]. Bethesda (MD): National Cancer Institute (US); 2002. Available at: https://www.ncbi.nlm.nih.gov/books/NBK65945.
Siegel, R. L., Miller, K. D., and Jemal, A. (2020). Cancer statistics, 2020. Ca. Cancer J. Clin. 70, 7–30. doi:10.3322/caac.21590
Sun, T., Wang, Q., Balk, S., Brown, M., Lee, G.-S. M., and Kantoff, P. (2009). The role of microRNA-221 and microRNA-222 in androgen-independent prostate cancer cell lines. Cancer Res. 69, 3356–3363. doi:10.1158/0008-5472.CAN-08-4112
Thul, P. J., and Lindskog, C. (2018). The human protein atlas: A spatial map of the human proteome. Protein Sci. 27, 233–244. doi:10.1002/pro.3307
Van Gool, K., and Pearson, M. (2014). Health, austerity and economic crisis: Assessing the short-term impact in OECD countries. Paris, France: OECD.
Verras, M., and Sun, Z. (2006). Roles and regulation of Wnt signaling and β-catenin in prostate cancer. Cancer Lett. 237, 22–32. doi:10.1016/j.canlet.2005.06.004
Wang, M., Valenzuela, L., Murphy, G., and Chu, T. (1979). Purification of a human prostate specific antigen. Invest. Urol. 17, 159–163.
Watahiki, A., Wang, Y., Morris, J., Dennis, K., O'dwyer, H. M., Gleave, M., et al. (2011). MicroRNAs associated with metastatic prostate cancer. PloS one 6, e24950. doi:10.1371/journal.pone.0024950
Xu, J., Lange, E. M., Lu, L., Zheng, S. L., Wang, Z., Thibodeau, S. N., et al. (2013). HOXB13 is a susceptibility gene for prostate cancer: Results from the international consortium for prostate cancer genetics (ICPCG). Hum. Genet. 132, 5–14. doi:10.1007/s00439-012-1229-4
Xu, J., Zheng, S. L., Chang, B.-L., Smith, J. R., Carpten, J. D., Stine, O. C., et al. (2001). Linkage of prostate cancer susceptibility loci to chromosome 1. Hum. Genet. 108, 335–345. doi:10.1007/s004390100488
Yan, K., Gao, L. N., Cui, Y. L., Zhang, Y., and Zhou, X. (2016). The cyclic AMP signaling pathway: Exploring targets for successful drug discovery (Review). Mol. Med. Rep. 13, 3715–3723. doi:10.3892/mmr.2016.5005
Keywords: prostate cancer, microRNA, gene expression, PPI, cancer drug targets
Citation: Shinawi T, Nasser KK, Moradi FA, Mujalli A, Albaqami WF, Almukadi HS, Elango R, Shaik NA and Banaganapalli B (2022) A comparative mRNA- and miRNA transcriptomics reveals novel molecular signatures associated with metastatic prostate cancers. Front. Genet. 13:1066118. doi: 10.3389/fgene.2022.1066118
Received: 10 October 2022; Accepted: 01 November 2022;
Published: 16 November 2022.
Edited by:
Hafeez Ur Rehman, National University of Computer and Emerging Sciences, PakistanReviewed by:
Kaleemuddin Mohammed, CanadaCopyright © 2022 Shinawi, Nasser, Moradi, Mujalli, Albaqami, Almukadi, Elango, Shaik and Banaganapalli. This is an open-access article distributed under the terms of the Creative Commons Attribution License (CC BY). The use, distribution or reproduction in other forums is permitted, provided the original author(s) and the copyright owner(s) are credited and that the original publication in this journal is cited, in accordance with accepted academic practice. No use, distribution or reproduction is permitted which does not comply with these terms.
*Correspondence: Babajan Banaganapalli, YmJhYmFqYW5Aa2F1LmVkdS5zYQ==; Noor Ahmad Shaik, bnNoYWlrQGthdS5lZHUuc2E=
†These authors have contributed equally to this work
Disclaimer: All claims expressed in this article are solely those of the authors and do not necessarily represent those of their affiliated organizations, or those of the publisher, the editors and the reviewers. Any product that may be evaluated in this article or claim that may be made by its manufacturer is not guaranteed or endorsed by the publisher.
Research integrity at Frontiers
Learn more about the work of our research integrity team to safeguard the quality of each article we publish.