 Xing Liu
 Donghang Zhao
 Chenggang Ou
- Institute of Vegetables and Flowers, Chinese Academy of Agricultural Sciences, Key Laboratory of Biology and Genetic Improvement of Horticultural Crops, Ministry of Agriculture, Beijing, China
Members of the family of Phosphatidy Ethanolamine-Binding Protein (PEBP) have been shown to be key regulators of the transition of plants from vegetative to reproductive phases. Here, a total of 12 PEBP proteins were identified in the carrot (Daucus carota L.) genome and classified into FT-like (4), TFL1-like (6), and MFT-like 2) subfamilies, that had different lengths (110–267 aa) and were distributed unevenly across seven chromosomes. Moreover, 13 and 31 PEBP proteins were identified in other two Apiaceae species, celery (Apium graveolens L.) and coriander (Coriandrum sativum L.). The phylogenetic and evolutionary results of these PEBP family proteins were obtained based on the protein sequences. In the three Apiaceae species, purifying selection was the main evolutionary force, and WGD, segmental duplication, and dispersed duplication have played key roles in the PEBP family expansion. The expression analysis showed that carrot PEBP genes exhibited relatively broad expression patterns across various tissues. In the period of bolting to flowering, the carrot FT-like subfamily genes were upregulated as positive regulators, and TFL1-like subfamily genes remained at lower expression levels as inhibitors. More interestingly, the members of carrot FT-like genes had different temporal-spatial expression characteristics, suggesting that they have different regulatory functions in the carrot reproductive phase. In summary, this study contributes to our understanding of the PEBP family proteins and provides a foundation for exploring the mechanism of carrot bolting and flowering for the breeding of cultivars with bolting resistance.
Introduction
The Phosphatidy Ethanolamine-Binding Protein (PEBP) family is an ancient and evolutionarily conserved group that occurs in all three major phylogenetic taxa of prokaryotes, archaea, and eukaryotes, indicating common origin (Hengst et al., 2001; Karlgren et al., 2011). In animals, PEBP genes control cell growth and differentiation as kinase and serine protease inhibitors (Lorenz et al., 2003). In plants, PEBP genes are involved in many biological processes, particularly in floral transition and plant architecture (Karlgren et al., 2011). Plant PEBP genes were originally cloned from mutants with altered inflorescence architecture such as CENTRORADIALIS (CEN) in Antirrhinum (Bradley et al., 1996) and TERMINAL FLOWER1 (TFL1) in Arabidopsis thaliana (Bradley et al., 1997). To data, many PEBP family members have been identified in different plant species, including Arabidopsis (Kobayashi et al., 1999; Mimida et al., 2001), tomato (Carmel-Goren et al., 2003), barley (Faure et al., 2007), grapevine (Carmona et al., 2007), maize (Danilevskaya et al., 2008), apple (Kotoda et al., 2010), Populus (Mohamed et al., 2010), cotton (Wang et al., 2019), Moso bamboo (Yang et al., 2019) and Dendrobium huoshanense (Song C. et al., 2021).
There are three major subfamilies in the PEBP family, comprising the FLOWERING LOCUS T (FT)-like proteins, the TFL1-like proteins, and the MOTHER OF FT AND TFL1 (MFT)-like proteins (Danilevskaya et al., 2008; Wang et al., 2019). In Arabidopsis, two FT-like genes, FT (AT1G65480) and TSF (AT4G20370), three TFL1-Like genes, TFL1 (AT5G03840), BFT (AT5G62040), and ATC (AT2G27550), and one MFT-like gene, MFT (AT1G18100), have been identified. FT encodes a floral activator and promotes flowering together with TSF, whereas TFL1, BFT, and ATC are antagonists to FT/TSF (Huang et al., 2012; Ryu et al., 2014; Lee C. et al., 2019; Chen et al., 2021). Additionally, constitutive expression of MFT led to slightly early flowering under long days, and MFT plays a significant role in seed germination and development. Loss of function mutants showed decreased rates of germination in the presence of ABA (Yoo et al., 2004; Barros-Galvão et al., 2019).
In higher plants, the induction of flowering is a critical developmental decision in the life cycle, representing the transition from vegetative to reproductive growth phases. After extensive research, the plant flowering signal is now relatively well understood, specifically, in Arabidopsis, many key genes (e.g., CO, FLC, FT, SOC1, TFL, and LFY) and pathways (e.g., autonomous, photoperiod, and vernalization) have been identified and verified (Bäurle and Dean 2006; Corbesier et al., 2007; Song et al., 2015; Zhang et al., 2020). FT, the central flowering regulator, is induced by the circadian clock coordinated gene CO and initiates flowering by activating floral promoters such as SOC1 and floral meristem-identity genes such as AP1 in meristem when the threshold is passed (Abe et al., 2005; Corbesier et al., 2007; Michaels, 2009; Taoka et al., 2011; Ho and Weigel, 2014). FLC is a MADS-box transcription factor that represses FT and SOC1 in a quantitative manner and plays a central role in the response to vernalization (Lee and Lee, 2010; Sharma et al., 2020). Recently, Zhu et al. (2020) demonstrated that FT activation of LFY expression is critical for floral fate, and LFY as a target under dual opposite transcriptional regulation by TFL1 and FT.
Apiaceae crops are widely cultivated for their unique flavor and medicinal and nutritional value. Carrot (Daucus carota L.), celery (Apium graveolens L.), and coriander (Coriandrum sativum L.) are three representative species that bring significant economic benefits to growers (Ahmad et al., 2019; Maljaei et al., 2019). Carrot is among the top 10 vegetables in terms of global production and is the most significant source of β-carotene in the human diet, and widely distributed in temperate and subtropical regions (Stelmach et al., 2021). However, premature bolting followed by early flowering is the main limiting factor affecting carrot growth and quality, as the xylem quickly lignifies after vernalization, causing a complete loss of commercial value (Wohlfeiler et al., 2019). Mutation of bolting-positive regulators by CRISPR/Cas9 is an important way to obtain bolting-resistant materials. Therefore, an in-depth study of the genes and signal network associated with bolting-resistance in carrot has great significance in application.
To data, only a limited number of PEBP genes have been identified in carrot and other Apiaceae crops (Zhan et al., 2017; Liu et al., 2020). Recently, the genomes of carrot (Iorizzo et al., 2016), coriander (Song X. et al., 2020; Song X. M. et al., 2020) and celery (Li M. Y. et al., 2020; Song X. M. et al., 2021) were sequenced and assembled in succession, and these have provided powerful resources for investigating the PEBP family genes in the Apiaceae species. In this study, we first identified all potential PEBP family genes from the D. carota genome, along with C. sativum and A. graveolens genomes. Their phylogenetic relationships, chromosome locations, structures and motifs, gene duplication events, and collinearity were analyzed. In view of the key roles of PEBP genes in flower development, the expression characteristics of carrot PEBP genes during bolting and flowering were further analyzed. The results of this study will aid investigation of the detailed molecular and biological functions of PEBP members and provides a foundation for breeding carrot cultivars with bolting tolerance.
Materials and methods
Identification of PEBP family genes in carrot, celery and coriander
The genomic sequence and annotation files of carrot were downloaded from NCBI (https://www.ncbi.nlm.nih.gov/, ASM162521v1). Based on the annotation, the putative full-length protein sequences of all carrot genes were extracted by using TBtools (Chen et al., 2020). Two methods were used to identify PEBP family genes in the carrot genome. First, the Hidden Markov Model (HMM) profiles of the PEBP consensus conserved seed file (PF01161) were downloaded from the Pfam database (http://pfam.xfam.org/) and used as a query to screen the first part of candidate PEBP proteins by HMMER 3.2.1 (e-value < 0.01; Finn et al., 2011). Second, the sequences of six Arabidopsis PEBP proteins were downloaded as BLAST queries to identify the second part of PEBP candidate proteins by the BLASTP program. Then, all PEBP candidate proteins from the two part were merged, and further verified by NCBI-CDD (https://www.ncbi.nlm.nih.gov/Structure/cdd/wrpsb.cgi) and SMART (http://smart.embl-heidelberg.de/) and then used for subsequent analysis (Schultz et al., 1998; Marchler-Bauer et al., 2017). The publicly available genomes of celery and coriander were retrieved from Biology to Databases (BIO2DB, http://celerydb.bio2db.com/), and the same method was used to screen out PEBP family genes in those species. The ProtParam program (https://web.expasy.org/protparam/) was used to calculate the physical and chemical parameters of PEBP proteins, including theoretical isoelectric point (pI) and molecular weight (Mw). In addition, the subcellular locations of PEBP proteins were predicted using the online ProtComp 9.0 in Softberry (http://linux1.softberry.com/berry.phtml) (Li H. et al., 2020).
Phylogenetic analyses
Based on multiple sequence alignment of carrot, celery, and coriander PEBP amino acid sequences in Clustal X, the phylogenetic relationships of PEBP proteins were generated by using Molecular Evolutionary Genetics Analysis software package, version 7 (MEGA 7) with the neighbour-joining (NJ) algorithm (Kumar et al., 2016). Bootstrap values from with 1,000 replications were used to assess group support, and the substitution model was the Poisson model. Evolview (http://evolgenius.info/) was used to add colorful visualization plots and to display the phylogenetic tree.
Chromosomal locations, gene structure and conserved motif analysis
Based on the genome sequences and general feature format (gff) files, the chromosomal locations of each PEBP family gene were retrieved and drawn on gene maps using TBtools separately for the three species. Two or more members of the PEBP genes arranged closely in the same chromosomal region were identified as one gene cluster. The structures of PEBP family genes were obtained online using the Gene Structure Display Server 2.0 (GSDS, http://gsds.cbi.pku.edu.cn/) (Hu et al., 2015). The intron-exon structures and untranslated regions (UTRs) of PEBP family genes were also illustrated by GSDS. The conserved motif in full-length PEBP proteins were identified by searching the protein sequence using Multiple Expression motifs for Motif Elicitation (MEME, http://meme-suite.org/), with the following parameters: the maximum number of motifs was 10; the minimum and maximum motif lengths were 4 and 50 amino acids, respectively (Bailey et al., 2009). TBtools was used to visualize the results of gene structure and conserved motif analysis.
Cis-acting element analysis
The upstream 2,000 bp sequences of DcPEBP genes from the transcription start site were extracted from the carrot genome sequences by TBtools. The cis-acting elements were screened and predicted using the PlantCARE database (http://bioinformatics.psb.ugent.be/webtools/plantcare/html/) (Lescot et al., 2002), and TBtools was used to visualize these promoter elements.
Collinearity, duplication type and evolutionary analysis
MCScanX software (http://chibba.pgml.uga.edu/mcscan2/) was used to obtain the collinearity files between each pair of species (Wang et al., 2012). The duplicate_gene_classifier sub-program was used to identify the duplication type, including singleton, dispersed, proximal, segmental, and whole-genome duplication (WGD). Orthologous and paralogous genes were identified using Orthovenn2 (https://orthovenn2.bioinfotoolkits.net/) (Xu et al., 2019). The non-synonymous (Ka) and synonymous (Ks) values of the orthologous gene pairs were calculated using the calculate_Ka_Ks_pipeline (Qiao et al., 2019) and were used to calculate the Ka/Ks ratio of all homologous gene pairs. The Ka/Ks ratio can generally indicate the nature of selective pressures; if the Ka/Ks ratio is equal to one, this indicates neutral evolution; if the ratio is greater than one, this indicates positive selection, and if the ratio is less than one, this indicates negative/purifying selection (Yang, 2007). For further verification, EasyCodeML (https://github.com/BioEasy/EasyCodeML), a graphical interface for the PAML package, was used to identify positively selected sites in the multiple sequence alignment of orthologous genes (Wang et al., 2009; Ratnaparkhe et al., 2011; Gao et al., 2019). In addition, the approximate divergence time (T) was calculated using the formula T = Ks/2r, where “r” represents the neutral substitution rate (5.2 × 10⁻⁹ substitutions per synonymous site per year) (Song X. M. et al., 2020).
Plant materials and gene expression analysis
The annual wild carrot species D. carota ssp. carota ‘Songzi’ (Ws) supplied by the National Mid-term Genebank of Vegetable Genetic Resources, Chinese Academy of Agricultural Sciences was used for gene expression analysis (Ou et al., 2017). In a greenhouse, Ws was cultivated to complete the whole growth cycle from sowing to harvesting the next generation of seeds. Growth conditions were 28°C with 16 h of light/8 h of dark under artificial light.
For the expression analysis of PEBP family genes in different tissues, the root (Ro), hypocotyls (Hy), cotyledon (Co.), vegetative leaf (VL), flower stem (FS), reproductive leaf (RL), bract (Br), inflorescence (In), and mature cremocarp (MC) of Ws were sampled during the different growing stages. To detect the expression pattern of PEBP family genes during carrot bolting and flowering, the leaf samples of Ws were taken from bolting to flowering at eight time points: 10 days before bolting (10 DBB), 5 days before bolting (5 DBB), bolting (Bo), 5 days after bolting (5 DAB), 10 days after bolting (10 DAB), 15 days after bolting (15 DAB), flowering (Fl, 20 days after bolting), 5 days after flowering (5 DAF). All samples had three biological repetitions and were frozen in liquid nitrogen and stored at −80°C for RNA extraction.
A FastPure® universal Plant Total RNA Isolation Kit (Vazyme Biotech Co., Nanjing, Jiangsu Province, China) was used to extract the total RNA according to the manufacturer’s protocol. An ND-1000 spectrophotometer (Thermo Fisher Scientific Inc. Wilmington, DE, United States) was used to determine RNA concentration, purity, and integrity, followed by 1% agarose gel electrophoresis. HiScript III All-in-one RT SuperMix (Vazyme Biotech) was used for the generation of first-strand cDNAs, according to the manufacturer’s protocol and diluted to 50 ng/μL for downstream processing. A 20 μL reaction volume contained 10.0 μL of 2 × ChamQ universal SYBR qPCR Master Mix (Vazyme Biotech), 1.0 μL of cDNA, 0.4 μL of each primer (10 μM), and 8.2 μL ddH2O. qPCR was carried out in a Bio-Rad CFX96 Real-Time PCR System (Bio-Rad Laboratories, Hercules, CA, United States) with three technical replicates. The reaction protocol was as follows: 95°C for 2 min with one cycle, followed by 45 cycles of 95°C for 10 s, 60°C for 30 s, and 72°C for 20 s. Gene-specific primers were designed using Premier 6 according to the carrot PEBP gene sequences. The primer sequences were listed in Supplementary Table S1. The relative gene expression level was analyzed according to the delta-delta Ct (2−ΔΔCT) algorithm. The carrot Tubulin gene (GenBank ID: XM_017383275) was used as an internal control.
Subcellular localization and protein modeling analysis
Transient expression in tobacco plants (Nicotiana benthamiana) was used to determine the subcellular location of carrot PEBP proteins tagged with green fluorescent protein (GFP). The CDSs sequences of carrot PEBP genes fusing to homologous arms were amplified and connected to a pCAMBIA1300-GFP vector by homologous recombination. The recombinant plasmids were transferred into Agrobacterium tumefaciens strain GV3101 by chemical transformation. The transformed Agrobacterium tumefaciens was inoculated in L-broth supplemented with 50 μg/ml kanamycin, and cultured overnight at 28°C. After precipitation, the Agrobacterium pellet was resuspended in infiltration solution (containing 10 mM MgCl2, 10 mM MES, and 100 µM acetosyringone) to a desired optical density (OD600 = 0.5). After standing for 2–3 h, the infiltration solution was infiltrated into the abaxial air spaces of Nicotiana benthamiana plants (at the age of 4 weeks) with a 1 ml syringe (Voinnet et al., 2000). Two to 4 days after infiltration, the GFP fluorescence was observed by using a Leica SP8 laser confocal microscope (Leica Microsystems Inc. Buffalo Grove, Illinois, United States) at 488 nm spectral emission (matching the GFP), and the empty vector was used as a control. The three-dimensional (3D) structures of DcPEBP genes were analyzed using SWISS-MODEL (https://swissmodel.expasy.org/interactive), and PyMOL v2.5 (https://pymol.org/2/) was used to construct visualization plots (Waterhouse et al., 2018).
Results
Identification of PEBP family genes
Based on HMMER and BLASTP searches, a total of 12 candidate PEBP genes were identified in the whole genome of carrot. The 12 candidate genes were further verified by NCBI-CDD, and the results confirmed that all were PEBP family genes with the specific PBP-containing domain (Table 1, Supplementary Table S2). The sequence lengths of the carrot PEBP proteins were ranged from 110 to 267 amino acid (aa) residues, with an average length of 173 aa. DcTFL1-4 (GenBank accession number: XM_017378851) had the longest ORF length (804 bp), and the molecular weight and theoretical pI of the deduced protein were 30330.33 Da and 9.25, respectively. DcFT3 (GenBank accession number: XM_017369907) had the shortest ORF length (333 bp), and the molecular weight and theoretical pI were 12481.03 Da and 9.42, respectively. Meanwhile, the subcellular locations of the carrot PEBP proteins were predicted by ProtComp 9.0. All were predicted in the cytoplasm and nucleus. By the same approach, 13 and 31 PEBP family genes were also detected in celery and coriander, respectively; these are listed in the Supplementary Table S3. The deduced amino acid sequences of all the 56 PEBP proteins are summarized in Supplementary Table S4.
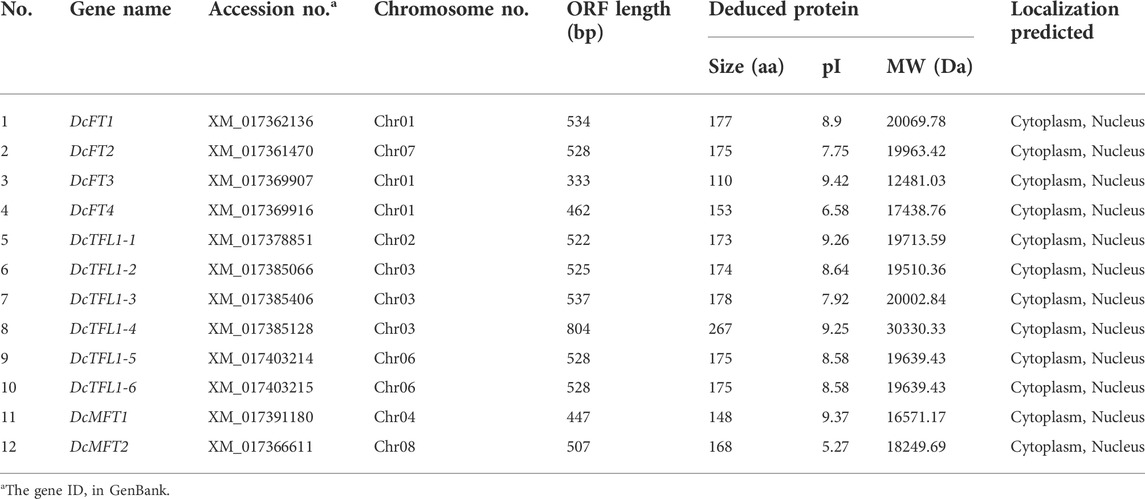
TABLE 1. List of the 12 PEBP family genes in carrot.
Phylogenetic analyses and classification of PEBP family proteins
To classify the PEBP gene family and clarify their evolutionary relationships, MEGA 7 was used to perform a phylogenetic analysis with 62 PEBP amino acid sequences from four species, A. thaliana, D. carota, A. graveolens and C. sativum. According to the analysis result, 62 PEBP proteins were clustered into three major groups (Figure 1). This result was consistent with the classification of the PEBP family genes in previous studies (Danilevskaya et al., 2008; Wang et al., 2019). In this phylogenetic tree, 30 proteins (four in carrot, three in celery, and 23 in coriander) with 2 A. thaliana FT-like proteins (AtFT and AtTSF) were clustered in the same clade, forming the largest FT-like subgroup. In particular, there were more FT-like members in coriander. In addition to CsFT22, other CsFT proteins had rather distant phylogenetic relationships with the DcFT and AgFT proteins. It was speculated that the CsFT proteins may have undergone more duplication events during their evolution. In addition, 19 proteins (six in carrot, eight in celery, and five in coriander) with 3 A. thaliana TFL1-like proteins (AtTFL1, AtBFT, and AtATC) were clustered in one subgroup named TFL1-like. The MFT-like subgroup with eight proteins was the smallest clade, comprising two carrot, two celery, and three coriander MFT proteins, and one AtMFT protein. The similar numbers and close relationship of TFL1-like and MFT-like subfamily proteins in the three Apiaceae species indicated that they have undergone similar evolutionary processes.
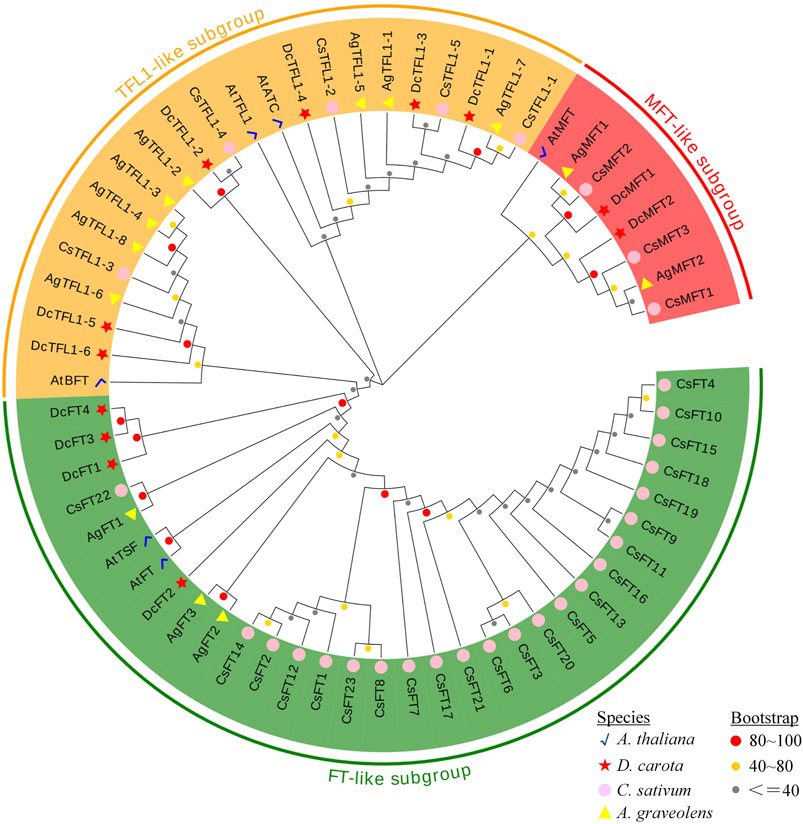
FIGURE 1. Phylogenetic tree of PEBP proteins from D. carota, A. graveolens, C. sativum and A. thaliana. The proteins from each species are labeled with different graphics and colors (red star: D. carota, yellow triangle: A. graveolens, pink circle: C. sativum, blue check: A. thaliana). The three subgroups with different colors represent three clades. The circles with different colors at the nodes represent bootstrap percentage values (gray: 0–40, yellow: 41–80, red: 81–100) from 1,000 replications.
Chromosomal locations of PEBP family genes
In carrot, 12 PEBP family genes were located on seven chromosomes (Chr01, 02, 03, 04, 06, 07, 8), and their distribution on each chromosome was uneven (Figure 2). Chromosomes 01 and 03 contained the highest numbers of PEBP genes (three genes), whereas no gene was detected on chromosome 05 or 09. Three carrot FT-like genes (DcFT1, DcFT3, and DcFT4) and two TFL1-like genes (DcTFL1-5 and DcTFL1-6) formed gene clusters on chromosomes 01 and 03, respectively. In celery, 13 PEBP family genes were unevenly distributed on eight chromosomes (Chr01, 02, 03, 04, 05, 08, 10, and 11), and chromosome 10 harbored the highest gene number (four genes), but the genes were absent on chromosomes 06, 07, and 09 (Supplementary Figure S1A). Of the 33 coriander PEBP genes, 28 were unevenly distributed on 10 chromosomes (Chr01–10). No gene was detected on chromosome 11, and five genes were not anchored to any chromosome (Supplementary Figure S1B). However, the chromosomal distribution of the PEBP genes varied among carrot, celery, and coriander, indicative of gain and loss events during WGDs. In previous studies, DcFT2 on chromosome 7 and DcFT1 on chromosome 1 had been named (Zhan et al., 2017; Liu et al., 2020). In this study, according to their order on the chromosomes and the subgroup classification result (Figure 1), the other 54 PEBP family genes were named one by one in carrot (DcFT3–DcMFT2), celery (AgFT1–AgMFT2) and coriander (CsFT1–CsMFT3) (Table 1, Supplementary Table S3).
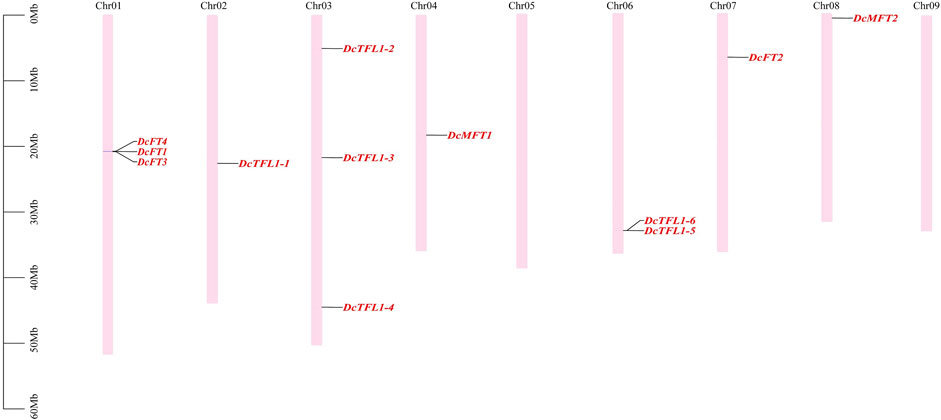
FIGURE 2. Distribution of PEBP family genes on carrot chromosomes. The names of 12 carrot PEBP genes are shown to the right of each chromosome. Gene positions and chromosome size can be measured using the scale on the left of the figure in mega bases (bp).
Gene structure, conserved motifs and cis-acting elements analysis
Six consensus motifs were detected in PEBP genes, and the distribution of these conserved motifs was further analyzed in carrot (Figure 3A), celery, and coriander (Supplementary Figure S2A). In carrot, most FT-Like and TFL1-Like genes contained motifs 1–5, especially motif 1 and motif 2. However, DcMFT2 contained only one motif 6. In celery and coriander, most FT-Like and TFL1-Like genes contained motifs 1–6, whereas motif 6 was absent in all MFT-Like genes. The different motif compositions, especially for MFT-Like genes, may be due to the diversity in the distribution of domains, suggesting that proteins may have different functions in Apiaceae species.
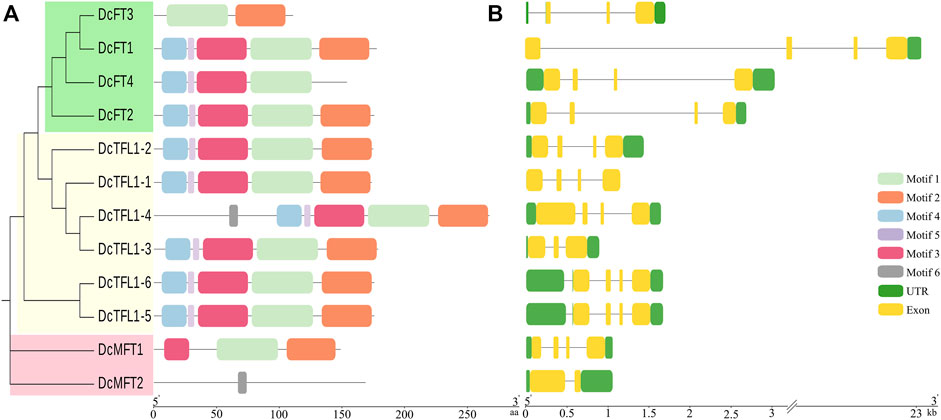
FIGURE 3. Gene motifs and structures of 12 PEBP genes in carrot. Boxes with different colors indicate conserved motifs, and the lengths of motifs in each protein are shown proportionally (A). UTRs and exons are represented by green and yellow boxes respectively (B).
The UTRs, exons, and intron organization of each PEBP gene were investigated in the three Apiaceae species (Figure 3B; Supplementary Figure S2B). The majority of the carrot PEBP genes contained four exons, whereas DcFT3, DcTFL1-3, and DcMFT2 had two or three exons. The length and position of exons and introns of carrot PEBP genes were varied. In particularly, DcFT1 contained a super intron (above 20 Kb). The number of exons in three celery FT-Like genes was consistent (3 exons). However, 17 of 23 FT genes had only one exon in coriander. The position and number of exons and introns in genes belonging to the same clade were similar, and this result supported the phylogenetic relationships of PEBP family genes.
Furthermore, to identify the responsive elements related to flowering regulation and other biological processes, cis-acting elements analysis was conducted for the 12 DcPEBP genes (Supplementary Figure S3). The cis-acting elements responsive to light, phytohormones (auxin, abscisic acid, gibberellin), meristem expression, anaerobic induction, defense and stress, and circadian control were generally detected in the promoter regions of DcPEBP genes. However, the number and type of cis-acting elements were distributed differently among genes. These results suggest that DcPEBP genes likely contribute to carrot development and several phytohormone signaling pathways, while there has been functional diversification. Interestingly, unlike the other three DcFT genes, the light responsive element was not detected in the promoter region of DcFT2, indicating that DcFT2 not directly respond to the changes of photoperiod.
Collinearity, evolutionary, and duplication type analysis of PEBP family genes
A total of 34 orthologous gene pairs were identified by collinearity analysis, including 12 between carrot and celery, 11 between carrot and coriander, and 11 between celery and coriander (Figure 4A; Supplementary Table S5). To explore the relationships of PEBP genes within species, two paralogous gene pairs were also detected in carrot and celery (Supplementary Table S6). These results indicated that there was a homologous evolutionary relationship between PEBP genes in Apiaceae species. To further elucidate the evolutionary dynamics, selection pressure, and divergence time, the Ka and Ks values and Ka/Ks ratios of these orthologous gene pairs were calculated (Figure 4B; Supplementary Table S7). The Ka/Ks ratios of all gene pairs were less than 1.0 in the intergenomic analyses, and no positively selected site was detected by PAML, implying that purifying selection was the main force behind PEBP gene evolution in the Apiaceae species. In addition, the divergence time of these orthologous gene pairs was varied from 1.14 to 19.43 million years.
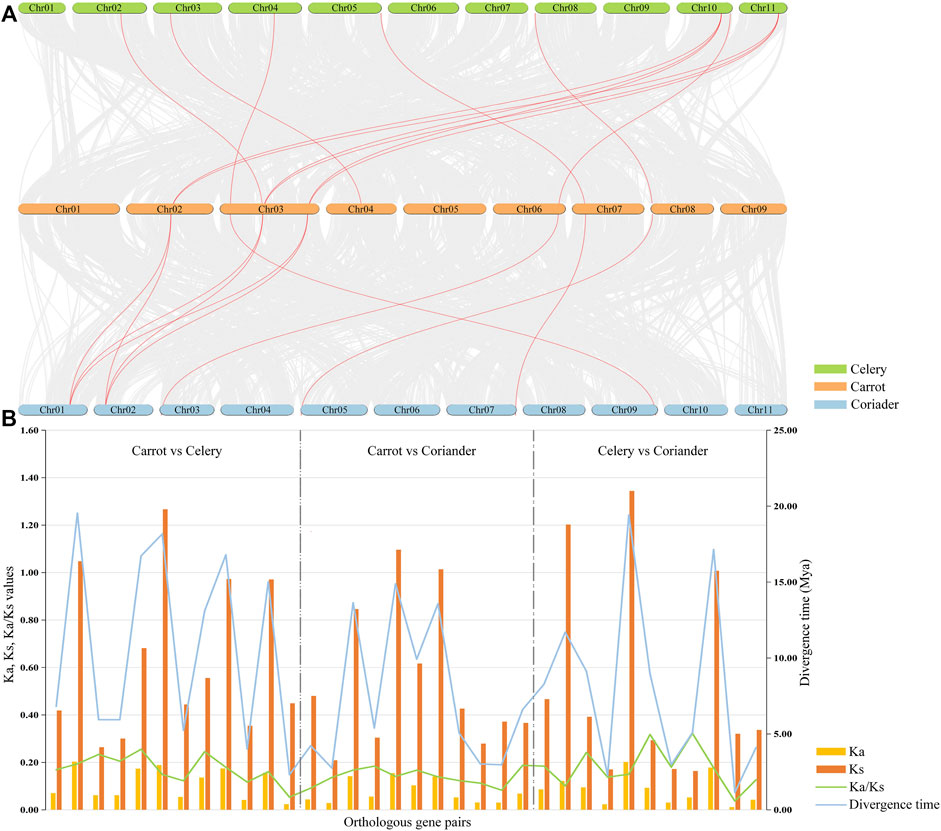
FIGURE 4. Collinearity analyses of PEBP genes among three Apiaceae species. Red lines indicate the intergenomic collinearity (A). Ka/Ks ratios and divergence time of orthologous PEBP gene pairs were estimated between any two of carrot, celery and coriander (B).
The genome-wide identification of different types of gene duplication was performed, including singleton, dispersed, proximal, segmental, and WGD (Supplementary Table S8). The results showed that 66.7% and 61.5% of PEBP genes were derived from WGD or segmental duplication in carrot and celery, respectively, indicating theat WGD or segmental duplication played significant roles in the expansion of carrot and celery PEBP family genes. In coriander, 77.4% of PEBP genes were derived from dispersed duplication, indicating the key role of dispersed duplication in coriander PEBP family genes expansion. No singleton or proximal duplication events were detected in PEBP family genes of the three Apiaceae species.
Expression profiles of PEBP family genes in various carrot tissues
Because the CDSs of DcFT1, DcFT3, and DcFT4 had strong homology (above 96.7%), specific qRT-PCR primers of the three DcFTs could not be designed separately. However, one primer pairs DcFT1/3/4 located in the common segment of the three genes was designed to detect their expression levels (Supplementary Table S1). Similarly, one primer pairs DcTFL1-5/6 located in the common segment of DcTFL1-5 and DcTFL1-6 was also designed for their expression analysis (Supplementary Table S1). Heat maps of the expression level of carrot PEBP genes in various tissues were constructed with horizontal standardization (Figure 5; Supplementary Table S9). Generally, the majority of carrot PEBP genes exhibited relatively broad expression patterns across various tissues. DcFT1/3/4 showed the highest expression level in hypocotyls, while there was almost no expression in roots, cotyledons or bracts. DcFT2 showed similar expression pattern in roots, hypocotyls and cotyledons; however, higher expression levels were also detected in other tissues. For TFL1-like genes, except for DcTFL1-2, the other genes showed the highest expression in hypocotyls, and relatively low expression in cotyledons, flower stems, reproductive leaves and bracts. These PEBP genes had different expression patterns in various tissues, even within the same subfamily, suggesting their diverse biological functions. In addition, two MFT-like genes were highly expressed in hypocotyls, indicating their regulatory role in seedling development.
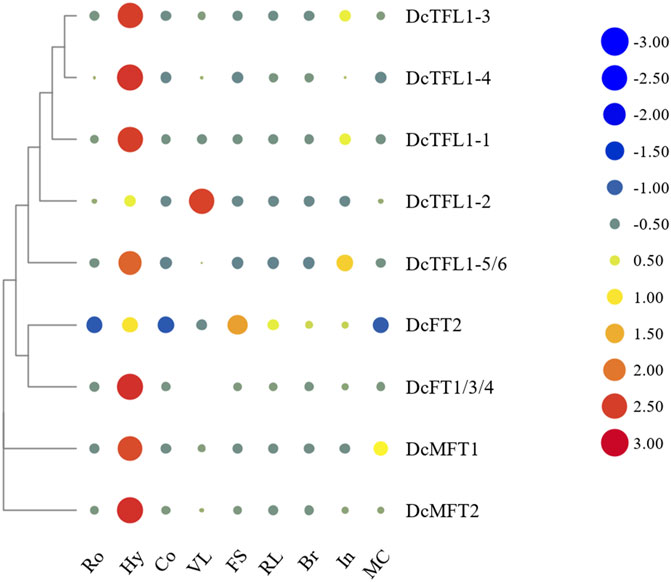
FIGURE 5. Heat map representation of carrot PEBP gene expression levels in various tissues. Ro: root, Hy: hypocotyl, Co. cotyledon, VL: vegetative leaf, FS: flower stem, RL: reproductive leaf, Br: bract, In: inflorescence, MC: mature cremocarp. The color scale with red and blue represent high and low values, respectively; color scale from –3.0 to 3.0.
Expression response of PEBP family genes to bolting and flowering
Bolting and flowing are important biological processes in plant development, and previous studies have shown that FT, TFL1, and their orthologs antagonistically regulate these life history traits (Harig et al., 2012; Yu et al., 2020; Zhu et al., 2020; Chen et al., 2022). To evaluate the responses of carrot PEBP genes during bolting and flowing, qRT-PCR analysis was conducted at eight time points (10 DBB, 5 DBB, Bo, 5 DAB, 10 DAB, 15 DAB, Fl, and 5 DAF). The expression patterns of carrot PEBP genes had significant differences during this period. Several genes (DcFT1/3/4, DcFT2, DcMFT2) showed high expression levels, while the others were basically at a stable low expression levels (Figure 6; Supplementary Table S10). Notably, DcFT1/3/4 was continuously upregulated from 10DBB to 10 DAB, and the expression level decreased after 10 DAB. In contrast, the expression of DcFT2 remained low until 10 DAB. The expression patterns of DcFT1/3/4 and DcFT2 indicated that both play important role in regulating bolting and flowering, and they had different regulatory functions and temporal-spatial expression characteristics. Similar to other species, all carrot TFL1-like genes showed low expression from bolting to flowering as flowering inhibitors. In addition, two carrot MFT-like genes were differentially expressed, and DcMFT2 may participate in the bolting and flowering process with high expression level from 10DBB to 10 DAB.
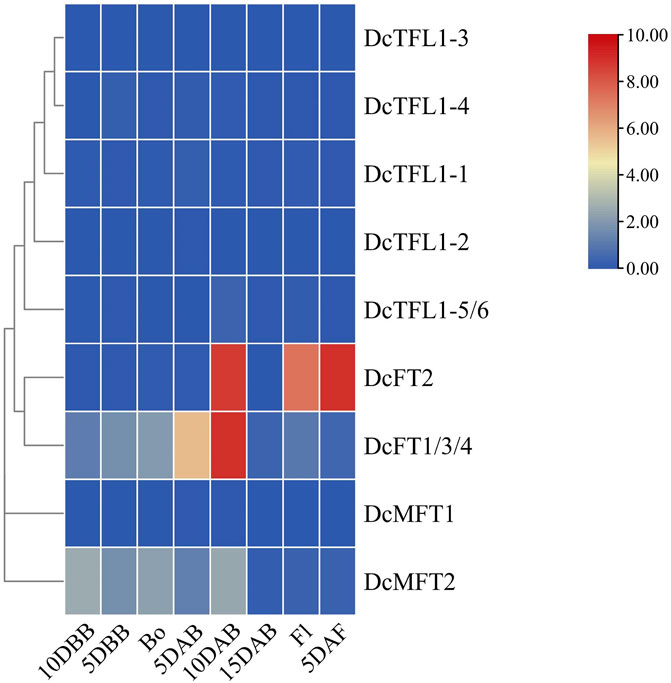
FIGURE 6. Relative expression of carrot PEBP genes from bolting to flowing. DBB: days before bolting, Bo: bolting, DAB: days after bolting, Fl: flowering, DAF: days after flowering. The color scale with red and blue represent high and low values, respectively; color scale from 0 to 10.
Subcellular localization and protein modeling analysis of carrot PEBP proteins
Based on the classification results, DcFT1, DcTFL1-1, and DcMFT1, which participated in three subgroups of carrot PEBP proteins, were selected as representative members to investigate the cellular localization. In the leaves of tobacco plants (Nicotiana benthamiana), DcFT1, DcTFL1-1, and DcMFT1 fused to GFP were transiently expressed. By using confocal microscopy, the GFP signals of the three fusion proteins were observed in the peripheral cytoplasm (surrounding the vacuole) and in the nucleus, indicating that there was no restriction to any particular subcellular compartment (Figure 7). The 3D structures of carrot PEBP proteins revealed the existence of multiple alpha helix, beta-sheet and random coil structures (Supplementary Figure S4). The results showed there were different numbers of alpha-helices and beta-sheet among the 3D structures of DcFT, DcTFL1 and DcMFT proteins. Moreover, in the same subfamily, DcFT3 contained two alpha-heliices, while other DcTFL proteins were composed of three alpha-heliices. These differences in the 3D structures may be the reason for functional differences, as DcFT proteins exhibited different expression profiles in the bolting and flowering processes.
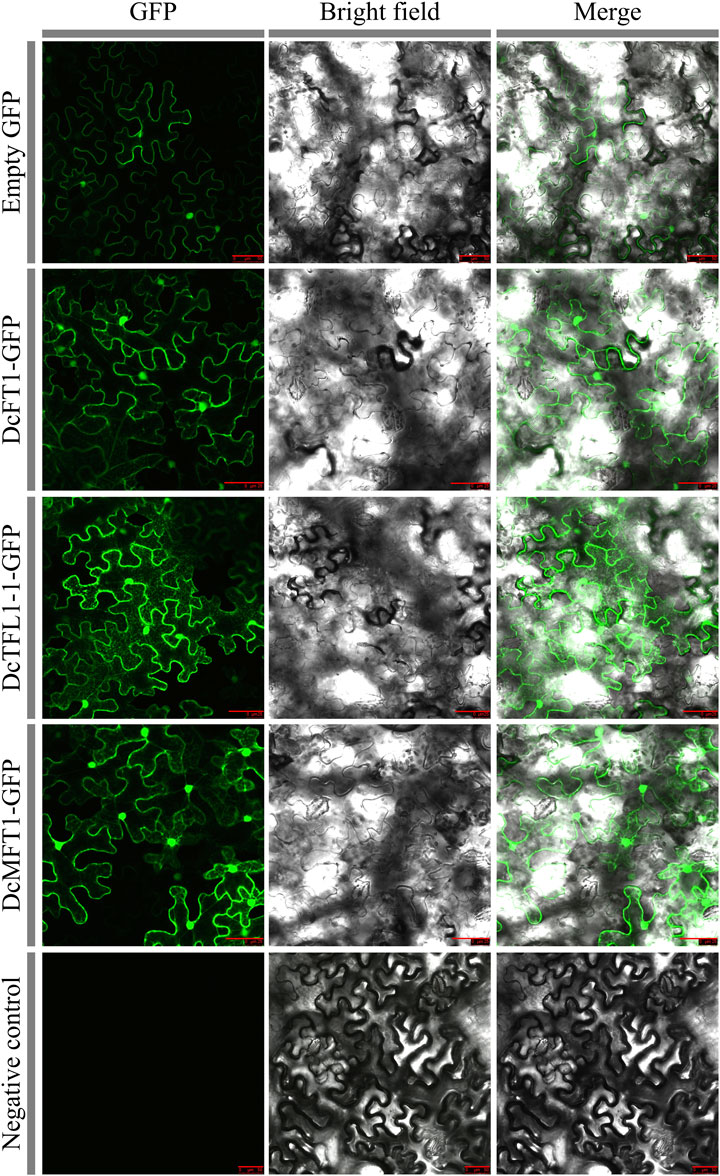
FIGURE 7. Transient expression of three carrot PEBP proteins in tobacco cells. Bars = 50 μm.
Discussion
Carrot, coriander, and celery, three major members of Apiaceae family, are globally important vegetable crops with rich nutritional value and diverse flavors (Li et al., 2018; Aelenei et al., 2019; Que et al., 2019). Carrot was the first species in the Apiaceae used for genome sequencing, and the genomes of coriander and celery were subsequently sequenced and assembled (Iorizzo et al., 2016; Li M. Y. et al., 2020; Song X. et al., 2020; Song X. M. et al., 2020; Song X. M. et al., 2021). The availability of these genomes provided resources for both fundamental and applied research into Apiaceae species and improved our understanding of the evolutionary and phylogenetic relationships in a group of under-explored plant taxa (Lee H. O. et al., 2019). The estimated genome size of carrot was 473 Mb, with nine chromosomes and 32,113 predicted genes, smaller than that 2,130.29 Mb of coriander and 3553.28 Mb of celery genome with 40,747 and 31,326 predicted genes, resceptively. The genomic differences implied that the genome structure, size and copy number varied considerably among species, and the variations were restricted to repetitive sequences and affected specific gene families involved in different plant physiological processes (Liu X. et al., 2020; Pei et al., 2021). Although the PEBP gene family has been reported in many plants, it had not been reported in carrot or other Apiaceae species until now. In this study, we performed genome-wide identification of the PEBP family genes in carrot and compared these with the analogus genes in coriander and celery. A total of 12, 13, and 31 PEBP family genes were identified in carrot, celery, and coriander genomes, respectively. Interestingly, the gene number and phylogenetic classification of PEBP family genes in carrot were similar to those of celery, indicating that the evolutionary rate of PEBP family genes was similar between the two species. However, the number of coriander PEBP genes in the FT-like subgroup was notably higher than that of the other two Apiaceae species, implying that there were more duplication events of FT-like proteins in coriander.
In this study, we constructed a phylogenetic tree of all PEBP family genes in carrot, coriander, and celery, and three distinct subgroups were formed, consistent with previous studies. Gene structure was related to the evolution of various plant species, and protein motifs were the structural elements with specific functional significance (Zhang and Li, 2017; Bu et al., 2021). We found that the motif distribution pattern of most FT-like and TFL1-like genes were similar, indicating that these genes may have conserved functions. However, the motif variation of MFT-like genes was clear, whether in carrot or in coriander and celery, and this may be the reason for the functional diversity of MFT-like genes (Yoo et al., 2004; Xi et al., 2010; Chen and Penfield, 2018; Vaistij et al., 2018). Gene duplication, including tandem duplication, segmental duplication, and WGD are the main types of gene duplication events that serves as the driving forces for gene family expansion in eukaryotes (Freeling, 2009; Jiao et al., 2012; Wang et al., 2013). The WGD or segmental events played an important role in the expansion of the PEBP gene family in carrot and celery, while dispersed duplication was the largest attribution to the expansion of coriander PEBP gene family. In this study, we identified collinearity blocks among three Apiaceae species by performing interspecies collinearity analyses. Eight carrot PEBP genes were found to have orthologous genes in coriander and celery, while five PEBP genes had no counterparts in the other two species, suggesting that the five genes were newly duplicated in the carrot genome after the divergence of carrot, coriander and celery. In addition, evolutionary analysis suggested that purifying selection was the primary evolutionary force acting on PEBP family genes in Apiaceae species.
It is well known that premature bolting, or early flowering, is an unfavorable factor in carrot production. Therefore, bolting-resistan cultivars ares a major direction in the worldwide carrot breeding effort (Alessandro et al., 2012). However, the regulatory mechanism of the transformation from vegetative growth to sexual reproduction in carrot remains unclear. In a range of plants, PEBP family genes, particularly FT and TFL1 subfamily genes, have been reported to participate in flowering differentiation (Zhang et al., 2020; Zhu et al., 2020). In this study, the expression responses of carrot PEBP genes to bolting and flowering were identified. The data suggest that carrot PEBP genes have different expression responses to bolting and flowering, indicating that they respond specifically to temperature and photoperiod and that they play different roles in flower development. The expression of carrot FT-like subfamily genes varied within the species. We found that DcFT1/3/4 was involved in the regulation of bolting, while DcFT2 was responsible for the regulation of flowering. However, more transcriptome analyses should be carried out at different time intervals, so as to clarify the transcripts of DcFT1, DcFT2, and DcFT4 separately and to identify the most important bolting regulator in carrot. In the future, based on CRISPR/Cas9, there will be the opportunity to obtain FT gene editing lines and thereby breed new bolting-tolerant carrot varieties.
Conclusion
In summary, 12, 13 and 31 PEBP genes were identified in carrot, celery, and coriander genomes, respectively, through genome-wide analysis. The number and length of exons and introns of these PEBP genes were varied, and their distributions on each chromosome were uneven. Purifying selection was the main force behind PEBP gene evolution in the three Apiaceae species. The expression of the carrot PEBP genes was relatively broad in different tissues, and significant differential expression was detected among these genes during bolting and flowing. The results presented in this report contribute to further functional characterization of PEBP genes and improve our understanding of the carrot FT genes that play key roles in the regulation of bolting and flowering.
Data availability statement
The datasets presented in this study can be found in online repositories. The names of the repository/repositories and accession number(s) can be found in the article/Supplementary Material.
Author contributions
Conceptualization, XL and DZ; formal analysis, DZ and WH; funding acquisition, FZ; writing—original draft, XL; writing—review and editing, CO, ZZ, and FZ.
Funding
This work was supported by grants from the National Natural Science Foundation of China (32102379), China Agriculture Research System (CARS-23), Agricultural Science and Technology Innovation Program of the Chinese Academy of Agricultural Sciences (CAAS-ASTIP), and Central Public-interest Scientific Institution Basal Research Fund (No.IVF-BRF2022001), The Major Science and Technology Projects of Inner Mongolia Autonomous Region (2021ZD0001).
Conflict of interest
The authors declare that the research was conducted in the absence of any commercial or financial relationships that could be construed as a potential conflict of interest.
Publisher’s note
All claims expressed in this article are solely those of the authors and do not necessarily represent those of their affiliated organizations, or those of the publisher, the editors and the reviewers. Any product that may be evaluated in this article, or claim that may be made by its manufacturer, is not guaranteed or endorsed by the publisher.
Supplementary material
The Supplementary Material for this article can be found online at: https://www.frontiersin.org/articles/10.3389/fgene.2022.1047890/full#supplementary-material
References
Abe, M., Kobayashi, Y., Yamamoto, S., Daimon, Y., Yamaguchi, A., Ikeda, Y., et al. (2005). FD, a bZIP protein mediating signals from the floral pathway integrator FT at the shoot apex. Science 309, 1052–1056. doi:10.1126/science.1115983
Aelenei, P., Rimbu, C. M., Guguianu, E., Dimitriu, G., Aprotosoaie, A. C., Brebu, M., et al. (2019). Coriander essential oil and linalool-interactions with antibiotics against Gram-positive and Gram-negative bacteria. Lett. Appl. Microbiol. 68, 156–164. doi:10.1111/lam.13100
Ahmad, T., Cawood, M., Iqbal, Q., Arino, A., Batool, A., Tariq, R. M. S., et al. (2019). Phytochemicals in Daucus carota and their health benefits-review article. Foods 8, 424. doi:10.3390/foods8090424
Alessandro, M. S., Galmarini, C. R., Iorizzo, M., and Simon, P. W. (2012). Molecular mapping of vernalization requirement and fertility restoration genes in carrot. Theor. Appl. Genet. 126, 415–423. doi:10.1007/s00122-012-1989-1
Bailey, T. L., Boden, M., Buske, F. A., Frith, M., Grant, C. E., Clementi, L., et al. (2009). MEME SUITE: tools for motif discovery and searching. Nucleic Acids Res. 37, W202–W208. doi:10.1093/nar/gkp335
Barros-Galvão, T., Dave, A., Gilday, A. D., Harvey, D., Vaistij, F. E., and Graham, I. A. (2019). ABA INSENSITIVE4 promotes rather than represses PHYA-dependent seed germination in Arabidopsis thaliana. New Phytol. 226, 953–956. doi:10.1111/nph.16363
Bäurle, I., and Dean, C. (2006). The timing of developmental transitions in plants. Cell 125, 655–664. doi:10.1016/j.cell.2006.05.005
Bradley, D., Carpenter, R., Copsey, L., Vincent, C., Rothstein, S., and Coen, E. (1996). Control of inflorescence architecture in Antirrhinum. Nature 379, 791–797. doi:10.1038/379791a0
Bradley, D., Ratcliffe, O., Vincent, C., Carpenter, R., and Coen, E. (1997). Inflorescence commitment and architecture in Arabidopsis. Science 275, 80–83. doi:10.1126/science.275.5296.80
Bu, X., Wang, X., Yan, J., Zhang, Y., Zhou, S., Sun, X., et al. (2021). Genome-wide characterization of B-box gene family and its roles in responses to light quality and cold stress in tomato. Front. Plant Sci. 12, 698525. doi:10.3389/fpls.2021.698525
Carmel-Goren, L., Liu, Y. S., Lifschitz, E., and Zamir, D. (2003). The SELF-PRUNING gene family in tomato. Plant Mol. Biol. 52, 1215–1222. doi:10.1023/b:plan.0000004333.96451.11
Carmona, M. J., Calonje, M., and Martı´nez-Zapater, J. M. (2007). The FT/TFL1 gene family in grapevine. Plant Mol. Biol. 63, 637–650. doi:10.1007/s11103-006-9113-z
Chen, M., and Penfield, S. (2018). Feedback regulation of COOLAIR expression controls seed dormancy and flowering time. Science 360, 1014–1017. doi:10.1126/science.aar7361
Chen, C., Chen, H., Zhang, Y., Thomas, H. R., Frank, M. H., He, Y., et al. (2020). TBtools: an integrative toolkit developed for interactive analyses of big biological data. Mol. Plant 13, 1194–1202. doi:10.1016/j.molp.2020.06.009
Chen, F. Y., Li, Y., Li, X. Y., Li, W. L., Xu, J. M., Cao, H., et al. (2021). Ectopic expression of the Arabidopsis florigen gene FLOWERING LOCUS T in seeds enhances seed dormancy via the GA and DOG1 pathways. Plant J. 107, 909–924. doi:10.1111/tpj.15354
Chen, Z., Ke, W., He, F., Chai, L., Cheng, X., Xu, H., et al. (2022). A single nucleotide deletion in the third exon of FT-D1 increases the spikelet number and delays heading date in wheat (Triticum aestivum L.). Plant Biotechnol. J. 20, 920–933. doi:10.1111/pbi.13773
Corbesier, L., Vincent, C., Jang, S., Fornara, F., Fan, Q. Z., Searle, I., et al. (2007). FT protein movement contributes to long-distance signaling in floral induction of Arabidopsis. Science 316, 1030–1033. doi:10.1126/science.1141752
Danilevskaya, O. N., Meng, X., Hou, Z. L., Ananiev, E. V., and Simmons, C. R. (2008). A genomic and expression compendium of the expanded PEBP gene family from maize. Plant Physiol. 146, 250–264. doi:10.1104/pp.107.109538
Faure, S., Higgins, J., Turner, A., and Laurie, D. A. (2007). The FLOWERING LOCUS T-like gene family in barley (Hordeum vulgare). Genetics 176, 599–609. doi:10.1534/genetics.106.069500
Finn, R. D., Clements, J., and Eddy, S. R. (2011). HMMER web server: interactive sequence similarity searching. Nucleic Acids Res. 39, W29–W37. doi:10.1093/nar/gkr367
Freeling, M. (2009). Bias in plant gene content following different sorts of duplication: tandem, whole-genome, segmental, or by transposition. Annu. Rev. Plant Biol. 60, 433–453. doi:10.1146/annurev.arplant.043008.092122
Gao, F., Chen, C., Arab, D. A., Du, Z., He, Y., and Ho, S. (2019). EasyCodeML: A visual tool for analysis of selection using CodeML. Ecol. Evol. 9, 3891–3898. doi:10.1002/ece3.5015
Harig, L., Beinecke, F. A., Oltmanns, J., Muth, J., Müller, O., Rüping, B., et al. (2012). Proteins from the FLOWERING LOCUS T-like subclade of the PEBP family act antagonistically to regulate floral initiation in tobacco. Plant J. 72, 908–921. doi:10.1111/j.1365-313X.2012.05125.x
Hengst, U., Albrecht, H., Hess, D., and Monard, D. (2001). The phosphatidylethanolamine-binding protein is the prototype of a novel family of serine protease inhibitors. J. Biol. Chem. 276, 535–540. doi:10.1074/jbc.M002524200
Ho, W. W., and Weigel, D. (2014). Structural features determining flower-promoting activity of Arabidopsis FLOWERING LOCUS T. Plant Cell 26, 552–564. doi:10.1105/tpc.113.115220
Hu, B., Jin, J., Guo, A. Y., Zhang, H., Luo, J., and Gao, G. (2015). GSDS 2.0: an upgraded gene feature visualization server. Bioinformatics 31, 1296–1297. doi:10.1093/bioinformatics/btu817
Huang, N. C., Jane, W. N., Chen, J., and Yu, T. S. (2012). Arabidopsis thaliana CENTRORADIALIS homologue (ATC) acts systemically to inhibit floral initiation in Arabidopsis. Plant J. 72, 175–184. doi:10.1111/j.1365-313X.2012.05076.x
Iorizzo, M., Ellison, S., Senalik, D., Zeng, P., Satapoomin, P., Huang, J. Y., et al. (2016). A high-quality carrot genome assembly provides new insights into carotenoid accumulation and asterid genome evolution. Nat. Genet. 48, 657–666. doi:10.1038/ng.3565
Jiao, Y., Leebens-Mack, J., Ayyampalayam, S., Bowers, J. E., McKain, M. R., McNeal, J., et al. (2012). A genome triplication associated with early diversification of the core eudicots. Genome Biol. 13, R3. doi:10.1186/gb-2012-13-1-r3
Karlgren, A., Gyllenstrand, N., Källman, T., Sundström, J. F., Moore, D., Lascoux, M., et al. (2011). Evolution of the PEBP gene family in plants: functional diversification in seed plant evolution. Plant Physiol. 156, 1967–1977. doi:10.1104/pp.111.176206
Kobayashi, Y., Kaya, H., Goto, K., Iwabuchi, M., and Araki, T. (1999). A pair of related genes with antagonistic roles in mediating flowering signals. Science 286, 1960–1962. doi:10.1126/science.286.5446.1960
Kotoda, N., Hayashi, H., Suzuki, M., Igarashi, M., Hatsuyama, Y., Kidou, S. I., et al. (2010). Molecular characterization of FLOWERING LOCUS T-like genes of apple (Malus x domestica Borkh.). Plant Cell Physiol. 51, 561–575. doi:10.1093/pcp/pcq021
Kumar, S., Stecher, G., and Tamura, K. (2016). MEGA7: Molecular evolutionary genetics analysis version 7.0 for bigger datasets. Mol. Biol. Evol. 33, 1870–1874. doi:10.1093/molbev/msw054
Lee, J., and Lee, I. (2010). Regulation and function of SOC1, a flowering pathway integrator. J. Exp. Bot. 61, 2247–2254. doi:10.1093/jxb/erq098
Lee, C., Kim, S. J., Jin, S., Susila, H., Youn, G., Nasim, Z., et al. (2019). Genetic interactions reveal the antagonistic roles of FT/TSF and TFL1 in the determination of inflorescence meristem identity in Arabidopsis. Plant J. 99, 452–464. doi:10.1111/tpj.14335
Lee, H. O., Joh, H. J., Kim, K., Lee, S. C., Kim, N. H., Park, J. Y., et al. (2019). Dynamic chloroplast genome rearrangement and DNA barcoding for three Apiaceae species known as the medicinal herb "bang-poong. Int. J. Mol. Sci. 20, 2196. doi:10.3390/ijms20092196
Lescot, M., Déhais, P., Thijs, G., Marchal, K., Moreau, Y., Van de Peer, Y., et al. (2002). PlantCARE, a database of plant cis-acting regulatory elements and a portal to tools for in silico analysis of promoter sequences. Nucleic Acids Res. 30, 325–327. doi:10.1093/nar/30.1.325
Li, M. Y., Hou, X. L., Wang, F., Tan, G. F., Xu, Z. S., and Xiong, A. S. (2018). Advances in the research of celery, an important Apiaceae vegetable crop. Crit. Rev. Biotechnol. 38, 172–183. doi:10.1080/07388551.2017.1312275
Li, H., Ran, K., Dong, Q., Zhao, Q., and Shi, S. (2020). Cloning, sequencing, and expression analysis of 32 NAC transcription factors (MdNAC) in apple. PeerJ 8, e8249. doi:10.7717/peerj.8249
Li, M. Y., Feng, K., Hou, X. L., Jiang, Q., Xu, Z. S., Wang, G. L., et al. (2020). The genome sequence of celery (Apium graveolens L.), an important leaf vegetable crop rich in apigenin in the Apiaceae family. Hortic. Res. 7, 9. doi:10.1038/s41438-019-0235-2
Liu, L. J., Ou, C. G., Chen, S. M., Shen, Q., Liu, B., Li, M., et al. (2020). The response of COL and FT homologues to photoperiodic regulation in carrot (Daucus carota L.). Sci. Rep. 10, 9984. doi:10.1038/s41598-020-66807-y
Liu, X., Zhao, C., Yang, L., Zhang, Y., Wang, Y., Fang, Z., et al. (2020). Genome-wide identification, expression profile of the TIFY gene family in Brassica oleracea var. capitata, and their divergent response to various pathogen infections and phytohormone treatments. Genes 11, 127. doi:10.3390/genes11020127
Lorenz, K., Lohse, M. J., and Quitterer, U. (2003). Protein kinase C switches the Raf kinase inhibitor from Raf-1 to GRK-2. Nature 426, 574–579. doi:10.1038/nature02158
Maljaei, M. B., Moosavian, S. P., Mirmosayyeb, O., Rouhani, M. H., Namjoo, I., and Bahreini, A. (2019). Effect of celery extract on thyroid function; Is herbal therapy safe in obesity? Int. J. Prev. Med. 10, 55. doi:10.4103/ijpvm.ijpvm_209_17
Marchler-Bauer, A., Bo, Y., Han, L., He, J., Lanczycki, C. J., Lu, S., et al. (2017). CDD/SPARCLE: functional classification of proteins via subfamily domain architectures. Nucleic Acids Res. 45, D200–D203. doi:10.1093/nar/gkw1129
Michaels, S. D. (2009). Flowering time regulation produces much fruit. Curr. Opin. Plant Biol. 12, 75–80. doi:10.1016/j.pbi.2008.09.005
Mimida, N., Goto, K., Kobayashi, Y., Araki, T., Ahn, J. H., Weigel, D., et al. (2001). Functional divergence of the TFL1-like gene family in Arabidopsis revealed by characterization of a novel homologue. Genes Cells. 6, 327–336. doi:10.1046/j.1365-2443.2001.00425.x
Mohamed, R., Wang, C. T., Ma, C., Shevchenko, O., Dye, S. J., Puzey, J. R., et al. (2010). Populus CEN/TFL1 regulates first onset of flowering, axillary meristem identity and dormancy release in Populus. Plant J. 62, 674–688. doi:10.1111/j.1365-313X.2010.04185.x
Ou, C. G., Mao, J. H., Liu, L. J., Li, C. J., Ren, H. F., Zhao, Z. W., et al. (2017). Characterising genes associated with flowering time in carrot (Daucus carota L.) using transcriptome analysis. Plant Biol. 19, 286–297. doi:10.1111/plb.12519
Pei, Q. Y., Yu, T., Wu, T., Yang, Q. H., Gong, K., Zhou, R., et al. (2021). Comprehensive identification and analyses of the Hsf gene family in the whole-genome of three Apiaceae species. Hortic. Plant J. 7, 457–468. doi:10.1016/j.hpj.2020.08.005
Qiao, X., Li, Q., Yin, H., Qi, K., Li, L., Wang, R., et al. (2019). Gene duplication and evolution in recurring polyploidization-diploidization cycles in plants. Genome Biol. 20, 38. doi:10.1186/s13059-019-1650-2
Que, F., Hou, X. L., Wang, G. L., Xu, Z. S., Tan, G. F., Li, T., et al. (2019). Advances in research on the carrot, an important root vegetable in the Apiaceae family. Hortic. Res. 6, 69. doi:10.1038/s41438-019-0150-6
Ratnaparkhe, M. B., Wang, X., Li, J., Compton, R. O., Rainville, L. K., Lemke, C., et al. (2011). Comparative analysis of peanut NBS-LRR gene clusters suggests evolutionary innovation among duplicated domains and erosion of gene microsynteny. New Phytol. 192, 164–178. doi:10.1111/j.1469-8137.2011.03800.x
Ryu, J. Y., Lee, H. J., Seo, P. J., Jung, J. H., Ahn, J. H., and Park, C. M. (2014). The Arabidopsis floral repressor BFT delays flowering by competing with FT for FD binding under high salinity. Mol. Plant 7, 377–387. doi:10.1093/mp/sst114
Schultz, J., Milpetz, F., Bork, P., and Ponting, C. P. (1998). SMART, a simple modular architecture research tool: identification of signaling domains. Proc. Natl. Acad. Sci. U. S. A. 95, 5857–5864. doi:10.1073/pnas.95.11.5857
Sharma, N., Geuten, K., Giri, B. S., and Varma, A. (2020). The molecular mechanism of vernalization in Arabidopsis and cereals: role of flowering locus C and its homologs. Physiol. Plant. 170, 373–383. doi:10.1111/ppl.13163
Song, Y. H., Shim, J. S., Kinmonth-Schultz, H. A., and Imaizumi, T. (2015). Photoperiodic flowering: time measurement mechanisms in leaves. Annu. Rev. Plant Biol. 66, 441–464. doi:10.1146/annurev-arplant-043014-115555
Song, X., Nie, F., Chen, W., Ma, X., Gong, K., Yang, Q., et al. (2020). Coriander genomics database: a genomic, transcriptomic, and metabolic database for coriander. Hortic. Res. 7, 55. doi:10.1038/s41438-020-0261-0
Song, X. M., Wang, J. P., Li, N., Yu, J. G., Meng, F. B., Liu, C., et al. (2020). Deciphering the high-quality genome sequence of coriander that causes controversial feelings. Plant Biotechnol. J. 18, 1444–1456. doi:10.1111/pbi.13310
Song, C., Li, G., Dai, J., and Deng, H. (2021). Genome-wide analysis of PEBP genes in Dendrobium huoshanense: unveiling the antagonistic functions of FT/TFL1 in flowering time. Front. Genet. 12, 687689. doi:10.3389/fgene.2021.687689
Song, X. M., Sun, P. C., Yuan, J. Q., Gong, K., Li, N., Meng, F. B., et al. (2021). The celery genome sequence reveals sequential paleo-polyploidizations, karyotype evolution and resistance gene reduction in apiales. Plant Biotechnol. J. 19, 731–744. doi:10.1111/pbi.13499
Stelmach, K., Macko-Podgórni, A., Allender, C., and Grzebelus, D. (2021). Genetic diversity structure of western-type carrots. BMC Plant Biol. 21, 200. doi:10.1186/s12870-021-02980-0
Taoka, K., Taoka, K., Ohki, I., Tsuji, H., Furuita, K., Hayashi, K., et al. (2011). 14-3-3 proteins act as intracellular receptors for rice Hd3a florigen. Nature 476, 332–335. doi:10.1038/nature10272
Vaistij, F. E., Barros-Galvão, T., Cole, A. F., Gilday, A. D., He, Z., Li, Y., et al. (2018). MOTHER-OF-FT-AND-TFL1 represses seed germination under far-red light by modulating phytohormone responses in Arabidopsis thaliana. Proc. Natl. Acad. Sci. U. S. A. 115, 8442–8447. doi:10.1073/pnas.1806460115
Voinnet, O., Lederer, C., and Baulcombe, D. C. (2000). A viral movement protein prevents systemic spread of the gene silencing signal in Nicotiana benthamiana. Cell 103, 157–167. doi:10.1016/s0092-8674(00)00095-7
Wang, X., Gowik, U., Tang, H., Bowers, J. E., Westhoff, P., and Paterson, A. H. (2009). Comparative genomic analysis of C4 photosynthetic pathway evolution in grasses. Genome Biol. 10, R68. doi:10.1186/gb-2009-10-6-r68
Wang, Y., Tang, H., Debarry, J. D., Tan, X., Li, J., Wang, X., et al. (2012). MCScanX: a toolkit for detection and evolutionary analysis of gene synteny and collinearity. Nucleic Acids Res. 40, e49. doi:10.1093/nar/gkr1293
Wang, N., Xiang, Y., Fang, L., Wang, Y., Xin, H., and Li, S. (2013). Patterns of gene duplication and their contribution to expansion of gene families in grapevine. Plant Mol. Biol. Rep. 31, 852–861. doi:10.1007/s11105-013-0556-5
Wang, M., Tan, Y. G., Cai, C. P., and Zhang, B. H. (2019). Identification and expression analysis of phosphatidy ethanolamine-binding protein (PEBP) gene family in cotton. Genomics 111, 1373–1380. doi:10.1016/j.ygeno.2018.09.009
Waterhouse, A., Bertoni, M., Bienert, S., Studer, G., Tauriello, G., Gumienny, R., et al. (2018). SWISS-MODEL: homology modelling of protein structures and complexes. Nucleic Acids Res. 46, W296–W303. doi:10.1093/nar/gky427
Wohlfeiler, J., Alessandro, M. S., Cavagnaro, P. F., and Galmarini, C. R. (2019). Multiallelic digenic control of vernalization requirement in carrot (Daucus carota L.). Euphytica 215, 37. doi:10.1007/s10681-019-2360-2
Xi, W., Liu, C., Hou, X., and Yu, H. (2010). MOTHER OF FT AND TFL1 regulates seed germination through a negative feedback loop modulating ABA signaling in Arabidopsis. Plant Cell 22, 1733–1748. doi:10.1105/tpc.109.073072
Xu, L., Dong, Z., Fang, L., Luo, Y., Wei, Z., Guo, H., et al. (2019). OrthoVenn2: a web server for whole-genome comparison and annotation of orthologous clusters across multiple species. Nucleic Acids Res. 47, W52–W58. doi:10.1093/nar/gkz333
Yang, Z., Chen, L., Kohnen, M. V., Xiong, B., Zhen, X., Liao, J., et al. (2019). Identification and characterization of the PEBP family genes in moso bamboo (Phyllostachys heterocycla). Sci. Rep. 9, 14998. doi:10.1038/s41598-019-51278-7
Yang, Z. (2007). PAML 4: phylogenetic analysis by maximum likelihood. Mol. Biol. Evol. 24, 1586–1591. doi:10.1093/molbev/msm088
Yoo, S. Y., Kardailsky, I., Lee, J. S., Weigel, D., and Ahn, J. H. (2004). Acceleration of flowering by overexpression of MFT (MOTHER OF FT AND TFL1). Mol. Cells 29, 95–101. doi:10.1214/09-AAP598
Yu, Y., Qiao, L., Chen, J., Rong, Y., Zhao, Y., Cui, X., et al. (2020). Arabidopsis REM16 acts as a B3 domain transcription factor to promote flowering time via directly binding to the promoters of SOC1 and FT. Plant J. 103, 1386–1398. doi:10.1111/tpj.14807
Zhan, Z. X., Zhang, C. S., Zhang, H. W., Li, X. J., Wen, C. L., and Liang, Y. (2017). Molecular cloning, expression analysis, and subcellular localization of FLOWERING LOCUS T (FT) in carrot (Daucus carota L.). Mol. Breed. 37, 149–9. doi:10.1007/s11032-017-0749-y
Zhang, Q., and Li, C. (2017). Comparisons of copy number, genomic structure, and conserved motifs for α-amylase genes from barley, rice, and wheat. Front. Plant Sci. 8, 1727. doi:10.3389/fpls.2017.01727
Zhang, B., Li, C. x., Li, Y., and Yu, H. (2020). Mobile TERMINAL FLOWER1 determines seed size in Arabidopsis. Nat. Plants 6, 1146–1157. doi:10.1038/s41477-020-0749-5
Keywords: Daucus carota, PEBP genes, comparative genomics, expression pattern, bolting
Citation: Liu X, Zhao D, Ou C, Hao W, Zhao Z and Zhuang F (2022) Genome-wide identification and characterization profile of phosphatidy ethanolamine-binding protein family genes in carrot. Front. Genet. 13:1047890. doi: 10.3389/fgene.2022.1047890
Received: 19 September 2022; Accepted: 26 October 2022;
Published: 08 November 2022.
Edited by:
Million Tadege, Oklahoma State University, United StatesReviewed by:
Jinpeng Wang, Institute of Botany (CAS), ChinaTeame Gereziher Mehari, Nantong University, China
Copyright © 2022 Liu, Zhao, Ou, Hao, Zhao and Zhuang. This is an open-access article distributed under the terms of the Creative Commons Attribution License (CC BY). The use, distribution or reproduction in other forums is permitted, provided the original author(s) and the copyright owner(s) are credited and that the original publication in this journal is cited, in accordance with accepted academic practice. No use, distribution or reproduction is permitted which does not comply with these terms.
*Correspondence: Feiyun Zhuang, emh1YW5nZmVpeXVuQGNhYXMuY24=
†These authors have contributed equally to this work