 Qiuwen Sun
 Lei Cheng1†
 Longzhen Zhang
95% of researchers rate our articles as excellent or good
Learn more about the work of our research integrity team to safeguard the quality of each article we publish.
Find out more
ORIGINAL RESEARCH article
Front. Genet. , 04 January 2023
Sec. Computational Genomics
Volume 13 - 2022 | https://doi.org/10.3389/fgene.2022.1032768
This article is part of the Research Topic Artificial Intelligence and Bioinformatics Applications for Omics and Multi-Omics Studies View all 13 articles
Integrating multi-omics data for cancer subtype recognition is an important task in bioinformatics. Recently, deep learning has been applied to recognize the subtype of cancers. However, existing studies almost integrate the multi-omics data simply by concatenation as the single data and then learn a latent low-dimensional representation through a deep learning model, which did not consider the distribution differently of omics data. Moreover, these methods ignore the relationship of samples. To tackle these problems, we proposed SADLN: A self-attention based deep learning network of integrating multi-omics data for cancer subtype recognition. SADLN combined encoder, self-attention, decoder, and discriminator into a unified framework, which can not only integrate multi-omics data but also adaptively model the sample’s relationship for learning an accurately latent low-dimensional representation. With the integrated representation learned from the network, SADLN used Gaussian Mixture Model to identify cancer subtypes. Experiments on ten cancer datasets of TCGA demonstrated the advantages of SADLN compared to ten methods. The Self-Attention Based Deep Learning Network (SADLN) is an effective method of integrating multi-omics data for cancer subtype recognition.
Cancer is one of the most common and fatal diseases with high heterogeneity, that is same cancer will produce subtypes with different phenotypes, which will affect the clinical treatment and prognosis (Bray et al., 2018; Siegel et al., 2020). Therefore, the recognition of the cancer subtype is of great significance for the choice of treatment and prognosis of cancer patients (Hong Zhao et al., 2014). With the developments of high-throughput sequencing technology, there yield large amounts of multi-omics data, such as miRNA expression data, mRNA expression data, DNA methylation data, and copy number variation etc. (Song et al., 2020). These multi-omics data can be obtained by some publicly available projects. For example, The Cancer Genome Atlas (TCGA) (Sayáns et al., 2019) stories more than 30 cancers over 11,000 patients’ data and provides valuable opportunities for cancer subtype recognition. Existing studies have demonstrated that incorporating multi-omics data can obtain better performances and improve the understanding of cancer progression compared to using single-omic data (Hawkins et al., 2010; Kristensen et al., 2014; Hasin et al., 2017). Therefore, there is a strong need for integrated analysis of multi-omics data in cancer subtype recognition (Simidjievski et al., 2019; Xu et al., 2019; Picard et al., 2021).
The clustering algorithm is often used to recognize cancer subtypes. Researchers have proposed many clustering methods for multi-omics data integration. These methods can be divided into three categories: early integration, late integration, and intermediate integration (Rappoport and Shamir, 2018).
Early integration methods simply concatenate different omics’ feature matrices to a single matrix and use the single omics clustering algorithm to subtype the matrix (Rappoport and Shamir, 2018). For example, K-means, LRAcluster, and Spectral clustering all belong to this category. Early integration methods do not consider the differences in the distribution and information contribution of each omics data, they increase the dimension of input data and exacerbate the dimension problem. In late integration, each omic data is clustered separately and the clustering solutions are integrated to obtain a single clustering solution. For example, COCA (Le et al., 2016) and PINS (Nguyen et al., 2017) belong to this category. Late integration methods ensure robustness against noise and bias, but the performance may be greatly affected when each omics data have different degrees of information contribution.
On the other hand, intermediate integration attempts to build a model that integrates all omics, including the method of integrating sample similarity, the method of using joint size reduction, and the method of using data statistical modeling. Similarity-based ensemble methods construct and fuse the sample similarity at each omics level to obtain consistent sample-sample relationships, and then perform cluster analysis. Typical methods include SNF (Wang et al., 2014) and NEMO (Rappoport and Shamir, 2019). These methods are very sensitive to data noise or network parameters due to the instability of the kernel distance function. An ensemble method based on dimensionality reduction is used to project each omics data into a common low-dimensional space, typical methods are CCA and MCCA (Witten and Tibshirani, 2009). However, these methods are susceptible to data noise and feature heterogeneity. Statistics-based ensemble methods build a statistical model to tackle ensemble challenges, including cluster (Shen et al., 2009), iClusterPlus and iClusterBayes.
As machine learning development, deep learning has been widely used in healthcare, such as imaging-based computer-aided diagnosis (Yu et al., 2021), digital pathology (Parodi et al., 2015), drug design (Peng et al., 2020), prediction of hospital admission (Zhang et al., 2022), classification of cancer (Zeng et al., 2021), and so on. With the advancement of the high learning capability and flexibility of deep neural networks, more and more deep learning based multi-omics integration methods have been proposed for cancer subtype recognition (Poirion et al., 2018; Guo et al., 2019). Most of them adopted autoencoder (AE) architecture, such as multi-omics autoencoder integration (MAUI) (Song et al., 2021), stacked sparse autoencoder (SSAE) (Xu et al., 2016), denoising autoencoder for accurate cancer prognosis prediction (DCAP) (Chai et al., 2021), which can efficiently leverage multi-omics datasets to learn latent factors of observed data in lower dimensions. However, these methods are almost based on early integration and ignore the distributions of different omics which would underestimate heterogeneous omics data (Wang et al., 2020). To solve these problems, some researchers have proposed deep learning based middle integration methods (Sharifi-Noghabi et al., 2019; Adossa et al., 2021; Picard et al., 2021). These methods separately learned each omics data through some subnetwork, and then integrated the output of every sub-network into a unified representation. For example, Tong et al. (2020) proposed ConcatAE, a method of concatenating features learned from each omics using an autoencoder. Yang et al. (2021a) proposed Subtype-GAN, an approach that used multi-input multi-output neural networks separately to model multi-omics data. Although these methods have demonstrated good performance in cancer subtype recognition, they ignore the relationship between samples when learning valuable feature representation. Different omics data types could provide unique characteristics to the patients’ space. Therefore, it is crucial to utilize the relationship of patients to further boost learning performance.
More recently, attention mechanism has become a new technology in the field of deep learning. The dominant thought is to measure the similarity between the Key and the Query (Mercer and Neufeld, 2021). Attention mechanism has been applied in speech NLP, image and other fields (Luo et al., 2018; Yuan et al., 2018; Li et al., 2020a; Liu et al., 2020), since it can select the most informative features of an input, adaptively consider the importance of a single feature and allow the model to make a more accurate judgment. As a special, self-attention (Shaw et al., 2018; Hou et al., 2019), which calculates the response at a position in the sequence by attending to all positions within the same sequence has achieved notable success in modeling complicated relations (Gao et al., 2019). For instance, it displays the superiority in machine translation (Zhang et al., 2020), sentence embedding (Li et al., 2020b) of modeling arbitrary word dependency and has been successfully applied to capture node similarities in graph embedding (Mustafa Abualsaud, 2019). Research shows that the attention-based encoder is more fit for learning high-level features (Chen et al., 2021).
To this end, we proposed SADLN: a self-attention based deep learning network integrating multi-omics data for cancer subtype recognition. SADLN is a middle integration method by consolidates the adversarial generation network and the self-attention mechanism to describe the different distributions of multi-omics data and fusion samples’ relationship. It used an independent sub network to learn omics-specific features and concatenated omics-specific features to an integration representation. Then used a self-attention to learn the relationship of samples on the integration representation and obtained a feature representation that fused the sample relationship. Finally, it used the Gaussian Mixture Model (GMM) to obtain the subtyping label of each sample.
The main contribution is summarized as follows:
1) We proposed a novel deep learning method, SADLN, which combines encoder, self-attention, decoder, and discriminator into a unified framework. It can simultaneously integrate multi-omics representation and sample relations.
2) We firstly introduced the self-attention into the deep learning based method for the cancer subtyping recognition task which allows the model to automatically learn the similarity of samples for better representation.
3) We conducted experiments on ten cancer datasets of TCGA, and SADLN achieved outstanding performance compared with ten integration methods. It provided the theoretical basis and a new method for clinical diagnosis and precise treatment of cancer, which has great theoretical significance and clinical application value.
Our proposed method consists of two steps. Firstly, we used the SADLN model to learn an integrated feature representation from multi-omics data. Secondly, with the learned feature representation, we used the GMM to identify sample’s subtypes. In the SADLN model, the input is the sample’s multi-omics data and the output is the sample’s integrated low-dimensional feature representation. The model consists of three main blocks: self-attention based encoder, decoder and discriminator. Figure 1 gives the overview architecture of our proposed method. In the following, we describe each block in more detail.
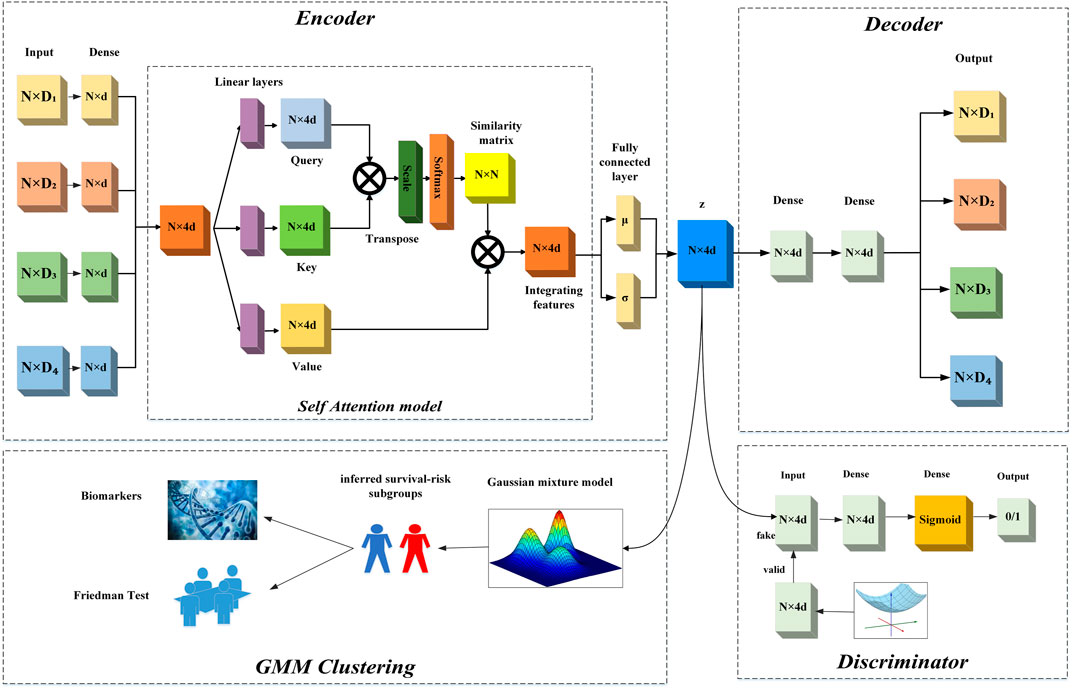
FIGURE 1. The overview architecture of SADLN.
To be able to generate higher quality data distribution, we design a self-attention based encoder in our SADLN model as shown in Figure 1. The self attention based encoder transforms the multi-omics data into a low-dimensional latent space representation z with distribution N(μ, σ) using multiple independent network layers, a fully connected layer and the self attention layer. We used four sub-independent dense network to extract features from each original omics data. For each sub-independent layer, let
where wm is the weight matrix, bm is the bias.
To fusion features from different omics data, we concatenate four features matrices into a feature representation matrix. The integrating feature matrix Y can be expressed as:
For example, if the outputs of the sub-networks is a N × d feature matrix, after concatenation, the output will be one N × 4d feature representation matrix. To prevent the model overfitting, we appended batch normalization layers and used the Gaussian Error Linear Unit (GELU) function as the non-linear activation function. That is:
Although the concatenation operation can integrate multi-omics data, the relationship between samples is not considered. In this study, we introduced self-attention mechanism to construct the relationship between samples. Self-attention is typically used to model the relationship of words in a sentence, we treat each sample’s features vector as a word and learn the samples’ weight matrix through the sample’s feature vectors.
Let dk = 4d,
Secondly, softmax function was used to obtain the similarity weight. That is:
Thirdly, the integrated feature vector zi of sample i can be obtained by a weighted sum of the values. That is:
Finally, the integrated feature representation can be express as:
To keep the data distribution unchanged, we added batch normalization layers after the self-attention model.
Suppose Z obeys Gaussian distribution Z ∼ N(μ, σ2), where μ is the mean and σ2 is the variance. In this paper, we obtained μ and σ2 through two fully-connected layers.
Decoder, in our SADLN model attempts to reconstruct the original multi-omics data from the integrating representation Z. As shown in the upper right halves of Figure 1, it contains fully connected layers and an output layer. Let
To force the distribution of the integrated feature representation matches the prior Gaussian distribution, we added a discriminator D to the model, which is a part of the GAN network. A typical GAN network is composed of a generator G and a discriminator D. In this work, we regard the self-attention base encoder part as the generator G, the input of the discriminator D is the output of the encoder part, and the randomly sampled data with Gaussian distribution. Let G(z) denote the function of the generator, and P(z) denote the prior Gaussian distribution. The discriminator D is used to distinguish the samples from P(z) or the G(z) (Yang et al., 2021a). Through adversarial learning, G(z) is as close to P(z) as possible.
The objective function optimization of discriminator D adopts the method of maximization and minimization. It can be expressed as:
where E represents the expected value of the distribution function. We use the binary_crossentropy function to train the discriminator learning process. The loss of the discriminator is:
Our model parameters of the whole network are jointly trained by minimizing the following total loss:
where LDecoder and LDiscr are defined in Eq.8 and Eq. 11, respectively. λ1 and λ2 ∈ [0, 1] are trade-off parameters.
For the generated feature representation
GMM used the EM algorithm to update the parameters π, μ and ∑. According to the maximum probability density of the sample in different clusters, the most suitable subtype labels are obtained.
The SADLN model has 19 layers, including 10 layers of the encoder, five layers of the decoder, and four layers of the discriminator. The specific network structure of SADLN is shown in Table 1. The model is built based on python 3.6.12, Keras 2.2.4, and TensorFlow 1.14.0 (the CPU version). The operating system is Windows 10. In terms of hardware, the CPU is Intel(R) Core (TM) i7-105 10U.
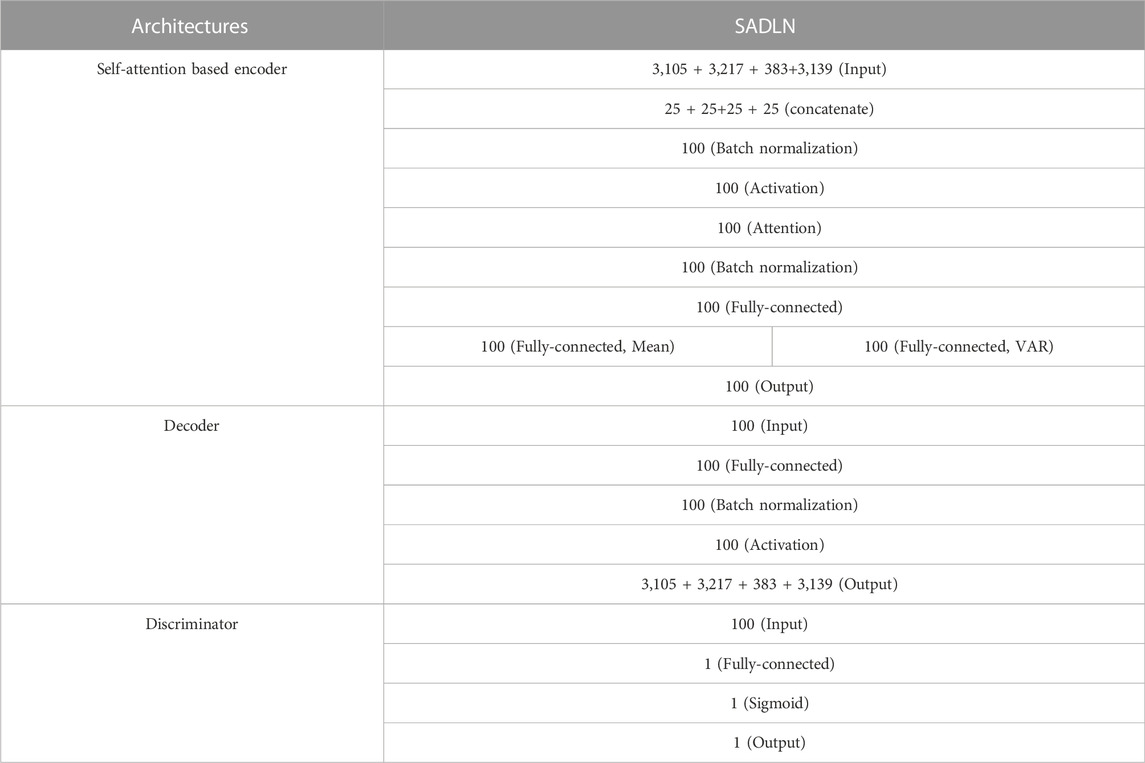
TABLE 1. The network structure of SADLN.
Optimizing hyperparameters are the key to training neural network models. Choosing appropriate hyperparameters can significantly improve the performance of the model. In this paper, the hyperparameters of the SADLN model mainly include the feature dimension of the independent sub network (d), the initial epoch, batch size, random seed, optimizer, activation function, learning rate and loss. Table 2 shows the hyperparameter settings of the SADLN model.
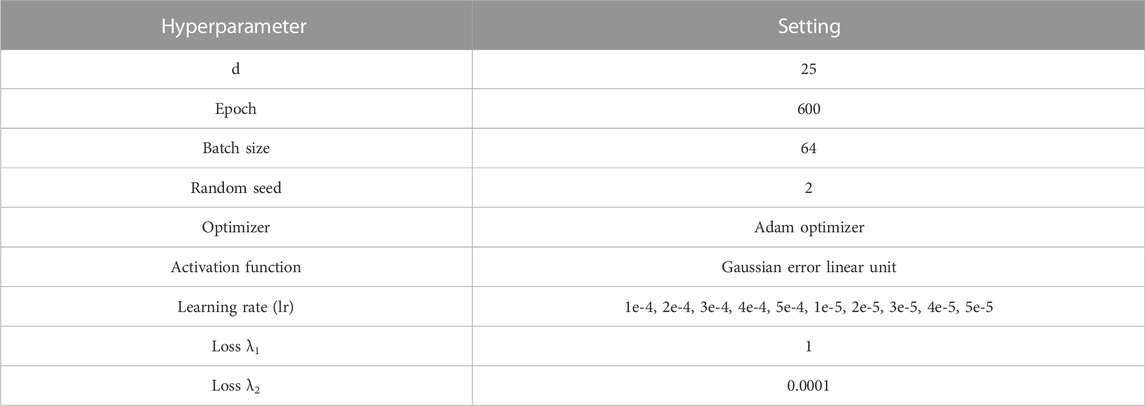
TABLE 2. Hyperparameter settings of SADLN model.
To evaluate the performance of our proposed method SADLN, we used ten TCGA cancers datasets provided by (Yang et al., 2021a) from https://github.com/haiyang1986/Subtype-GAN. The datasets include BRCA, LUAD, BLCA, PAAD, KIRC, STAD, UVM, GBM, SKCM, and UCEC. These ten datasets contain sufficient samples and have reasonable numbers of subtypes. There are four types of omics data for each cancer: copy number, DNA methylation, mRNA and miRNA. The datasets have been preprocessed and feature selection was performed. The preprocessing steps of four types data are as follows (Hoadley et al., 2018). The DNA methylation data were combined from two generations of Infinium arrays, HumanMethylation27 (HM27) and HumanMethylation450 (HM450). Firstly, the HM27 data against the HM450 data was normalized of 0–1 for β-values using a probe-by-probe proportional rescaling method. Then, 3,139 CpG sites were selected that were methylated at a β-value of
We used two evaluation metrics to evaluate the effect of cancer subtype recognition: survival analysis and clinical enrichment analysis. Survival analysis was obtained by the Cox log-rank test (Rainer and Muche and hosmer, 2001) to measure differential survival between subtypes. Smaller p-value indicates significant differences in survival profiles of different subtypes. In the clinical enrichment analysis, the differences in clinical indicators between subtypes were measured by the p-value obtained by Kruskal-Wallis test and Chi-square test for numerical and discrete clinical labels of cancer, respectively. Smaller p-value indicates significant differences between subtypes on this clinical label. Six clinical labels (Rappoport and Shamir, 2018) including age at diagnosis, gender, pathologic T, pathologic N, pathologic M, and pathologic stage were used for testing. The four latter parameters are discrete pathological parameters, measuring the size and extend of the primary tumor (T), the number of nearby lymph nodes that have cancer (N), whether the cancer has metastasized (M)and the total progression (pathologic stage). Cancer’s clinical parameters were not all available, such as GBM and UCEC only have two clinical parameters.
To avoid the influence of small cluster size on the accuracy of evaluation metrics, the permutation test (Rappoport and Shamir, 2018) was applied to calculate the p-value of Cox log-rank test in survival analysis and Chi-square test in clinical enrichment analysis. Permutation test obtains an empirical p-value using the test statistic by permuting the cluster labels between samples. To perform permutation tests, we randomly permuted the clustering assignments of the different samples. For the log-rank test, the number of permutations we performed for each clustering solution was first
To evaluate the contributions of key component of our model, we perform ablation studies in this section. There are three key modules in SADLN, self attention, decoder and discriminator. We separately removed these modules from SADLN, Table 3 gives the results of ablation studies in ten cancer datasets on TCGA.
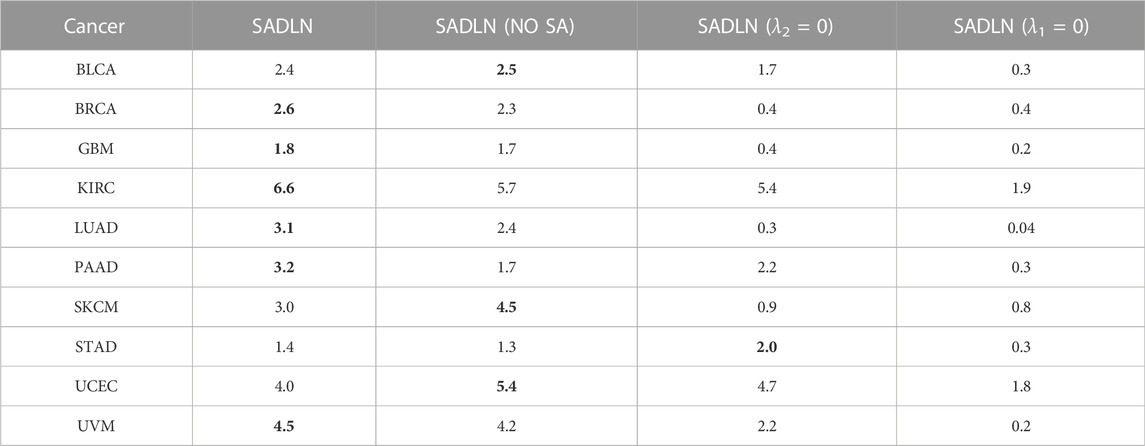
TABLE 3. The −log10p values of ablation studies in ten cancer datasets on TCGA (bold indicates that this method performs best on the corresponding cancer dataset).
From Table 3, we can see that, compared with the model without the attention module, namely SADLN (NO SA), SADLN achieved better values on seven cancer datasets (BRCA, KIRC, GBM, LUAD, PAAD, STAD, and UVM). Compared with removing the discriminator module (λ2 = 0), SADLN obtained better value on eight cancer datasets (BRCA, GBM, KIRC, LUAD, PAAD, SKCM, UCEC, and UVM). The −log10p values of removing the decoder module (λ1 = 0) are lower than SADLN. These results indicates that three modules play an important role in addressing the issue of feature generation.
To verify the performance of SADLN, we compared it with ten state-of-the-art methods. Three deep learning based methods include AE, VAE and Subtype-GAN and seven non-deep learning based methods include K-means, LRAcluster, iCluster, Spectral, NEMO (Rappoport and Shamir, 2019), MCCA (Witten and Tibshirani, 2009) and SNF (Wang et al., 2014). These ten methods can represent different types of approaches for integrating multi-omics data. AE and VAE belong to early integration methods, both input and output are integrated multi-omics data. Subtype-GAN belong to middle integration method, the input and output are multi-omics features. For ten comparison algorithms, (Yang et al., 2021a) detailed the network structure, parameter selection and execution details its Supplementary Materials Note 1 and Note 2. In this study, we rigorously implement these algorithms following the guidelines of (Yang et al., 2021a).
To reduce the influence of different clustering numbers on the results of subtyping, following the work (Yang et al., 2021a), we set the cluster number of BRCA, LUAD, BLCA, PAAD, KIRC, STAD, UVM, GBM, SKCM and UCEC were 5, 3, 5, 2, 4, 3, 4, 4, 4, 4, respectively. These cluster numbers of different cancers have been proved to be clinically informed (Berger et al., 2018; The Cancer Genome Atlas Research Network, 2013; Robertson et al., 2017a; The Cancer Genome Atlas Research Network, 2014; Levine, 2013; Akbani et al., 2015; Li and Wang, 2021; Verhaak et al., 2010; Raphael et al., 2017; Robertson et al., 2017b). Table 4 gives the cluster number and subtypes of ten cancers. For example, in a previous study, GBM was classified into Classical, Mesenchymal, Neural, and Proneural subtypes based on mRNA expression data (Verhaak et al., 2010).
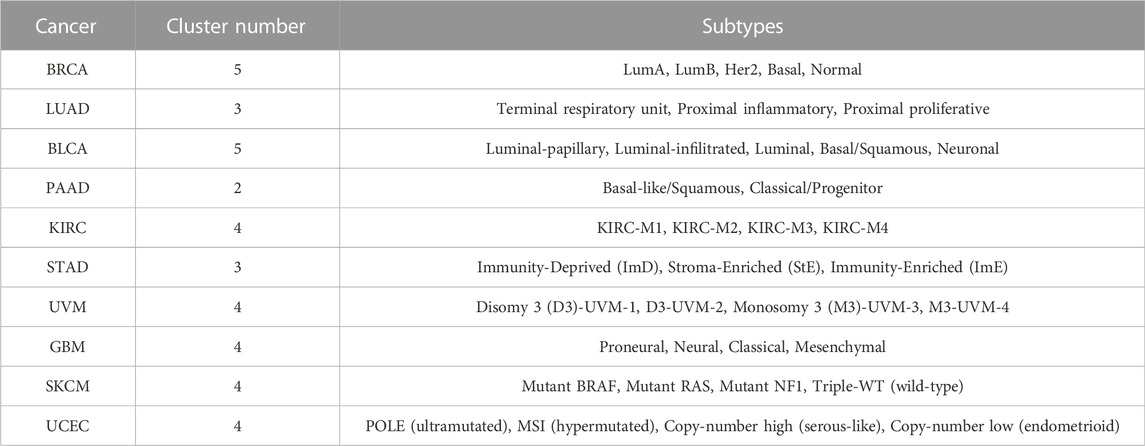
TABLE 4. The cluster number and subtypes of ten cancers.
Table 5 gives the −log10p values of survival analysis for eleven methods of ten cancer datasets on TCGA. The clustering results of the other ten compared methods come from Yang’s literature (Yang et al., 2021a). Bold indicates that this method performs best on the corresponding cancer dataset.
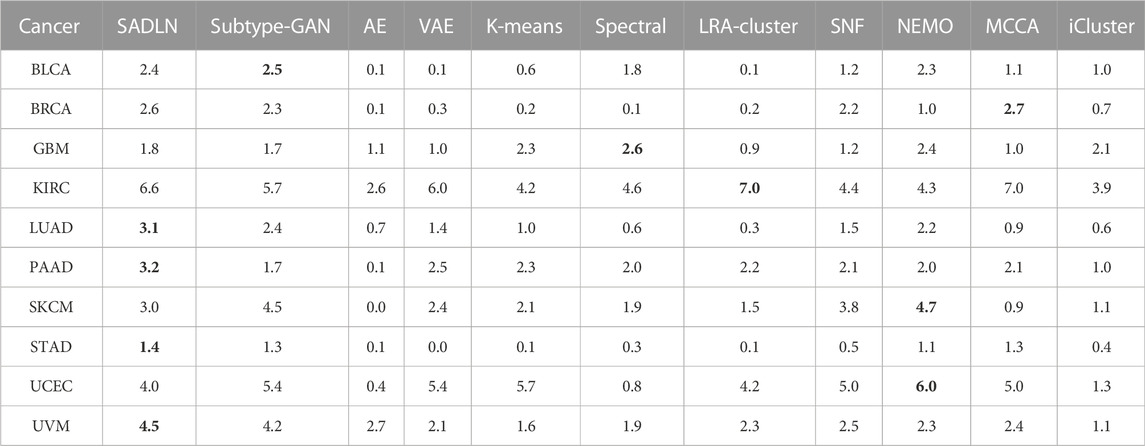
TABLE 5. The −log10p values of survival analysis based on Cox log-rank model of ten cancers datasets on TCGA (bold indicates that this method performs best on the corresponding cancer dataset).
As shown in Table 5, SADLN achieved the most significant results on PAAD, STAD, LUAD and UVM cancer datasets. Compared with Subtype-GAN, SADLN obtained better value on seven cancer datasets (BRCA, GBM, KIRC, LUAD, PAAD, STAD, and UVM). Compared with AE, SADLN obtained the best −log10p-value in ten cancer datasets. Compared with non-deep learning based methods, although same methods had best results in specific cancer datasets, the −log10p-value was highest on most cancer datasets.
Table 6 gives the clinical parameters enrichment analysis result of SADLN and other compared methods of ten cancer datasets.
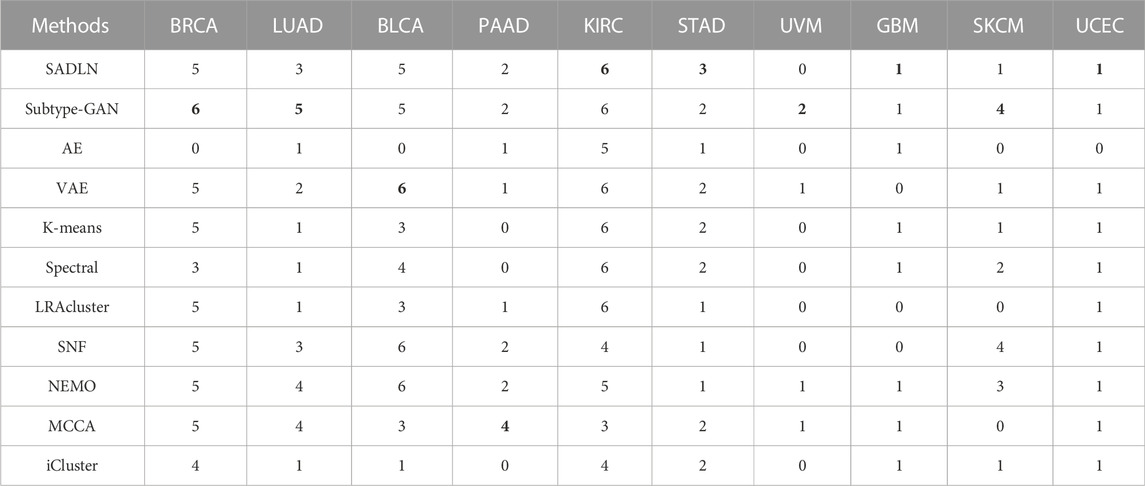
TABLE 6. The clinical parameters enrichment analysis of SADLN and other methods of ten cancer datasets on TCGA (bold indicates that this method performs best on the corresponding cancer dataset).
From Table 6, we can see that SADLN obtained the best results on four datasets (KIRC, GBM, STAD, UCEC). Therefore, we believe that SADLN is competitive with other methods in cancer subtype recognition.
Friedman (1937) analysis was also used to evaluate the performance (Figure 2). From Figure 2, we can see that the performance of SADLN is better than the three methods iCluster, LRAcluster and AE (p < 0.05), but not better than other methods. We found that the performance of the methods is not exactly consistent under the two evaluation strategies.
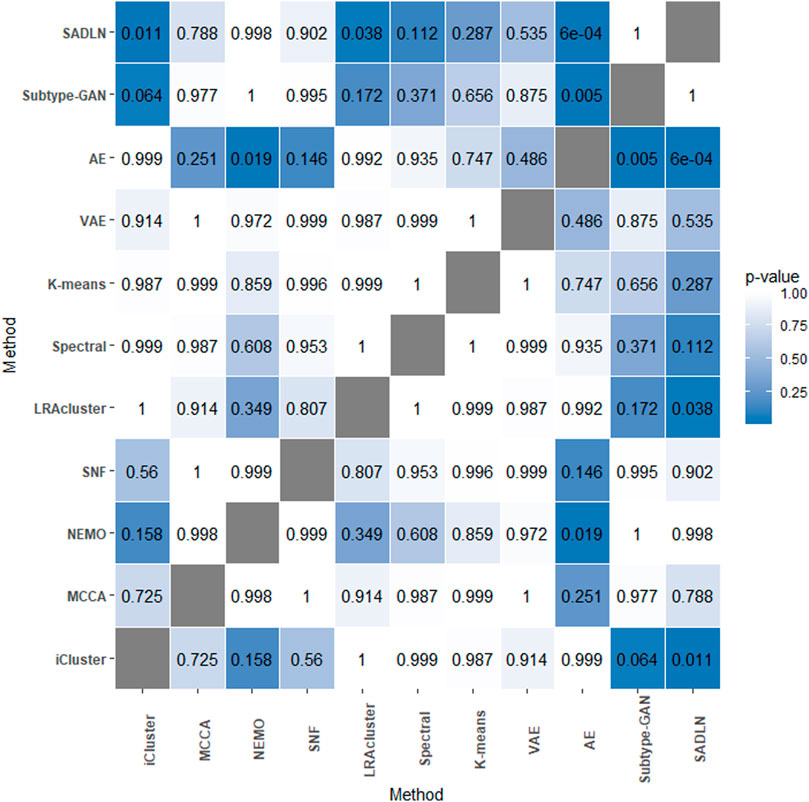
FIGURE 2. The p-values of the Friedman test on ten cancer datasets.
SADLN integrated four types of omics data. To demonstrate the necessity of integrating multiple omics data for subtype recognition, we compared multiple omics data and single omics data of SADLN (denoted as SADLN-single) on subtyping results. We use the random forest (RF) method to analyze the contribution of different omics data on the subtyping results of SADLN. The input of RF is the four original omics features and the subtype labels of SADLN. The output of RF was the Gini importance scores of the features. We perform RF using scikit-learn (1.0.1) package of python, where the key parameter max_depth is set to six and the other parameters are set to the default values. We summed all the Gini importance scores belonging to each type of omics data and quantified the contribution of different omics data to the final subtyping results. The results are shown in Figure 3.
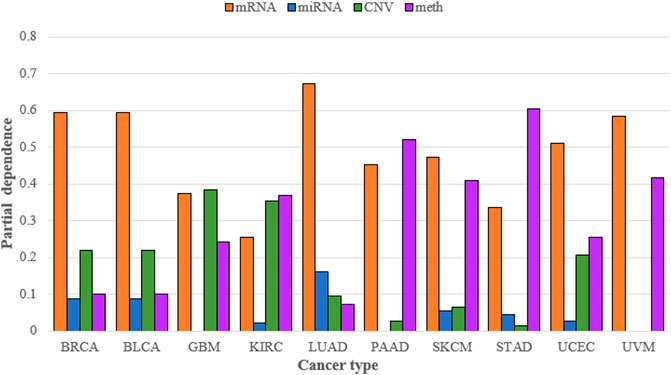
FIGURE 3. Contribution of mRNA, miRNA, CNV, and DNA methylation to the subtyping results of SADLN on ten cancer datasets.
From Figure 3 we can see that the greatest contribution of BRCA, BLCA, LUAD, SKCM, UCEC, and UVM datasets was mRNA data, the greatest contribution of GBM was CNV data and the greatest contribution of KIRC, PAAD, and STAD was DNA methylation data. For different cancers, we choose the greatest contribution of omics data as the input of SADLN-single. The settings of parameters remain the same as SADLN. We also use the metric of p-value of survival analysis in Cox log-rank model to compare the performance of SADLN and SADLN-single (Table 7).
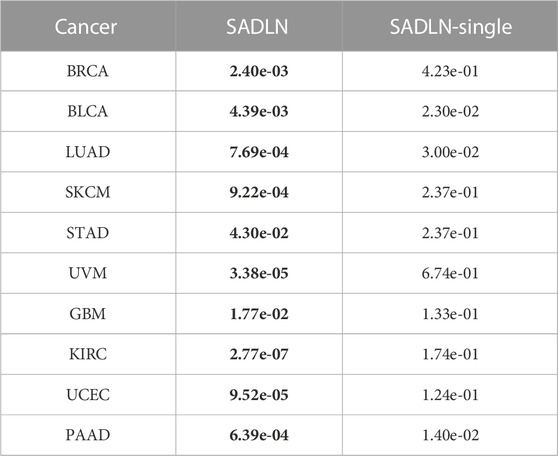
TABLE 7. The p values of survival analysis in Cox log-rank model of SADLN based multiple omics data and single omics data (bold indicates that this method performs better on the corresponding cancer dataset).
From Table 7, we can see that the p-values of SADLN are all smaller than the values of SADLN-single on ten cancer datasets. These results demonstrated that the integration of multiple omics data can help improve the performance of subtyping.
Survival curves can also be used to express the heterogeneity of different subtypes. Figures 4A–J shows the ten cancers’ Kaplan Meier survival alanalysis curves. From Figure 4, we can see that different clusters have significantly differences in survival curves (p-value < 0.05). Take BRCA cancer for example (Figure 4A), C1 has the longest average survival time, followed by C5, C2 and C3, C4 has a poor survival time.
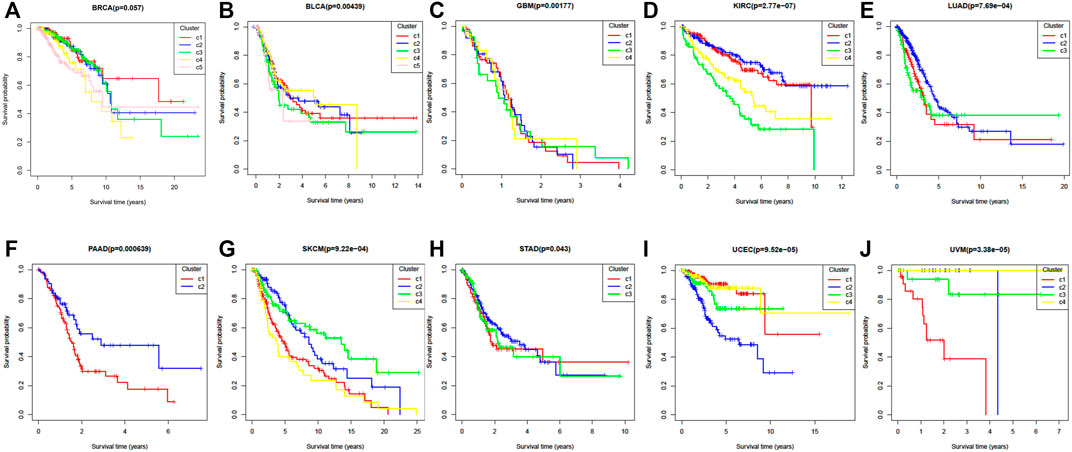
FIGURE 4. The Kaplan–Meier survival curves of ten cancer datasets. (A) BRCA, (B) BLCA, (C) GBM, (D) KIRC, (E) LUAD, (F) PAAD, (G) SKCM, (H) STAD, (I) UCEC, (J) UVM.
To visualize the clustering results, we used the t-SNE embedding method to display the final integrated feature representation of the SADLN (Figure 5). From Figure 5, we can see that samples of the same cluster are almost grouped together, and samples of different clusters are almost departed.
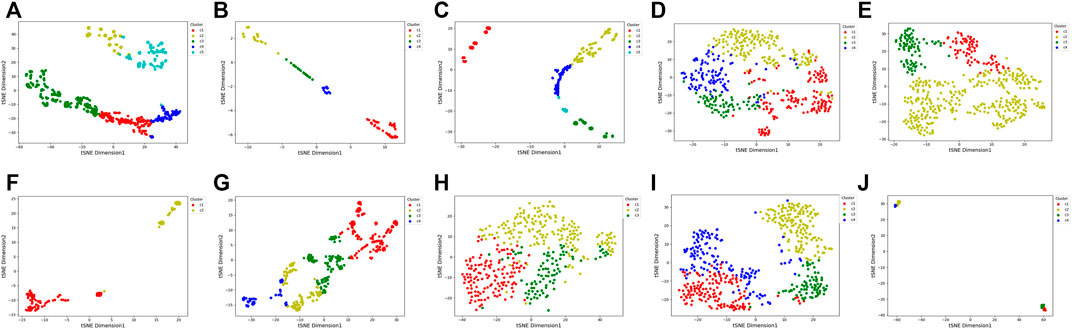
FIGURE 5. t-SNE visualization of the final integrated features by SADLN on ten cancer datasets. (A) BRCA, (B) BLCA, (C) GBM, (D) KIRC, (E) LUAD, (F) PAAD, (G) SKCM, (H) STAD, (I) UCEC, (J) UVM.
In this section, BRCA data is used to analyze the cancer subtypes obtained by the proposed method SADLN. Firstly, we analyzed the overlaps of the identified subtype clusters with the PAM50 cancer subtypes (Parker et al., 2009). There are five PAM50 cancer subtypes (Normal, LumA, LumB, Basal, and Her2), among 1,031 BRCA samples, only 803 samples have PAM50 subtypes including 128 Basal, 66 Her2, 405 LumA, 182 LumB, and 22 Normal. Table 8 shows the results of the overlap. From Table 8, we can see that, cluster C3 is enriched with LumA, of the 252 samples, 223 samples (88.49%) are LumA. Cluster C2 is enriched with LumA and LumB, of the 170 samples, 109 samples (64.12%) are LumA and 54 samples (31.76%) are LumB. Cluster C4 is enriched with LumB and LumA, of the 101 samples, 61 samples (60.40%) are LumB and 30 samples (29.70%) are LumA. Her2 and Basal samples are centrally distributed in clusters C1 and C5.
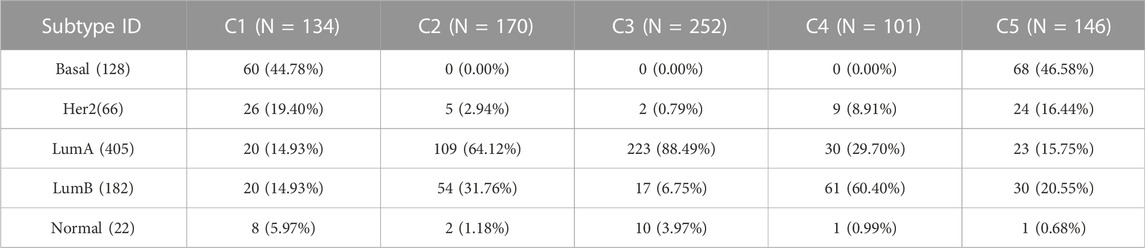
TABLE 8. The overlaps of the identified subtype clusters with PAM50 subtypes in BRCA cancer datasets.
In order to illustrate the difference between the identified subtype clusters of SADLN, we also analyzed the mutation profiles of BRCA using mutation data (the mutation data can be found at https://portal.gdc.cancer.gov). Among 1,031 samples in BRCA datasets, 820 samples have the mutation data. Figure 6 gives the 20 significantly mutated genes of the identified subtype clusters. From Figure 6, we can see that, clusters C2 and C3 have a significant difference in the frequency of PIK3CA and CDH1 genes, although clusters C2 and C3 are all dominated by LumA subtype. The C1 and C5 clusters have a high frequency of TP53 gene mutations, this also explains why clusters C1 and C5 are dominated by Basal and Her2 subtypes.
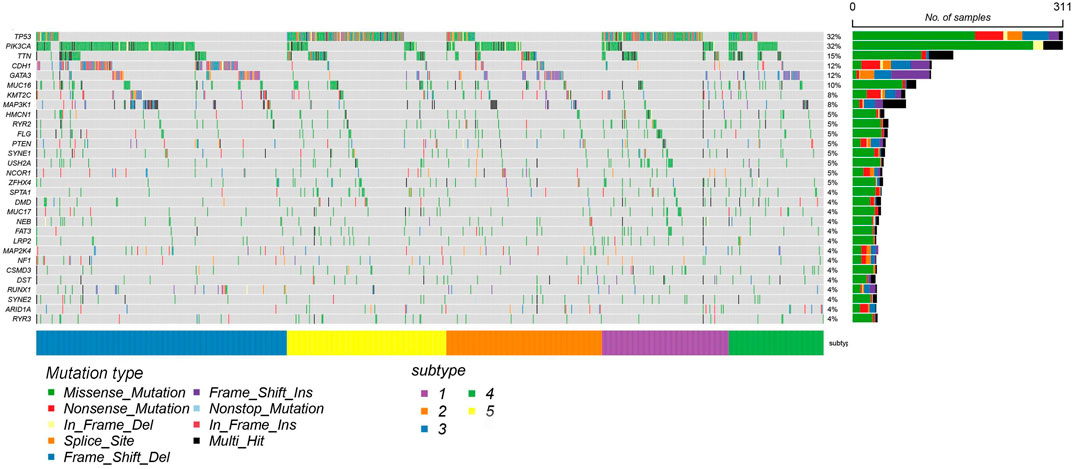
FIGURE 6. The mutation profiles of BRCA datasets with 20 significantly mutated genes using mRNA expression data.
To illustrate the difference between clusters C1 and C5, we used RF method to analyzed the differential genes using mRNA expression data. Figure 7 gives the result.
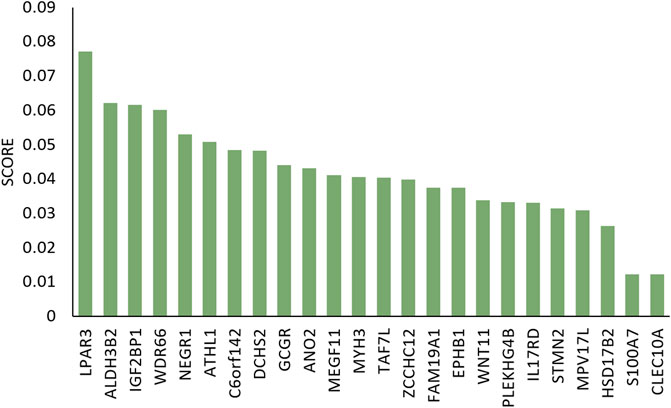
FIGURE 7. Gini importance scores of differential genes in C1 and C5 clusters.
Among these differential expression data, study has shown that the expression of ALDH3B2 was higher in SK-BR-3 cells compared with in other subtypes of breast cell lines, as determined by reverse transcription-polymerase chain reaction and western blot analysis. In addition, the expression levels of ALDH3B2 were higher in Her2 positive breast cancer compared with in other subtypes of breast cancer, as determined by immunohistochemistry, which may be used as a prognostic indicator for breast cancer (Feng et al., 2019). The expression level of CLEC10A to be positively associated with the level of different tumor-infiltrating immune cells in BRCA including CD8 T cells, B cells, macrophages, and NK cells. These results suggest that the relationship between lower CLEC10A expression level and poor prognosis in BRCA may be due to the role of CLEC10A in the tumor immune microenvironment (Tang et al., 2022).
To identify the key biomarkers that determine the subtyping results in each cancer, we ranked the importance of mRNA features of each cancer dataset using the clustering labels of SADLN and RF method to achieve the five most essential biomarkers. For each cancer, Table 9 gives the five biomarkers most relevant to ten cancers.
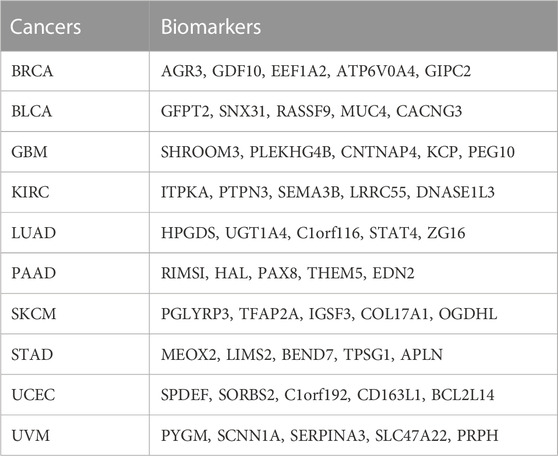
TABLE 9. The five biomarkers most relevant to ten cancers.
For BRCA as an example, the five key biomarkers are AGR3, GDF10, EEF1A2, ATP6V0A4, and GIPC2. By literature review, we found that the AGR3 gene (de Moraes et al., 2022) affects the prognosis of luminal breast cancer patients. EEF1A2 gene (Hassan et al., 2020) and the GDF10 (Zhou et al., 2019) gene have influenced the prognosis of triple-negative breast cancer patients. The study has shown that the expression of the ATP6V0A4 gene (Savci-Heijink et al., 2019) is a signature of visceral organ metastasis in breast cancer. Although the GIPC2 gene (Dong et al., 2021) has not been found in BRCA but has been shown that it acts on the pathogenesis and development of a pheochromocytoma. All these literature reviews demonstrated the results of SADLN on the BRCA dataset are reliable.
Recently, integrating multi-omics data for cancer subtyping is an important task in bioinformatics. In this paper, we proposed SADLN, a novel deep learning based integrated method for cancer subtyping. The method firstly introduced self-attention into the encoder-decoder based network architecture. It attempted to describe complex and diverse multi-omics data accurately and adaptively build the samples’ relationship when learning a shared low-dimensional representation during molecular subtyping. Compared with three deep learning and seven non-deep learning based integration algorithms, SADLN has two characteristics: 1) Unlike the early integration methods such as AE and VAE, SADLN characterizes multi-omics data respectively which enables the model to effectively describe different omics data with distinct distributions, meanwhile, the output integrating representation fits the prior distribution. 2) The self-attention module in SADLN taking full use of the sample’s multi-omics information, can automatically learn the weight matrix between samples and make the results of feature integration more convincing.
We demonstrated the power of SADLN using ten datasets of TCGA. The experiments of survival analysis and Friedman analysis show that SADLN has a good clustering consequence. Meanwhile, the experiments of SADLN and SADLN-single show that integrating multiple omics data is a necessity and useful. The BRCA results indicated that SADLN can efficiently distinguish cancer subtypes.
SADLN found 50 biomarkers for all cancers. Some biomarkers have been verified in previous studies. In clinical research, researchers can conduct more subtype analysis studies on related cancers based on the biomarkers obtained by SADLN. For example, SADLN believes that MEOX2 is an important biomarker of STAD. The study (Wang et al., 2021) has shown that MEOX2 is a novel biomarker associated with macrophage infiltration in digestive system cancer.
Although SADLN has enhanced the performance of cancer subtyping recognition, it also has limitations. Firstly, it is unsuited to integrate binary data. Secondly, it could not find the genes modules that affect each subtype. Thirdly, the relationship between omics data was not considered. For the next research, we will continue our efforts to develop an attention based method to simultaneously learn the relationship between multi-omic and samples to explore cancer heterogeneity.
In this paper, we proposed Self-Attention Based Deep Learning Network (SADLN) for integrating multi-omics data for cancer subtype recognition. The novel method is based on recent advances in deep learning and self-attention. It can jointly learn different multi-omic data representations and relations between samples. In comparison to the state-of-the-art methods, experiments on ten datasets of TCGA have demonstrated the effectiveness of SADLN.
The original contributions presented in the study are included in the article/supplementary material, further inquiries can be directed to the corresponding author.
Ethical review and approval was not required for the study on human participants in accordance with the local legislation and institutional requirements. Written informed consent for participation was not required for this study in accordance with the national legislation and the institutional requirements.
PG conceived the project. QS and LC designed and implemented the algorithms and models. QS, LC, SG, and AM analyzed and interpreted the data. PG, QS, and LC drafted the manuscript. JC and LZ participated in study analysis. All authors approved the final article.
This work was supported in part by the Natural Science Foundation of China (No. 82001987), and in part by the Xuzhou Key Research and Development Program Project (No. KC20148).
The authors declare that the research was conducted in the absence of any commercial or financial relationships that could be construed as a potential conflict of interest.
All claims expressed in this article are solely those of the authors and do not necessarily represent those of their affiliated organizations, or those of the publisher, the editors and the reviewers. Any product that may be evaluated in this article, or claim that may be made by its manufacturer, is not guaranteed or endorsed by the publisher.
Adossa, N., Khan, S., Rytkönen, K., and Elo, L. (2021). Computational strategies for single-cell multi-omics integration. Comput. Struct. Biotechnol. J. 19, 2588–2596. doi:10.1016/j.csbj.2021.04.060
Akbani, R., Akdemir, K. C., Aksoy, B. A., Albert, M., Ally, A., Amin, S. B., et al. (2015). Genomic classification of cutaneous melanoma. Cell 161, 1681–1696. doi:10.1016/j.cell.2015.05.044
Badrinarayanan, V., Kendall, A., and Cipolla, R. (2017). Segnet: A deep convolutional encoder-decoder architecture for image segmentation. IEEE Trans. Pattern Analysis Mach. Intell. 39, 2481–2495. doi:10.1109/TPAMI.2016.2644615
Berger, A. C., Korkut, A., Kanchi, R. S., Hegde, A. M., Lenoir, W., Liu, W., et al. (2018). A comprehensive pan-cancer molecular study of gynecologic and breast cancers. Cancer Cell 33, 690–705. doi:10.1016/j.ccell.2018.03.014
Bray, F., Ferlay, J., Soerjomataram, I., Siegel, R., Torre, L. A., and Jemal, A. (2018). Global cancer statistics 2018: Globocan estimates of incidence and mortality worldwide for 36 cancers in 185 countries. CA A Cancer J. Clin. 68, 394–424. doi:10.3322/caac.21492
Chai, H., Zhou, X., Zhang, Z., Rao, J., and Yang, Y. (2021). Integrating multi-omics data through deep learning for accurate cancer prognosis prediction. Comput. Biol. Med. 134, 104481. doi:10.1016/j.compbiomed.2021.104481
Chen, C., Zha, Y., Zhu, D., Ning, K., and Cui, X. (2021). Hydrogen bonds meet self-attention: All you need for general-purpose protein structure embedding. bioRxiv
de Moraes, C. L., e Melo, N. C., Valoyes, M. A. V., and do Amaral, W. N. (2022). Agr2 and agr3 play an important role in the clinical characterization and prognosis of basal like breast cancer. Clin. Breast Cancer 22, 1–17. doi:10.1016/j.clbc.2021.07.008
Dong, Y., Huang, Y., Fan, C., Wang, L., Zhang, R., Li, W., et al. (2021). Gipc2 is an endocrine-specific tumor suppressor gene for both sporadic and hereditary tumors of ret-and sdhb-but not vhl-associated clusters of pheochromocytoma/paraganglioma. Cell death Dis. 12, 1–17. doi:10.1038/s41419-021-03731-7
Feng, L., Huang, S., An, G., Wang, G., Gu, S., and Zhao, X. (2019). Identification of new cancer stem cell markers and signaling pathways in her-2-positive breast cancer by transcriptome sequencing. Int. J. Oncol. 55, 1003–1018. doi:10.3892/ijo.2019.4876
Friedman, M. (1937). The use of ranks to avoid the assumption of normality implicit in the analysis of variance. J. Am. Stat. Assoc. 32, 675–701. doi:10.1080/01621459.1937.10503522
Gao, H., Li, Y., Wang, X., Han, J., and Li, R. (2019). “Ensemble attention for text recognition in natural images,” in 2019 International Joint Conference on Neural Networks (IJCNN), Budapest, Hungary, July 14-19, 2019.
Gu, L., Zhang, X., Li, K., and Jia, G. (2020). “Using molecular fingerprints and unsupervised learning algorithms to find simulants of chemical warfare agents,” in The 2020 International Seminar on Artificial Intelligence, Networking and Information Technology, Shanghai, China, 18-20 September 2020.
Guo, Y., Shang, X., and Li, Z. (2019). Identification of cancer subtypes by integrating multiple types of transcriptomics data with deep learning in breast cancer. Neurocomputing 324, 20–30. doi:10.1016/j.neucom.2018.03.072
Hong Zhao, W., Luo, J., and Jiao, S. (2014). Comprehensive characterization of cancer subtype associated long non-coding rnas and their clinical implications. Sci. Rep. 4, 6591. doi:10.1038/srep06591
Hasin, Y., Seldin, M. M., and Lusis, A. J. (2017). Multi-omics approaches to disease. Genome Biol. 18, 83. doi:10.1186/s13059-017-1215-1
Hassan, M. K., Kumar, D., Patel, S. A., and Dixit, M. (2020). Eef1a2 triggers stronger erk mediated metastatic program in er negative breast cancer cells than in er positive cells. Life Sci. 262, 118553. doi:10.1016/j.lfs.2020.118553
Hawkins, R., Hon, G. C., and Ren, B. (2010). Next-generation genomics: An integrative approach. Nat. Rev. Genet. 11, 476–486. doi:10.1038/nrg2795
Hoadley, K. A., Yau, C., Hinoue, T., Wolf, D. M., Lazar, A. J., Drill, E., et al. (2018). Cell-of-origin patterns dominate the molecular classification of 10, 000 tumors from 33 types of cancer. Cell 173, 291–304. doi:10.1016/j.cell.2018.03.022
Hou, Y., Ma, Z., Liu, C., and Loy, C. C. (2019). “Learning lightweight lane detection cnns by self attention distillation,” in 2019 IEEE/CVF International Conference on Computer Vision (ICCV), Seoul, Korea, Oct. 27 2019 to Nov. 2 2019.
Kristensen, V. N., Lingjærde, O. C., Russnes, H. G., Vollan, H. K. M., Frigessi, A., and Børresen-Dale, A.-L. (2014). Principles and methods of integrative genomic analyses in cancer. Nat. Rev. Cancer 14, 299–313. doi:10.1038/nrc3721
Le, K., Quan, T. T., Bui, T. H., and Petrucci, L. (2016). “Coca: Congestion-oriented clustering algorithm for wireless sensor networks,” in 2016 8th IEEE International Conference on Communication Software and Networks (ICCSN), Beijing, China, June 4-6, 2016, 450–454.
Levine, D. A., Kandoth, C., Schultz, N., Cherniack, A. D., Akbani, R., Liu, Y., et al. (2013). Integrated genomic characterization of endometrial carcinoma. Nature 497, 67–73. doi:10.1038/nature12113
Li, L., and Wang, X. (2021). Identification of gastric cancer subtypes based on pathway clustering. NPJ Precis. Oncol. 5, 46–17. doi:10.1038/s41698-021-00186-z
Li, M., Wang, Y., Wang, Z., and Zheng, H. (2020a). A deep learning method based on an attention mechanism for wireless network traffic prediction. Ad Hoc Netw. 107, 102258. doi:10.1016/j.adhoc.2020.102258
Li, Y., Long, G., Shen, T., Zhou, T., Yao, L., Huo, H., et al. (2020b). Self-attention enhanced selective gate with entity-aware embedding for distantly supervised relation extraction. ArXiv abs/1911.11899
Liu, C., Zhang, L., Niu, J., Yao, R., and Wu, C. (2020). Intelligent prognostics of machining tools based on adaptive variational mode decomposition and deep learning method with attention mechanism. Neurocomputing 417, 239–254. doi:10.1016/j.neucom.2020.06.116
Luo, L., Yang, Z., Yang, P., Zhang, Y., Wang, L., Lin, H., et al. (2018). An attention-based bilstm-crf approach to document-level chemical named entity recognition. Bioinformatics 34, 1381–1388. doi:10.1093/bioinformatics/btx761
Mercer, E., and Neufeld, R. (2021). Advances in artificial intelligence and security. Berlin, Germany: Springer Science and Business Media LLC.
Mustafa Abualsaud, M. D. (2019). “Proceedings of the 28th acm international conference on information and knowledge management,” in Proceedings of the 28th ACM International Conference on Information and Knowledge Management, Beijing China, November 3 - 7, 2019.
Nguyen, T., Tagett, R., Diaz, D., and Drăghici, S. (2017). A novel approach for data integration and disease subtyping. Genome Res. 27 (12), 2025–2039. doi:10.1101/gr.215129.116
Parker, J. S., Mullins, M., Cheang, M. C., Leung, S., Voduc, D., Vickery, T., et al. (2009). Supervised risk predictor of breast cancer based on intrinsic subtypes. J. Clin. Oncol. 27, 1160–1167. doi:10.1200/JCO.2008.18.1370
Parodi, S., Filiberti, R. A., Marroni, P., Libener, R., Ivaldi, G., Mussap, M., et al. (2015). Differential diagnosis of pleural mesothelioma using logic learning machine. BMC Bioinforma. 16, S3. S3 – S3. doi:10.1186/1471-2105-16-S9-S3
Peng, J., Li, J., and Shang, X. (2020). A learning-based method for drug-target interaction prediction based on feature representation learning and deep neural network. BMC Bioinforma. 21, 394. doi:10.1186/s12859-020-03677-1
Picard, M., Scott-Boyer, M.-P., Bodein, A., Périn, O., and Droit, A. (2021). Integration strategies of multi-omics data for machine learning analysis. Comput. Struct. Biotechnol. J. 19, 3735–3746. doi:10.1016/j.csbj.2021.06.030
Poirion, O. B., Chaudhary, K., and Garmire, L. (2018). Deep learning data integration for better risk stratification models of bladder cancer. AMIA Summits Transl. Sci. Proc. 2018, 197206.
Raphael, B. J., Hruban, R. H., Aguirre, A. J., Moffitt, R. A., Yeh, J. J., Stewart, C., et al. (2017). Integrated genomic characterization of pancreatic ductal adenocarcinoma. Cancer Cell 32, 185–203. doi:10.1016/j.ccell.2017.07.007
Rappoport, N., and Shamir, R. (2018). Multi-omic and multi-view clustering algorithms: Review and cancer benchmark. Nucleic Acids Res. 46, 10546–10562. doi:10.1093/nar/gky889
Rappoport, N., and Shamir, R. (2019). Nemo: Cancer subtyping by integration of partial multi-omic data. Bioinformatics 35, 3348–3356. doi:10.1093/bioinformatics/btz058
Robertson, A. G., Kim, J., Al-Ahmadie, H., Bellmunt, J., Guo, G., Cherniack, A. D., et al. (2017a). Comprehensive molecular characterization of muscle-invasive bladder cancer. Cell 171, 540–556. doi:10.1016/j.cell.2017.09.007
Robertson, A. G., Shih, J., Yau, C., Gibb, E. A., Oba, J., Mungall, K. L., et al. (2017b). Integrative analysis identifies four molecular and clinical subsets in uveal melanoma. Cancer Cell 32, 204–220.e15. doi:10.1016/j.ccell.2017.07.003
Rainer and Muche (2001). “Applied survival analysis: Regression modeling of time to event data,” in lemeshow. Editor Dw hosmer (new york: John wiley).
Savci-Heijink, C., Halfwerk, H., Koster, J., Horlings, H., and Van De Vijver, M. (2019). A specific gene expression signature for visceral organ metastasis in breast cancer. BMC cancer 19, 333–338. doi:10.1186/s12885-019-5554-z
Sayáns, M. P., Petronacci, C. C. C., Pouso, A. L. L., Iruegas, E. P., Carrión, A. B., Peñaranda, J. M. S., et al. (2019). Comprehensive genomic review of tcga head and neck squamous cell carcinomas (hnscc). J. Clin. Med. 8, 1896. doi:10.3390/jcm8111896
Sharifi-Noghabi, H., Zolotareva, O., Collins, C., and Ester, M. (2019). Moli: Multi-omics late integration with deep neural networks for drug response prediction. bioRxiv
Shaw, P., Uszkoreit, J., and Vaswani, A. (2018). Self-attention with relative position representations. arXiv preprint arXiv:1803.02155
Shen, R., Olshen, A. B., and Ladanyi, M. (2009). Integrative clustering of multiple genomic data types using a joint latent variable model with application to breast and lung cancer subtype analysis. Bioinformatics 25 22, 2906–2912. doi:10.1093/bioinformatics/btp543
Siegel, R., Miller, K., and Jemal, A. (2020). Cancer statistics, 2020. CA A Cancer J. Clin. 70, 7–30. doi:10.3322/caac.21590
Simidjievski, N., Bodnar, C., Tariq, I., Scherer, P., Andrés-Terré, H., Shams, Z., et al. (2019). Variational autoencoders for cancer data integration: Design principles and computational practice. bioRxiv 10, 1205. doi:10.3389/fgene.2019.01205
Song, H., Ruan, C., Xu, Y., Xu, T., Fan, R., Jiang, T., et al. (2021). Survival stratification for colorectal cancer via multi-omics integration using an autoencoder-based model. Exp. Biol. Med. 247, 898–909. doi:10.1177/15353702211065010
Song, M., Greenbaum, J., Luttrell, J., Zhou, W., Wu, C., Shen, H., et al. (2020). A review of integrative imputation for multi-omics datasets. Front. Genet. 11, 570255. doi:10.3389/fgene.2020.570255
Tang, S., Zhang, Y., Lin, X., Wang, H., Yong, L., Zhang, H., et al. (2022). Clec10a can serve as a potential therapeutic target and its level correlates with immune infiltration in breast cancer. Oncol. Lett. 24, 285–311. doi:10.3892/ol.2022.13405
The Cancer Genome Atlas Research Network (2013). Comprehensive molecular characterization of clear cell renal cell carcinoma. Nature 499, 43–49. doi:10.1038/nature12222
The Cancer Genome Atlas Research Network (2014). Comprehensive molecular profiling of lung adenocarcinoma. Nature 511, 543–550. doi:10.1038/nature13385
Tong, L., Mitchel, J., Chatlin, K., and Wang, M. D. (2020). Deep learning based feature-level integration of multi-omics data for breast cancer patients survival analysis. BMC Med. Inf. Decis. Mak. 20, 225. doi:10.1186/s12911-020-01225-8
Verhaak, R. G., Hoadley, K. A., Purdom, E., Wang, V., Qi, Y., Wilkerson, M. D., et al. (2010). Integrated genomic analysis identifies clinically relevant subtypes of glioblastoma characterized by abnormalities in pdgfra, idh1, egfr, and nf1. Cancer Cell 17, 98–110. doi:10.1016/j.ccr.2009.12.020
Wang, B., Mezlini, A. M., Demir, F., Fiume, M., Tu, Z., Brudno, M., et al. (2014). Similarity network fusion for aggregating data types on a genomic scale. Nat. Methods 11, 333–337. doi:10.1038/nmeth.2810
Wang, T., Shao, W., Huang, Z., Tang, H., Zhang, J., Ding, Z., et al. (2020). Moronet: Multi-omics integration via graph convolutional networks for biomedical data classification. bioRxiv.
Wang, Z., Yang, H., Zhang, R., Luo, B., Xu, B., Zhu, Z., et al. (2021). Meox2 serves as a novel biomarker associated with macrophage infiltration in oesophageal squamous cell carcinoma and other digestive system carcinomas. Autoimmunity 54, 373–383. doi:10.1080/08916934.2021.1919880
Witten, D. M., and Tibshirani, R. (2009). Extensions of sparse canonical correlation analysis with applications to genomic data. Stat. Appl. Genet. Mol. Biol. 8, 28–27. doi:10.2202/1544-6115.1470
Xu, J., Wu, P., Chen, Y., Meng, Q., Dawood, H., and Dawood, H. (2019). A hierarchical integration deep flexible neural forest framework for cancer subtype classification by integrating multi-omics data. BMC Bioinforma. 20, 527. doi:10.1186/s12859-019-3116-7
Xu, J., Xiang, L., Liu, Q., Gilmore, H., Wu, J., Tang, J., et al. (2016). Stacked sparse autoencoder (ssae) for nuclei detection on breast cancer histopathology images. IEEE Trans. Med. Imaging 35, 119–130. doi:10.1109/TMI.2015.2458702
Yang, H., Chen, R., Li, D., and Wang, Z. (2021a). Subtype-gan: A deep learning approach for integrative cancer subtyping of multi-omics data. Bioinformatics 37, 2231–2237. doi:10.1093/bioinformatics/btab109
Yang, H., Wang, M., Liu, X., Zhao, X., and Li, A. (2021b). Phosidn: An integrated deep neural network for improving protein phosphorylation site prediction by combining sequence and protein–protein interaction information. Bioinformatics 37, 4668–4676. doi:10.1093/bioinformatics/btab551
Yu, H., Li, J., Zhang, L., Cao, Y., Yu, X., and Sun, J. (2021). Design of lung nodules segmentation and recognition algorithm based on deep learning. BMC Bioinforma. 22, 314. doi:10.1186/s12859-021-04234-0
Yuan, S., Zhang, Y., Tang, J., Shen, H., and Wei, X. (2018). Modeling and predicting popularity dynamics via deep learning attention mechanism. ArXiv abs/1811.02117
Zeng, Z., Mao, C., Vo, A. H., Li, X., Nugent, J. O., Khan, S. A., et al. (2021). Deep learning for cancer type classification and driver gene identification. BMC Bioinforma. 22, 491. doi:10.1186/s12859-021-04400-4
Zhang, L., Yang, X., Li, S., Liao, T., and Pan, G. (2022). Answering medical questions in Chinese using automatically mined knowledge and deep neural networks: An end-to-end solution. BMC Bioinforma. 23, 136. doi:10.1186/s12859-022-04658-2
Zhang, Z., Wu, S., Chen, G., and Jiang, D. (2020). Self-attention and dynamic convolution hybrid model for neural machine translation. IEEE Int. Conf. Knowl. Graph (ICKG) 2020, 352–359. doi:10.1109/ICBK50248.2020.00057
Keywords: self-attention, deep learning, multi-omics data, Gaussian mixture model, cancer subtype recognition
Citation: Sun Q, Cheng L, Meng A, Ge S, Chen J, Zhang L and Gong P (2023) SADLN: Self-attention based deep learning network of integrating multi-omics data for cancer subtype recognition. Front. Genet. 13:1032768. doi: 10.3389/fgene.2022.1032768
Received: 31 August 2022; Accepted: 15 December 2022;
Published: 04 January 2023.
Edited by:
Dominik Heider, University of Marburg, GermanyReviewed by:
Markus List, Technical University of Munich, GermanyCopyright © 2023 Sun, Cheng, Meng, Ge, Chen, Zhang and Gong. This is an open-access article distributed under the terms of the Creative Commons Attribution License (CC BY). The use, distribution or reproduction in other forums is permitted, provided the original author(s) and the copyright owner(s) are credited and that the original publication in this journal is cited, in accordance with accepted academic practice. No use, distribution or reproduction is permitted which does not comply with these terms.
*Correspondence: Ping Gong, Z29uZ3BpbmdAeHpobXUuZWR1LmNu
†These authors have contributed equally to this work
Disclaimer: All claims expressed in this article are solely those of the authors and do not necessarily represent those of their affiliated organizations, or those of the publisher, the editors and the reviewers. Any product that may be evaluated in this article or claim that may be made by its manufacturer is not guaranteed or endorsed by the publisher.
Research integrity at Frontiers
Learn more about the work of our research integrity team to safeguard the quality of each article we publish.