 Yi Zhang
 Yu Wang1,2*
 Min Chen
- 1Guilin University of Technology, Guilin, China
- 2Guangxi Key Laboratory of Embedded Technology and Intelligent System, Guilin University of Technology, Guilin, China
- 3School of Computer Science and Technology, Hunan Institute of Technology, Hengyang, China
Computable models as a fundamental candidate for traditional biological experiments have been applied in inferring lncRNA–disease association (LDA) for many years, without time-consuming and laborious limitations. However, sparsity inherently existing in known heterogeneous bio-data is an obstacle to computable models to improve prediction accuracy further. Therefore, a new computational model composed of multiple mechanisms for lncRNA–disease association (MM-LDA) prediction was proposed, based on the fusion of the graph attention network (GAT) and inductive matrix completion (IMC). MM-LDA has two key steps to improve prediction accuracy: first, a multiple-operator aggregation was designed in the n-heads attention mechanism of the GAT. With this step, features of lncRNA nodes and disease nodes were enhanced. Second, IMC was introduced into the enhanced node features obtained in the first step, and then the LDA network was reconstructed to solve the cold start problem when data deficiency of the entire row or column happened in a known association matrix. Our MM-LDA achieved the following progress: first, using the Adam optimizer that adaptively adjusted the model learning rate could increase the convergent speed and not fall into local optima as well. Second, more excellent predictive ability was achieved against other similar models (with an AUC value of 0.9395 and an AUPR value of 0.8057 obtained from 5-fold cross-validation). Third, a 6.45% lower time cost was consumed against the advanced model GAMCLDA. In short, our MM-LDA achieved a more comprehensive prediction performance in terms of prediction accuracy and time cost.
Introduction
Long non-coding RNA, named for its transcription length of over 200 nucleotides, has received extensive attention from biological researchers (Sun et al., 2018). With the in-depth development of biomedicine, many literatures have confirmed that lncRNA plays an important role in the activities of living organisms through dose compensation effect, genetic expression, cell differentiation, and other ways and gradually becomes the focus of bioinformatics. Studies have shown that abnormal lncRNA expression can lead to a variety of complex diseases, especially as both oncogenes and tumor suppressors in the tumorigenesis of diverse cancers (Chen et al., 2020). The exploration of lncRNA leading to disease is helpful in understanding the mechanism of disease generation and provides reference for disease treatment and prognosis (Xia et al., 2013). Therefore, the work on predicting lncRNA–disease associations is significant for human disease diagnostics and prognostics and will improve the development of drug discovery (Chen et al., 2020).
As biological experiments are time-consuming and laborious, numerous computational models are mostly used to replace biological experiments in real life to identify disease-related associations and provide efficient and more accurate candidates for biological experiments in recent years (Chen et al., 2019; Wang et al., 2021; Huang et al., 2022a; Huang et al., 2022b; Huang et al., 2022c). Currently, computational models for predicting lncRNA–disease associations (LDAs) commonly fall into three categories.
The first category of methods is based on constructing biological similarity networks. Label propagation algorithms are used commonly in association-related prediction (Yin et al., 2020), especially as restart random walk and KATZ, whose main difference is applied in different underlying networks. Sun et al, (2014) and Chen et al, (2016) established the global restart random walk algorithm by using the lncRNA functional similarity network so as to predict potential association information. However, these models could not work on isolated diseases (diseases without known association information) or new lncRNAs (lncRNAs without known association information). Based on the gene–disease association and lncRNA–disease similarity network, Ma et al, (2019) introduced the HeteSim algorithm to construct a gene–disease heterogeneous information network, with which the network structure was strengthened by increasing the number of edges in the network. Potential associations can be propagated with more information and with better prediction effects. Chen, 2015; Chen et al, (2019) combined known LDA, lncRNA expression profile information, lncRNA functional similarity, disease semantic similarity, and Gaussian interaction spectrum kernel similarity to establish association prediction models. Although these models could work on isolated diseases or new lncRNAs, the prediction accuracy is still not high enough.
The second category of methods utilizes machine learning with a classifier to identify pathogenic lncRNAs. Chen and Yan, (2013) used lncRNA expression profile information to develop a classic and significant calculation model LRLSLDA for inferring potential lncRNA–disease pair information. This model is the first to use Laplacian regularized least squares in a semi-supervised learning framework, and it could work on new lncRNAs and isolated diseases without needing negative samples. However, its selection of optimal parameters is complicated because of its disease space and lncRNA space belonging to two classifiers. Later, Chen et al, (2015) developed an improved correlation prediction model LNCSIM to further improve the prediction accuracy. However, with its prediction results biased toward those lncRNAs with more known associations, the prediction effect is not good enough for isolated diseases and new lncRNAs with less known information. In addition, selecting attenuation factors of semantic contribution has not been well-solved. Zhao et al, (2015) predicted potentially pathogenic lncRNA by integrating known disease-related lncRNA and a variety of biological data (genomic data, regulatory, and transcriptional biological data) based on the Bayesian algorithm. Although the prediction performance of this model is good, sufficient negative samples of the Bayesian classifier are required to improve the prediction performance.
The third category of methods is based on disease-related genes, for example, mRNA, miRNA, and protein information. Models belonging to the aforementioned two categories all rely on the known LDA, whose number with experimental verification is relatively small. Therefore, researchers have to explore new ideas to infer the potential associations with using third-party data, also known as genetic information. Zhou et al, (2015) selected appropriate thresholds and coefficients to predict lncRNA–disease pairs, using the expression data of three kinds of non-coding RNAs (mRNA, miRNA, and lncRNA). Cheng et al, (2016) introduced mRNA- and miRNA-related data into the prediction of LDA. Compared with other methods, methods within this category are more reliable and stable, but the model performance is highly dependent on coactions found among the three kinds of non-coding RNAs.
Utilizing deep learning technology has gradually become a research hotspot to make up for the deficiencies in the abovementioned three categories. The graph that can abstract the relationship between entities is widely used as a data structure (Wu et al., 2020). Wu et al, (2021) proposed a computational method MLGCNET that applied the graph convolutional network (GCN) to extract the node information with which to feed into an extra tree (ET) classifier for accurately predicting the potential lncRNA–disease associations. The graph attention network (GAT), as a promising graph neural network, has been applied to a number of bioinformatics tasks. Long et al, (2021) proposed a new method GATMDA based on the GAT to identify a microbial–disease association. Bian et al, (2021) proposed a model GATCDA to predict circRNA–disease associations based on the GAT. Gu et al, (2021) predicted drug ADMET classification based on the GAT. However, this model did not discuss the time complexity consumed for achieving high accuracy. Inductive matrix completion (IMC) that could fill data sparsity existing in the bio-database inherently caused the problem of low prediction accuracy when it was applied in inferring LDA directly and separately (Natarajan and Dhillon, 2014; Huang et al., 2017; Chen et al., 2018; Lu et al., 2018; Fraidouni and Zaruba, 2019; Chen et al., 2021). Therefore, to break through the aforementioned limitations, multiple mechanisms were fused into a new computational model, such as MM-LDA, as shown in Figure 1. On one hand, a multiple-operator aggregation used in the n-heads attention mechanism of the GAT was designed, where it could enhance the features of lncRNA nodes (or disease nodes) to avoid the low prediction accuracy caused by known-data sparsity. On the other hand, with enhanced node features, the LDA network was rebuilt by IMC that could renew the missing elements in the bio-database. In the end, the Adam optimizer was used to further improve the prediction accuracy.
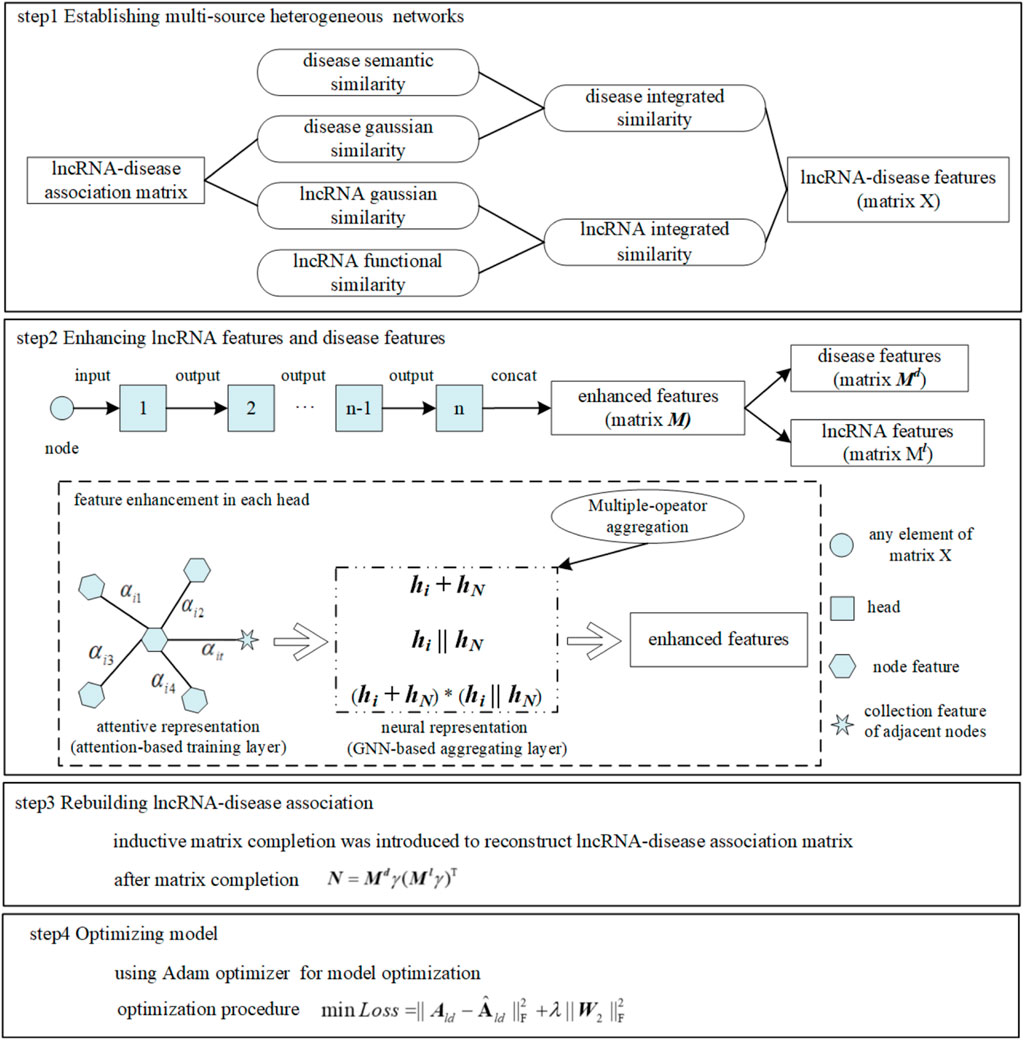
FIGURE 1. MM-LDA workflow.
Materials and methods
Data source
Known lncRNA–disease association: After removing repeated and redundant lncRNAs (diseases) in the original dataset lncRNA disease V2.0 (Bao et al., 2019), a processed dataset composed of associations between human diseases and lncRNAs was used in our model. This dataset contains 352 LDAs verified experimentally, involving 156 lncRNAs and 190 diseases. It is an unbalanced dataset with existing inherent data sparsity because of less known associations against unknown or non-existent associations.
For formal description later, the number of lncRNAs and diseases involved in this dataset (also called association matrix) was denoted by
Multi-source heterogeneous networks
Disease–disease semantic similarity network: Directed acyclic graph (DAG) was utilized to calculate the semantic similarity between diseases (Wang et al., 2010). The semantic contribution value of any disease
where
If two diseases have more overlaps in DAG, it implies greater similarity between them (Wang et al., 2010). Matrix
where
LncRNA–lncRNA functional similarity network: Functionally similar lncRNAs are often associated with diseases in similar phenotypes (Wang et al., 2010). To calculate the functional similarity between two lncRNAs, the semantic similarity of diseases and its correlation to lncRNAs were utilized. Set
Matrix
where set
Gaussian interaction spectrum kernel similarity network: As an efficient and useful method in biological information classification, the Gaussian kernel function (Van Laarhoven et al., 2011) has been applied to the association network when some diseases do not have semantic similarity. Gaussian interaction spectrum kernel similarity of diseases (Gaussian similarity) calculated by the Gaussian kernel function could replace the semantic similarity of disease. If disease
where
Similarly, matrix
Integrated similarity network: Since not all diseases involved could calculate the semantic similarity due to the inherent sparsity in the dataset, an integrated similarity network
Similarly, matrix
Finally, a multi-source heterogeneous network as a diagonal matrix was constructed, preparing for the following calculation in the model:
Node feature enhancement
N-heads attention with multiple-operator aggregation: The original GAT utilizes attention scores to adaptively aggregate information from neighbor nodes during node updating and learns the representation of nodes on the graph by assigning different weights to its neighbor nodes. N-heads attention could stabilize the process of self-attention, with
Attention-based feature training: Any element in the feature vector matrix
where
In order to make the attention score within the interval of [0,1], the softmax function was used for normalization
where
GNN-based feature aggregation: In order to enhance node features further, based on a nonlinear graph neural network (GNN), a multiple-operator that aggregated the features coming from the attention-based feature training layer was designed:
where
where
LncRNA–disease association reconstruction
Inductive matrix completion: Known LDA was represented as a low-rank matrix in original matrix completion which recovers missing elements only with less sampling data (Chen and Chen, 2017). However, a cold start phenomenon will occur, when the entire row or column of data is missing. IMC technology introduced could fix the cold start problem and improve prediction accuracy because the number of parameters that was learned in IMC only related to the number of features of lncRNAs (or diseases), not the number of lncRNAs (or diseases).
where
Model optimization: Optimization of MM-LDA mainly focused on parameter training by minimizing the loss function. During parameter training, improper selection of learning rates will cause abnormal loss function. A large learning rate will lead to the non-convergence of the loss function. Otherwise, a small learning rate will make the model trap into local optimization. Therefore, the Adam optimizer (Kingma and Ba, 2014) that combined the advantages of an AdaGrad (adaptive gradient) optimizer (Lydia and Francis, 2019) and RMSprop (root mean square propagation) optimizer (Xu et al., 2021) was adopted in our model. Only requiring small memory space, the Adam optimizer with a simple and efficient implementation process could adjust the learning rate adaptively without being affected by gradient scaling, thus speeding up the model optimization speed. The optimization process by minimizing the loss function was formalized as
where
Results
Experimental evaluation
Evaluation metrics: All known LDAs were randomly divided into five groups with which 5-fold cross-validation was carried out to evaluate the predictive performance of our model. Successively selecting one group in five (as negative samples) with a group of unknown lncRNA–disease pairs in the same size (as negative samples) made up the test samples. The remaining four groups in five and the remaining unknown lncRNA–disease pairs were used to train the model. A total of five model evaluation metrics were defined by setting different thresholds, including true positive rate (TPR), false positive rate (FPR), and recall rate. Model performance was measured by an area under the ROC curve (AUC) and an area under the PR curve (AUPR). In order to avoid the influence of grouping randomly, each experiment was repeated 10 times. Finally, an AUC value and AUPR value were calculated according to the average value of the results from the 10 repeated experiments.
Parameter selection: Parameters used in our model could impact the predictive performance in the process of model training. Therefore, this section discussed the selection process of these three parameters in detail.
Number of attention heads: According to the literature (Fraidouni and Zaruba, 2019), the number of heads used in n-heads attention was discussed by setting the weight decay parameter
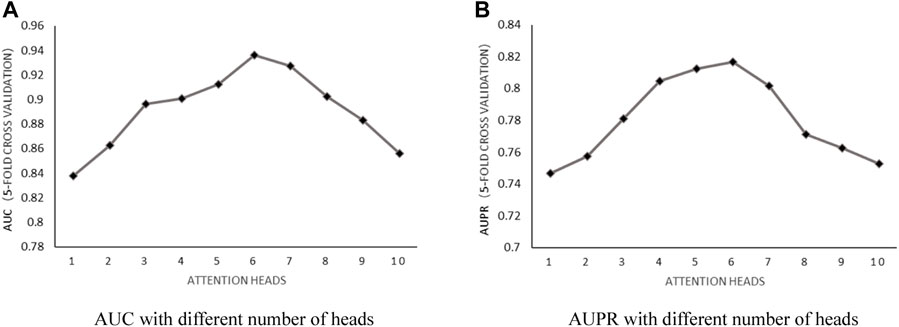
FIGURE 2. (A) AUC with different number of heads. (B) AUPR with different number of heads.
Weight decay parameter: According to the previous training, with the number of heads in a fixed value of 6 and the number of neurons in fixed value of 8, the influence of the weight decay parameter
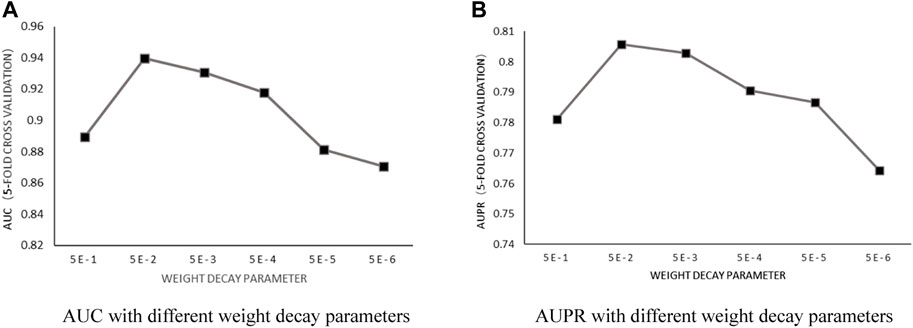
FIGURE 3. (A) AUC with different weight decay parameters. (B) AUPR with different weight decay parameters.
Number of neurons: With the number of heads in a fixed value of 6 and the weight decay parameter in fixed value of 5E-2, the influence of the number of neurons on predictive performance was discussed by choosing the value within the set of [4, 8, 16, 32, 64, and 128]. After implementing 5-fold cross-validation, the results shown in Figure 4 proved that AUC and AUPR obtained the best values when the number of neurons was set to 16.
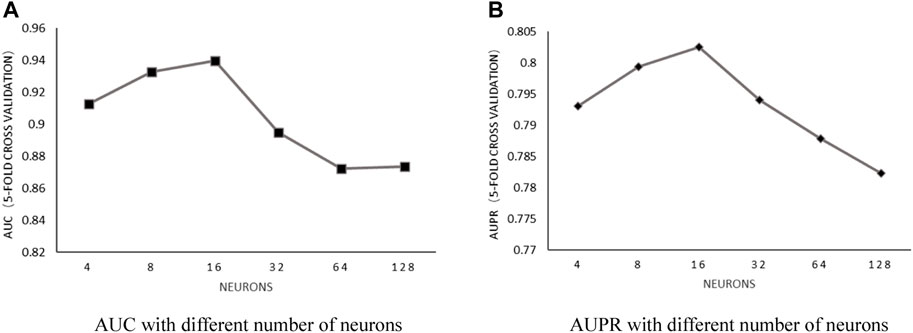
FIGURE 4. (A) AUC with different number of neurons. (B) AUPR with different number of neurons.
Based on the previously mentioned discussion, by setting the number of heads in a fixed value of 6, the weight decay parameter
Ablation experiments: In order to evaluate the role of each kernel part in MM-LDA, such as multiple-operator aggregation in n-heads attention, IMC in lncRNA–disease association reconstruction, three ablation experiments that were used to compare with our MM-LDA were set up:
• GAT-NG: A prediction model was constructed without kernel similarity of the Gaussian interaction spectrum as the kernel part.
• GAT-GIMC: A prediction model was constructed only based on a standard multiple-heads graph attention network.
• GAT-GMC: A prediction model was constructed only based on standard matrix completion.
For each ablation experiment, 5-fold cross-validation was repeated 10 times, and the average values of the results are shown in Figure 5.
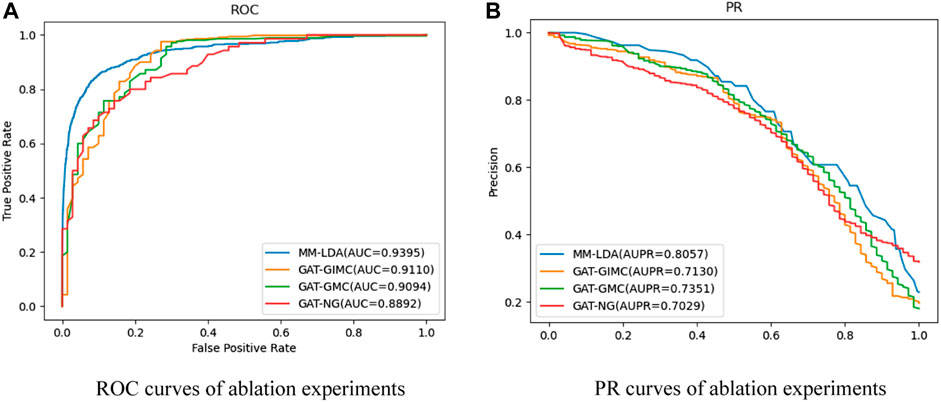
FIGURE 5. (A) ROC curves of ablation experiments. (B) PR curves of ablation experiments.
From the results shown, MM-LDA obtained 5.65%, 3.3%, and 3.1% higher AUC values than GAT-NG, GAT-GMC, and GAT-GIMC, respectively. Furthermore, MM-LDA obtained 14.62%, 9.6%, and 13% higher AUPR values than GAT-NG, GAT-GMC, and GAT-GIMC, respectively. Therefore, it proved that the three kernel parts (integrated Gaussian interaction spectrum kernel similarity, multiple-operator aggregation in n-heads attention, and IMC) of MM-LDA could significantly improve the predictive performance.
Comparison with other models: SDLDA (Zeng et al., 2020b), DMFLDA (Zeng et al., 2020a), and GAMCLDA (Lu et al., 2019), the three computational models based on machine learning and matrix factorization in recent 3 years, were compared with our MM-LDA on the same dataset (
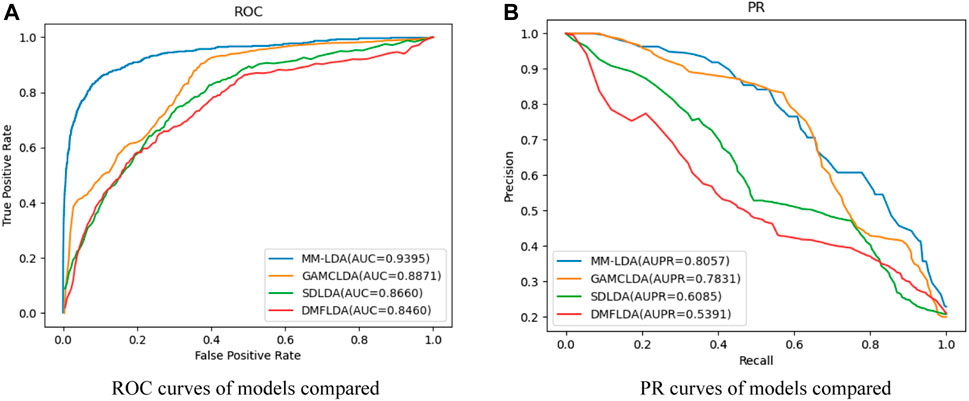
FIGURE 6. (A) ROC curves of models compared. (B) PR curves of models compared.
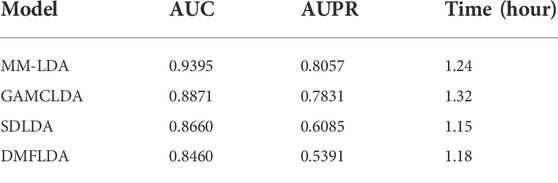
TABLE 1. AUC value (AUPR value) and running time of models compared.
From the results shown, we could easily find that MM-LDA obtained the best AUC value that is 5.9%, 6.05%, and 11.05% higher than that of GAMCLDA, SDLDA, and DMFLDA, respectively. In addition, MM-LDA also obtained the best AUPR value that is 2.9%, 32.4%, and 49.5% higher than that of GAMCLDA, SDLDA, and DMFLDA, respectively. Though the running time of MM-LDA is 7.82% and 5.08% longer than that of SDLDA and DMFLDA, MM-LDA achieved the highest cost-effective prediction performance comprehensively.
Case study
In order to further verify the independent prediction performance of MM-LDA, gastric cancer was selected as the target for the case study. All known associations relating to gastric cancer composed the training set, and unknown associations composed the testing set. Then, gastric cancer-related lncRNAs identified by MM-LDA were sorted by scores. The top 10 lncRNAs with the highest scores were selected to validate the predictive performance of MM-LDA, with the evidence coming from relevant literature and database, as shown in Table 2.
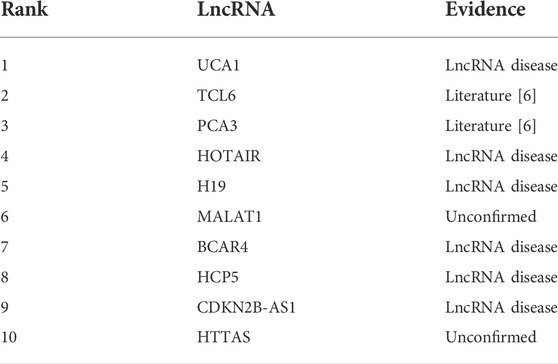
TABLE 2. Top 10 gastric cancer-related lncRNAs.
In Table 2, all but two out of 10 lncRNAs predicted by MM-LDA have found evidence from relevant literature and database. Even though, there is no direct evidence showing that HOTAIR and HTTAS relate to gastric cancer so far, some studies found that HOTAIR has stable expression in peripheral blood and can be used as a non-invasive diagnostic marker for gastric cancer (Dong et al., 2019). There is also no published literature which finds the association between HTTAS and gastric cancer. We firmly believe that there will be some researchers to find the experimental evidence for this association inferred by MM-LDA.
Discussion
In this study, a new lncRNA–disease association prediction model, namely, MM-LDA, combining the graph attention network and inductive matrix completion technology was established. MM-LDA designed a multiple-operator aggregation in n-heads attention to enhance the features of nodes. The enhanced features were input into the whole process of induction matrix completion, and the original association matrix was reconstructed by completing the missing elements of the matrix. The results from 5-fold cross-validation showed that MM-LDA obtained the best AUC value and AUPR value compared with the other three state-of-the-art computational models. Comparing with GAMCLDA, 6.45% of training time was saved. In general, MM-LDA deserves to be recommended as the highest cost-effective prediction model. However, there are still some aspects that need to be further improved and studied. First, more biological information relating to lncRNAs and diseases should be effectively integrated. Second, MM-LDA did not predict the associations relating to new lncRNAs and isolated diseases because we could not capture the features of new lncRNAs and isolated diseases without known associations. Third, we should continue to optimize the aggregators by considering the research progress of association prediction in other fields.
Data availability statement
The original contributions presented in the study are included in the article/Supplementary Material; further inquiries can be directed to the corresponding author.
Author contributions
Conceptualization, YZ; data curation, YW; formal analysis, XL; funding acquisition, YZ; methodology, YZ; software, YW; validation, YL and MC; writing—original draft, YZ; writing—review and editing, YZ and YW.
Funding
This research was funded by the National Natural Science Foundation of China (Grant Nos. 62166014 and 62162019), with funder YZ, and the Natural Science Foundation of Guangxi Province (Grant No. 2020GXNSFAA297255), with funder YZ.
Acknowledgments
The authors thank the reviewers for their suggestions that helped improve the manuscript substantially.
Conflict of interest
The authors declare that the research was conducted in the absence of any commercial or financial relationships that could be construed as a potential conflict of interest.
Publisher’s note
All claims expressed in this article are solely those of the authors and do not necessarily represent those of their affiliated organizations, or those of the publisher, the editors, and the reviewers. Any product that may be evaluated in this article, or claim that may be made by its manufacturer, is not guaranteed or endorsed by the publisher.
Abbreviations
ROC, receiver operating characteristic; AUC, area under the ROC curve; FPR, false positive rate; TPR, GAT, IMC, and LDA true positive rate, graph attention network, inductive matrix completion, and LncRNA–disease associations, respectively.
References
Bao, Z., Yang, Z., Huang, Z., Zhou, Y., Cui, Q., and Dong, D. (2019). LncRNADisease 2.0: An updated database of long non-coding RNA-associated diseases. Nucleic Acids Res. 47, D1034–D1037. doi:10.1093/nar/gky905
Bian, C., Lei, X., and Wu, F. (2021). Gatcda: Predicting circRNA-disease associations based on graph attention network. Cancers 13, 2595. doi:10.3390/cancers13112595
Chen, L., and Chen, S. (2017). Survey on matrix completion models and algorithms. J. Softw. 28, 1547–1564.
Chen, L., Shi, H., Wang, Z., Hu, Y., Yang, H., Zhou, C., et al. (2016). IntNetLncSim: An integrative network analysis method to infer human lncRNA functional similarity. Oncotarget 7, 47864–47874. doi:10.18632/oncotarget.10012
Chen, X. (2015). Katzlda: KATZ measure for the lncRNA-disease association prediction. Sci. Rep. 5, 16840–16850. doi:10.1038/srep16840
Chen, X., Clarence Yan, C., Luo, C., Ji, W., Zhang, Y., and Dai, Q. (2015). Constructing lncRNA functional similarity network based on lncRNA-disease associations and disease semantic similarity. Sci. Rep. 5, 11338. doi:10.1038/srep11338
Chen, X., Sun, L., and Zhao, Y. (2021). Ncmcmda: miRNA–disease association prediction through neighborhood constraint matrix completion. Brief. Bioinform. 22, 485–496. doi:10.1093/bib/bbz159
Chen, X., Sun, Y., Guan, N., Qu, J., Huang, Z., Zhu, Z., et al. (2019). Computational models for lncRNA function prediction and functional similarity calculation. Brief. Funct. Genomics 18, 58–82. doi:10.1093/bfgp/ely031
Chen, X., Wang, C., and Guan, N. (2020). Computational models in non-coding RNA and human disease. Int. J. Mol. Sci. 21, 1557. doi:10.3390/ijms21051557
Chen, X., Wang, L., Qu, J., Guan, N., and Li, J. (2018). Predicting miRNA–disease association based on inductive matrix completion. Bioinformatics 34, 4256–4265. doi:10.1093/bioinformatics/bty503
Chen, X., and Yan, G. (2013). Novel human lncRNA–disease association inference based on lncRNA expression profiles. Bioinformatics 29, 2617–2624. doi:10.1093/bioinformatics/btt426
Chen, X., You, Z., Yan, G., and Gong, D. (2016). Irwrlda: Improved random walk with restart for lncRNA-disease association prediction. Oncotarget 7, 57919–57931. doi:10.18632/oncotarget.11141
Dong, X., He, X., Guan, A., Huang, W., Jia, H., Huang, Y., et al. (2019). Long non-coding RNA Hotair promotes gastric cancer progression via miR-217-GPC5 axis. Life Sci. 217, 271–282. doi:10.1016/j.lfs.2018.12.024
Fraidouni, N., and Zaruba, G. (2019). The steering committee of the world congress in computer science. Computer Engineering and Applied Computing (WorldComp), 61–66.A matrix completion approach for predicting lncRNA-disease association, Proceedings of the International Conference on Bioinformatics & Computational Biology (BIOCOMP), Athens, Greece.
Gu, Y., Zhang, B., Zheng, S., Yang, F., and Li, J. (2021). Building A drug ADMET classification prediction model based on graph attention network. Data Anal. Knowl. Discov. 1.
Huang, L., Li, X., Guo, P., Yao, Y., Liao, B., Zhang, W., et al. (2017). Matrix completion with side information and its applications in predicting the antigenicity of influenza viruses. Bioinformatics 33, 3195–3201. doi:10.1093/bioinformatics/btx390
Huang, L., Zhang, L., and Chen, X. (2022a). Updated review of advances in microRNAs and complex diseases: Experimental results, databases, webservers and data fusion. Brief. Bioinform., bbac397. doi:10.1093/bib/bbac397
Huang, L., Zhang, L., and Chen, X. (2022b). Updated review of advances in microRNAs and complex diseases: Taxonomy, trends and challenges of computational models. Brief. Bioinform. 23, bbac358. doi:10.1093/bib/bbac358
Huang, L., Zhang, L., and Chen, X. (2022c). Updated review of advances in microRNAs and complex diseases: Towards systematic evaluation of computational models. Brief. Bioinform., bbac407. bbac407. doi:10.1093/bib/bbac407
Kingma, D. P., and Ba, J. 2014. Adam: A method for stochastic optimization. https://arxiv.org/abs/1412.6980.
Long, Y., Luo, J., Zhang, Y., and Xia, Y. (2021). Predicting human microbe–disease associations via graph attention networks with inductive matrix completion. Brief. Bioinform. 22, bbaa146. doi:10.1093/bib/bbaa146
Lu, C., Yang, M., Li, M., Li, Y., Wu, F., and Wang, J. (2019). Predicting human lncRNA-disease associations based on geometric matrix completion. IEEE J. Biomed. Health Inf. 24, 2420–2429. doi:10.1109/JBHI.2019.2958389
Lu, C., Yang, M., Luo, F., Wu, F., Li, M., Pan, Y., et al. (2018). Prediction of lncRNA–disease associations based on inductive matrix completion. Bioinformatics 34, 3357–3364. doi:10.1093/bioinformatics/bty327
Lydia, A., and Francis, S. (2019). Adagrad—An optimizer for stochastic gradient descent. Int. J. Inf. Comput. Sci. 6, 566–568.
Ma, Y., Guo, X., and Sun, Y. (2019). Prediction of disease associated long non-coding RNA based on HeteSim. Comput. Res. Dev. 56, 1889–1896.
Natarajan, N., and Dhillon, I. S. (2014). Inductive matrix completion for predicting gene–disease associations. Bioinformatics 30, i60–i68. doi:10.1093/bioinformatics/btu269
Sun, J., Shi, H., Wang, Z., Zhang, C., Liu, L., Wang, L., et al. (2014). Inferring novel lncRNA–disease associations based on a random walk model of a lncRNA functional similarity network. Mol. Biosyst. 10, 2074–2081. doi:10.1039/c3mb70608g
Sun, X., Zheng, H., and Sui, N. (2018). Regulation mechanism of long non-coding RNA in plant response to stress. Biochem. Biophys. Res. Commun. 503, 402–407. doi:10.1016/j.bbrc.2018.07.072
Van Laarhoven, T., Nabuurs, S. B., and Marchiori, E. (2011). Gaussian interaction profile kernels for predicting drug–target interaction. Bioinformatics 27, 3036–3043. doi:10.1093/bioinformatics/btr500
Wang, C., Han, C., Zhao, Q., and Chen, X. (2021). Circular RNAs and complex diseases: From experimental results to computational models. Brief. Bioinform. 22, bbab286. doi:10.1093/bib/bbab286
Wang, D., Wang, J., Lu, M., Song, F., and Cui, Q. (2010). Inferring the human microRNA functional similarity and functional network based on microRNA-associated diseases. Bioinformatics 26, 1644–1650. doi:10.1093/bioinformatics/btq241
Wu, Q., Cao, R., Xia, J., Ni, J., Zheng, C., and Su, Y. (2021). Extra trees method for predicting LncRNA-disease association based on multi-layer graph embedding aggregation. IEEE/ACM Trans. Comput. Biol. Bioinform., 1. doi:10.1109/TCBB.2021.3113122
Wu, Z., Pan, S., Chen, F., Long, G., Zhang, C., and Philip, S. Y. (2020). A comprehensive survey on graph neural networks. IEEE Trans. Neural Netw. Learn. Syst. 32, 4–24. doi:10.1109/TNNLS.2020.2978386
Xia, T., Xiao, B., and Guo, J. (2013). Acting mechanisms and research methods of long noncoding RNAs. Yi Chuan= Hered. 35, 269–280. doi:10.3724/sp.j.1005.2013.00269
Xu, D., Zhang, S., Zhang, H., and Mandic, D. P. (2021). Convergence of the RMSProp deep learning method with penalty for nonconvex optimization. Neural Netw. 139, 17–23. doi:10.1016/j.neunet.2021.02.011
Yin, M., Liu, J., Gao, Y., Kong, X., and Zheng, C. (2020). Ncplp: A novel approach for predicting microbe-associated diseases with network consistency projection and label propagation. IEEE Trans. Cybern. 52, 5079–5087. doi:10.1109/TCYB.2020.3026652
Zeng, M., Lu, C., Fei, Z., Wu, F., Li, Y., Wang, J., et al. (2020a). Dmflda: A deep learning framework for predicting IncRNA–disease associations. IEEE/ACM Trans. Comput. Biol. Bioinform. doi:10.1109/TCBB.2020.2983958
Zeng, M., Lu, C., Zhang, F., Li, Y., Wu, F., Li, Y., et al. (2020b). Sdlda: lncRNA-disease association prediction based on singular value decomposition and deep learning. Methods 179, 73–80. doi:10.1016/j.ymeth.2020.05.002
Zhao, T., Xu, J., Liu, L., Bai, J., Xu, C., Xiao, Y., et al. (2015). Identification of cancer-related lncRNAs through integrating genome, regulome and transcriptome features. Mol. Biosyst. 11, 126–136. doi:10.1039/c4mb00478g
Keywords: graph attention network, inductive matrix completion, association prediction, aggregation, multiple-operator
Citation: Zhang Y, Wang Y, Li X, Liu Y and Chen M (2022) Identifying lncRNA–disease association based on GAT multiple-operator aggregation and inductive matrix completion. Front. Genet. 13:1029300. doi: 10.3389/fgene.2022.1029300
Received: 27 August 2022; Accepted: 03 October 2022;
Published: 20 October 2022.
Edited by:
Rui Yin, Harvard Medical School, United StatesReviewed by:
Xing Chen, China University of Mining and Technology, ChinaJin-Xing Liu, Qufu Normal University, China
Copyright © 2022 Zhang, Wang, Li, Liu and Chen. This is an open-access article distributed under the terms of the Creative Commons Attribution License (CC BY). The use, distribution or reproduction in other forums is permitted, provided the original author(s) and the copyright owner(s) are credited and that the original publication in this journal is cited, in accordance with accepted academic practice. No use, distribution or reproduction is permitted which does not comply with these terms.
*Correspondence: Yu Wang, MjAwNzAwMkBnbHV0LmVkdS5jbg==