 Kai Wang
 Shujie Wang
 Xiang Ji1
 Pingxian Wu
 Xuewei Li
 Guoqing Tang
- 1Farm Animal Genetic Resources Exploration and Innovation Key Laboratory of Sichuan Province, Sichuan Agricultural University, Chengdu, China
- 2Chongqing Academy of Animal Science, Chongqing, China
In this study, we aimed to identified CpG sites at which DNA methylation levels are associated with meat quality traits in 140 Yorkshire pigs, including pH at 45 min (pH45min), pH at 24 h (pH24h), drip loss (DL), meat redness value (a*), yellowness (b*) and lightness (L*). Genome-wide methylation levels were measured in muscular tissue using reduced representation bisulfite sequencing (RRBS). Associations between DNA methylation levels and meat quality traits were examined using linear mixed-effect models that were adjusted for gender, year, month and body weight. A Bonferroni-corrected p-value lower than
1 Introduction
Meat quality are important traits in the pig industry. Meat quality traits mainly include, pH45m, pH24h, water-holding capacity (WHC) or DL, meat color and intramuscular fat content (IMF). In the process of pig genetics and breeding, the production performance of pig has always been the main breeding goal, and has achieved remarkable results. However, in recent years, the meat quality of pig has attracted more and more attention. Improving meat quality has become a high priority for the pork industry.
A great deal of progress has been made by genome-wide association studies (GWAS) to identify genetic loci for meat quality traits (Zhang et al., 2015; Shen et al., 2016; Verardo et al., 2017; Xing et al., 2019). In recent decades, more than 30,000 quantitative trait loci (QTL) have been released for public access on the Pig QTLdb (release 40 December 2019. http://www.animalgenome.org/cgi-bin/QTLdb/SS/index). Among them, 730 QTLs have been found to affect pork pH and 651 QTLs are associated with meat color.
While tremendous progress has been made in identifying QTLs associated with meat quality traits, epigenetic mechanisms for regulating gene expression are less understood, such as DNA methylation, histone modification and chromatin accessibility. In particular, DNA methylation at CpG sites plays an important role in development, cell differentiation, imprinting and regulation of gene expression. DNA methylation is an annotation system that marks genetic text to guide how and when to read information and control transcription (Dor and Cedar, 2018). DNA methylation has been shown to be related to pig traits, including growth (Jin et al., 2014), reproduction (Bell et al., 2011) and immune response (Wang et al., 2017).
Similar to GWAS, epigenome-wide association studies (EWAS) use epigenetic factors instead of SNP to identify candidate genes for traits (Flanagan, 2015). In recent years, EWAS have identified associations for DNA methylation and complex traits in humans, such as body-mass index (BMI) (Dick et al., 2014; Demerath et al., 2015), obesity (Silva and Garvin, 2009; Klodian et al., 2018) and diseases (Dedeurwaerder et al., 2011; Mathias et al., 2016; Soriano-Tárraga et al., 2016; Meeks et al., 2019). However, up to now, most EWAS studies have been carried out in human but no EWAS studies have been conducted on pigs.
In this study, we aimed to investigate the association between DNA methylation and meat quality traits in Yorkshire pigs by using muscular tissue. We conducted EWAS using RRBS data and then identified 20 significant CpG sites associations with meat quality traits. The results are a step toward realizing the epigenetic molecular mechanisms of meat quality traits and identifying new loci.
2 Results
2.1 Animals and meat quality traits
A total of 140 Yorkshire pigs (51 male and 89 female) were sampled in this study. The characteristics of these pigs were presented in Table 1. The mean value of pH45min, pH24h, DL, a*, b*, and L* were 6.30, 5.91, 2.89%, 5.09, 2.36, and 45.77, respectively.
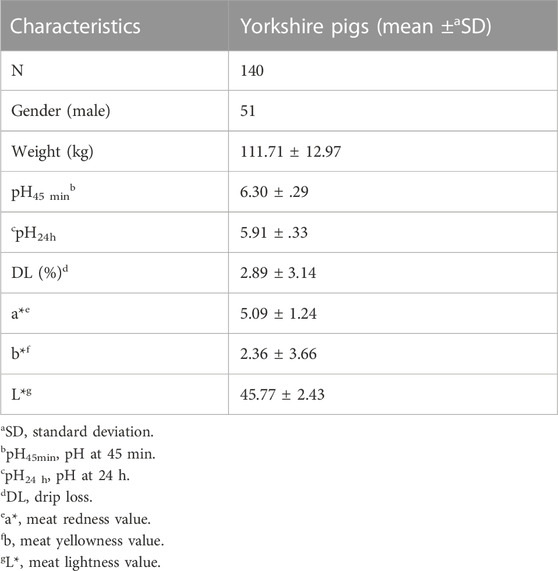
TABLE 1. Descriptive statistics of meat quality characteristics of muscular tissue from Yorkshire pigs.
2.2 DNA methylation
We constructed RRBS libraries from muscular tissue to examine methylation patterns in 140 pigs. We sequencing the libraries using Illumina HiSeq platform and then obtained on an average of
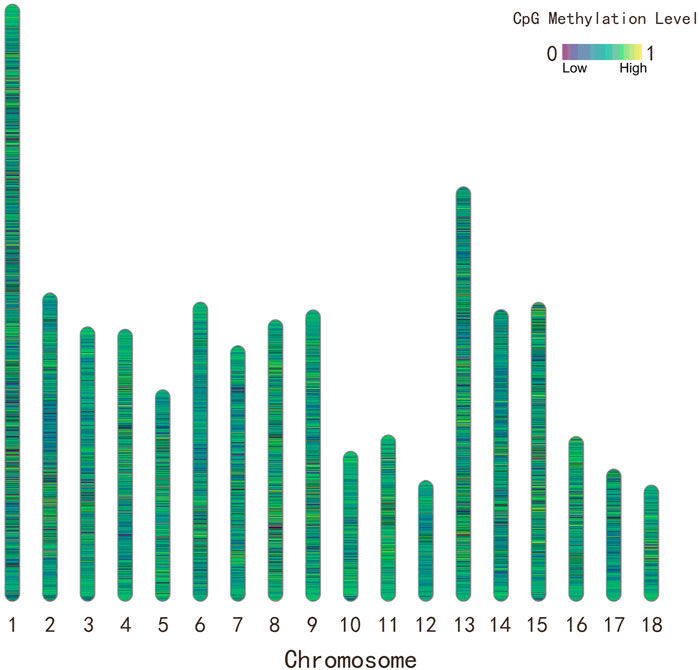
FIGURE 1. The distribution and methylation level of CpG sites for Yorkshire pigs in the 18 autosomal chromosomes. The color of chromosome ideogram represents the methylation level of CpG sites.
2.3 EWAS
We performed EWAS between CpG ML and 6 meat quality metrics, including pH45min, pH24h, DL, a*, b* and L*. We then used the R package “CpGassoc” to determine associations between DNA methylation and phenotype, as is common practice for GWAS of quantitative traits. Based on the Bonferroni correction for the number of CpG sites tested, associations were deemed significant if p-value were below
A total of 15 significant associations were detected, corresponding to 3 unique phenotypes (Figure 2, Figure 3 and Figure 4) where the p-value was below
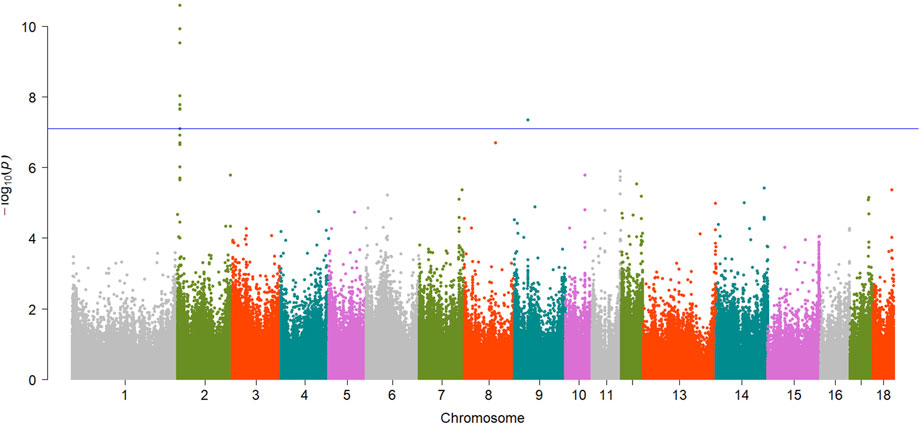
FIGURE 2. Manhattan plot showing EWAS results for DL trait. Each dot represents an CpG site and the blue line represents the threshold.
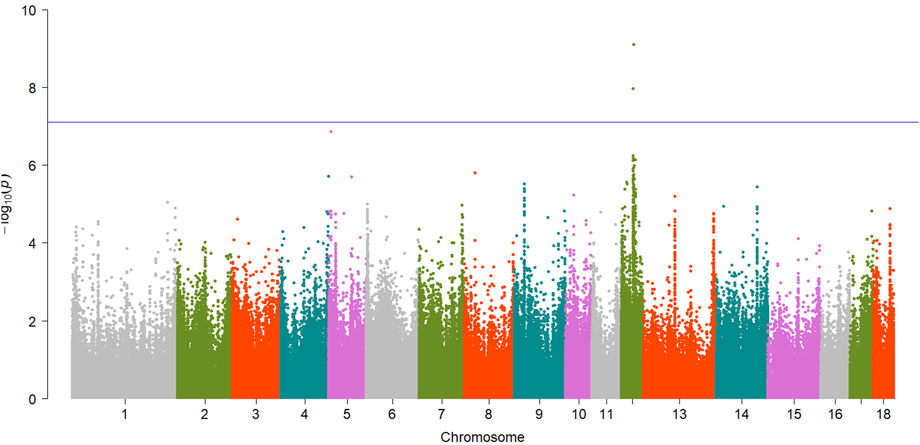
FIGURE 3. Manhattan plot showing EWAS results for b* trait. Each dot represents an CpG site and the blue line represents the threshold.
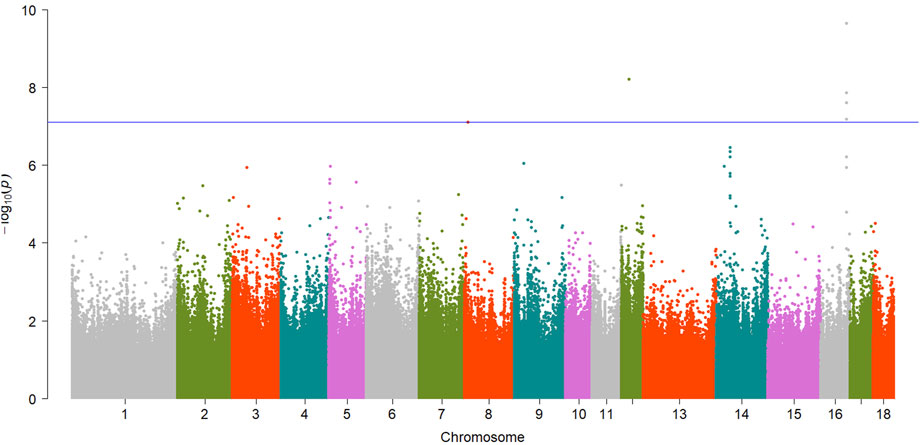
FIGURE 4. Manhattan plot showing EWAS results for L* trait. Each dot represents an CpG site and the blue line represents the threshold.
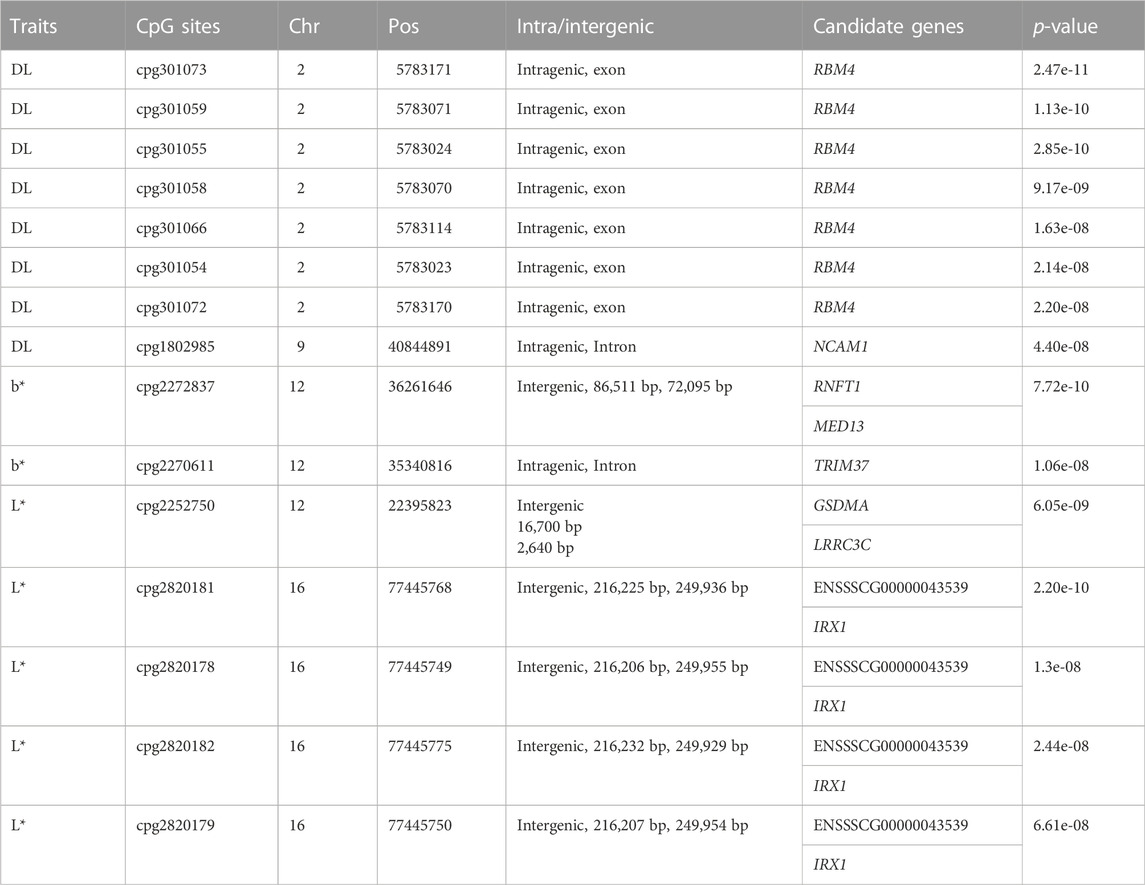
TABLE 2. Summary of significant CpG sites associated with meat quality traits.
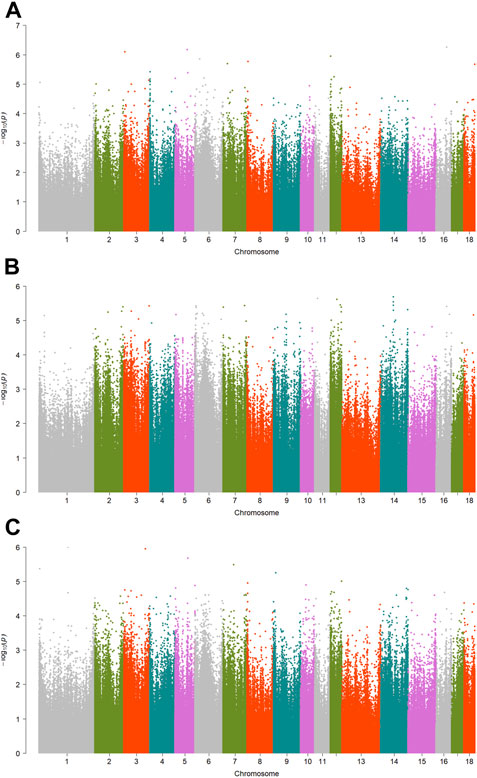
FIGURE 5. Manhattan plots showing EWAS results for other traits. Each dot represents an CpG site. (A) Manhattan plot showing EWAS results for pH45min. (B) Manhattan plot showing EWAS results for pH24h. (C) Manhattan plot showing EWAS results for a*.
As Table 2 shown, of the 15 significant CpG sites, 9 CpG sites were intragenic, and 6 CpG sites were intergenic. The distance between intergenic loci and nearby flanking genes ranged between 2,640 bp and 249,955 bp. The candidate genes listed for each site correspond to the gene itself for intragenic, and the two nearest flanking genes by distance for intergenic, with the distance between the site and each flanking gene listed for intergenic associations.
Subsequently, we calculated the average methylation level (ML) of significant CpG sites (Supplementary Table S2). Of these 15 significant CpG sites, 13 CpG sites (cpg301073, cpg301059, cpg301055, cpg301058, cpg301066, cpg301054, cpg301072, cpg2272837, cpg2270611, cpg2820181, cpg2820178, cpg2820182, and cpg2820179) were hypermethylation, and only 2 CpG sites (cpg1802985 and cpg2252750) were hypomethylation.
2.4 Candidate genes
Totals of 8 CpG sites reached significant level and were regarded as significant sites for DL trait (Table 2). Of the 8 CpG sites, 7 sites were located within the exon1 of RBM4 gene (Figure S1), and the top CpG site was cpg301073 (SSC2:5783171,
For meat color trait, totals of 2 and 5 CpG sites reached significant level for b* and L*, respectively. For b*, one of them, cpg2272837 (SSC12:36261646,
The main GO terms enriched in 9 candidate genes (Supplementary Table S1) might be related to negative regulation of centriole replication (
3 Discussion
This study reported the results of EWAS of meat quality traits in 140 Yorkshire pigs, including drip loss (DL), meat pH (pH45 min, pH24 h), and meat color (a*, b* and L*). Just as genome-wide association studies (GWAS) grew from the field of genetic epidemiology, so too do EWAS derive from the field of epigenetic epidemiology. Although there have been numerous studies of EWAS in humans, few studies perform EWAS analysis to identified associations between DNA methylation and complex traits in livestock (Flanagan, 2015). In the current study, we found associations between DNA methylation levels and meat quality traits in the muscle tissue of pigs. These findings suggest that it was possible to find significant associations between DNA methylation and traits by using tissues associated with traits of interest. Besides, one of the advantages of using mammalian models, such as pigs, is that tissues that are not readily available in human studies can be collected.
DL trait is used to describe the water-holding capacity of meats. The water-holding capacity of meats is affected by multiple factors (Huff-Lonergan and Lonergan, 2005), including muscle cell structure, muscle contraction, muscle cell protein and genetic factors. We observed that methylation of 7 CpG sites annotated to the RBM4 gene on SSC2 and 1 CpG site annotated to the NCAM1 gene on SSC9 were associated with DL trait. The RBM4 gene encodes RNA Binding Motif Protein 4 (RBM4) which participates in both precursor mRNA splicing regulation and translational control in muscle cells. RBM4 protein promotes the expression of many muscle-specific mRNAs from individual genes via its activity in modulating alternative splicing in myoblasts (Lin and Tarn, 2012). The NCAM1 gene encodes a cell adhesion protein that is a member of cell adhesion molecules (CAMs) family. The CAMs are associated with the binding of a cell to another cell or to the extracellular matrix. They play important role in cell proliferation, differentiation, trafficking, motility, apoptosis and tissue architecture. Up to now, it is not clear how methylation of RBM4 gene and NCAM1 gene are involved in DL. Multiple studies have shown that NCAM1 is associated with denervation and reinnervation, and is often used as a marker of muscle fiber denervation. We cannot definitively know that the NCAM1 is associated with DL. However, that NCAM1 is associated with denervation and reinnervation, and is often used as a marker of muscle fiber denervation (Barns et al., 2014; Messi et al., 2016) provides evidence to conclude that NCAM1 may be involved in WHC of muscle by regulating skeletal muscle fiber.
When consumers choose fresh meat, meat color plays an important visual role. In this study, meat color traits were recorded by a Minolta CR-300 colorimeter. We identified several of significant CpG sites in 2 chromosome regions (SSC12 and SSC16). Yellowness of meat (b*) is mainly influenced by the fat deposits in muscle (Calnan et al., 2017). Usually, yellowness increases with the amount of fat deposited in the muscle. We identified 2 significant CpG sites for b* on SSC12 (Figure S3), which had’n been previously reported. The cpg2272837 is annotated to the upstream of MED13 gene. The MED13 is a protein coding gene that encodes a component of the mediator complex. The mediator complex acts as a centralized hub for transcriptional regulation and plays an important role in metabolic control (Amoasii et al., 2018). Previous study reported that MED13 overexpression enhanced lipid metabolism, insulin sensitivity, and decreased susceptibility to obesity (Baskin et al., 2014). Yellowness of meat is affected by muscle fat deposition. This result could imply that MED13 may affect yellowness of meat by participating in lipid metabolism. The cpg2270611 is annotated within the TRIM37 gene which encodes a peroxisomal protein (TRIM37) with E3 ubiquitin-ligase activity. The mutations in the TRIM37 gene caused mulibrey (muscle-liver-brain-eye) nanism (MUL). Although the physiological function of TRIM37 in vivo is unclear, a study has shown that members of the ubiquitin-proteosome pathway can participate in energy metabolism by affecting the regulation of insulin signaling (Karlberg et al., 2005). Energy metabolism plays an important role in the process of muscle transformation after slaughter. Functional studies are needed to investigate the roles of the MED13 and TRIM37 gene in meat color among Yorkshire pigs.
A growing body of evidence supports the contribution of epigenetic modification to phenotypic variation in livestock (Triantaphyllopoulos et al., 2016; Wang and Ibeagha-Awemu, 2020) and supports the potential application of epigenetic biomarkers, particularly DNA methylation in livestock breeding programs. Moreover, a previous study has reported the association between SNPs and differential DNA methylation (Imgenberg-Kreuz et al., 2018). This provided one possible mechanism that SNPs impacts gene expression by altering DNA methylation, thereby suggesting the possible application of epigenetic biomarkers in livestock improvement breeding (Maldonado et al., 2019). Thus, in the development of new breeding methods, the relationship between DNA methylation biomarkers identified by EWAS and production traits can be considered in order to be able to quantify the epigenetic contribution to breeding value prediction. (Wang and Ibeagha-Awemu, 2020). Therefore, more studies are needed to get a better understanding of the epigenetic mechanisms underlying phenotyping variation in pig production.
4 Materials and methods
4.1 Animals and DNA sample
A total of 140 Yorkshire pigs (51 male and 89 female) were used to extracted genomic DNA from muscular tissue. The pigs were raised under the same recommended environment at the conservation farm of Mingxing Agricultural science and Technology Development Co.,Ltd. All individuals were raised to 111.71 Kg (
4.2 DNA methylation data
Briefly, genomic DNA was isolated from flash frozen muscular tissue. Then, the construction of RRBS libraries and paired-end sequencing using Illumina HisSeq analyzer was performed at Novogene technology co., LTD. (Beijing, China). Raw sequencing data were processed by an Illumina base-calling pipeline. Clean reads were aligned to the pig reference genome (Sscrofa11.1) using Bismark (Felix and Andrews, 2011) after removing adaptor sequences. Next, ML were measured using bismark_methylation_extrator program. A quality control procedure was adopted to ensure the high data quality by 1) retaining only CpG cytosines across all samples; 2) removing CpG sites with missing methylation values at >35 samples; 3) removing CpG sites with coverage <10 reads within a sample. A total of 3,083,713 CpG sites were retained for further analysis. The distribution of CpG sites were conducted using R package Rldeogram v.2.2 (Hao et al., 2020).
4.3 Data analysis
We used the R package CpGassoc v2.60 (Barfield et al., 2012) to test for association between methylation and phenotype. We applied the linear mixed-model with the CpG ML score (vary between 0 and 1) as the outcome, and adjusted for sex, year, month, parity and body weight. The following model was used:
where
We corrected for multiple comparisons using a Bonferroni correction for
4.4 Candidate genes and annotation
Then we identified candidate genes based on the significant CpG sites by the Ensemble biomart (http://www.biomart.org). The candidate genes listed for each site correspond to the gene itself for intragenic, and the two nearest flanking genes by distance for intergenic, with the distance between the site and each flanking gene listed for intergenic associations. The gene lists were then submitted for enrichment analysis using the Database for Annotation, Visualization and Integrated Discovery (DAVID) v6.8 (http://david.ncifcrf.gov/). Significant Gene Ontology (GO) terms and Kyoto Encyclopedia of Genes and Genomes (KEGG) pathways were selected after filtering with
Data availability statement
The data presented in the study are deposited in the Figshare repository, accession number 10.6084/m9.figshare.20633217.
Ethics statement
The animal study was reviewed and approved by All experimental procedures were performed in accordance with the Institutional Review Board (IRB14044) and the Institutional Animal Care and Use Committee of the Sichuan Agricultural University under permit number DKY-B20140302. Written informed consent was obtained from the owners for the participation of their animals in this study.
Author contributions
Conceptualization: GT and XL; Methodology: GT and KW; Formal analysis: KW, SW; Writing—original draft preparation: KW and SW; Writing—review and editing: XJ and DC; Funding acquisition: XL; Supervision: QS, YY, KW, and QT. All authors have read and approved the manuscript.
Funding
The study was supported by grants from the Sichuan Science and Technology Program (2020YFN0024), the earmarked fund for the China Agriculture Research System (CARS-35-01 A), the National Key R&D Program of China (2018YFD0501204), the National Natural Science Foundation of China (C170102) and the Sichuan Innovation Team of Pig (sccxtd-2021–08). This study was supported by High-performance Computing Platform of Sichuan Agricultural University.
Conflict of interest
The authors declare that the research was conducted in the absence of any commercial or financial relationships that could be construed as a potential conflict of interest.
Publisher’s note
All claims expressed in this article are solely those of the authors and do not necessarily represent those of their affiliated organizations, or those of the publisher, the editors and the reviewers. Any product that may be evaluated in this article, or claim that may be made by its manufacturer, is not guaranteed or endorsed by the publisher.
Supplementary material
The Supplementary Material for this article can be found online at: https://www.frontiersin.org/articles/10.3389/fgene.2022.1028711/full#supplementary-material
Supplementary Figure S1 | The Manhattan plot of significant CpG sites on SSC2 for DL trait and the graphic of significant CpG sites in the genomic region. Each dot represents an CpG site and the green dot in the circle represents significant CpG site. The X-axis represents genomic region, and the Y-axis represents average methylation level of CpG sites.
Supplementary Figure S2 | The Manhattan plot of significant CpG sites on SSC9 for DL trait and the graphic of significant CpG sites in the genomic region. Each dot represents an CpG site and the green dot in the circle represents significant CpG site. The X-axis represents genomic region, and the Y-axis represents average methylation level of CpG sites.
Supplementary Figure S3 | The Manhattan plot of significant CpG sites on SSC12 for b* and the graphic of significant CpG sites in the genomic region. Each dot represents an CpG site and the green dot in the circle represents significant CpG site. The X-axis represents genomic region, and the Y-axis represents average methylation level of CpG sites.
Supplementary Figure S4 | The Manhattan plot of significant CpG sites on SSC12 for L* and the graphic of significant CpG sites in the genomic region. Each dot represents an CpG site and the green dot in the circle represents significant CpG site. The X-axis represents genomic region, and the Y-axis represents average methylation level of CpG sites.
Supplementary Figure S5 | The Manhattan plot of significant CpG sites on SSC16 for L* and the graphic of significant CpG sites in the genomic region. Each dot represents an CpG site and the green dot in the circle represents significant CpG site. The X-axis represents genomic region, and the Y-axis represents average methylation level of CpG sites.
References
Amoasii, L., Olson, E. N., and Bassel-Duby, R. (2018). Control of muscle metabolism by the mediator complex. Cold Spring Harb. Perspect. Med. 8, a029843. doi:10.1101/cshperspect.a029843
Barfield, R. T., Kilaru, V., Smith, A. K., and Conneely, K. N. (2012). CpGassoc: an R function for analysis of DNA methylation microarray data. Bioinformatics 28, 1280–1281. doi:10.1093/bioinformatics/bts124
Barns, M., Gondro, C., Tellam, R. L., Radley-Crabb, H. G., Grounds, M. D., and Shavlakadze, T. (2014). Molecular analyses provide insight into mechanisms underlying sarcopenia and myofibre denervation in old skeletal muscles of mice. Int. J. Biochem. Cell Biol. 53, 174–185. doi:10.1016/j.biocel.2014.04.025
Baskin, K. K., Grueter, C. E., Kusminski, C. M., Holland, W. L., Bookout, A. L., Satapati, S., et al. (2014). MED13-dependent signaling from the heart confers leanness by enhancing metabolism in adipose tissue and liver. EMBO Mol. Med. 6, 1610–1621. doi:10.15252/emmm.201404218
Bell, J. T., Pai, A. A., Pickrell, J. K., Gaffney, D. J., Pique-Regi, R., Degner, J. F., et al. (2011). DNA methylation patterns associate with genetic and gene expression variation in HapMap cell lines. Genome Biol. 12, R10.R10. doi:10.1186/gb-2011-12-1-r10
Calnan, H. B., Jacob, R. H., Pethick, D. W., and Gardner, G. E. (2017). Selection for intramuscular fat and lean meat yield will improve the bloomed colour of Australian lamb loin meat. Meat Sci. 131, 187–195. doi:10.1016/j.meatsci.2017.05.001
Dedeurwaerder, S., Desmedt, C., Calonne, E., Singhal, S. K., Haibe-Kains, B., Defrance, M., et al. (2011). DNA methylation profiling reveals a predominant immune component in breast cancers. Embo Mol. Med. 3, 726–741. doi:10.1002/emmm.201100801
Demerath, E. W., Guan, W., Grove, M. L., Stella, A., Michael, M., Yi-Hui, Z., et al. (2015). Epigenome-wide association study (EWAS) of BMI, BMI change and waist circumference in African American adults identifies multiple replicated loci. Hum. Mol. Genet. 15, 4464–4479. doi:10.1093/hmg/ddv161
Dick, K. J., Nelson, C. P., Tsaprouni, L., Sandling, J. K., A?Ssi, D., Wahl, S., et al. (2014). DNA methylation and body-mass index: A genome-wide analysis. Lancet 383, 1990–1998. doi:10.1016/S0140-6736(13)62674-4
Dor, Y., and Cedar, H. (2018). Principles of DNA methylation and their implications for biology and medicine. Lancet 392, 777–786. doi:10.1016/S0140-6736(18)31268-6
Duan, Y. Y., Ma, J. W., Yuan, F., Huang, L. B., Yang, K. X., Xie, J. P., et al. (2009). Genome-wide identification of quantitative trait loci for pork temperature, pH decline, and glycolytic potential in a large-scale White Duroc x Chinese Erhualian resource population. J. Animal Sci. 87, 9–16. doi:10.2527/jas.2008-1128
Felix, K., and Andrews, S. R. (2011). Bismark: A flexible aligner and methylation caller for bisulfite-seq applications. Bioinformatics 11, 1571–1572. doi:10.1093/bioinformatics/btr167
Flanagan, J. M. (2015). Epigenome-wide association studies (EWAS): Past, present, and future. Methods Mol. Biol. 1238, 51–63. doi:10.1007/978-1-4939-1804-1_3
Hao, Z., Lv, D., Ge, Y., Shi, J., Weijers, D., Yu, G., et al. (2020). RIdeogram: Drawing SVG graphics to visualize and map genome-wide data on the idiograms. PeerJ. Comput. Sci. 6, e251. doi:10.7717/peerj-cs.251
Huff-Lonergan, E., and Lonergan, S. M. (2005). Mechanisms of water-holding capacity of meat: The role of postmortem biochemical and structural changes. Meat Sci. 71, 194–204. doi:10.1016/j.meatsci.2005.04.022
Imgenberg-Kreuz, J., Carlsson Almlöf, J., Leonard, D., Alexsson, A., Nordmark, G., Eloranta, M. L., et al. (2018). DNA methylation mapping identifies gene regulatory effects in patients with systemic lupus erythematosus. Ann. Rheum. Dis. 77, 736–743. doi:10.1136/annrheumdis-2017-212379
Jin, L., Jiang, Z., Xia, Y., Lou, P., Chen, L., Wang, H., et al. (2014), Genome-wide DNA methylation changes in skeletal muscle between young and middle-aged pigs. BMC Genomics 15, 653. doi:10.1186/1471-2164-15-653
Karlberg, N., Jalanko, H., Kallijarvi, J., Lehesjoki, A. E., and Lipsanen-Nyman, M. (2005). Insulin resistance syndrome in subjects with mutated RING finger protein TRIM37. Diabetes 54, 3577–3581. doi:10.2337/diabetes.54.12.3577
Klodian, D., Braun, K. V. E., Jana, N., Trudy, V., Demerath, E. W., Guan, W., et al. (2018). An epigenome-wide association study of obesity-related traits. Am. J. Epidemiol. 8, 1662–1669. doi:10.1093/aje/kwy025
Lin, J. C., and Tarn, W. Y. (2012). Multiple roles of RBM4 in muscle cell differentiation. Front. Biosci. Sch. Ed. 4, 181–189. doi:10.2741/260
Ma, J., Ren, J., Guo, Y., Duan, Y., Ding, N., Zhou, L., et al. (2009). Genome-wide identification of quantitative trait loci for carcass composition and meat quality in a large-scale White Duroc x Chinese Erhualian resource population. Anim. Genet. 40, 637–647. doi:10.1111/j.1365-2052.2009.01892.x
Maldonado, M. B. C., De Rezende Neto, N. B., Nagamatsu, S. T., Carazzolle, M. F., Hoff, J. L., Whitacre, L. K., et al. (2019). Identification of bovine CpG SNPs as potential targets for epigenetic regulation via DNA methylation. PLoS One 14, e0222329. doi:10.1371/journal.pone.0222329
Mathias, R. A., David, M., Muhammad, A., Stefan, E., Ek, W. E., Ulf, G., et al. (2016). Epigenome-wide association study reveals differential DNA methylation in individuals with a history of myocardial infarction. Hum. Mol. Genet. 21, 4739–4748. doi:10.1093/hmg/ddw302
Meeks, K. a. C., Peter, H., Andrea, V., Juliet, A., Silver, B., Tom, B., et al. (2019). Epigenome-wide association study in whole blood on type 2 diabetes among sub-saharan african individuals: Findings from the RODAM study. Int. J. Epidemiol., 58–70. doi:10.1093/ije/dyy171
Messi, M. L., Li, T., Wang, Z. M., Marsh, A. P., Nicklas, B., and Delbono, O. (2016). Resistance training enhances skeletal muscle innervation without modifying the number of satellite cells or their myofiber association in obese older adults. J. Gerontol. A Biol. Sci. Med. Sci. 71, 1273–1280. doi:10.1093/gerona/glv176
Otto, G., Roehe, R., Looft, H., Thoelking, L., and Kalm, E. (2004). Comparison of different methods for determination of drip loss and their relationships to meat quality and carcass characteristics in pigs. Meat Sci. 68, 401–409.
Shen, L., Du, J., Xia, Y., Tan, Z., Fu, Y., Yang, Q., et al. (2016). Genome-wide landscape of DNA methylomes and their relationship with mRNA and miRNA transcriptomes in oxidative and glycolytic skeletal muscles. Sci. Rep. 6, 32186. doi:10.1038/srep32186
Silva, G. B., and Garvin, J. L. (2009). Akt1 mediates purinergic-dependent NOS3 activation in thick ascending limbs. Am. J. physiology. Ren. physiology 297, F646–F652. doi:10.1152/ajprenal.00270.2009
Soriano-Tárraga, C., Jiménez-Conde, J., Giralt-Steinhauer, E., Mola-Caminal, M., Vivanco-Hidalgo, R. M., Ois, A., et al. (2016). Epigenome-wide association study identifies TXNIP gene associated with type 2 diabetes mellitus and sustained hyperglycemia. Hum. Mol. Genet. 25, 609–619. doi:10.1093/hmg/ddv493
Triantaphyllopoulos, K. A., Ikonomopoulos, I., and Bannister, A. J. (2016). Epigenetics and inheritance of phenotype variation in livestock. Epigenetics Chromatin 9, 31. doi:10.1186/s13072-016-0081-5
Turner, S. D. (2018). qqman: an R package for visualizing GWAS results using Q-Q and manhattan plots. J. Open Source Softw. 3, 731. doi:10.21105/joss.00731
Verardo, L. L., Sevón-Aimonen, M. L., Serenius, T., Hietakangas, V., and Uimari, P. (2017). Whole-genome association analysis of pork meat pH revealed three significant regions and several potential genes in Finnish Yorkshire pigs. Bmc Genet. 18, 13. doi:10.1186/s12863-017-0482-x
Wang, H., Wang, J., Ning, C., Zheng, X., Fu, J., Wang, A., et al. (2017). Genome-wide DNA methylation and transcriptome analyses reveal genes involved in immune responses of pig peripheral blood mononuclear cells to poly I:C. Sci. Rep. 7, 9709. doi:10.1038/s41598-017-10648-9
Wang, M., and Ibeagha-Awemu, E. M. (2020). Impacts of epigenetic processes on the Health and productivity of livestock. Front. Genet. 11, 613636. doi:10.3389/fgene.2020.613636
Xing, K., Zhao, X., Ao, H., Chen, S., Yang, T., Tan, Z., et al. (2019). Transcriptome analysis of miRNA and mRNA in the livers of pigs with highly diverged backfat thickness. Sci. Rep. 9, 16740. doi:10.1038/s41598-019-53377-x
Keywords: DNA methylation, EWAS, CPGs, pig, gene
Citation: Wang K, Wang S, Ji X, Chen D, Shen Q, Yu Y, Wu P, Li X and Tang G (2023) Epigenome-wide association studies of meat traits in Chinese Yorkshire pigs highlights several DNA methylation loci and genes. Front. Genet. 13:1028711. doi: 10.3389/fgene.2022.1028711
Received: 26 August 2022; Accepted: 14 December 2022;
Published: 04 January 2023.
Edited by:
Xiao Wang, Konge Larsen ApS, DenmarkReviewed by:
Apratim Mitra, Eunice Kennedy Shriver National Institute of Child Health and Human Development (NIH), United StatesXiangdong Ding, China Agricultural University, China
Copyright © 2023 Wang, Wang, Ji, Chen, Shen, Yu, Wu, Li and Tang. This is an open-access article distributed under the terms of the Creative Commons Attribution License (CC BY). The use, distribution or reproduction in other forums is permitted, provided the original author(s) and the copyright owner(s) are credited and that the original publication in this journal is cited, in accordance with accepted academic practice. No use, distribution or reproduction is permitted which does not comply with these terms.
*Correspondence: Guoqing Tang, dHlxMDAzQDE2My5jb20=
†These authors contributed equally to this work