 Zhixian Zhou1
 Chun Fu
- 1Department of Obstetrics and Gynecology, Second Xiangya Hospital, Central South University, Changsha, China
- 2Department of Neurosurgery, Second Xiangya Hospital, Central South University, Changsha, China
Fanconi anemia (FA) genes contribute to tumorigenesis by regulating DNA repair. Despite its importance for assembly and functionality of the FA core complex, no pan-cancer analysis of FANCE was performed. We aimed to provide a comprehensive understanding of the role of FANCE in cancers. Based on The Cancer Genome Atlas (TCGA), Cancer Cell Line Encyclopedia (CCLE), Genotype Tissue-Expression (GTEx), Human Protein Atlas (HPA), Gene Expression Omnibus (GEO), and Cancer Single-cell Atlas (CancerSEA) databases, we investigated the carcinogenicity of FANCE using various bioinformatics methods, including FANCE expression and prognosis, immune invasion, tumor mutation burden, microsatellite instability, and neoantigens. We monitored Fance mutations in mice that caused tumorigenesis. FANCE expression and activity scores were upregulated in 15 and 21 cancers. High expression of FANCE affected shorter overall survival (OS) in seven cancers and longer overall survival in three cancers. It was correlated with shorter overall survival and progression-free interval (PFI) in endometrial cancer and longer overall survival and PFI in cervical cancer. FANCE expression negatively correlated with stromal/immune scores in 21 cancers including cervical cancer, endometrial cancer, and ovarian cancer. FANCE expression negatively correlated with CD8 T cells in endometrial cancer and positively correlated with M1 macrophages in cervical cancer, possibly related to cancer prognosis. FANCE positively correlated with immune checkpoint inhibitors PD-1, PD-L1, and CTLA4 in endometrial cancer and ovarian cancer. FANCE expression positively correlated with microsatellite instability, tumor mutational burden, and neoantigens in 7, 22, and five cancers, especially in endometrial cancer, potentially increasing the effectiveness of immunotherapy. Single-cell sequencing data showed FANCE was primarily expressed in cancer cells in cervical and ovarian cancer, and in fibroblasts in endometrial cancer. Fance heterozygous mutant mice had increased tumor incidences and shorter overall survival and tumor-free survival (TFS) than Fance homozygous mutant mice and wild-type mice. Conclusively, FANCE potential to serve as a biomarker for cancer prognosis and may predict cancer immunotherapy responses. Fance heterozygous mutant resulted in increased tumorigenesis and poor prognosis in mice.
1 Introduction
Fanconi anemia (FA) is characterized by bone marrow failure, developmental abnormalities, and cancer predisposition (Che et al., 2018). So far, 22 FA complementation groups have been identified (FANCA/B/C/D/D2/E/F/G/I/J/L/M/N/O/P/Q/R/S/T/U/V/W). The defection of FA genes is associated with high incidences of cancers in patients, particularly those originating from hematopoietic and squamous cells, most commonly seen in acute myeloid leukemia, pancreatic cancer, solid tumors, cervical cancer, oral cancer, prostate cancer, bone marrow failure, breast cancer, and ovarian cancer (Nepal et al., 2017). High expression of FA genes (FANCF D1/D2/I/J/N/S) has been demonstrated linked to poor prognosis in various cancers, including head and neck cancer (Verhagen et al., 2018), myeloid leukemia (Padella et al., 2021), liver cancer (Xu H. et al., 2021), lung cancer (Miao et al., 2022; Zhang et al., 2022), breast cancer (Fagerholm et al., 2013; Feng and Jin, 2019), cervical cancer (Liu et al., 2021), and ovarian cancer (Ding et al., 2016; Moes-Sosnowska et al., 2019). Fanconi Anemia Complementation Group E (FANCE) is a key component in the architecture of the FA core complex (FANCA/B/C/E/F/G/L/M/T) and the connection of the downstream FANCD2–FANCI monoubiquitylation complex, DNA damage repair proteins (FANCD1/J/N/O/P/Q/R/S/U/V/W), and their collaborators (FA associate proteins) (Gordon et al., 2005; Kottemann and Smogorzewska, 2013). Patients with FANCE defects are at risk of developing esophageal cancer, gastric cancer, and leukemia (Ali et al., 2009; Akbari et al., 2011; Li et al., 2013). FANCE high expression was reported consistent with poor prognosis in liver cancer (Takahashi et al., 2022). However, the mechanism that FANCE contributes to the development and progression of cancer is still unclear.
The tumor microenvironment can have a significant impact on tumor development, invasion, metastasis, and prognosis (Ren et al., 2018; Jiang et al., 2020; Malherbe, 2021; Bremnes et al., 2016; Oura et al., 2021). Studies showed the expression of FA genes (FANCR/D2/I) regulates immune infiltration and modulates the immunotherapy response in cancers. FANCR expression was positively correlated with inhibitory immune checkpoint proteins in liver cancer, promoting immune escape and inhibiting immunotherapy responses (Xu H. et al., 2021). FANCD2 expression facilitates tumor immune escape in lung cancer by suppressing the immune microenvironment, while patients with high expression of FANCD2 exhibited higher tumor mutation burden (TMB) indicating greater responses to immunotherapy (Miao et al., 2022; Zhang et al., 2022). FANCI expression suppressed the immune microenvironment and was positively related to infiltrated CD4 T cells, CD8 T cells, and neutrophils in cervical cancer (Liu et al., 2021). Moreover, patients with FA-related head and neck cancer benefit from immunotherapy by activating lymphocyte-mediated antitumor activity (Lee et al., 2021). It remains unclear what role of FANCE plays in tumor immunity. We investigate the prognostic and immunological effects of FANCE on various cancers.
We conducted a pan-cancer analysis of FANCE in 33 cancers. FANCE expression was analyzed with prognosis, function enrichment, tumor microenvironment (TME), tumor-infiltrating immune cells (TIICs), immune-regulated genes, immune checkpoint genes, microsatellite instability (MSI), TMB, and neoantigens. In addition, we used Fance mutant mice models to observe tumorigenesis. Our findings suggest that FANCE potentially serves as a biomarker for cancer prognosis. FANCE correlated with immunity infiltration and predicted the response to immunotherapy in cancers. Additionally, we identified the tumorigenesis of Fance mutation in mice. Our study provided preliminary insights into the role of FANCE in tumorigenesis, prognosis prediction, and immunotherapy. These data may serve as references to new targets for clinical treatment.
2 Material and methods
2.1 Expression and gene activity of FANCE
Genotype-Tissue Expression (GTEx) database (https://commonfund.nih.gov/GTEx) examined the expression of FANCE in 31 normal tissues. Cancer Cell Line Encyclopedia (CCLE) database (https://portals.broadinstitute.org/ccle/) was used to assess the expression of FANCE in 21 tumor cell lines. The Cancer Genome Atlas (TCGA) database (https://portal.gdc.cancer.gov) was used to determine the differential expression of FANCE between tumors and normal tissues. Single-sample gene set enrichment analysis (ssGSEA) was used to estimate the gene activity scores of FANCE in normal and tumor tissues. The human protein atlas (HPA) database (http://www.proteinatlas.org/) was used to evaluate the expression of FANCE protein in normal and tumor tissues using immunohistochemistry (IHC).
FANCE gene expression data from these downloaded datasets for subsequent analyses, contains 11,007 samples from 33 cancers, involving adrenocortical carcinoma (ACC, n = 79), bladder urothelial carcinoma (BLCA, n = 427), breast invasive carcinoma (BRCA, n = 1211), cervical squamous cell carcinoma (CESC, n = 309), cholangiocarcinoma (CHOL, n = 45), colon adenocarcinoma (COAD, n = 499), lymphoid neoplasm diffuse large B cell lymphoma (DLBC, n = 48), esophageal carcinoma (ESCA, n = 173), glioblastoma multiforme (GBM, n = 172), head and neck squamous cell carcinoma (NHSC, n = 546), kidney chromophobe (KICH, n = 89), kidney renal clear cell carcinoma (KIRC, n = 603), kidney renal papillary cell carcinoma (KIRP, n = 321), acute myeloid leukemia (LAML, n = 151), brain lower grade glioma (LGG, n = 525), liver hepatocellular carcinoma (LIHC, n = 423), lung adenocarcinoma (LUAD, n = 574), lung squamous cell carcinoma (LUSC, n = 550), mesothelioma (MESO, n = 86), ovarian serous cystadenocarcinoma (OV, n = 379), pancreatic adenocarcinoma (PAAD, n = 182), pheochromocytoma and paraganglioma (PCPG, n = 186), prostate adenocarcinoma (PRAD, n = 548), rectum adenocarcinoma (READ), sarcoma (SARC, n = 265), skin cutaneous melanoma (SKCM, n = 472), stomach adenocarcinoma (STAD, n = 407), testicular germ cell tumors (TGCT, n = 156), thyroid carcinoma (THCA, n = 568), thymoma (THYM, n = 121), uterine corpus endometrial carcinoma (UCEC, n = 10,872), uterine carcinosarcoma (UCS, n = 56), and uveal melanoma (UVM, n = 80). The expression data were shown according to a log2 (TPM+1) scale. Strawberry Perl (5.32.1.1) and R (4.2.0) were used to process and plot the data. R packages “plyr,” “reshape2,” “ggpubr,” “GSVA,” and “GSEABase” were used.
2.2 GSEA of FANCE expression
GSEA was performed to analyze the biological pathway of FANCE expression in cancers. According to the TCGA database, samples were divided into two subgroups based on the median expression level of FANCE. The top five pathways of Kyoto Encyclopedia of Genes and Genomes (KEGG) terms was presented. This analysis was conducted with R packages “org.Hs.eg.db,” “clusterProfiler,” “enrichplot,” and “ggplot2.”
2.3 Prognosis value of FANCE expression
The TCGA database was used to collect survival and clinical data on 33 cancers. FANCE expression and patient prognosis were investigated using four indicators: overall survival (OS), disease-specific survival (DSS), progression-free interval (PFI), and disease-free interval (DFI). Survival analysis was performed using Cox regression and Kaplan–Meier (KM). “survival,” “survminer,” “ggpubr,” “forestplot” packages were used.
2.4 FANCE expression and TME, TIICs, immune-regulated genes, and immune checkpoint genes
In 33 cancers based on the TCGA dataset, the stromal, immune, and ESTIMATE scores were calculated using the ESTIMATE algorithm. CIBERSORT was used to evaluate FANCE expression and the proportion of TIICs in 33 cancers based on the TCGA dataset. Co-expression of FANCE with 150 immune moderator genes and 60 immune checkpoint genes were analyzed based on the TCGA database. “ggplot2,” “ggpubr,” “ggExtra,” “limma,” “estimate,” “psych,” and “CIBERSORT” packages were used.
2.5 FANCE expression and MSI, TMB, and neoantigens
Data on somatic mutations were downloaded from TCGA. TMB and MSI grades were computed with Perl scripts. Neoantigen prediction aimed to assess factors affecting immunogenicity in tumors from the TCGA (Thorsson et al., 2018). The ScanNeo tool2 was used to measure the number of neoantigens in each tumor sample (Xu C. et al., 2021). The R packages “fmsb,” “ggradar,” and “ggplot2” were used.
2.6 Single-cell RNA sequencing (scRNA-seq) data analysis
ScRNA-seq data for endometrial cancer, ovarian cancer, and cervical cancer (GSE173682, GSM5236544, and GSM5236545) were downloaded from the Gene Expression Omnibus (GEO) database (https://www.ncbi.nlm.nih.gov/geo/). The Seurat package was used for normalization, feature selection, and clustering of the gene expression matrices. The selection method “vst” of Seurat was applied to pick the top 2,000 variable features. The UMAP and tSNE algorithms were applied for the dimensionality reduction of the data. The FindCluster function was used to cluster cells. SingleR was used to annotate cells automatically. The Cancer Single-cell Atlas (CancerSEA) database (https://biocc.hrbmu.edu.cn/CancerSEA/) was employed to explore the function of FANCE.
2.7 Fance gene mutant mice increased tumor susceptibility
This study has been approved by the Laboratory Animal Welfare and Ethical Committee of Central South University (IACUC Number: 2020sydw1041). Fance mutant mice with FVB/N backgrounds have been constructed by the research group (Fu et al., 2016a; Fu et al., 2016b). In Central South University’s Laboratory Animals Department, laboratory animals were housed under pathogen-free conditions (20–22 C, 12-h light/dark cycle). Histopathological examinations of various tissues and organs were performed after the mice monitored tumorigenesis. Paraffin-embedded sections stained with H&E were used to confirm and categorize tumors. Log-rank test was used to analyze survival. Section scanning was performed using 3DHISTECH (Hungary) (PANNORAMIC, DESK/MIDI/250/1000, CaseViewer2.4).
2.8 Statistical analysis
The Kruskal-Wallis test was applied to compare the expression of FANCE among normal tissues and tumor cell lines. The comparison of normal tissue and cancer tissue used two sets of t-tests. The KM curve, Cox proportional hazard regression model, and the log-rank test were applied to all survival analyses. Spearman’s test was used to analyze the correlation between expression and tumor immunity. Chi-square tests were used to compare tumor incidence, and Bonferroni tests were conducted to compare multiple groups. p < .05 was regarded as statistically significant.
3 Results
3.1 FANCE expression and gene activity scores
We compared FANCE expression levels in 31 normal tissues based on the GTEx database. FANCE was detected highest in the testis, bone marrow, and skin (Figure 1A). All 21 tumor cell lines from the CCLE database expressed FANCE (Figure 1B). Based on the TCGA dataset, FANCE expression was highest in CESC (Figure 1C). FANCE expression was higher in 15 tumors than in normal tissues, including CESC, ESCA, STAD, LIHC, BLCA, CHOL, COAD, GBM, HNSC, LUAD, LUSC, PCPG, READ, SARC, and THCA. BRCA and KIRP tumors had lower FANCE expression (Figure 1D). Gene activity scores of FANCE were highest in DLBC, UCS, TGCT, and were significantly higher in 21 cancers than in normal tissues, including CESC, UCEC, ESCA, STAD, LIHC, BRCA, PRAD, BLCA, CHOL, COAD, GBM, HNSC, KICH, KIRC, KIRD, LUAD, LUSC, PCPG, READ, SARC, and THCA (Figures 1E,F).
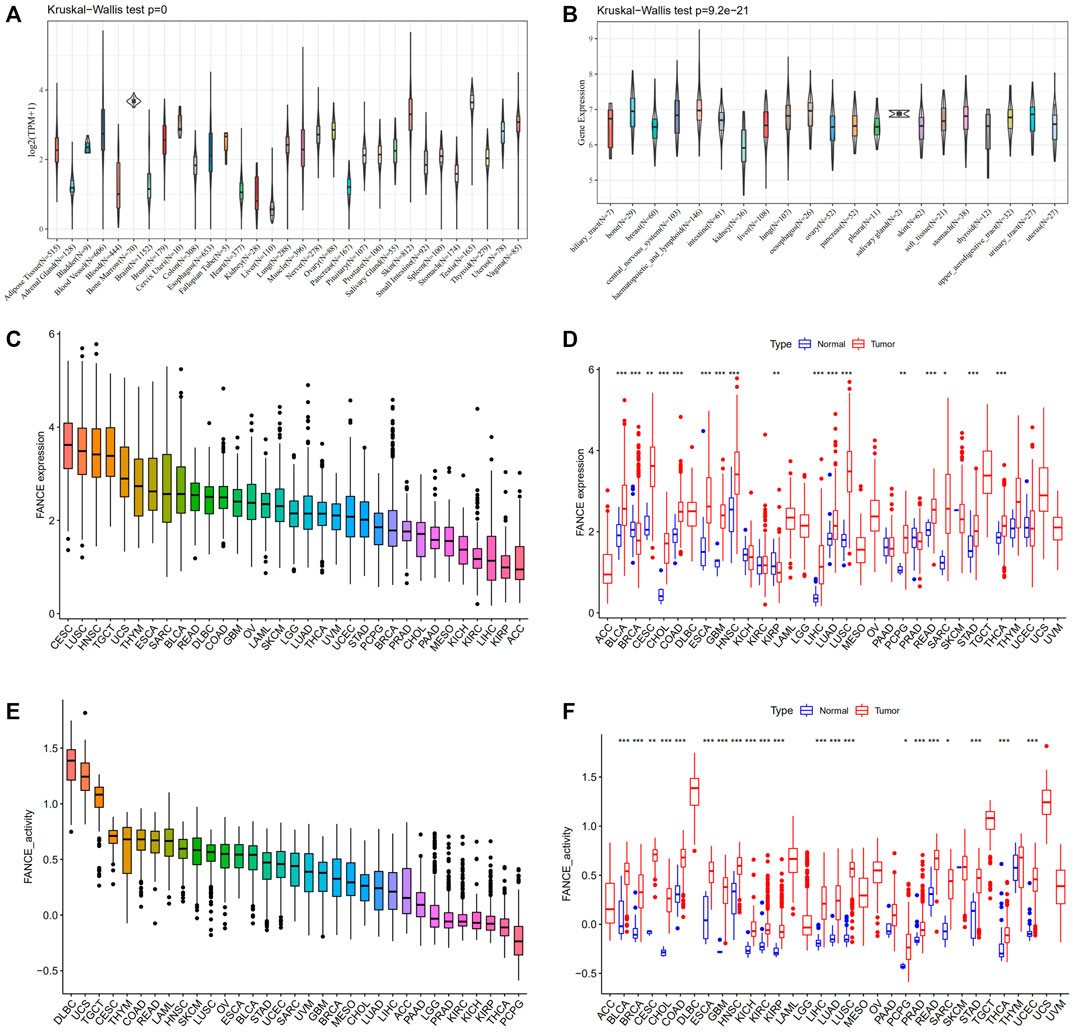
FIGURE 1. Expression and gene activity scores of FANCE. (A) FANCE expression in 31 normal tissues from the Genotype Tissue-Expression (GTEx) database. (B) FANCE expression in 21 tumor cell lines from the Cancer Cell Line Encyclopedia (CCLE) database. (C) The expression of FANCE in 33 cancers ranked from highest (left) to lowest (right) in the TCGA database. (D) The expression of FANCE in 33 cancers compared to normal tissues from The Cancer Genome Atlas (TCGA) database. (E) Gene activity scores of FANCE in 33 cancers ranked from highest (left) to lowest (right) based on TCGA and sngle-sample gene set enrichment analysis (ssGSEA). (F) Gene activity scores of FANCE in 33 cancers compared to normal tissues based on TCGA and ssGSEA. *p < .05; **p < .01; and ***p < .001.
As shown in Figure 2, FANCE staining was higher in prostate, testis, and cervical cancers than in normal tissues. In addition, FANCE staining was lower in renal cancer than in normal tissues. These results were consistent with gene expression. FANCE staining observed no difference in endometrial, ovarian, lung, and gastric cancers compared with normal tissue.
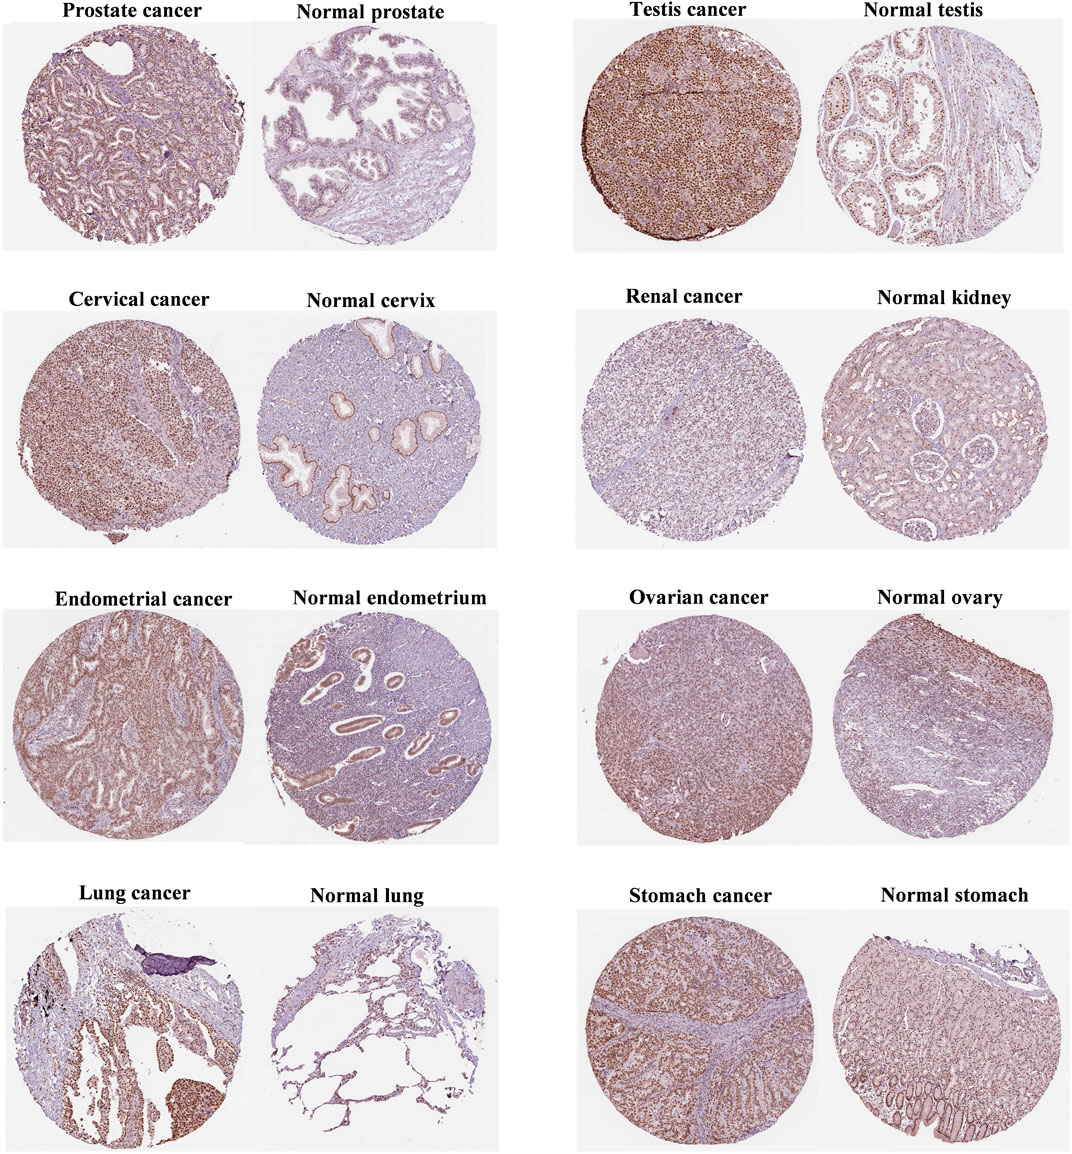
FIGURE 2. Immunohistochemistry of FANCE protein expression between tumor and normal tissues from the Human Protein Atlas (HPA) database.
3.2 Biological functions of FANCE expression
FANCE mainly upregulated signaling pathways in 11 tumors and downregulated signaling pathways in 22 tumors (Figure 3, Supplementary Figure S1). FANCE negatively regulated antigen processing and presentation pathway CESC and positively regulated autoimmune thyroid disease in OV. FANCE inhibited DNA replication and cell cycle in UCEC. FANCE negatively regulated T cell receptor signaling pathway in USC. FANCE positively regulated cell cycle, natural killer cell mediated cytotoxicity and primary immunodeficiency in BRCA. FANCE positively regulated cell cycle in STAD. These results suggest that FANCE functions in tumors by regulating immune function and DNA replication pathways, and so on.
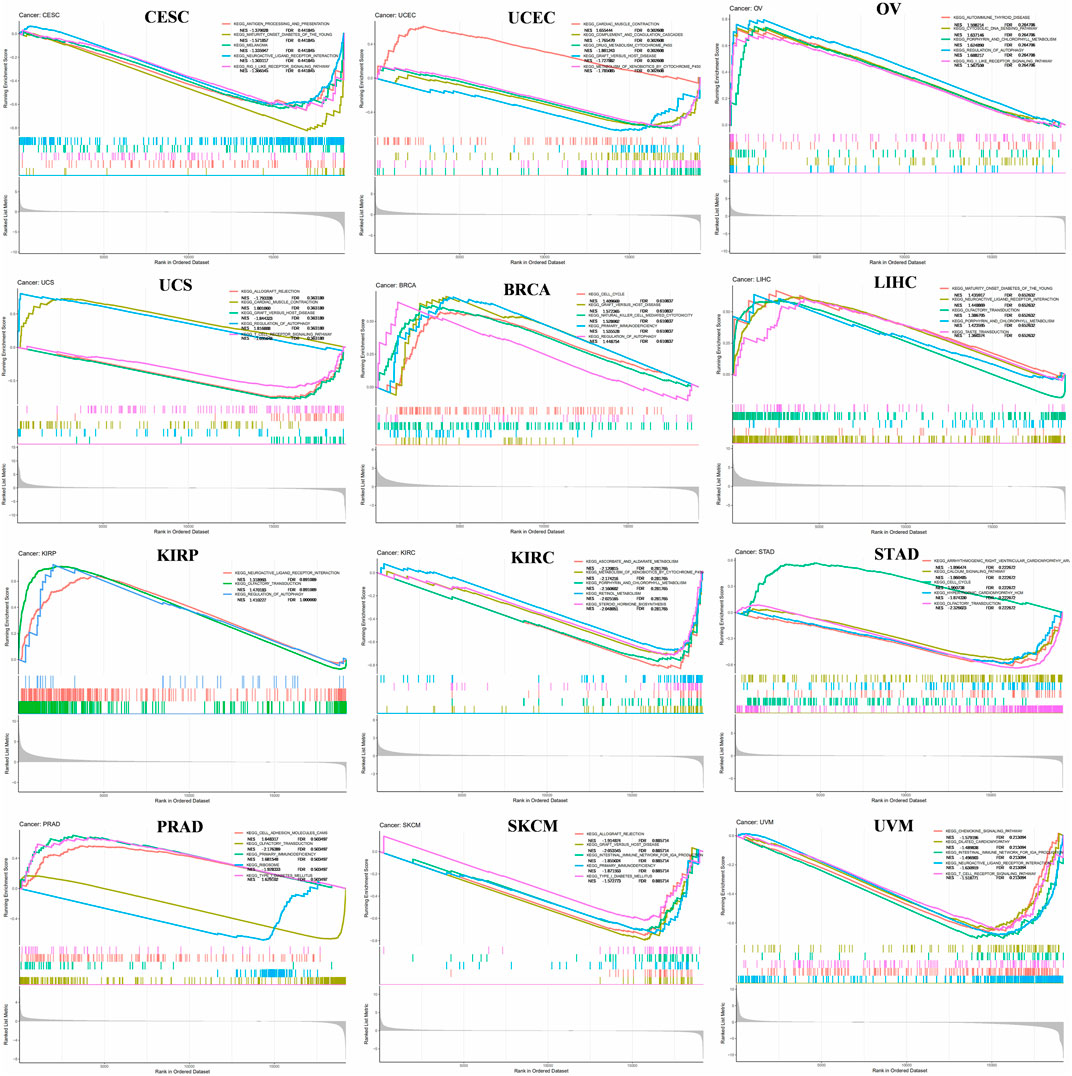
FIGURE 3. Gene set enrichment analysis (GSEA) of FANCE expression in cancers. The top five most relevant signaling pathways in the Kyoto Encyclopedia of Genes and Genomes (KEGG) dataset were displayed. Normalized Enrichment Score (NES) value and FDR value (qvalue) were displayed. Peaks on the upward curve indicate positive regulation and peaks on the downward curve indicate negative regulation.
3.3 Prognostic value of FANCE expression
Survival analyses of FANCE expression were evaluated using Cox regression analysis and KM curves based on OS, DSS, DFI, and PFI as prognostic indicators. Cox regression analysis showed FANCE correlated with OS in UCEC, LIHC, ACC, KIRP, SARC, SKCM as a risky gene (HR > 1), and in LUSC, READ, UVM as a protective gene (HR < 1) (Figure 4A). KM curves indicated patients with high FANCE expression had shorter OS in UCEC, LIHC, ACC, CHOL, KIRP, PCPG, SKCM (Figures 4B, D–F, H–J). Conversely, patients with high FANCE expression had longer OS in CESC, LUSC, UVM (Figures 4C, G, K). FANCE was associated with DSS in UCEC, LIHC, ACC, KIRP, PCPG, SARC, SKCM (HR > 1), and UVM, LUSC (HR < 1) (Figure 5A). Patients with high FANCE expression exhibited shorter DSS in LIHC, PRAD, ACC, KIRP, PCPG (Figures 5B–F), and exhibited longer DSS in UVM (Figures 5G). FANCE correlated with PFI in UCEC, LIHC, PRAD, ACC, KIRP as a risky gene (HR > 1), and in UCS, UVM, LUSC as a protective gene (HR < 1) (Figure 6A). PFI was shorter in patients with high FANCE expression in UCEC, LIHC, PRAD, ACC, KIRP, PAAD, and PCPG (Figures 6B, E–J), but longer in CESC, GBM, and UVM (Figures 6C, D, K). (Braun et al., 2016) FANCE correlated with DFI in UCEC, LIHC (HR > 1), and in UCS (HR < 1) (Figure 7A). LIHC patients with high FANCE expression had shorter DFIs (Figure 7B). These results suggest that high expression of FANCE affects the prognosis of multiple tumors. It is particularly associated with the shorter survival of UCEC and LIHC and the longer survival of CESC.
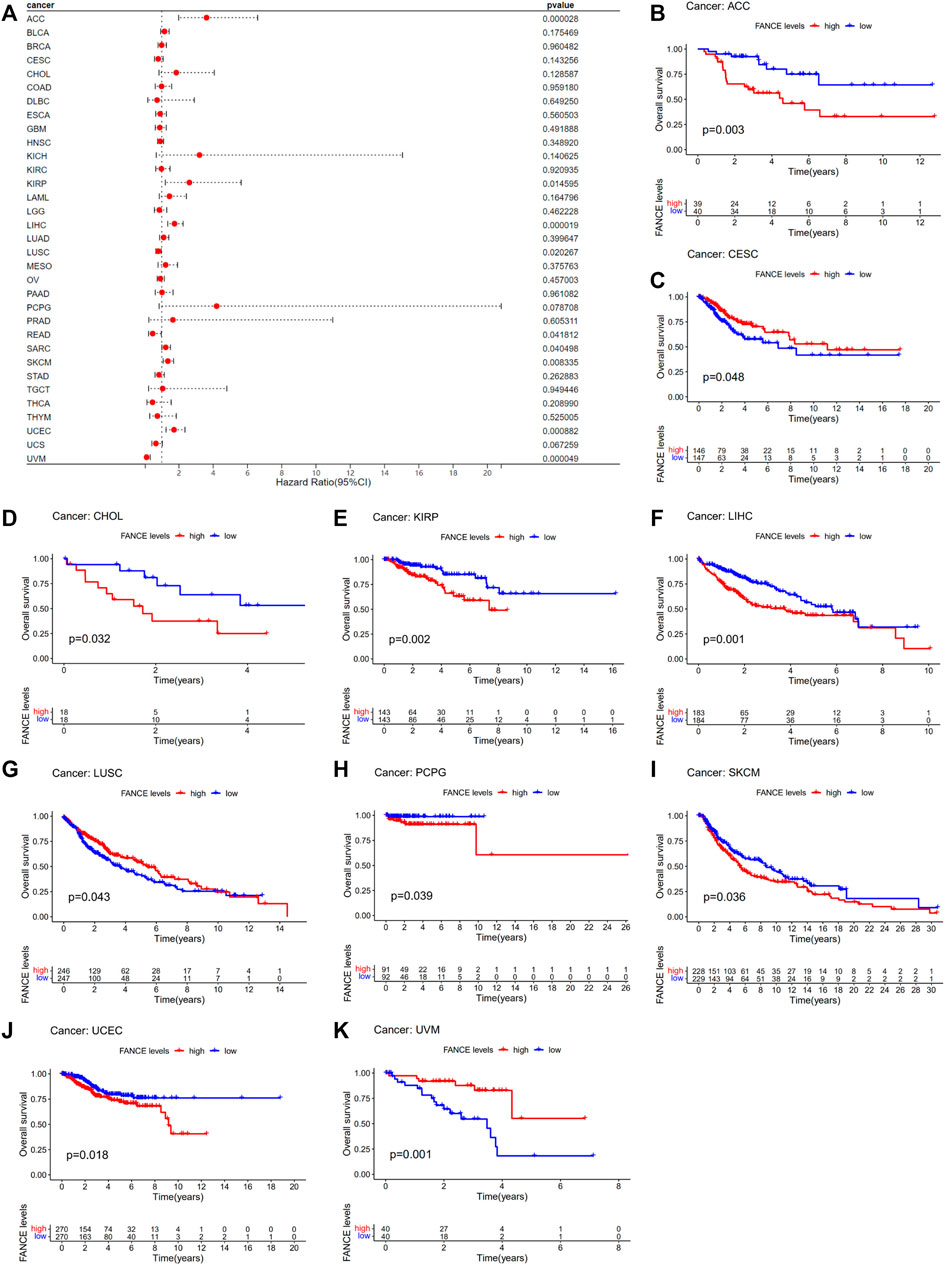
FIGURE 4. Correlation between FANCE expression and overall survival (OS) using data from the TGCA database. (A) Forest plot of FANCE expression and OS in 33 cancers. (B–K) The Kaplan–Meier survival analysis for FANCE expression and OS in 10 cancers. *p < .05; **p < .01; and ***p < .001.
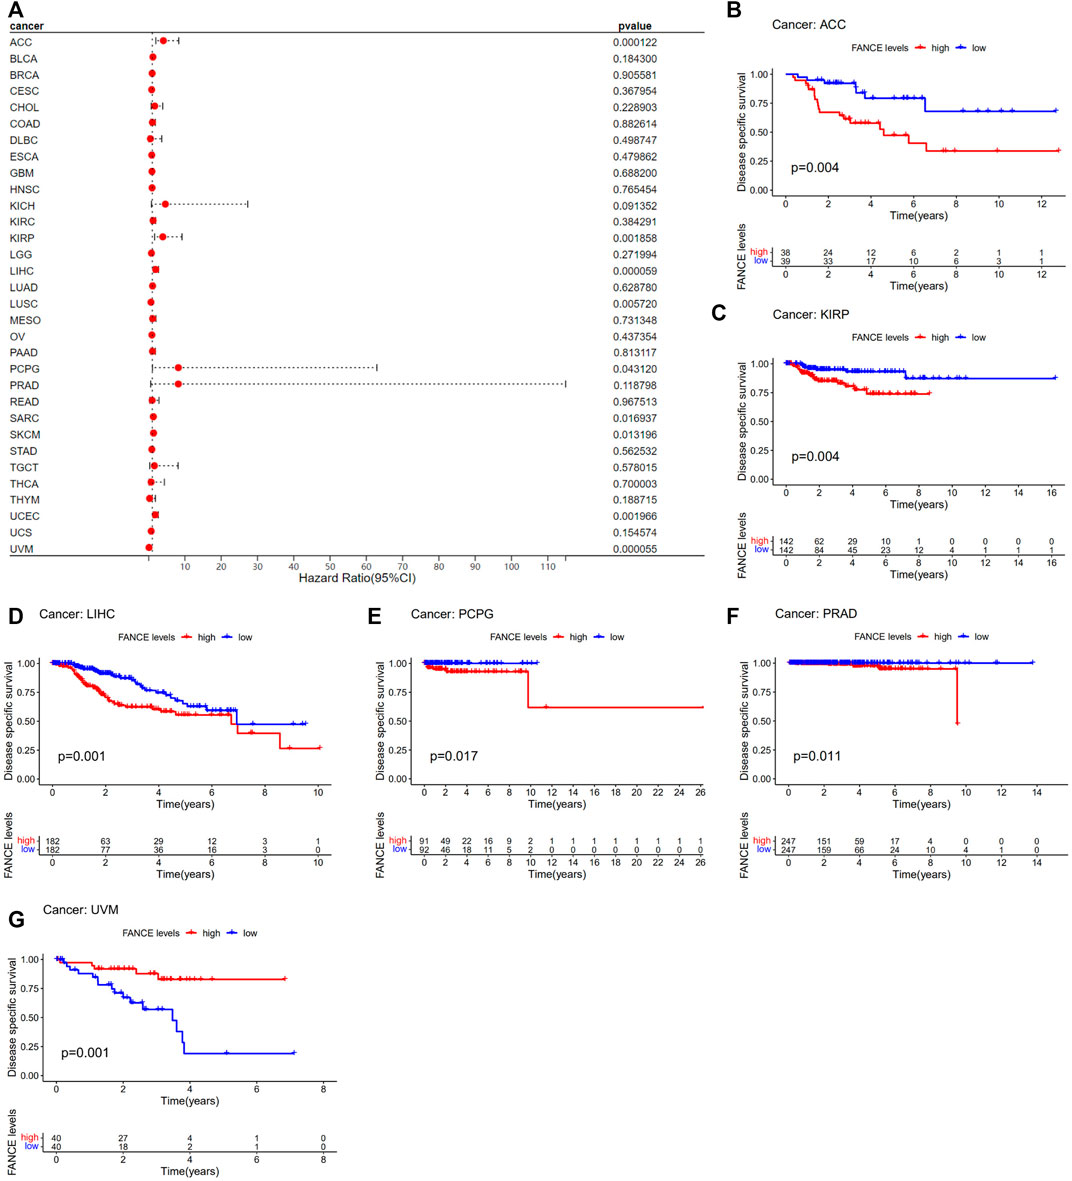
FIGURE 5. Correlation between FANCE expression and disease-specific survival (DSS) using data from the TGCA database. (A) Forest plot of FANCE expression and DSS in 32 cancers. (B–G) The Kaplan–Meier survival analysis for FANCE expression and DSS in six cancers. *p < .05; **p < .01; and ***p < .001.
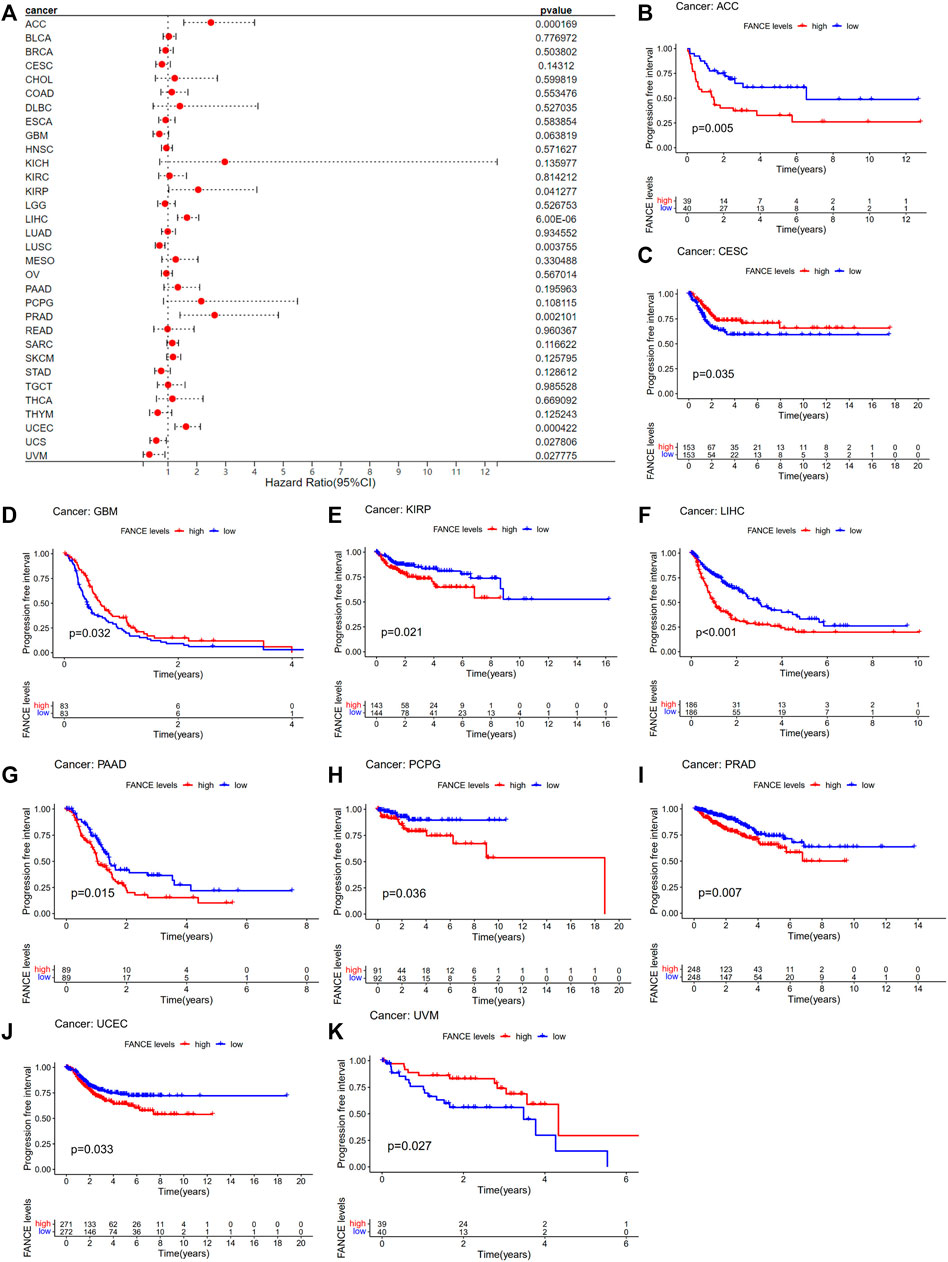
FIGURE 6. Correlation between FANCE expression and progression-free interval (PFI) using data from the TGCA database. (A) Forest plot of FANCE expression and PFI in 32 cancers. (B) The Kaplan–Meier survival analysis for FANCE expression and PFI in 10 cancers. *p < .05; **p < .01; and ***p < .001.
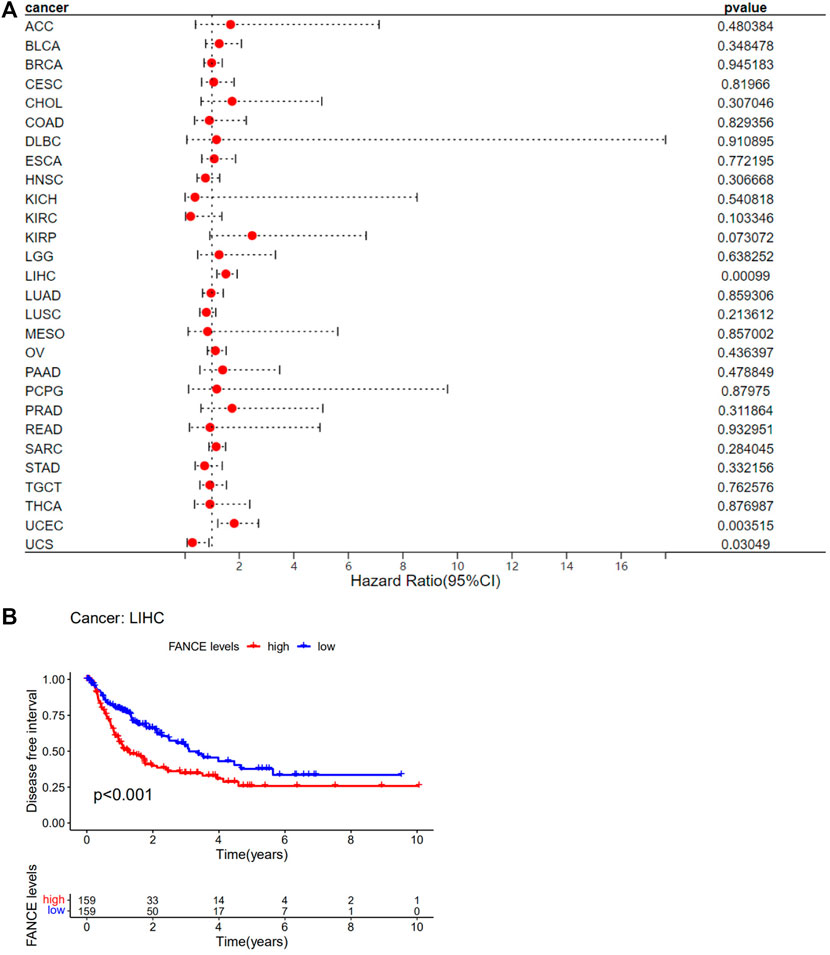
FIGURE 7. Correlation between FANCE expression and disease-free interval (DFI) using data from the TGCA database. (A) Forest plot of FANCE expression and DFI in 32 cancers. (B) The Kaplan–Meier survival analysis for FANCE expression and DFI in LIHC. *p < .05; **p < .01; and ***p < .001.
We analyzed FANCE and clinical phenotype. Studies have shown people over 65 years old have significantly increased cancer incidence and mortality, such as endometrial cancer and ovarian cancer (Ries, 1993; Yancik, 1993; Braun et al., 2016). We found that patients aged 65 and older had higher FANCE expression in OV, UCEC, CHOL, PRAD, and STAD, while expression was lower in BRCA, ESCA, HNSC, KIRP, and LIHC (Figure 8A). We also analyzed whether FANCE expression was substantially linked with the TNM stage in LIHC, BRCA, HNSC, and KICH (Figure 8B). Males had higher FANCE expression in KIRP, KIRP, and THCA, and females had higher FANCE expression in HNSC, LAML, and LUSC (Figure 8C). Further, these findings indicate that FANCE expression is clinically significant in a wide variety of tumors.
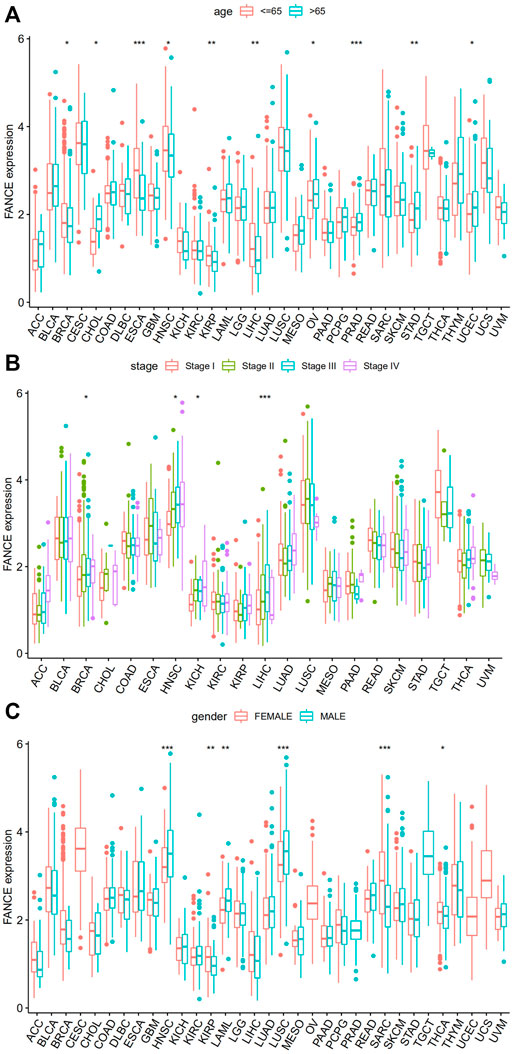
FIGURE 8. Correlation between FANCE expression and (A) age, (B) stage, and (C) gender in 33 cancers from TCGA database. *p < .05; **p < .01; and ***p < .001.
3.4 FANCE expression and tumor immunity infiltration
We analyzed FANCE expression and TME, TIICs, immune-regulated genes, and immune checkpoint genes to investigate tumor immunity. We calculated stromal, immune, and estimate scores to analyze FANCE expression and TME. Results reveal that FANCE expression was significantly negatively correlated with both immune scores and stromal scores in UCEC, OV, LUSC, GBM, SARC, SKCM, HNSC, STAD, LGG, LUAD, PCPG, UVM, and THCA, but was opposite in PRAD. In CESC, LIHC, BRCA, and TGCT, FANCE expression was negatively related to stromal scores. The top eight cancers with significant associations between FANCE expression and TME were displayed in Figure 9A, including LUAD, STAD, HNSC, PCPG, GBM, LGG, SARC, and LUSC. These indicated that high FANCE expression correlates with less stromal and immune cell infiltration, leading to high tumor purity in the vast majority of tumors.
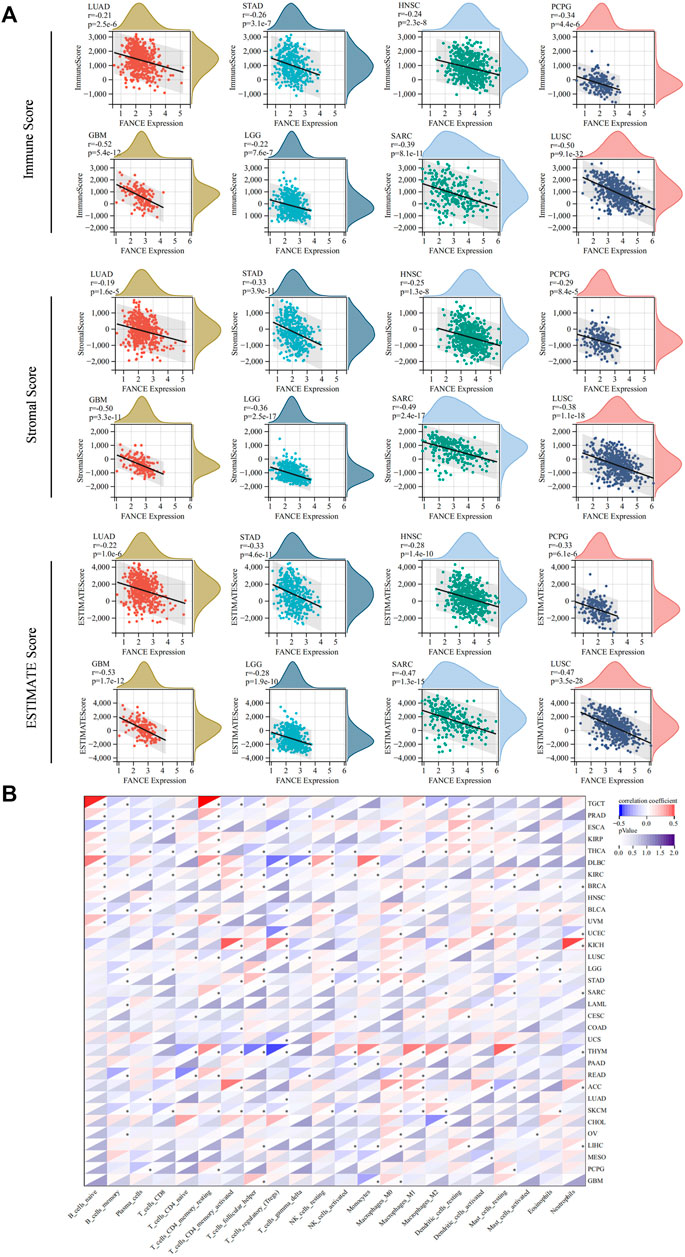
FIGURE 9. Tumor microenvironment (TME) and tumor-infiltrating immune cells (TIICs) analysis with FANCE expression in pan-cancer. (A) Correlation between FANCE expression and the immune Score, stromal Score, and ESTIMATE score in TME. The top eight cancers with the most significant association were displayed, including LUAD, STAD, HNSC, PCPG, GBM, LGG, SARC, and LUSC. (B) Correlation between FANCE expression and the proportion of 22 types of TIICs. *p < .05; **p < .01; and ***p < .001.
We next analyzed the correlation between FANCE expression and the infiltration levels of 22 immune cells. Our results suggest that immune cell infiltration levels were associated with FANCE expression in most cancers (Figure 9B). We found diverse correlations between FANCE expression levels and different subsets of infiltrating T cells. FANCE expression was negatively linked with the infiltration of CD8 T cells in UCEC, LGG, and ESCA. FANCE expression was also negatively correlated with the infiltration of Treg cells in UCEC, USC, ESCA, THYM, and DLBC. However, it was positively associated with levels of infiltrating CD4 T cells in ACC, KICH, KIRC, and UVM. Further, FANCE expression levels were connected with multiple different subgroups of infiltrating macrophages. FANCE expression was positively correlated with the levels of infiltrating M0 macrophages in UCEC, OV, LIHC, LGG, and ACC. It was also positively associated with the levels of infiltrating M1 macrophages in CESC, BRCA, THYM, ACC, and READ. These results suggest that FANCE is highly associated with immune cell infiltration in the majority of tumors.
We conducted gene co-expression analyses to explore the relationships between FANCE expression and immune-related genes in 33 tumors. These genes encoded chemokine, chemokine receptor, MHC, immunoinhibitor, and immunostimulator genes. These results indicated that almost all immune-related genes were co-expressed with FANCE (Figure 10A). The majority of immune-related genes were highly associated with FANCE in LIHC, ACC, LUAD, STAD, LAML, KIRP, KIRC, and CHOL, while negatively associated with FANCE in CESC, GBM, LGG, and TGCT. Results showed MHC genes, including TAPBP, TAP1, and TAP2, were highly positively correlated with FANCE in most cancers. Regarding immunoinhibitor genes, FANCE expression was significantly positively correlated with KDR, TGFBR1, PVRL2, TGFB1, ADORA2A, and IL10RB. As for immunostimulator genes, FANCE was significantly positively linked with C10orf54, CD40, CD276, PVR, IL6R, TNFRSF13C, MICB, TNFRSF25, and ULBP1. These findings suggested that FANCE could be involved in regulating tumor immune responses by altering the activity of immune genes.
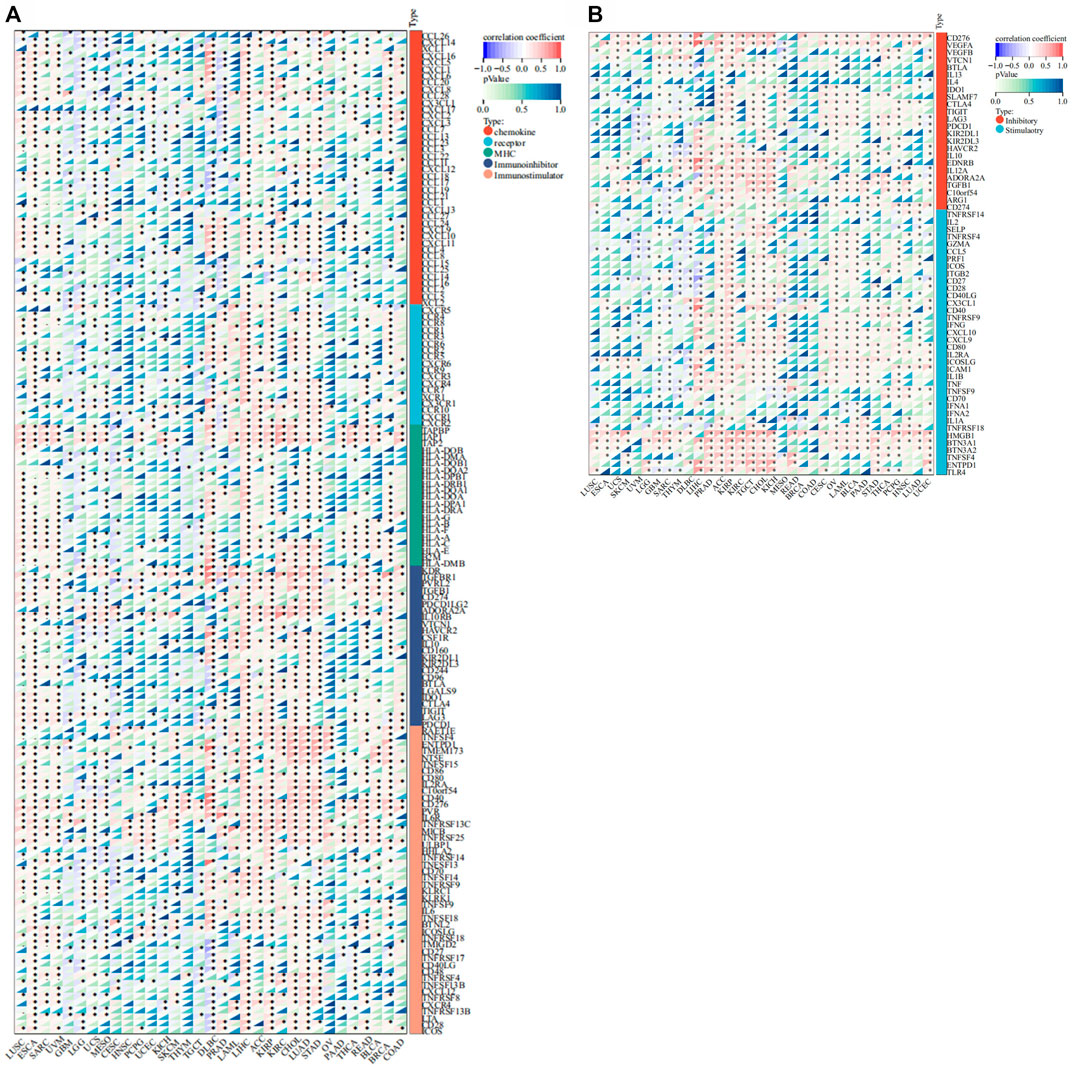
FIGURE 10. Co-expression of FANCE and immune regulated genes. (A) Co-expression of FANCE and 150 immune moderator genes of five immune pathways (chemokine (41), receptor (18), MHC (21), immunoinhibitor (24), immunostimulator (46)) in 33 cancers. (B) Co-expression of FANCE with 60 immune checkpoint pathway genes (Inhibitory (24) and Stimulatory (36)) in 33 cancers. *p < .05; **p < .01; and ***p < .001.
Furthermore, FANCE correlated positively with the majority of immune checkpoint genes in CESC, OV, UCEC, LIHC, BRCA, KIRP, KIRC, ACC, TGCT, BLCA, STAD, PCPG, HNSC, LUAD, while negatively correlating with UCS, GBM, LGG, UVM, THYM, DLBC. FANCE was significantly positively linked with the immune checkpoint stimulatory genes HMGB1, BTN3A1, and BTN3A2. As for immune checkpoint inhibitory genes, FANCE was significantly positively correlated with CD276, VEGFA, and TGFB1 (Figure 10B). The results indicated that FANCE contributes to regulating the immune checkpoint inhibitor (ICI) therapy response in these cancers. FANCE was linked to ICIs containing PD-L1/CD274, PD-1/PDCD1, and CTLA4 in UCEC, OV, BRCA, HNSC, STAD, LUAD, TGCT, LTHC, KIRP, KIRC. In CESC, FANCE was positively associated with PD-L1 and CTLA4. The results indicated that FANCE regulation of ICI therapy response might be related to cancer prognosis in these cancers.
3.5 FANCE expression and tumor immunotherapy responses
We further analyzed FANCE expression and MSI, TMB, and neoantigens to predict the tumor immunotherapy responses. There are important connections between MSI and ICI therapy sensitivity. Higher TMB results in more neoantigens, increased T cell recognition, and better ICI therapy outcomes (Jardim et al., 2021). Neoantigens were used as markers in cancer immunotherapy that enhance T cell reactivity against these antigens (Schumacher and Schreiber, 2015). FANCE expression was positively associated with MSI in seven cancers including UCEC, UCS, STAD, BRCA, BLCA, LUSC, SARC, and negatively in DLBC, TGCT (Figure 11A). FANCE expression was positively correlated with TMB in 22 cancers, including UCEC, OV, ESCA, STAD, PRAD, BRCA, PAAD, ACC, BLCA, COAD, GBM, HNSC, KICH, KIRC, KIRP, LGG, LUAD, MESO, READ, SARC, SKCM, THYM (Figure 11B). FANCE correlated positively with neoantigens in UCEC, STAD, BRCA, HNSC, LGG, and negatively in THCA (Figure 11C). Results showed FANCE expression was highly positively associated with MSI, TMB, and neoantigens in UCEC, BRCA, and STAD especially. The results indicate FANCE may regulate ICI therapy response and inspire new therapies development for these cancers.
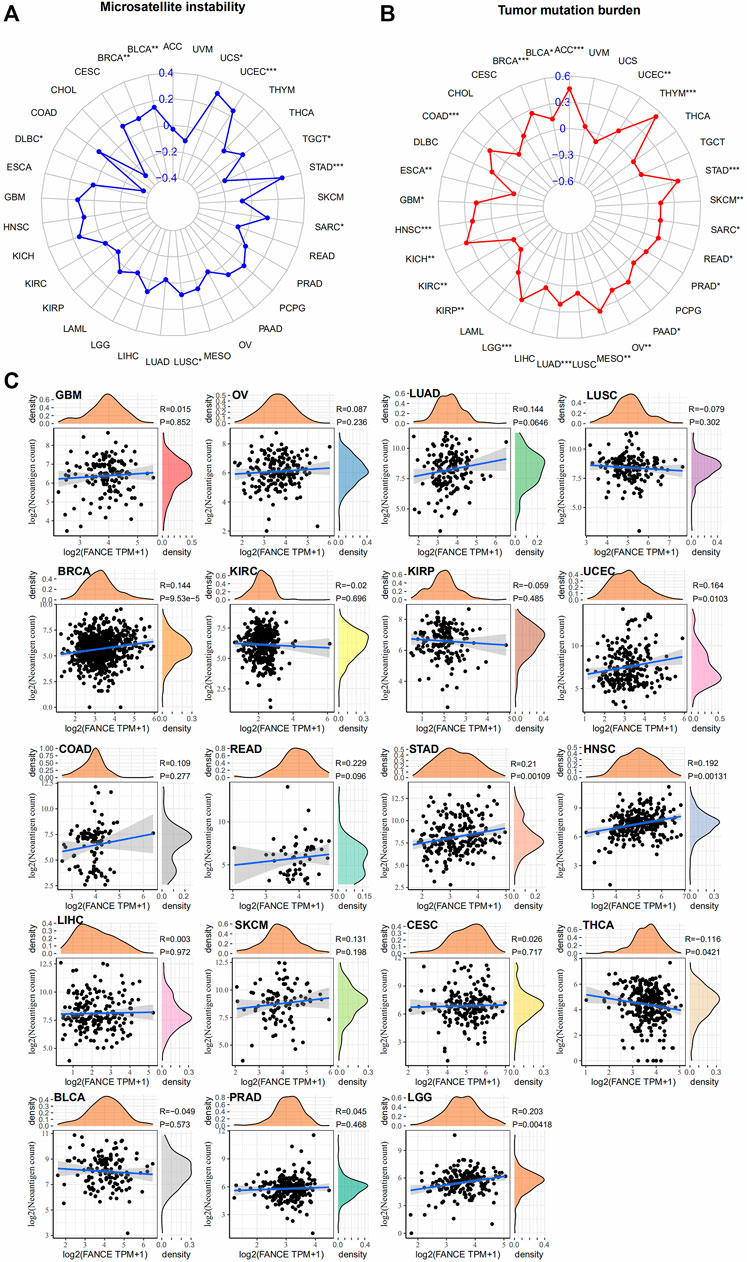
FIGURE 11. Correlation between FANCE expression and microsatellite instability (MSI) (A), tumor mutation burden (TMB) (B), and neoantigens (C) analysis in pan-cancer. *p < .05; **p < .01; and ***p < .001.
3.6 ScRNA-seq data analysis identified the expression and function of FANCE
We further evaluated FANCE expression in different cells of the tumor microenvironment using single-cell RNA sequencing data from the GEO database. Three cancers, including endometrial cancer, cervical cancer, and ovarian cancer, with correlations with clinical phenotype and tumor immunity, were further analyzed. Our results showed that in endometrial cancer, FANCE was expressed in cancer cells, fibroblasts, endothelial cells, and T cells (Figure 12A). In ovarian cancer, FANCE was predominantly present in cancer cells, with a minority distributed in fibroblasts, T cells, and macrophages (Figure 12B). In cervical cancer, FANCE was mainly expressed in cancer cells and less abundant in T cells (Figure 12C). These are consistent FANCE expressions that correlate negatively with TME in UCEC, CESC, and OV. FANCE’s role in tumor immunity appears to be achieved by altering the function of cancer cells in these cancers. At the immune cell level, it may be mediated by T cells and macrophages. In addition, we explored that FANCE functions in cancers by downregulating DNA repair and DNA damage, and upregulating angiogenesis at the single-cell level using the CancerSEA database (Figure 12D).
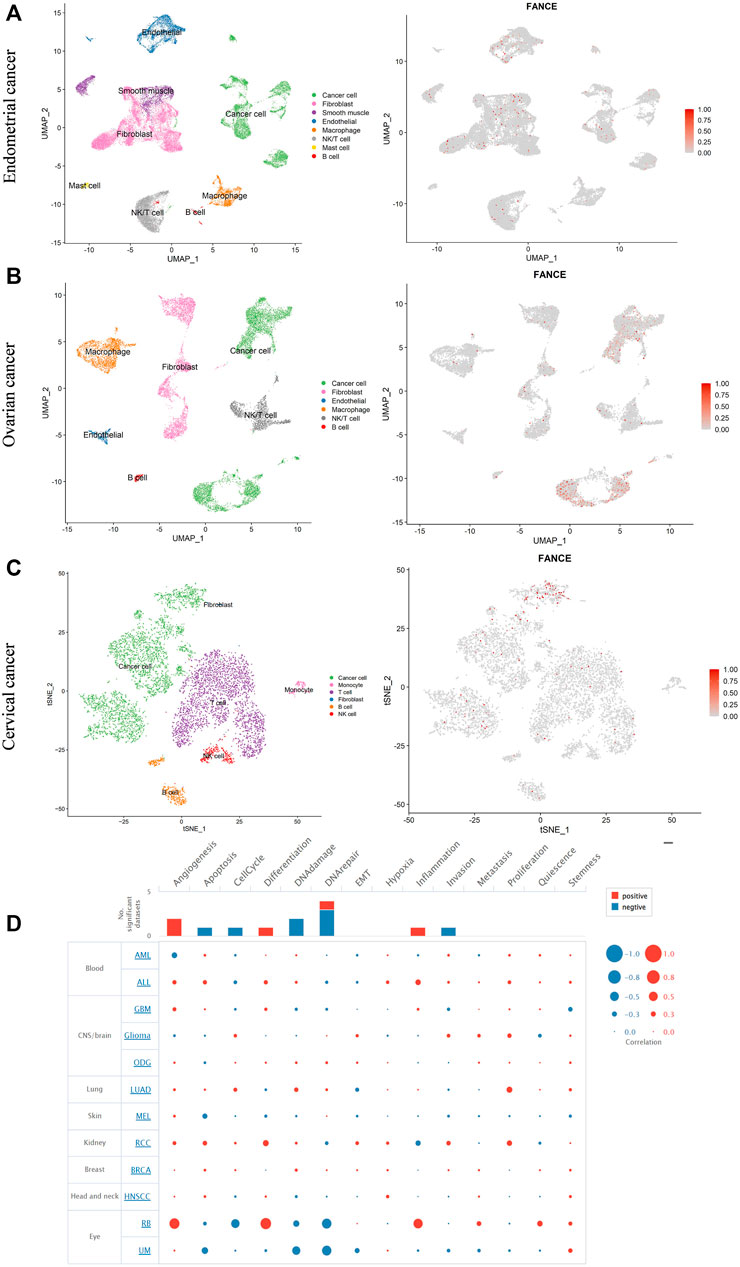
FIGURE 12. Single-cell RNA sequencing data analyze the expression of FANCE in different cells in endometrial cancer (A), ovarian cancer (B), and cervical cancer (C) based on the Gene Expression Omnibus (GEO) database. (D) The function of FANCE at the single cell level investigated by the cancer single-cell atlas (CancerSEA) database.
3.7 Fance gene mutant mice increased tumor susceptibility
FA genes were associated with cancer predisposition. Especially mutations in BRCA1/FANCS and BRCA2/FANCD1 caused ovarian cancer and breast cancer in women. We generated a cohort of female Fance homozygous mutant (Fance−/−) mice, Fance heterozygous mutant (Fance+/−) mice, and wild-type (Fance+/+) mice for long-term monitoring to determine tumor prone of Fance mutant. Tumors (93.5% were sweat gland carcinomas) were detected in 85.7% (24/28) of Fance+/− mice, 27.3% (3/11) of Fance+/+ mice, and 22.2% (4/18) of Fance−/− mice (Table 1; Figure 13C). Fance+/− mice had increased tumor incidence than Fance−/− and Fance+/+ mice (p < .05). Survival analysis showed that Fance+/− had shorter OS and tumor-free survival (TFS) than Fance−/− and Fance+/+ mice (p < .05) (Figures 13A, B). The OS of Fance+/+ mice was shorter than Fance−/− mice (p < .05). Two Fance−/− mice had tumors located at their tails, and one had ovarian tumors. A Fance+/+ mouse detected lung tumors with sweat gland carcinoma (Figure 13D). The liver, spleen, stomach, kidney, ovary, and skin tissues of other mice found no obvious abnormalities (Supplementary Figure S2). These results indicated that Fance+/− mice had increased carcinogenesis and shorter survival. Deeper studies are needed to prove results definitively.
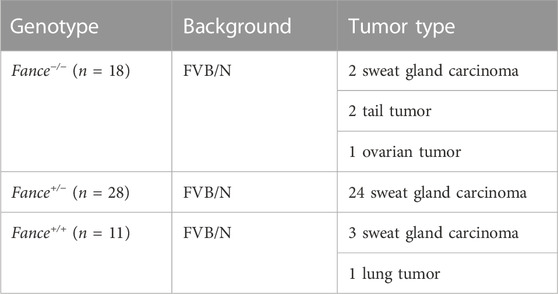
TABLE 1. Increased cancer incidence in Fance−/−, Fance+/−, and Fance+/+ female mice
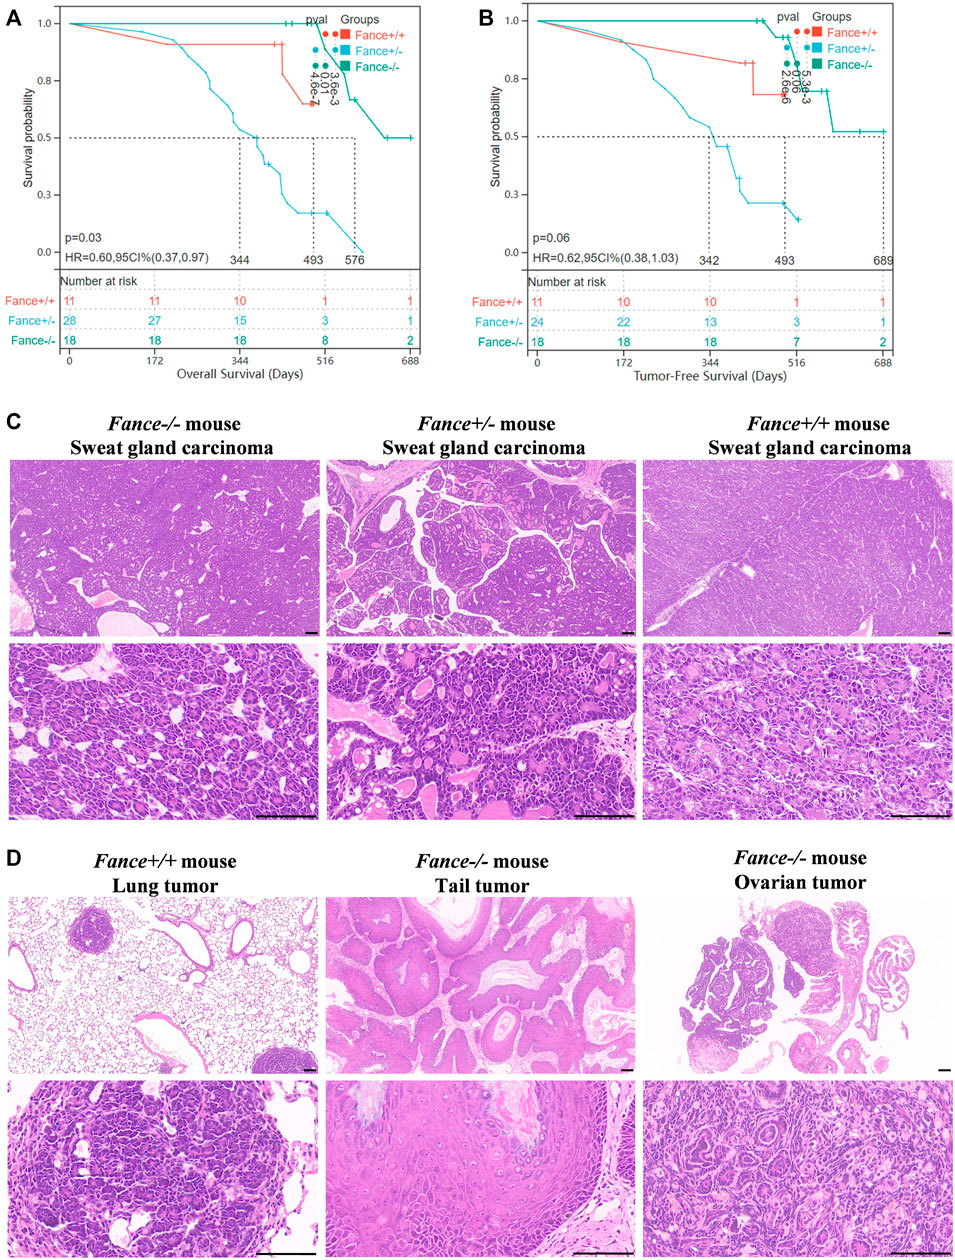
FIGURE 13. Survival curves and histology of carcinomas in Fance homozygous mice, Fance heterozygote mice, and wild-type mice with FVB/N background. Overall survival curves (A) and tumor-free survival curves (B) of the Fance−/−, Fance+/-, and Fance+/+ mice cohort. p values were determined by the Log-rank test. p < .05 was considered significantly different. (C) H&E-stained paraffin-embedded sections of sweat gland carcinoma in Fance−/−, Fance+/-, and Fance+/+ mice cohort. (D) Histology of tumors located at lung in Fance+/+ mice. Histology of tumors located at tail and ovary in Fance−/− mice. All scale label = 100 um.
4 Discussion
FA genes play an influential role in tumor prognosis and immunity. However, the role of FANCE in tumors remains uncertain. We performed a pan-cancer analysis of FANCE expression with the prognostic and immunological role in 33 different cancers based on information extracted from databases. Additionally, we explored the tumorigenesis phenomenon of Fance using mutant mice.
FANCE may serve as a prognostic biomarker. Our results suggest that FANCE has clinical associations with a variety of cancers. High FANCE expression correlated with poor prognosis in UCEC, LIHC, ACC, CHOL, KIRP, PCPG, SKCM, PRAD, and PAAD, while it correlated with better prognosis in CESC, LUSC, and UVM. We found FANCE expression correlated with shorter OS and PFI in UCEC and longer OS and PFI in cervical cancer. A previous study showed FANCE was an independent factor in predicting poor prognosis in LIHC (Takahashi et al., 2022). Our data suggested LIHC patients with high FANCE (regarded as a risky gene) expression had shorter OS, DSS, DFI, and PFI. These results were consistent with previous results. Patients with the FANCE variant had better prognosis for non-small cell lung cancer (Mo et al., 2022). We found high FANCE expression in LUSC was associated with longer OS and served as a protective factor in OS, DSS, and DFI. Moreover, FANCE served as a risky gene and correlated with shorter survival in UCEC (shorter OS and PFI) and PRAD (shorter PFI). We discovered patients over 65 had higher FANCE expression in UCEC and PRAD. These results indicated that elevated FANCE expression may be related to increased mortality in these cancers. While we found high FANCE expression correlated with longer OS and PFI in CESC and UVM. The expression and gene activity scores of FANCE were higher in CESC than in normal tissues. The role of FANCE in cervical cancer should be further studied. Further, patients with FA gene defects were more likely to develop human papillomaviruses (HPV) associated squamous cell carcinoma at multiple anatomical sites, including the HNSC (Kutler et al., 2003a; Kutler et al., 2003b; Lowy and Gillison, 2003; Rosenberg et al., 2003). HPV was identified as a significant positive prognostic factor for females with some solid tumors (Preissner et al., 2022). Our study found that females have higher FANCE expression in HNSC, these may help explain the lower incidence compared to males (Carazo-Casas et al., 2022).
FANCE expression regulated TIICs infiltration related to cancer prognosis. CD8 T cells exert cytotoxic effects on tumor cells by activating their apoptosis mechanisms (Farhood et al., 2019). FA genes significantly prolong the OS of cervical cancer by promoting the infiltration of CD8 T cells and memory T cells (Wang et al., 2021). Treg cells suppress aberrant immune responses and anti-tumor immune responses and are associated with poor prognosis (Tanaka and Sakaguchi, 2017). Our analysis of endometrial cancer scRNA-seq results showed that FANCE was expressed in T cells. High FANCE expression in endometrial cancer was correlated with reduced CD8 T cells and raised Treg cells infiltration. These may be related to poor prognosis. Previous studies have shown that fibroblasts maintain frequent communication with cancer cells to promote the development of endothelial cancer (Yu et al., 2022). We also found FANCE is predominantly expressed in fibroblasts and correlated with poor prognosis in endometrial cancer according to scRNA-seq analysis. M1 macrophages enhance cytotoxicity and activate cytotoxic T cells to eliminate tumor cells, while M2 macrophages contribute to cancer development (Chen et al., 2018). High FANCE expression in cervical cancer was positively associated with M1 macrophage infiltration, consistent with its favorable prognosis. According to our scRNA-seq analysis of cervical cancer cells, FANCE was expressed mainly in cancer cells and less in T cells. As a result, more research is needed to explore the relationship between FANCE’s effect on the immune microenvironment and its prognostic value in cervical cancer.
FANCE expression was associated with immunotherapy responses. PD-1 and CTLA-4 immune checkpoint blockers have been shown in studies to improve the survival of patients with recurrent or metastatic cervical cancer (Allouch et al., 2020; Ferrall et al., 2021). In cervical cancer, FANCE expression was positively correlated with PDL1 and CTLA4. Binding to PD-L1 ligand, PD-1 inhibits intracellular signaling in effector T cells and Treg cells, mediates T cell apoptosis, or induces T cell dysfunctional states, which decrease tumor immunity and promote tumor survival (Keir et al., 2008; Wei et al., 2017). T cells release CTLA4, which binds to antigen-presenting cells B7-1/B7-2 (Tai et al., 2012). Blockade of CTLA4 promotes therapeutic response for T cell activation against tumor cells (Waldman et al., 2020). It suggested ICI therapy may be effective and promote a better prognosis for cervical cancer with high expression of FANCE. Blockade of PD-1 and PD-L1 immune checkpoints led to better outcomes in high-grade serous ovarian cancer and recurrent or metastatic endometrial cancer (Post et al., 2020; Wan et al., 2021). FANCE expression in ovarian cancer and endometrial cancer might enhance ICIs therapy response since positively correlated with PD-1 and PD-L1.
FANCE expression might also enhance immunotherapy response due to its positive relation to MSI, TMB, and neoantigens. FANCE expression was positively correlated with MSI in seven cancers, especially in endometrial cancer and gastric cancer. Nearly 30% of primary endometrial cancer were MSI-high (MSI-H). PD-1 inhibitor is more effective against MSI-H than against microsatellite stable (MSS) in advanced endometrial cancers (Green et al., 2020). Approximately 4%–20% of gastroesophageal cancer exhibit MSI, and ICIs therapy was effective against MSI-H tumors (van Velzen et al., 2020; Joshi and Badgwell, 2021). We hypothesize FANCE expression enhances the effectiveness of immunotherapy in cancers with positive MSI. The objective response rate of anti-PD-1 or anti-PD-L1 therapy in 55% of cancers was positively correlated to TMB, in a study involving 27 cancers (Yarchoan et al., 2017). In a study of 1,48,803 tumor samples, MSS/TMB-high tumors were more prevalent than MSI-H cancers and benefited more from immunotherapy (Goodman et al., 2019). As a result of our research, FANCE expression was positively correlated with TMB in 22 cancers containing endometrial cancer, gastric cancer, ovarian cancer and breast cancer, and so on. Immunotherapies might be more effective in these cancers. FANCE expression positively correlated with neoantigens in endometrial cancer, gastric cancer, ovarian cancer, and breast cancer. These results may inspire the development of immunotherapies that selectively activate T cells against these antigens.
FA gene mutations contributed to tumors including squamous cell carcinoma, breast cancer, and ovarian cancer (Milletti et al., 2020). Tumorigenesis is also observed in FA mutant animal models. Primary cancers have been observed in Fanca, Fancm, Fancf, Fancd1, and Fancd2 mutant mice, including ovarian adenocarcinomas, hepatocellular carcinomas, lymphomas, ovarian granulosa cell tumors, spindle-cell sarcomas, lung carcinomas, breast cancers, and histiocytic sarcomas (Houghtaling et al., 2003; Wong et al., 2003; Bakker et al., 2009; Bakker et al., 2012; Luo et al., 2014; Hartford et al., 2016). We observed tumors including sweat gland carcinomas, ovarian tumors, lung tumors, and tail tumors in Fance−/−, Fance+/−, and Fance+/+ mice. Fance+/− mice had increased tumor incidence and shorter survival than Fance−/− and Fance+/+ mice. The mechanisms of carcinogenesis associated with a dysregulation FA pathway are complicated, as FA proteins contribute to genome homeostasis associated with DNA repair and cell division proteins (Nalepa and Clapp, 2018). We speculate heterozygous mutations in the Fance gene cause its dysfunction to maintain genome homeostasis, resulting in increased tumorigenic responses and promoting tumor progression. Further studies are needed to understand the molecular mechanisms involved.
Our study had several limitations. First, we examined FANCE expression with prognosis, tumor immunity infiltration, and immunotherapy using bioinformatics methods. However, we lack in vitro experimental validation. Secondly, we examined tumorigenesis performed in a cohort of Fance mutant mice, while the sample size was relatively small and further verification requires for diagnosis and prognostic correlation analysis. Finally, the molecular mechanism of Fance tumorigenesis is complex and requires further investigation. The results of our bioinformatics analysis and validation by Fance mutant mice were only recommendations for future development.
In conclusion, this study systematically described the role of FANCE in different cancer types. Our results suggest that FANCE is correlated with clinical prognosis, immune infiltration, and immunotherapy in a variety of cancers. Further research is needed to verify the specific mechanisms involved. This study illustrates the role of FANCE in tumor development and provides a theoretical basis for more precise treatment in the future. In addition, the Fance mutant mouse model also offers potential value for more in-depth mechanistic exploration in the future.
Data availability statement
The datasets presented in this study can be found in online repositories. The names of the repository/repositories and accession number(s) can be found in the article/Supplementary Material.
Ethics statement
The animal study was reviewed and approved by the Laboratory Animal Welfare and Ethical Committee of Central South University (IACUC Number: 2020sydw1041).
Author contributions
Conception and design: ZZ and CF. Perform experiments: ZZ, HY, and SS. Perform bioinformatics analysis: ZZ and JH. Data interpretation and manuscript writing: ZZ and CF. Funding acquisition: CF. Supervision: CF. Final approval of manuscript: all authors.
Funding
This research was supported by the National Natural Science Foundation Project of China (81771546 and 82271674), Natural Science Foundation of Hunan Province (2022JJ30804), Clinical medical technology innovation guidance project of Hunan Provincial, Science and Technology Department (2018SK52508 and 2020SK53404), Research Project of Hunan Provincial Health Commission (2021050120344), Construction project of graduate teaching case bank of Central South University (2021ALK47), Research on degree and postgraduate education and teaching reform of Central South University (2021JGB057).
Conflict of interest
The authors declare that the research was conducted in the absence of any commercial or financial relationships that could be construed as a potential conflict of interest.
Publisher’s note
All claims expressed in this article are solely those of the authors and do not necessarily represent those of their affiliated organizations, or those of the publisher, the editors and the reviewers. Any product that may be evaluated in this article, or claim that may be made by its manufacturer, is not guaranteed or endorsed by the publisher.
Supplementary material
The Supplementary Material for this article can be found online at: https://www.frontiersin.org/articles/10.3389/fgene.2022.1024989/full#supplementary-material
SUPPLEMENTARY FIGURE S1 | Gene set enrichment analysis of FANCE expression in cancers. The top 5 most relevant signaling pathways in the KEGG dataset were displayed.
SUPPLEMENTARY FIGURE S2 | Histology of liver, spleen, stomach, kidney, ovary, and skin tissues of Fance−/−, Fance+/−, and Fance+/+ female mice cohort and found no significant abnormalities. All scale label = 100 um.
References
Akbari, M. R., Malekzadeh, R., Lepage, P., Roquis, D., Sadjadi, A. R., Aghcheli, K., et al. (2011). Mutations in Fanconi anemia genes and the risk of esophageal cancer. Hum. Genet. 129 (5), 573–582. doi:10.1007/s00439-011-0951-7
Ali, A. M., Kirby, M., Jansen, M., Lach, F. P., Schulte, J., Singh, T. R., et al. (2009). Identification and characterization of mutations in FANCL gene: A second case of Fanconi anemia belonging to FA-L complementation group. Hum. Mutat. 30 (7), E761–E770. doi:10.1002/humu.21032
Allouch, S., Malki, A., Allouch, A., Gupta, I., Vranic, S., and Al Moustafa, A. E. (2020). High-risk HPV oncoproteins and PD-1/PD-L1 interplay in human cervical cancer: Recent evidence and future directions. Front. Oncol. 10, 914. doi:10.3389/fonc.2020.00914
Bakker, S. T., van de Vrugt, H. J., Rooimans, M. A., Oostra, A. B., Steltenpool, J., Delzenne-Goette, E., et al. (2009). Fancm-deficient mice reveal unique features of Fanconi anemia complementation group M. Hum. Mol. Genet. 18 (18), 3484–3495. doi:10.1093/hmg/ddp297
Bakker, S. T., van de Vrugt, H. J., Visser, J. A., Delzenne-Goette, E., van der Wal, A., Berns, M. A., et al. (2012). Fancf-deficient mice are prone to develop ovarian tumours. J. Pathol. 226 (1), 28–39. doi:10.1002/path.2992
Braun, M. M., Overbeek-Wager, E. A., Grumbo, R. J., Bremnes, R. M., Busund, L. T., Kilvær, T. L., et al. (2016). The role of tumor-infiltrating lymphocytes in development, progression, and prognosis of non-small cell lung CancerThe role of tumor-infiltrating lymphocytes in development. Am. Fam. PhysicianJ Thorac. Oncol. 9311 (66), 468789–474800. doi:10.1016/j.jtho.2016.01.015
Carazo-Casas, C., Gil-Prieto, R., Hernández-Barrera, V., and Gil de Miguel, Á. (2022). Trends in hospitalization and death rates among patients with head and neck cancer in Spain, 2009 to 2019. Hum. Vaccin Immunother. 18 (5), 2082192. doi:10.1080/21645515.2022.2082192
Che, R., Zhang, J., Nepal, M., Han, B., and Fei, P. (2018). Multifaceted Fanconi anemia signaling. Trends Genet. 34 (3), 171–183. doi:10.1016/j.tig.2017.11.006
Chen, D., Xie, J., Fiskesund, R., Dong, W., Liang, X., Lv, J., et al. (2018). Chloroquine modulates antitumor immune response by resetting tumor-associated macrophages toward M1 phenotype. Nat. Commun. 9 (1), 873. doi:10.1038/s41467-018-03225-9
Ding, J. J., Wang, G., Shi, W. X., Zhou, H. H., and Zhao, E. F. (2016). Promoter hypermethylation of FANCF and susceptibility and prognosis of epithelial ovarian cancer. Reprod. Sci. 23 (1), 24–30. doi:10.1177/1933719115612136
Fagerholm, R., Sprott, K., Heikkinen, T., Bartkova, J., Heikkilä, P., Aittomäki, K., et al. (2013). Overabundant FANCD2, alone and combined with NQO1, is a sensitive marker of adverse prognosis in breast cancer. Ann. Oncol. 24 (11), 2780–2785. doi:10.1093/annonc/mdt290
Farhood, B., Najafi, M., and Mortezaee, K. (2019). CD8(+) cytotoxic T lymphocytes in cancer immunotherapy: A review. J. Cell Physiol. 234 (6), 8509–8521. doi:10.1002/jcp.27782
Feng, L., and Jin, F. (2019). Expression and prognostic significance of Fanconi anemia group D2 protein and breast cancer type 1 susceptibility protein in familial and sporadic breast cancer. Oncol. Lett. 17 (4), 3687–3700. doi:10.3892/ol.2019.10046
Ferrall, L., Lin, K. Y., Roden, R. B. S., Hung, C. F., and Wu, T. C. (2021). Cervical cancer immunotherapy: Facts and hopes. Clin. Cancer Res. 27 (18), 4953–4973. doi:10.1158/1078-0432.Ccr-20-2833
Fu, C., Begum, K., Jordan, P. W., He, Y., and Overbeek, P. A. (2016a). Dearth and delayed maturation of testicular germ cells in Fanconi anemia E mutant male mice. PLoS One 11 (8), e0159800. doi:10.1371/journal.pone.0159800
Fu, C., Begum, K., and Overbeek, P. A. (2016b). Primary ovarian insufficiency induced by Fanconi anemia E mutation in a mouse model. PLoS One 11 (3), e0144285. doi:10.1371/journal.pone.0144285
Goodman, A. M., Sokol, E. S., Frampton, G. M., Lippman, S. M., and Kurzrock, R. (2019). Microsatellite-stable tumors with high mutational burden benefit from immunotherapy. Cancer Immunol. Res. 7 (10), 1570–1573. doi:10.1158/2326-6066.Cir-19-0149
Gordon, S. M., Alon, N., and Buchwald, M. (2005). FANCC, FANCE, and FANCD2 form a ternary complex essential to the integrity of the Fanconi anemia DNA damage response pathway. J. Biol. Chem. 280 (43), 36118–36125. doi:10.1074/jbc.M507758200
Green, A. K., Feinberg, J., and Makker, V. (2020). A review of immune checkpoint blockade therapy in endometrial cancer. Am. Soc. Clin. Oncol. Educ. Book 40, 1–7. doi:10.1200/edbk_280503
Hartford, S. A., Chittela, R., Ding, X., Vyas, A., Martin, B., Burkett, S., et al. (2016). Interaction with PALB2 is essential for maintenance of genomic integrity by BRCA2. PLoS Genet. 12 (8), e1006236. doi:10.1371/journal.pgen.1006236
Houghtaling, S., Timmers, C., Noll, M., Finegold, M. J., Jones, S. N., Meyn, M. S., et al. (2003). Epithelial cancer in Fanconi anemia complementation group D2 (Fancd2) knockout mice. Genes Dev. 17 (16), 2021–2035. doi:10.1101/gad.1103403
Jardim, D. L., Goodman, A., de Melo Gagliato, D., and Kurzrock, R. (2021). The challenges of tumor mutational burden as an immunotherapy biomarker. Cancer Cell 39 (2), 154–173. doi:10.1016/j.ccell.2020.10.001
Jiang, Y., Wang, C., and Zhou, S. (2020). Targeting tumor microenvironment in ovarian cancer: Premise and promise. Biochim. Biophys. Acta Rev. Cancer 1873 (2), 188361. doi:10.1016/j.bbcan.2020.188361
Joshi, S. S., and Badgwell, B. D. (2021). Current treatment and recent progress in gastric cancer. CA Cancer J. Clin. 71 (3), 264–279. doi:10.3322/caac.21657
Keir, M. E., Butte, M. J., Freeman, G. J., and Sharpe, A. H. (2008). PD-1 and its ligands in tolerance and immunity. Annu. Rev. Immunol. 26, 677–704. doi:10.1146/annurev.immunol.26.021607.090331
Kottemann, M. C., and Smogorzewska, A. (2013). Fanconi anaemia and the repair of Watson and Crick DNA crosslinks. Nature 493 (7432), 356–363. doi:10.1038/nature11863
Kutler, D. I., Auerbach, A. D., Satagopan, J., Giampietro, P. F., Batish, S. D., Huvos, A. G., et al. (2003a). High incidence of head and neck squamous cell carcinoma in patients with Fanconi anemia. Arch. Otolaryngol. Head. Neck Surg. 129 (1), 106–112. doi:10.1001/archotol.129.1.106
Kutler, D. I., Singh, B., Satagopan, J., Batish, S. D., Berwick, M., Giampietro, P. F., et al. (2003b). A 20-year perspective on the international Fanconi anemia registry (IFAR). Blood 101 (4), 1249–1256. doi:10.1182/blood-2002-07-2170
Lee, R. H., Kang, H., Yom, S. S., Smogorzewska, A., Johnson, D. E., and Grandis, J. R. (2021). Treatment of Fanconi anemia-associated head and neck cancer: Opportunities to improve outcomes. Clin. Cancer Res. 27 (19), 5168–5187. doi:10.1158/1078-0432.Ccr-21-1259
Li, W. Q., Hu, N., Hyland, P. L., Gao, Y., Wang, Z. M., Yu, K., et al. (2013). Genetic variants in DNA repair pathway genes and risk of esophageal squamous cell carcinoma and gastric adenocarcinoma in a Chinese population. Carcinogenesis 34 (7), 1536–1542. doi:10.1093/carcin/bgt094
Liu, X., Liu, X., and Han, X. (2021). FANCI may serve as a prognostic biomarker for cervical cancer: A systematic review and meta-analysis. Med. Baltim. 100 (51), e27690. doi:10.1097/md.0000000000027690
Lowy, D. R., and Gillison, M. L. (2003). A new link between Fanconi anemia and human papillomavirus-associated malignancies. J. Natl. Cancer Inst. 95 (22), 1648–1650. doi:10.1093/jnci/djg125
Luo, Y., Hartford, S. A., Zeng, R., Southard, T. L., Shima, N., and Schimenti, J. C. (2014). Hypersensitivity of primordial germ cells to compromised replication-associated DNA repair involves ATM-p53-p21 signaling. PLoS Genet. 10 (7), e1004471. doi:10.1371/journal.pgen.1004471
Malherbe, K. (2021). Tumor microenvironment and the role of artificial intelligence in breast cancer detection and prognosis. Am. J. Pathol. 191 (8), 1364–1373. doi:10.1016/j.ajpath.2021.01.014
Miao, H., Ren, Q., Li, H., Zeng, M., Chen, D., Xu, C., et al. (2022). Comprehensive analysis of the autophagy-dependent ferroptosis-related gene FANCD2 in lung adenocarcinoma. BMC Cancer 22 (1), 225. doi:10.1186/s12885-022-09314-9
Milletti, G., Strocchio, L., Pagliara, D., Girardi, K., Carta, R., Mastronuzzi, A., et al. (2020). Canonical and noncanonical roles of Fanconi anemia proteins: Implications in cancer predisposition. Cancers (Basel) 12 (9), 2684. doi:10.3390/cancers12092684
Mo, J. L., Liu, J. S., Xiao, Q., Hong, W. X., Yin, J. Y., Chen, J., et al. (2022). Association of variations in the Fanconi anemia complementation group and prognosis in Non-small cell lung cancer patients with Platinum-based chemotherapy. Gene 825, 146398. doi:10.1016/j.gene.2022.146398
Moes-Sosnowska, J., Rzepecka, I. K., Chodzynska, J., Dansonka-Mieszkowska, A., Szafron, L. M., Balabas, A., et al. (2019). Clinical importance of FANCD2, BRIP1, BRCA1, BRCA2 and FANCF expression in ovarian carcinomas. Cancer Biol. Ther. 20 (6), 843–854. doi:10.1080/15384047.2019.1579955
Nalepa, G., and Clapp, D. W. (2018). Fanconi anaemia and cancer: An intricate relationship. Nat. Rev. Cancer 18 (3), 168–185. doi:10.1038/nrc.2017.116
Nepal, M., Che, R., Zhang, J., Ma, C., and Fei, P. (2017). Fanconi anemia signaling and cancer. Trends Cancer 3 (12), 840–856. doi:10.1016/j.trecan.2017.10.005
Oura, K., Morishita, A., Tani, J., and Masaki, T. (2021). Tumor immune microenvironment and immunosuppressive therapy in hepatocellular carcinoma: A review. Int. J. Mol. Sci. 22 (11), 8362. doi:10.3390/ijms21218362
Padella, A., Fontana, M. C., Marconi, G., Fonzi, E., Petracci, E., Ferrari, A., et al. (2021). Loss of PALB2 predicts poor prognosis in acute myeloid leukemia and suggests novel therapeutic strategies targeting the DNA repair pathway. Blood Cancer J. 11 (1), 7. doi:10.1038/s41408-020-00396-x
Post, C. C. B., Westermann, A. M., Bosse, T., Creutzberg, C. L., and Kroep, J. R. (2020). PARP and PD-1/PD-L1 checkpoint inhibition in recurrent or metastatic endometrial cancer. Crit. Rev. Oncol. Hematol. 152, 102973. doi:10.1016/j.critrevonc.2020.102973
Preissner, S. H., Nahles, S., Preissner, S., Heiland, M., and Koerdt, S. (2022). Influence of sex on survival rates of HPV-positive oropharyngeal cancers. Front. Oncol. 12, 917890. doi:10.3389/fonc.2022.917890
Ren, B., Cui, M., Yang, G., Wang, H., Feng, M., You, L., et al. (2018). Tumor microenvironment participates in metastasis of pancreatic cancer. Mol. Cancer 17 (1), 108. doi:10.1186/s12943-018-0858-1
Ries, L. A. (1993). Ovarian cancer. Survival and treatment differences by age. Cancer 71 (2), 524–529. doi:10.1002/cncr.2820710206
Rosenberg, P. S., Greene, M. H., and Alter, B. P. (2003). Cancer incidence in persons with Fanconi anemia. Blood 101 (3), 822–826. doi:10.1182/blood-2002-05-1498
Schumacher, T. N., and Schreiber, R. D. (2015). Neoantigens in cancer immunotherapy. Science 348 (6230), 69–74. doi:10.1126/science.aaa4971
Tai, X., Van Laethem, F., Pobezinsky, L., Guinter, T., Sharrow, S. O., Adams, A., et al. (2012). Basis of CTLA-4 function in regulatory and conventional CD4(+) T cells. Blood 119 (22), 5155–5163. doi:10.1182/blood-2011-11-388918
Takahashi, J., Masuda, T., Kitagawa, A., Tobo, T., Nakano, Y., Abe, T., et al. (2022). Fanconi anemia complementation group E, a DNA repair-related gene, is a potential marker of poor prognosis in hepatocellular carcinoma. Oncology 100 (2), 101–113. doi:10.1159/000520582
Tanaka, A., and Sakaguchi, S. (2017). Regulatory T cells in cancer immunotherapy. Cell Res. 27 (1), 109–118. doi:10.1038/cr.2016.151
Thorsson, V., Gibbs, D. L., Brown, S. D., Wolf, D., Bortone, D. S., Ou Yang, T. H., et al. (2018). The immune landscape of cancer. Immunity 48 (4), 812–830. e14. doi:10.1016/j.immuni.2018.03.023
van Velzen, M. J. M., Derks, S., van Grieken, N. C. T., Haj Mohammad, N., and van Laarhoven, H. W. M. (2020). MSI as a predictive factor for treatment outcome of gastroesophageal adenocarcinoma. Cancer Treat. Rev. 86, 102024. doi:10.1016/j.ctrv.2020.102024
Verhagen, C. V. M., Vossen, D. M., Borgmann, K., Hageman, F., Grénman, R., Verwijs-Janssen, M., et al. (2018). Fanconi anemia and homologous recombination gene variants are associated with functional DNA repair defects in vitro and poor outcome in patients with advanced head and neck squamous cell carcinoma. Oncotarget 9 (26), 18198–18213. doi:10.18632/oncotarget.24797
Waldman, A. D., Fritz, J. M., and Lenardo, M. J. (2020). A guide to cancer immunotherapy: from T cell basic science to clinical practice. Nat. Rev. Immunol. 20 (11), 651–668. doi:10.1038/s41577-020-0306-5
Wan, C., Keany, M. P., Dong, H., Al-Alem, L. F., Pandya, U. M., Lazo, S., et al. (2021). Enhanced efficacy of simultaneous PD-1 and PD-L1 immune checkpoint blockade in high-grade serous ovarian cancer. Cancer Res. 81 (1), 158–173. doi:10.1158/0008-5472.Can-20-1674
Wang, S., Ding, B., Cui, M., Yan, W., Xia, Q., Meng, D., et al. (2021). Fanconi anemia pathway genes advance cervical cancer via immune regulation and cell adhesion. Front. Cell Dev. Biol. 9, 734794. doi:10.3389/fcell.2021.734794
Wei, S. C., Levine, J. H., Cogdill, A. P., Zhao, Y., Anang, N. A. S., Andrews, M. C., et al. (2017). Distinct cellular mechanisms underlie anti-CTLA-4 and anti-PD-1 checkpoint blockade. Cell 170 (6), 1120–1133. e17. doi:10.1016/j.cell.2017.07.024
Wong, J. C., Alon, N., McKerlie, C., Huang, J. R., Meyn, M. S., and Buchwald, M. (2003). Targeted disruption of exons 1 to 6 of the Fanconi Anemia group A gene leads to growth retardation, strain-specific microphthalmia, meiotic defects and primordial germ cell hypoplasia. Hum. Mol. Genet. 12 (16), 2063–2076. doi:10.1093/hmg/ddg219
Xu, C., Zang, Y., Zhao, Y., Cui, W., Zhang, H., Zhu, Y., et al. (2021a). Comprehensive pan-cancer analysis confirmed that ATG5 promoted the maintenance of tumor metabolism and the occurrence of tumor immune escape. Front. Oncol. 11, 652211. doi:10.3389/fonc.2021.652211
Xu, H., Xiong, C., Chen, Y., Zhang, C., and Bai, D. (2021b). Identification of Rad51 as a prognostic biomarker correlated with immune infiltration in hepatocellular carcinoma. Bioengineered 12 (1), 2664–2675. doi:10.1080/21655979.2021.1938470
Yancik, R. (1993). Ovarian cancer. Age contrasts in incidence, histology, disease stage at diagnosis, and mortality. Cancer 71 (2), 517–523. doi:10.1002/cncr.2820710205
Yarchoan, M., Hopkins, A., and Jaffee, E. M. (2017). Tumor mutational burden and response rate to PD-1 inhibition. N. Engl. J. Med. 377 (25), 2500–2501. doi:10.1056/NEJMc1713444
Yu, Z., Zhang, J., Zhang, Q., Wei, S., Shi, R., Zhao, R., et al. (2022). Single-cell sequencing reveals the heterogeneity and intratumoral crosstalk in human endometrial cancer. Cell Prolif. 55 (6), e13249. doi:10.1111/cpr.13249
Keywords: Fanconi anemia, FANCE, pan-cancer, prognosis, tumor immunity
Citation: Zhou Z, Yin H, Suye S, He J and Fu C (2023) Pan-cancer analysis of the prognostic and immunological role of Fanconi anemia complementation group E. Front. Genet. 13:1024989. doi: 10.3389/fgene.2022.1024989
Received: 22 August 2022; Accepted: 13 December 2022;
Published: 04 January 2023.
Edited by:
Wei-Lin Jin, First Hospital of Lanzhou University, ChinaReviewed by:
Fangxu Yin, Binzhou Medical University, ChinaJian Yang, The First Affiliated Hospital of Soochow University, China
Copyright © 2023 Zhou, Yin, Suye, He and Fu. This is an open-access article distributed under the terms of the Creative Commons Attribution License (CC BY). The use, distribution or reproduction in other forums is permitted, provided the original author(s) and the copyright owner(s) are credited and that the original publication in this journal is cited, in accordance with accepted academic practice. No use, distribution or reproduction is permitted which does not comply with these terms.
*Correspondence: Chun Fu, ZnVjaHVuMDgxNEBjc3UuZWR1LmNu