
95% of researchers rate our articles as excellent or good
Learn more about the work of our research integrity team to safeguard the quality of each article we publish.
Find out more
ORIGINAL RESEARCH article
Front. Genet. , 14 October 2022
Sec. Epigenomics and Epigenetics
Volume 13 - 2022 | https://doi.org/10.3389/fgene.2022.1024300
This article is part of the Research Topic Epigenetics of Metabolism, Immunology and Aging View all 17 articles
 Peili Wu1†
 Lei Guo1†Xuelin Li1Yuejun Du2Xiaochun Lin1Xiaoqin Ma1Yingbei Lin1Churan Wen1Chuyi Yang1Nannan Liu1Qijian Feng1
 Yaoming Xue1Meiping Guan1*
DNA methylation is closely related to the occurrence and development of many diseases, but its role in obesity is still unclear. This study aimed to find the potential differentially methylated genes associated with obesity occurrence and development. By combining methylation and transcriptome analysis, we identified the key genes in adipose tissue affecting the occurrence and development of obesity and revealed the possible molecular mechanisms involved in obesity pathogenesis. We first screened 14 methylation-related differential genes and verified their expression in adipose tissue by quantitative polymerase chain reaction (qPCR). Seven genes with the same expression pattern were identified as key genes, namely, CCRL2, GPT, LGALS12, PC, SLC27A2, SLC4A4, and TTC36. Then, the immune microenvironment of adipose tissue was quantified by CIBERSORT, and we found that the content of M0 macrophages and T follicular helper cells in adipose tissue was significantly increased and decreased, respectively, in the obese group. Furthermore, the relationship between key genes and the immune microenvironment was analyzed. Additionally, the metabolic pathway activity of each sample was calculated based on the ssGSEA algorithm, and the key gene–metabolic network was constructed. Moreover, we performed a CMAP analysis based on the differential genes in adipose tissue to screen out drugs potentially effective in obesity treatment. In conclusion, we identified seven methylation-related key genes closely related to obesity pathogenesis and explored the potential mechanism of their role in obesity. This study provided novel insights into the molecular mechanisms and management of obesity.
Obesity is a chronic metabolic disease. Currently, the incidence rate of obesity and obesity-based metabolic diseases is increasing worldwide (Ng et al., 2014), greatly reducing the quality of life. Therefore, it is increasingly important to explore and develop effective treatments for obesity. Obesity is caused by excessive accumulation and abnormal distribution of body fat due to long-term energy intake exceeding consumption. Adipose tissue is the core of the bodys’ energy balance and metabolic homeostasis. Targeting adipose tissue metabolic activity is one of the most attractive strategies to effectively reduce weight and improve metabolism.
Adipose tissue is mainly divided into two categories, brown adipose tissue (BAT) and white adipose tissue (WAT). Among them, BAT resists cold and increases energy consumption by increasing heat production, while WAT, as the main site for nutrition storage, secretes important endocrine hormones to communicate with the central nervous system and other peripheral tissues, which jointly maintain the changing nutritional environment (Kajimura et al., 2015; Chen et al., 2017). Additionally, WAT can also coordinate with immune cells and play an important role in integrating immune and metabolic signals (Martinez-Santibanez and Lumeng, 2014; Crewe et al., 2017), revealing a potential new target for preventing and treating obesity and its related complications by regulating the immune microenvironment.
DNA methylation is associated with causing genetic changes without changing the DNA sequence, which is one of the most stable epigenetic mechanisms. DNA methylation is widely involved in the occurrence and development of various characteristics and diseases. Methylation of DNA is generally associated with elevated gene expression, whereas unmethylated DNA is associated with repressed gene expression (Parle-McDermott and Ozaki, 2011). The mechanism is believed to be linked with transcriptional silencing involving the interference of RNA polymerase complex and associated transcription factors (Klose and Bird, 2006; Parle-McDermott and Ozaki, 2011). In obesity, studies have shown that DNA methylation can regulate the homeostasis of energy balance in WAT. Previous studies have reported that methylation changes of certain genes, such as ATP binding cassette subfamily G member 1 (ABCG1), sterol regulatory element binding transcription factor (SREBP1), and carnitine palmitoyl transferase 1A (CPT1A), were related to obesity, and these DNA methylation-related markers might act as predictors of obesity and related diseases. However, due to the unsatisfactory duplication or validation results of DNA methylation markers in obesity, clinical application of DNA methylation-related genes is still relatively limited. Hence, further studies on the key genes of DNA methylation are needed in the future to lay a foundation for them as predictors of obesity and related diseases.
Differential genes and methylation profiles between the control and obese groups were analyzed by combining methylation and transcriptome data to seek potential differentially methylated genes associated with obesity. Furthermore, the selected candidate genes were subsequently verified in human adipose tissue samples. The immune microenvironment and metabolic regulation pathway were further explored, and the relationship between them and the key genes was also analyzed. Additionally, drug prediction was performed based on differential genes of adipose tissue, and potential small molecules for obesity treatment were screened. This study provided potential obesity-related therapeutic targets for further research and obesity management in clinical practice.
The GEO database (https://www.ncbi.nlm.nih.gov/geo) stores gene expression data from all over the world (Barrett et al., 2007). In this study, three datasets based on subcutaneous adipose analysis were enrolled. The 450-k methylation matrix within GSE67024 (GPL13534) was downloaded from the GEO database, including 15 obese patients (BMI 41.36 ± 4.54 kg/m2) and 14 never-obese control women (BMI 25.11 ± 2.49 kg/m2). The expression profile of GSE174475 (GPL18573) was downloaded, including 14 obese patients (BMI 34.31 ± 3.17 kg/m2) and 29 non-obese control women (BMI 26.45 ± 2.47 kg/m2). The expression profile of GSE156906 (GPL24676) was acquired, including 52 obese patients with an average BMI near 38.45 kg/m2 and 14 non-obese control with an average BMI of 22.90 kg/m2 (Fuchs et al., 2021). Age and gender between obese and non-obese patients in the datasets show no statistical difference (more details in Supplementary Tables S1–S3.
The limma package is a commonly used method to identify differential genes (Ritchie et al., 2015). In this study, the R package “limma” was used to analyze the differentially expressed genes between control and obese samples. Filter criteria of differentially expressed genes were set as | log2 fold change | of >1 and a p of <0.05. Differential gene volcano plots were drawn using the R package “ggplot2” (https://link.springer.com/book/10.1007/978-3-319-24277-4), and differential gene heatmaps were drawn using the “pheatmap” package. The “clusterProfiler” (Yu et al., 2012) package was used to perform GO and KEGG pathway enrichment analysis, and the possible pathways of differential genes involved in the progression of obesity were comprehensively explored. GO analysis included three different categories, namely, biological process (BP), molecular function (MF), and cellular component (CC). Enriched pathways with both P and Q values less than 0.05 were considered to be significant.
ChAMP is a comprehensive methylation analysis pipeline including functions of low-quality probe filtering, differential methylation position detection, methylated genomic block detection, and so on. In this study, the methylation data in the GSE67024 dataset were analyzed by the R package “ChAMP” (Morris et al., 2014; Tian et al., 2017), and the methylation levels of adipose tissue genes between the control and the obese groups were compared. The differentially methylated genes were screened. Filter criteria of differentially methylated genes were |log2 fold change| of >0.2 and an adjusted P of <0.05. Lower-expression genes with hypermethylation and higher-expression genes with hypomethylation were identified as key genes in disease development.
Patients who met the inclusion criteria were enrolled: a. aged 18–65; b. subcutaneous adipose tissue and clinical data available; c. informed consent. Subcutaneous adipose tissue was obtained from 14 men and 10 women with diseases such as renal cysts, kidney stones, adrenal adenoma, and primary aldosteronism, who underwent laparoscopic adrenalectomy (more details in Supplementary Materials). According to the Chinese standard of obesity, in this study, the obese group was set with a BMI of no less than 28 kg/m2. The average BMI in the obese group was significantly different compared to that of the control group (30.01 ± 1.48 kg/m2 vs. 22.43 ± 2.81 kg/m2, p<0.001). No significant difference in age and gender between the two groups was observed (more details in Supplementary Table S4. It was approved by the Ethics Committee of Nanfang Hospital, and all subjects. Total RNA was extracted from subcutaneous adipose tissue, cDNA was reverse-transcribed, and quantitative reverse transcription-polymerase chain reaction (RT-PCR) was conducted on the QuantStudio5 real-time PCR system. All primers were confirmed by PubMed BLAST, and human β-ACTIN served as the internal control. Primer sequences are given in the Supplementary Materials.
CIBERSORT is a deconvolution method that effectively links the gene expression data with the content of immune cells and quantifies the composition of immune cells through gene expression profiles (Chen et al., 2018). For each case, the total of predicted cell subgroups was equal to 1, which indicates the enrichment of immune cell infiltration. This study quantified the immune microenvironment of adipose tissue gene expression data of GSE174475 by the CIBERSORT algorithm, inferred the relative content of immune cells in adipose tissue, and compared the relative level of immune cell content in different groups. Additionally, Pearson’s correlation analysis was used to explore the correlation between key genes and the content of immune cells, and p < 0.05 was considered statistically significant.
The connectivity map (CMap) is a database for drug prediction based on differential gene expression (Lamb et al., 2006). It contains 6100 examples of 1309 small-molecule drugs and is mainly used to reveal the functional relationship between genes, drugs, and diseases. In the present study, we predicted potential molecular compounds for obesity treatment based on the CMAP database. We first analyzed the differential genes between the control and obese groups in adipose tissue and then input the differential genes into the CMAP database for drug prediction. The correlation between drugs and differential genes was displayed by a score from −1 to 1, with a negative number indicating the gene expression pattern of the corresponding interference, suggesting that this interference might have a potential therapeutic effect on obesity.
Data analysis was conducted by the R framework (version 4.1.2). All statistical tests were bilateral, and a p-value < 0.05 was considered statistically significant.
The study design of this research is displayed in Figure 1. In this study, GSE174475, including 43 cases of adipose tissue transcriptome data, was downloaded from the NCBI GEO public database. According to the expression profile data of adipose tissue, differential analysis was conducted to screen the differential genes between the control and obesity groups. A total of 742 differential genes were selected, including 614 upregulated genes and 128 downregulated genes (Figures 2A,B). We further performed pathway enrichment analysis on these differential genes. The Gene Ontology (GO) results showed that the differential genes were mainly enriched in the signaling pathways such as leucocyte-mediated immunity, adaptive immune response based on somatic, T cell activation, and lymphocyte-mediated immunity (Figure2C). The Kyoto Encyclopedia of Genes and Genomes (KEGG) results displayed that the differential genes were mainly enriched in the chemical signaling pathway, natural killer cell-mediated cytotoxicity, Th17 cell differentiation, and other signaling pathways (Figure 2D). On the other hand, we downloaded the 450-k data of GSE67024 from the NCBI GEO public database, including the methylation gene profiles in adipose tissue of 29 cases, and analyzed the differential methylation sites with the ChAMP package. A total of 1186 significant differentially methylated probes were screened, including corresponding 81 hypomethylated genes and 647 hypermethylated genes (Figures 3A,B).
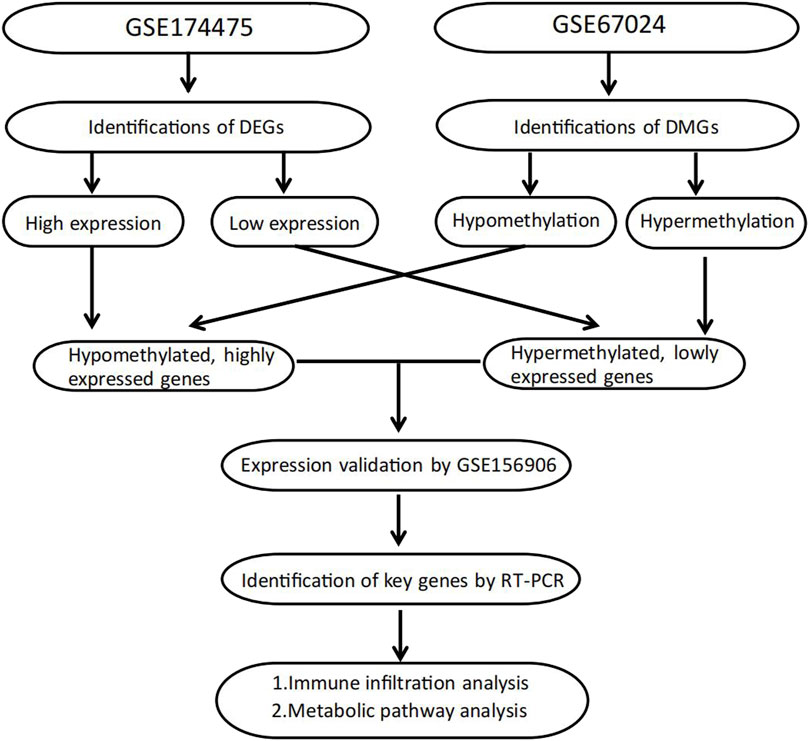
FIGURE 1. Flowchart of study design.
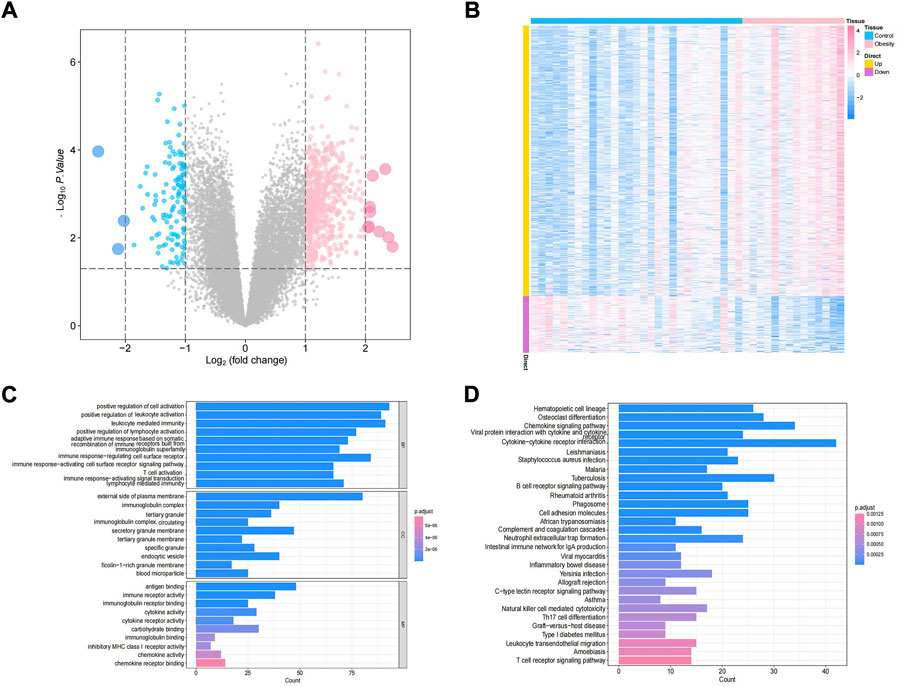
FIGURE 2. Identification of obesity differential genes. (A) Volcano plot of differential gene expression. Blue indicates differentially expressed downregulated genes, and pink indicates differentially expressed upregulated genes. (B) Differential gene expression heatmap, where blue indicates low-expression genes and pink indicates high-expression genes. (C,D) GO/KEGG enrichment pathway of differential genes.
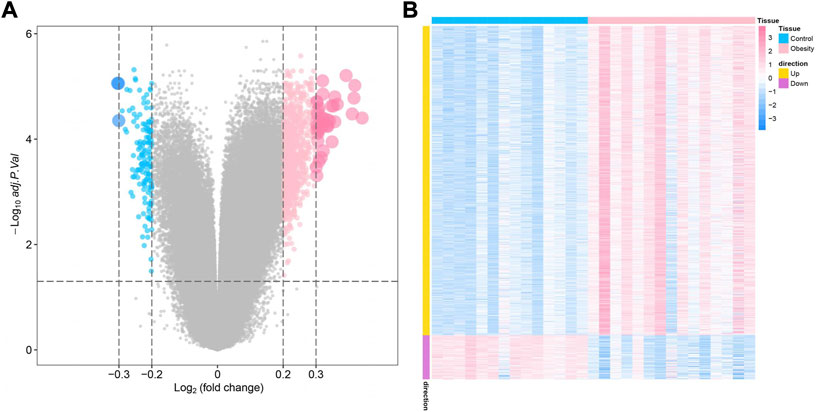
FIGURE 3. Identification of obesity differentially methylated genes. (A) Volcano plot of differentially methylated genes, where blue indicates differentially methylated downregulated genes and pink indicates differentially methylated upregulated genes. (B) Differential methylation heatmap, where blue indicates hypomethylated genes and pink indicates hypermethylated genes.
Genes that were lower expressed in transcriptome analysis while being hypermethylated in the methylation dataset or higher expression genes with hypomethylation were further selected. The Venn plots showed that 14 genes were identified, namely, AGBL carboxypeptidase 4 (AGBL4), CC-chemokine receptor-like 2 (CCRL2), carbohydrate sulfotransferase 11 (CHST11), fatty acid synthase (FASN), glutamic-pyruvic transaminase (GPT), lysosomal protein transmembrane 5 (LAPTM5), galectin-12 (LGALS12), leucine-rich repeats and immunoglobulin-like domains 1 (LRIG1), pyruvate carboxylase (PC), solute carrier family 27 member 2 (SLC27A2), solute carrier family 4 member 4 (SLC4A4), thyroid hormone responsive (THRSP), transient receptor potential cation channel subfamily V member 2 (TRPV2), and tetratricopeptide repeat domain 36 (TTC36) (Figures 4A,B). Additionally, the present study verified the expression pattern of these genes through another adipose tissue dataset, GSE156906. The results showed that 13 of the 14 genes had the same expression pattern, namely, AGBL4, CCRL2, CHST11, FASN, GPT, LAPTM5, LGALS12, LRIG1, PC, SLC27A2, SLC4A4, TRPV2, and TTC36 (Figures 4C,D). Moreover, we also verified the expression of key genes in adipose tissue between nine obese and 15 non-obese patients by RT-qPCR and found that seven genes remained in the same expression pattern in obese patients, namely, CCRL2, GPT, LGALS12, PC, SLC27A2, SLC4A4, and TTC36 (all p value < 0.05) (Figure 4E). Therefore, these seven genes were regarded as potential key genes in obesity, and further analysis in exploring their potential molecular mechanisms in adipose tissue was conducted.
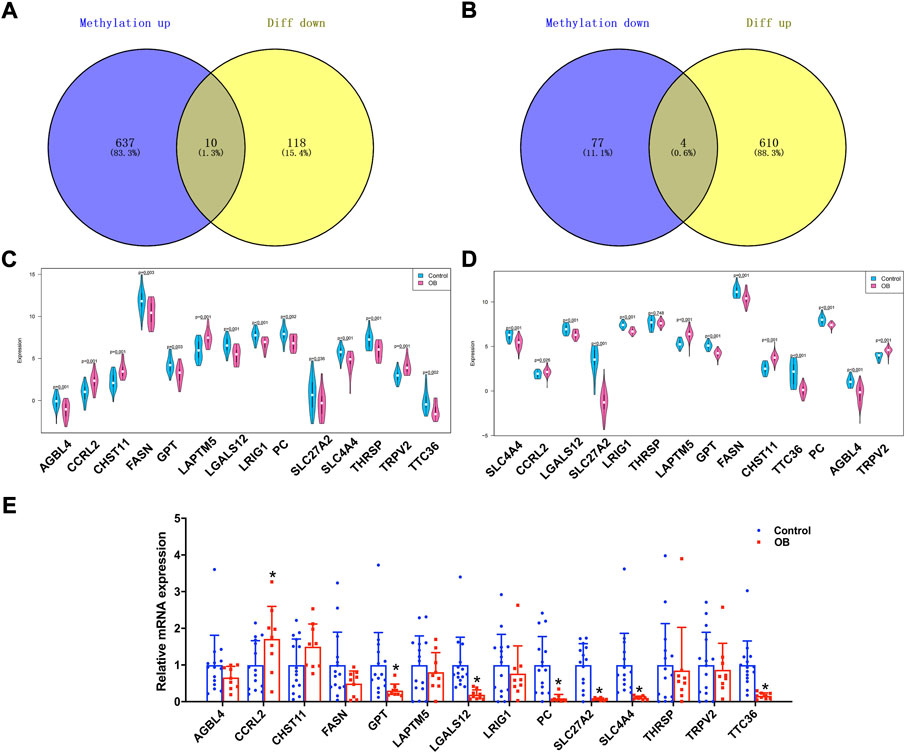
FIGURE 4. Identification of obesity hub genes. (A,B) Venn diagram of hypermethylated-low expression and hypomethylated-high expression genes. (C,D) Expression patterns of genes in GSE174475 and GSE156906. (E) qPCR experiments verified the expression of 14 genes.
In addition to storing nutrients, adipose tissue is also an important immune organ in humans. It contains many immune cells, such as T cells, B cells, and macrophages. Under different microenvironments or stimulation, adipose tissue can secrete cytokines to recruit immune cells and further secrete various inflammatory factors, ultimately leading to chronic inflammation and insulin resistance. This study further explored the immune microenvironment of adipose tissue and the correlation between key genes and immune cell content in obesity based on the dataset GSE174475. We first quantified the content of immune cells in each sample by the CIBERSORT algorithm (Figures 5A,B). The results showed that the content of M0 macrophages was significantly increased in the obese group compared to that of the control group, while the content of T follicular helper cells was significantly decreased in the obese group (Figure 5C). The immuno-microenvironmental analysis based on GSE156906 also showed that the number of M0 macrophages was significantly increased in the obese group (Supplementary Figures S1A–C), which was consistent with the abovementioned results. Furthermore, we analyzed the correlation between the expression of key genes and the content of immune cells. The results showed that the seven genes were strongly correlated with the content of immune cells, suggesting that the key genes might affect the occurrence and development of obesity by influencing the immune microenvironment of adipose tissue (Figures 6A–G).
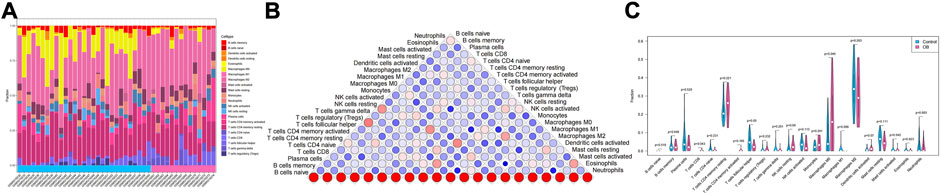
FIGURE 5. Immune infiltration of adipose tissue. (A) Relative percentage of 22 immune cell subpopulations in the sample. (B) Correlation among 22 immune cells, where blue indicates positive correlation and red indicates positive correlation. (C) Difference in immune cell content between normal samples and obese samples, with blue indicating normal samples and pink indicating obese samples. p < 0.05 was considered statistically significant.
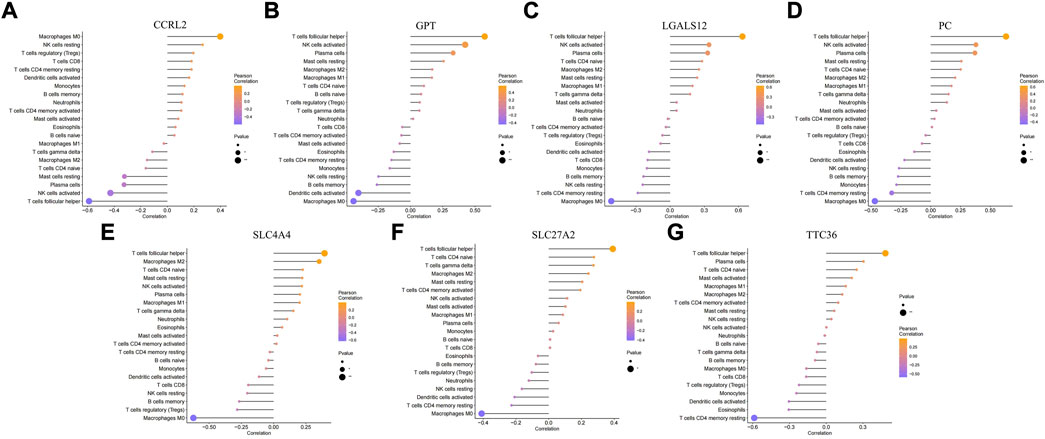
FIGURE 6. Correlation between key genes and immune cells. (A–G) Relationship between key genes and immune cells, and the genes are CCRL2, GPT, LGALS12, PC, SLC4A4, SLC27A2, and TTC36, respectively.
Adipose tissue can sense the energy metabolism of the body and then secrete adipokines to regulate energy homeostasis. The dysfunction of adipose tissue is manifested by the aggravation of inflammatory factors and insulin resistance. The dysfunction of adipose tissue and dysregulated glucolipid metabolism accelerate each other. In this study, the metabolic pathway score of each sample was quantified by the ssGSEA algorithm. In the metabolic pathway heatmap, significant difference in scores for lipid metabolism-related signatures and other metabolism signatures between the control and obese samples was observed (Figure 7A). Additionally, we also further quantified the correlation between key genes and metabolic pathways and constructed a key gene–metabolic pathway network (Figures 7B,C).
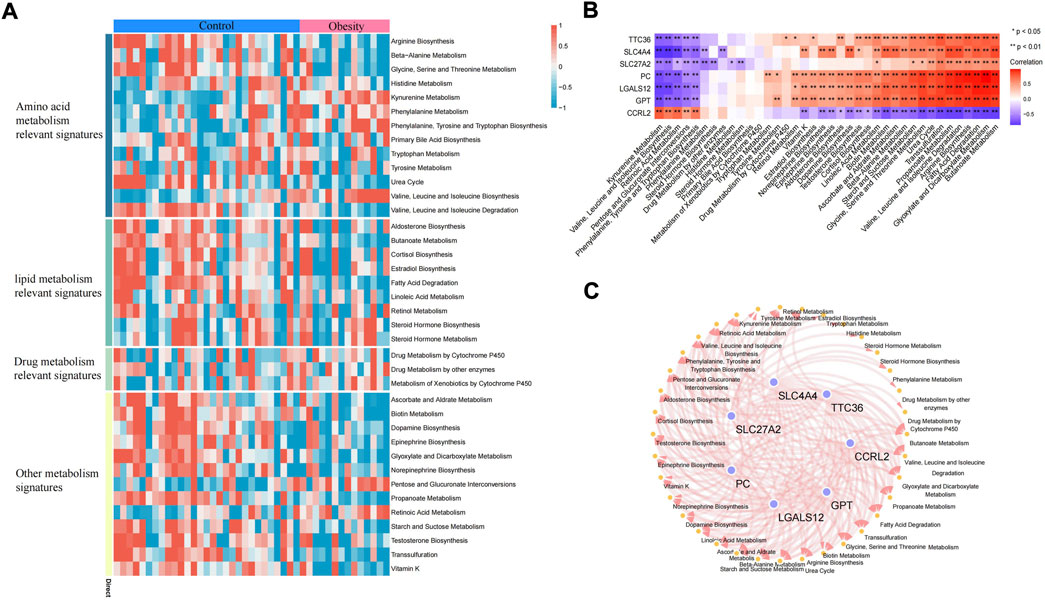
FIGURE 7. Metabolic pathway of adipose tissue. (A) Heatmap of the metabolic pathway of adipose tissue. (B) Correlation analysis between key genes and metabolic pathways. (C) Relationship between key genes and metabolic pathways (the correlation coefficient is greater than 0.3).
To identify potential drugs for the targeted treatment of obesity, we used the CMap database to evaluate the potential of small-molecule drugs in obesity treatment. We uploaded differentially expressed genes of adipose tissue to the CMap database and identified drugs related to obesity treatment. Among them, vemurafenib, NTNCB, dilazep, and PD-0325901 ((with available structure in PubChem database) were highly negatively correlated with obesity progression, indicating that these compounds might have therapeutic effects on obesity (Figure 8A). The mechanism of action (MOA) and drug targets of these drugs are identified using the CMap database to explore the potential mechanism of their treatment of obesity (Figure 8A), and the 2D visualization of these four drugs is shown (Figure 8B).
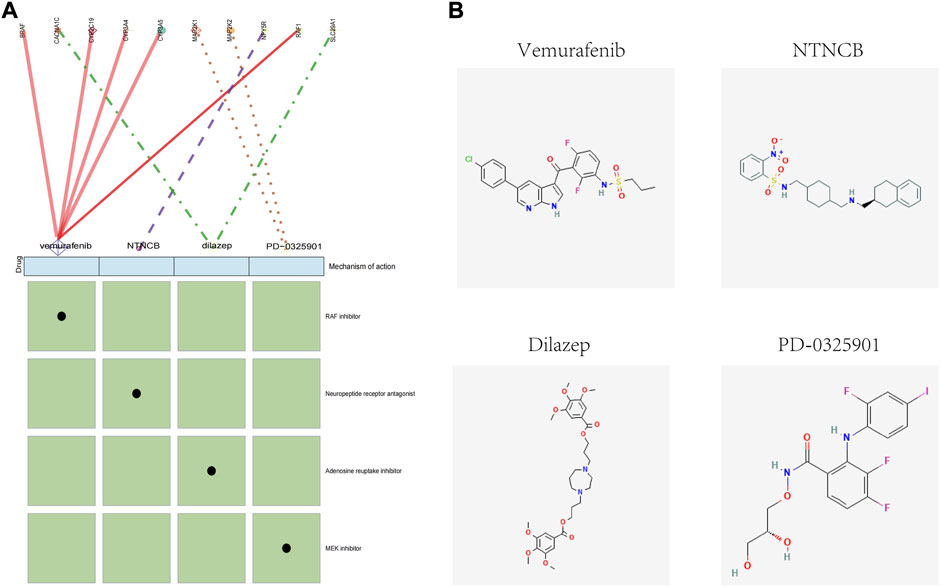
FIGURE 8. CMap analysis of the therapeutic drugs for obesity. (A) Molecular action and targets of potentially therapeutic drugs. (B) 2D visualization of these four drugs.
In this study, by analyzing three GEO datasets and verifying in 24 patients, we identified that CCRL2, GPT, LGALS12, PC, SLC27A2, SLC4A4, and TTC36 might be the key genes that play an important role in obesity pathogenesis. Furthermore, these seven genes showed association with immune microenvironment and metabolic pathways in adipose tissue of obese patients. Additionally, we found that, compared to the control, M0 macrophage content was higher, while T follicular helper cell content was lower in adipose tissues in the obese group. Also, possible therapeutic drugs for obese patients were shown in our study. This study provided potential obesity-related therapeutic targets for further research and obesity management in clinical practice.
An increasing number of studies have shown that methylated genes are closely related to obesity. Simone et al. have identified 278 BMI-associated CpG sites in blood from epigenomic associations in European and Indian Asian populations, of which 120 CpG sites were consistently associated with BMI in both adipose tissue and blood. The epigenome-wide association study (EWAS) in the Asian population has also identified 116 BMI-associated CpGs, of which 108 were consistent with those of previous studies. In addition to being biomarkers, methylated genes have also been useful for predicting obesity and its related metabolic diseases (Wahl et al., 2017; Gallardo-Escribano et al., 2020). However, although many studies have suggested that excessive accumulation of fat caused most of the methylation changes (Wahl et al., 2017; Chen et al., 2021), others have insisted that methylation might be the cause of obesity (Mendelson et al., 2017). Additionally, methylated genes might also be associated with inflammation and lipoprotein-related biological pathways, further aggravating metabolic disorders (Wahl et al., 2017; Chen et al., 2021). These findings still need more experimental studies for further confirmation. In this study, seven candidate obesity-related methylation genes were identified, and our results suggested that these genes might participate in immune infiltration and in glucolipid metabolism.
Adipose tissue is also an important immune organ, containing many immune cells that function to maintain immune homeostasis. Infiltration and activation of immune cells during obesity is a powerful mechanism for adipose tissue remodeling (Engin, 2017), highlighting their potential as immunotherapeutic targets for the prevention and treatment of metabolic diseases. Studies in humans and mice have shown that the content of macrophages in adipose tissue is proportional to BMI (Weisberg et al., 2003). With obesity, adipose tissue is in a low-intensity inflammatory state, in which the percentage of macrophage infiltration in adipose tissue is significantly increased to 41% (Weisberg et al., 2003) compared with the normal state, which is consistent with the results of our study in terms that macrophages were significantly increased in the tissue of obese patients. More importantly, our analysis found that T follicular helper cells were significantly decreased in obesity, which has been rarely reported in previous studies. No reports have been found on the correlation between T follicular helper cells and adipose tissue or obesity. It should be noted that the BCL6 transcription repressor (Bcl6) has been shown to play an important role in regulating lipid metabolism in adipose tissue. Mice lacking Bcl6 showed multiple characteristics of lipid metabolism disorders, accompanied by adipose tissue dysplasia (LaPensee et al., 2014; Hu et al., 2016). Bcl6 is essential for the differentiation and development of T follicular helper cells (Yu et al., 2009), suggesting that the decrease in T follicular helper cells might be involved in the functional imbalance of adipose tissue in obesity.
In this study, consistent with previous studies (Xu et al., 2022), we found that CCRL2 was significantly overexpressed in the subcutaneous tissues of obese subjects. However, this result needs to be interpreted with more caution, as one study suggested that the high expression of CCRL2 in adipose tissue might be a compensatory result. Moreover, CCRL2 lacks a signal transduction structure to transmit ligand signals into cells; hence, it might affect macrophage infiltration by competitively binding ligands (Xu et al., 2022). GPT, its protein that catalyzes reversible reactions of alanine and 2-keto glutaric acid, plays a key role in intermediate metabolism between glucose and amino acid metabolism. Furthermore, enzyme activity in the serum is usually used as a biomarker of liver injury, but it seems to be rarely investigated in the adipose tissue. Our result demonstrated the potential of GPT for subsequent basic research on glucolipid metabolism. Although some studies have shown that LGALS12 was involved in blood glucose improvement (Corbi et al., 2017), many studies have revealed that it promoted adipose differentiation and development (Yang et al., 2004; Wu et al., 2018). Additionally, LGALS12 knockdown accelerates lipid catabolism (Baum, 2011; Yang et al., 2011). These results suggest that LGALS12 acts as a negative regulator in obesity, which is inconsistent with our results, and this inconsistency might be explained by the possibility of adaptive regulation. As a human adipocyte-specific lncRNA, ADIPINT regulates lipid metabolism in adipocytes by regulating PC protein abundance and enzymatic activity (Kerr et al., 2022). Because the effects of PC often correlate with its activity, the reduced transcript levels of PC found in obese individuals in this study were not fully representative of its functional characteristics. Some studies have shown that SLC4A4 may be involved in the pathogenesis of obesity and also participate in immune infiltration (Li et al., 2015; Li et al., 2022), and the methylation of the solute carrier protein (SLC) gene has been closely related to BMI and waist circumference (Mendelson et al., 2017; Sayols-Baixeras et al., 2017). In this study, not only SLC4A4 but also SLC27A2 were both significantly downregulated in obese patients, which to a certain extent supports previous studies and suggests that these two genes might be key genes requiring more attention in the future exploration of the obesity mechanism. Although there are no relevant reports on obesity or adipose tissue for TTC36, few studies have found that TTC36 was negatively regulated by TTC36 methylation in liver cancer tissues (Jing et al., 2022), and it is involved in the process of immune infiltration. It suggests that the role of TTC36 in adipose tissue might be worthy of further investigation, especially in immune infiltration. In short, there are currently limited reports about these seven key genes, and more experimental research and clinical trials are needed. However, these genes may serve as potential target genes for subsequent basic research.
Our results showed that vemurafenib, NTNCB, dilazep, and PD-0325901 might have therapeutic effects on obesity. Unfortunately, for now, the direct effect of these drugs on obesity was hardly reported. Interestingly, according to the molecular action of potential therapeutic drugs analysis, SLC29A was indicated as a potential target in the possible mechanism of dilazep in treating obesity. Recent research suggested SLC29A was considered to regulate inosine levels in brown adipose tissue and consequently enhanced thermogenesis (Niemann et al., 2022); hence, these may be the indirect evidence supporting dilazep as the potential therapeutic drug. However, caution is needed until more evidence on the anti-obesity of these drugs is found.
In summary, we successfully identified seven key genes, namely, CCRL2, GPT, LGALS12, PC, SLC27A2, SLC4A4, and TTC36, which are involved in obesity occurrence and development likely through the immune microenvironment. Meanwhile, M0 macrophage content was higher, while T follicular helper cell content was lower in adipose tissues in the obese group. Our results also indicated that vemurafenib, NTNCB, dilazep, and PD-0325901 might have therapeutic effects on obesity.
The datasets presented in this study can be found in online repositories. The names of the repository/repositories and accession number(s) can be found below: https://www.ncbi.nlm.nih.gov/geo/, GSE67024, https://www.ncbi.nlm.nih.gov/geo/, GSE174475, https://www.ncbi.nlm.nih.gov/geo/, GSE156906.
The studies involving human participants were reviewed and approved by the Medical Ethics Committee of Nanfang Hospital of Southern Medical University. The patients/participants provided their written informed consent to participate in this study.
MG: conceived and designed the study and revised the manuscript. PW: analyzed, interpreted, and wrote the manuscript. LG: interpreted and wrote the manuscript. Other authors collaborated on tissue sample collection and data interpretation. All authors have provided the final approval of the submitted version.
This work was supported by the National Natural Science Foundation of China Grants 81870612 and the Science and Technology Planning Project of Guangdong Province 2019A1515011997.
We thank those involved in this work.
The authors declare that the research was conducted in the absence of any commercial or financial relationships that could be construed as a potential conflict of interest.
All claims expressed in this article are solely those of the authors and do not necessarily represent those of their affiliated organizations, or those of the publisher, the editors, and the reviewers. Any product that may be evaluated in this article, or claim that may be made by its manufacturer, is not guaranteed or endorsed by the publisher.
The Supplementary Material for this article can be found online at: https://www.frontiersin.org/articles/10.3389/fgene.2022.1024300/full#supplementary-material
Barrett, T., Troup, D. B., Wilhite, S. E., Ledoux, P., Rudnev, D., Evangelista, C., et al. (2007). NCBI GEO: Mining tens of millions of expression profiles--database and tools update. Nucleic Acids Res. 35 (1), D760–D765. doi:10.1093/nar/gkl887
Baum, L. G. (2011). Burn control, an adipocyte-specific function for galectin-12. Proc. Natl. Acad. Sci. U. S. A. 108 (46), 18575–18576. doi:10.1073/pnas.1115738108
Chen, B., Khodadoust, M. S., Liu, C. L., Newman, A. M., and Alizadeh, A. A. (2018). Profiling tumor infiltrating immune cells with CIBERSORT. Methods Mol. Biol. 1711, 243–259. doi:10.1007/978-1-4939-7493-1_12
Chen, Y., Kassam, I., Lau, S. H., Kooner, J. S., Wilson, R., Peters, A., et al. (2021). Impact of BMI and waist circumference on epigenome-wide DNA methylation and identification of epigenetic biomarkers in blood: An EWAS in multi-ethnic asian individuals. Clin. Epigenetics 13 (1), 195. doi:10.1186/s13148-021-01162-x
Chen, Z., Wang, G. X., Ma, S. L., Jung, D. Y., Ha, H., Altamimi, T., et al. (2017). Nrg4 promotes fuel oxidation and a healthy adipokine profile to ameliorate diet-induced metabolic disorders. Mol. Metab. 6 (8), 863–872. doi:10.1016/j.molmet.2017.03.016
Corbi, S. C. T., Bastos, A. S., Nepomuceno, R., Cirelli, T., Dos Santos, R. A., Takahashi, C. S., et al. (2017). Expression profile of genes potentially associated with adequate glycemic control in patients with type 2 diabetes mellitus. J. Diabetes Res. 2017, 2180819. doi:10.1155/2017/2180819
Crewe, C., An, Y. A., and Scherer, P. E. (2017). The ominous triad of adipose tissue dysfunction: Inflammation, fibrosis, and impaired angiogenesis. J. Clin. Invest. 127 (1), 74–82. doi:10.1172/JCI88883
Engin, A. B. (2017). Adipocyte-macrophage cross-talk in obesity. Adv. Exp. Med. Biol. 960, 327–343. doi:10.1007/978-3-319-48382-5_14
Fuchs, A., Samovski, D., Smith, G. I., Cifarelli, V., Farabi, S. S., Yoshino, J., et al. (2021). Associations among adipose tissue immunology, inflammation, exosomes and insulin sensitivity in people with obesity and nonalcoholic fatty liver disease. Gastroenterology 161 (3), 968–981.e12. doi:10.1053/j.gastro.2021.05.008
Gallardo-Escribano, C., Buonaiuto, V., Ruiz-Moreno, M. I., Vargas-Candela, A., Vilches-Perez, A., Benitez-Porres, J., et al. (2020). Epigenetic approach in obesity: DNA methylation in a prepubertal population which underwent a lifestyle modification. Clin. Epigenetics 12 (1), 144. doi:10.1186/s13148-020-00935-0
Hu, X., Zhou, Y., Yang, Y., Peng, J., Song, T., Xu, T., et al. (2016). Identification of zinc finger protein Bcl6 as a novel regulator of early adipose commitment. Open Biol. 6 (6), 160065. doi:10.1098/rsob.160065
Jing, W., Peng, R., Li, X., Lv, S., Duan, Y., and Jiang, S. (2022). Study on the prognostic values of TTC36 correlated with immune infiltrates and its methylation in hepatocellular carcinoma. J. Immunol. Res. 2022, 7267131. doi:10.1155/2022/7267131
Kajimura, S., Spiegelman, B. M., and Seale, P. (2015). Brown and beige fat: Physiological roles beyond heat generation. Cell Metab. 22 (4), 546–559. doi:10.1016/j.cmet.2015.09.007
Kerr, A. G., Wang, Z., Wang, N., Kwok, K. H. M., Jalkanen, J., Ludzki, A., et al. (2022). The long noncoding RNA ADIPINT regulates human adipocyte metabolism via pyruvate carboxylase. Nat. Commun. 13 (1), 2958. doi:10.1038/s41467-022-30620-0
Klose, R. J., and Bird, A. P. (2006). Genomic DNA methylation: The mark and its mediators. Trends biochem. Sci. 31 (2), 89–97. doi:10.1016/j.tibs.2005.12.008
Lamb, J., Crawford, E. D., Peck, D., Modell, J. W., Blat, I. C., Wrobel, M. J., et al. (2006). The connectivity map: Using gene-expression signatures to connect small molecules, genes, and disease. Science 313 (5795), 1929–1935. doi:10.1126/science.1132939
LaPensee, C. R., Lin, G., Dent, A. L., and Schwartz, J. (2014). Deficiency of the transcriptional repressor B cell lymphoma 6 (Bcl6) is accompanied by dysregulated lipid metabolism. PLoS One 9 (6), e97090. doi:10.1371/journal.pone.0097090
Li, J., Zhou, C., Li, J., Su, Z., Sang, H., Jia, E., et al. (2015). Global correlation analysis for microRNA and gene expression profiles in human obesity. Pathol. Res. Pract. 211 (5), 361–368. doi:10.1016/j.prp.2014.11.014
Li, Z., Li, X., Jin, M., Liu, Y., He, Y., Jia, N., et al. (2022). Identification of potential biomarkers and their correlation with immune infiltration cells in schizophrenia using combinative bioinformatics strategy. Psychiatry Res. 314, 114658. doi:10.1016/j.psychres.2022.114658
Martinez-Santibanez, G., and Lumeng, C. N. (2014). Macrophages and the regulation of adipose tissue remodeling. Annu. Rev. Nutr. 34, 57–76. doi:10.1146/annurev-nutr-071812-161113
Mendelson, M. M., Marioni, R. E., Joehanes, R., Liu, C., Hedman, A. K., Aslibekyan, S., et al. (2017). Association of body mass index with DNA methylation and gene expression in blood cells and relations to cardiometabolic disease: A mendelian randomization approach. PLoS Med. 14 (1), e1002215. doi:10.1371/journal.pmed.1002215
Morris, T. J., Butcher, L. M., Feber, A., Teschendorff, A. E., Chakravarthy, A. R., Wojdacz, T. K., et al. (2014). ChAMP: 450k chip analysis methylation pipeline. Bioinformatics 30 (3), 428–430. doi:10.1093/bioinformatics/btt684
Ng, M., Fleming, T., Robinson, M., Thomson, B., Graetz, N., Margono, C., et al. (2014). Global, regional, and national prevalence of overweight and obesity in children and adults during 1980-2013: A systematic analysis for the global burden of disease study 2013. Lancet 384 (9945), 766–781. doi:10.1016/S0140-6736(14)60460-8
Niemann, B., Haufs-Brusberg, S., Puetz, L., Feickert, M., Jaeckstein, M. Y., Hoffmann, A., et al. (2022). Apoptotic Brown adipocytes enhance energy expenditure via extracellular inosine. Nature 609 (7926), 361–368. doi:10.1038/s41586-022-05041-0
Parle-McDermott, A., and Ozaki, M. (2011). The impact of nutrition on differential methylated regions of the genome. Adv. Nutr. 2 (6), 463–471. doi:10.3945/an.111.001008
Ritchie, M. E., Phipson, B., Wu, D., Hu, Y., Law, C. W., Shi, W., et al. (2015). Limma powers differential expression analyses for RNA-sequencing and microarray studies. Nucleic Acids Res. 43 (7), e47. doi:10.1093/nar/gkv007
Sayols-Baixeras, S., Subirana, I., Fernandez-Sanles, A., Senti, M., Lluis-Ganella, C., Marrugat, J., et al. (2017). DNA methylation and obesity traits: An epigenome-wide association study. The REGICOR study. Epigenetics 12 (10), 909–916. doi:10.1080/15592294.2017.1363951
Tian, Y., Morris, T. J., Webster, A. P., Yang, Z., Beck, S., Feber, A., et al. (2017). ChAMP: Updated methylation analysis pipeline for illumina BeadChips. Bioinformatics 33 (24), 3982–3984. doi:10.1093/bioinformatics/btx513
Wahl, S., Drong, A., Lehne, B., Loh, M., Scott, W. R., Kunze, S., et al. (2017). Epigenome-wide association study of body mass index, and the adverse outcomes of adiposity. Nature 541 (7635), 81–86. doi:10.1038/nature20784
Weisberg, S. P., McCann, D., Desai, M., Rosenbaum, M., Leibel, R. L., and Ferrante, A. W. (2003). Obesity is associated with macrophage accumulation in adipose tissue. J. Clin. Invest. 112 (12), 1796–1808. doi:10.1172/JCI19246
Wu, W., Yin, Y., Xu, K., Peng, Y., and Zhang, J. (2018). Knockdown of LGALS12 inhibits porcine adipocyte adipogenesis via PKA-Erk1/2 signaling pathway. Acta Biochim. Biophys. Sin. 50 (10), 960–967. doi:10.1093/abbs/gmy099
Xu, M., Wang, Y. M., Li, W. Q., Huang, C. L., Li, J., Xie, W. H., et al. (2022). Ccrl2 deficiency deteriorates obesity and insulin resistance through increasing adipose tissue macrophages infiltration. Genes Dis. 9 (2), 429–442. doi:10.1016/j.gendis.2020.08.009
Yang, R. Y., Hsu, D. K., Yu, L., Chen, H. Y., and Liu, F. T. (2004). Galectin-12 is required for adipogenic signaling and adipocyte differentiation. J. Biol. Chem. 279 (28), 29761–29766. doi:10.1074/jbc.M401303200
Yang, R. Y., Yu, L., Graham, J. L., Hsu, D. K., Lloyd, K. C., Havel, P. J., et al. (2011). Ablation of a galectin preferentially expressed in adipocytes increases lipolysis, reduces adiposity, and improves insulin sensitivity in mice. Proc. Natl. Acad. Sci. U. S. A. 108 (46), 18696–18701. doi:10.1073/pnas.1109065108
Yu, D., Rao, S., Tsai, L. M., Lee, S. K., He, Y., Sutcliffe, E. L., et al. (2009). The transcriptional repressor Bcl-6 directs T follicular helper cell lineage commitment. Immunity 31 (3), 457–468. doi:10.1016/j.immuni.2009.07.002
Keywords: obesity, methylation, immune infiltration, metabolism, comprehensive analysis
Citation: Wu P, Guo L, Li X, Du Y, Lin X, Ma X, Lin Y, Wen C, Yang C, Liu N, Feng Q, Xue Y and Guan M (2022) Comprehensive analysis of epigenomics and transcriptome data to identify potential target genes associated with obesity. Front. Genet. 13:1024300. doi: 10.3389/fgene.2022.1024300
Received: 21 August 2022; Accepted: 23 September 2022;
Published: 14 October 2022.
Edited by:
Xiaofan Lu, INSERM U964 Institut de Génétique et de Biologie Moléculaire et Cellulaire (IGBMC), FranceReviewed by:
Jialin Meng, First Affiliated Hospital of Anhui Medical University, ChinaCopyright © 2022 Wu, Guo, Li, Du, Lin, Ma, Lin, Wen, Yang, Liu, Feng, Xue and Guan. This is an open-access article distributed under the terms of the Creative Commons Attribution License (CC BY). The use, distribution or reproduction in other forums is permitted, provided the original author(s) and the copyright owner(s) are credited and that the original publication in this journal is cited, in accordance with accepted academic practice. No use, distribution or reproduction is permitted which does not comply with these terms.
*Correspondence: Meiping Guan, bXBndWFuQDE2My5jb20=
†These authors have contributed equally to this work and share first authorship
Disclaimer: All claims expressed in this article are solely those of the authors and do not necessarily represent those of their affiliated organizations, or those of the publisher, the editors and the reviewers. Any product that may be evaluated in this article or claim that may be made by its manufacturer is not guaranteed or endorsed by the publisher.
Research integrity at Frontiers
Learn more about the work of our research integrity team to safeguard the quality of each article we publish.