 Pooja Saini1Imran Sheikh1Dinesh Kumar Saini2
 Reyazul Rouf Mir3
 Harcharan Singh Dhaliwal1
 Vikrant Tyagi1*
- 1Department of Genetics-Plant Breeding and Biotechnology, Dr. Khem Singh Gill Akal College of Agriculture, Eternal University, Baru Sahib, India
- 2Department of Plant Breeding and Genetics, Punajb Agricultural University, Ludhiana, India
- 3Division of Genetics and Plant Breeding, Faculty of Agriculture SKUAST-Kashmir, Srinagar, India
A meta-analysis of QTLs associated with grain protein content (GPC) was conducted in hexaploid and tetraploid wheat to identify robust and stable meta-QTLs (MQTLs). For this purpose, as many as 459 GPC-related QTLs retrieved from 48 linkage-based QTL mapping studies were projected onto the newly developed wheat consensus map. The analysis resulted in the prediction of 57 MQTLs and 7 QTL hotspots located on all wheat chromosomes (except chromosomes 1D and 4D) and the average confidence interval reduced 2.71-fold in the MQTLs and QTL hotspots compared to the initial QTLs. The physical regions occupied by the MQTLs ranged from 140 bp to 224.02 Mb with an average of 15.2 Mb, whereas the physical regions occupied by QTL hotspots ranged from 1.81 Mb to 36.03 Mb with a mean of 8.82 Mb. Nineteen MQTLs and two QTL hotspots were also found to be co-localized with 45 significant SNPs identified in 16 previously published genome-wide association studies in wheat. Candidate gene (CG) investigation within some selected MQTLs led to the identification of 705 gene models which also included 96 high-confidence CGs showing significant expressions in different grain-related tissues and having probable roles in GPC regulation. These significantly expressed CGs mainly involved the genes/gene families encoding for the following proteins: aminotransferases, early nodulin 93, glutamine synthetases, invertase/pectin methylesterase inhibitors, protein BIG GRAIN 1-like, cytochrome P450, glycosyl transferases, hexokinases, small GTPases, UDP-glucuronosyl/UDP-glucosyltransferases, and EamA, SANT/Myb, GNAT, thioredoxin, phytocyanin, and homeobox domains containing proteins. Further, eight genes including GPC-B1, Glu-B1-1b, Glu-1By9, TaBiP1, GSr, TaNAC019-A, TaNAC019-D, and bZIP-TF SPA already known to be associated with GPC were also detected within some of the MQTL regions confirming the efficacy of MQTLs predicted during the current study.
Introduction
The hexaploid bread wheat (Triticum aestivum L.) is the major food crop for approximately one-third of the world population with 760.93 million thousand tonnes of production from a growing area of over 219 million thousand hectares (https://www.fao.org). It constitutes the 20 percent dietary component of both calories and protein in the human diet (Peng et al., 2011; Pal et al., 2022). The tetraploid durum wheat (Triticum turgidum L. subsp. Durum Desf.) is mainly used for pasta making. The most extensively produced species is common wheat (95%) followed by durum wheat accounting for the remaining 5%. Given the ever-increasing emphasis on health among consumers, wheat breeding efforts have recently shifted their focus from enhancing production to enriching quality end products with high nutritional value (Saini et al., 2020). Wheat quality is a versatile and complex phenomenon involving various factors (Peng et al., 2022). Both protein content, as well as the quality of processed wheat products, is primarily governed by grain protein content (GPC) and protein quality (protein profile). Wheat proteins are challenging to define due to their tremendous complexity in genetic factors and diverse environmental influence with one another.
Wheat grain storage proteins are a complex mixture of various polypeptide chains that have typically been categorized based on their solubility or composition and structure (Peng et al., 2022). GPC has an important role in determining the crop’s commercial worth by altering the end-use quality and nutritional content of flour/semolina. Given that mature wheat grains typically contain 8–16% protein (Žilić et al., 2011), one of the breeders’ key goals is to find stable QTLs and superior alleles that can be successfully introgressed from high GPC lines to low GPC lines but superior in terms of agronomic traits (Kumar et al., 2018). The quantitative nature makes it a challenging task to improve GPC, as it is governed by several genes and affected by surrounding factors and crop management operations (Saini et al., 2020). With the genotypes, locations, and computational analysis, the heritability of GPC ranged from 0.41 to 0.70 (Giancaspro et al., 2019). Quality and quantity of protein have long been important considerations in wheat breeding. However, the negative association betwixt grain productivity and GPC, considerable environmental effects, and the narrow genetic base existing within the cultivated species of gene pool all complicate the increase in GPC (Iqbal et al., 2016). GPC improvement through traditional breeding procedures has mostly yielded mediocre results.
The combination of modern genetic tools such as DNA markers, genetic linkage maps, and high throughput phenomics platforms with genomic resources i.e. high quality wheat genome sequence and comparative genomics analysis with model species has speed up the genetic dissection of GPC in wheat cultivars (Saini et al., 2020; Gill et al., 2022). Several GPC-QTLs have been reported and located across all the chromosomes of both common wheat (e.g., Boehm et al., 2017; Krishnappa et al., 2017; Cook et al., 2018; Su et al., 2020; Jiang et al., 2021) and tetraploid wheat (Conti et al., 2011; Blanco et al., 2012; Marcotuli et al., 2017; Fatiukha et al., 2020; Ruan et al., 2021). However, very few reported QTLs could be successfully employed in molecular breeding programs mainly owing to the large confidence intervals (CIs), small phenotypic variation explained (PVE) by individual QTLs, and discrepancies in mapping results due to variations in the genetic backgrounds and environmental effects.
A meta-analysis of the QTLs identified in different experiments can be effective in refining the numbers and positions of the QTLs and detecting stable and consensus QTLs or meta-QTLs (MQTLs). It has been found that this is the most dynamic approach for the identification of genomic regions for a particular trait effectively by reducing the CI’s and therefore enhancing the detection of candidate genes (CGs) underlying the causative genomic regions (Goffinet and Gerber, 2000; Sosnowski et al., 2012; Shafi et al., 2022). Significant genomic regions are associated with several economically important traits such as grain yield and its attributing parameters (Saini et al., 2022c), nitrogen physiology (Sandhu N. et al., 2021b; Saini et al., 2021), tolerance to environmental stresses (Kumar et al., 2021; Pal et al., 2021), single disease resistance such as leaf rust and multiple disease resistance (Amo and Soriano, 2022.; Pal et al., 2022; Saini et al., 2022a) in wheat and other cereal crops. The MQTLs related to nutritional and quality traits have been reported in durum and bread wheat (Quraishi et al., 2017; Soriano et al., 2021; Gudi et al., 2022). The very first study conducted by Quraishi et al. (2017) discovered six and eight MQTLs associated with GPC and baking quality traits respectively, utilizing 155 original QTLs obtained from only eight linkage-based QTL mapping studies published before the year 2013. In the second study, Soriano et al. (2021) utilized 171 QTLs for meta-analysis and identified several MQTLs associated with different quality-related traits such as mineral contents, yellow pigment, and a few shared MQTLs for GPC in durum wheat. Most recently, Gudi et al. (2022) detected several shared MQTLs each associated with different quality traits using the studies published after the year 2013. Overall, all three above-mentioned studies utilized only a fraction of QTLs available for GPC either in durum or bread wheat; none of the studies considered all the available QTLs from both bread and durum wheat, simultaneously. Therefore, the present study was planned to integrate all the available QTLs associated with GPC in durum and bread wheat and to perform a meta-analysis for the identification of the most robust MQTLs associated with GPC.
In addition to the above, with the advancements in the next-generation sequencing (NGS) technology, high throughput genotyping strategies i.e. GBS, RAD sequencing, SNP array, and advancements in GWAS approaches, it becomes very easy to identify the significant genomic loci associated with quantitative traits in crop plants (Halder et al., 2019; Sidhu et al., 2020; Sandhu et al., 2021a; Sandhu et al., 2021b; Saini et al., 2022b). The integration of meta-analysis with GWAS has been utilized in several studies for the investigation of key genomic regions associated with economic traits (Bilgrami et al., 2020; Saini et al., 2022a; Saini et al., 2022b). The overall goal of this meta-analysis was to combine QTLs associated with GPC in tetraploid and hexaploid wheat with the aim of identification of consensus genomic regions and their confirmation through GWAS, which can be used in MQTL-assisted breeding, and to consolidate thorough information for developing novel wheat cultivars with high GPC. MQTL genes were discovered and functionally characterized. RNA-seq and microarray datasets were also used to find high-confidence CGs with significant expressions in relevant wheat tissues. The findings of this study may help in the identification of diagnostic markers and their utilization in marker-assisted breeding (MAB) or genomic selection (GS) in wheat to improve GPC.
Materials and methods
Collection of data on QTLs associated with grain protein content
The research articles pertaining to GPC in durum and bread wheat were collected from different repositories/databases including PubMed (https://www.pubmed.ncbi.nlm.nih.gov), Google Scholar (https://scholar.google.com/). The information on (i) markers flanking the individual QTLs (ii) peak positions and confidence intervals (CI’s) of the individual QTLs (iii) kind and size of the segregating population used in the individual studies (iv) LOD score and phenotypic variation explained (PVE) or R2 values were collected for each QTLs linked with GPC. Whenever the peak position of the QTLs was not given, the mid-values of the two flanking markers were used to estimate the peak positions. When there was no information on LOD scores, the threshold LOD of 3.0 was used and unique identities were assigned to individual QTLs for analysis.
The mapping studies utilized 49 different mapping populations (including 37 RILs, 11 DH, and one NIL population) with the size ranging from 82 to 306 (Supplementary Table S1). The size of 37 RIL populations ranged from 93 to 302, the size of 11 DH populations ranged from 95 to 414 and the size of the NIL population was 120. SSR and SNP markers were mostly utilized for mapping in these linkage-based mapping studies in wheat. As many as 459 GPC-QTLs were available from these 48 studies. Of these 459 QTLs, 133 and 326 QTLs belonged to durum and hexaploid wheat, respectively (Figure 1A).
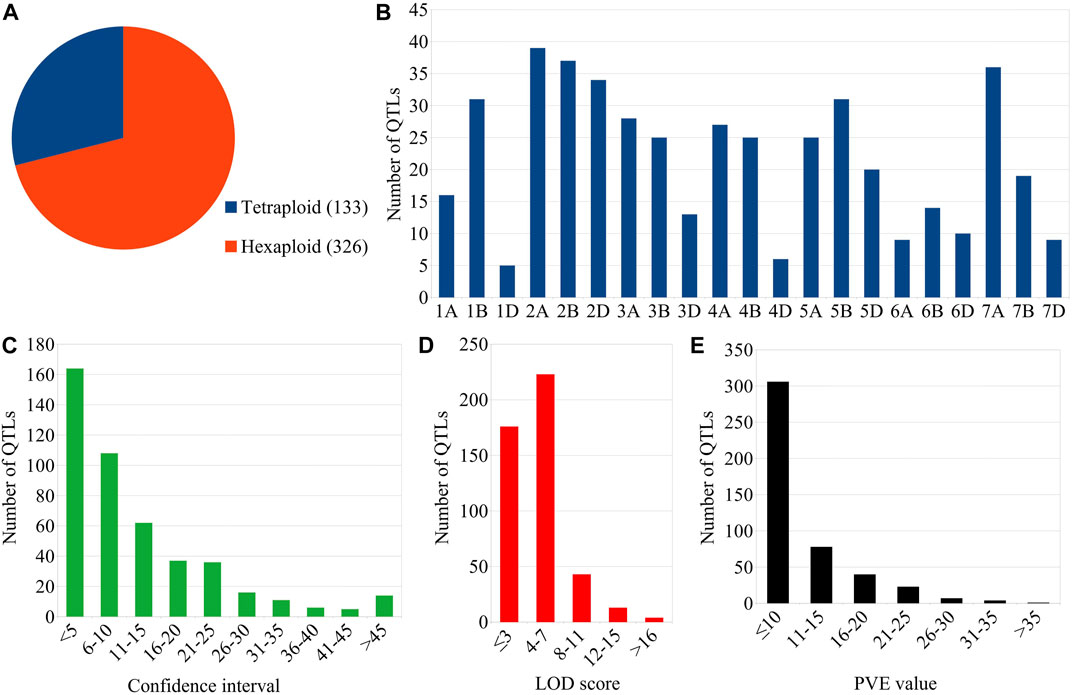
FIGURE 1. Salient features of GPC-QTLs considered during the present study. (A) Species-wise distribution of QTLs, (B) chromosome-wise distribution of QTLs, (C) Confidence intervals (D) LOD scores, and (E) PVE values of the QTLs.
Construction of consensus linkage map
During present study, the markers information from previously published high-quality linkage maps used for QTL mapping in durum and common wheat for grain protein content was utilized for the development of a consensus genetic map these high-quality linkage maps are as follows- (i) the ‘Wheat, Consensus SSR, 2004’ with 1,258 marker loci (Somers et al., 2004), (ii) the ‘ITMI_SSR map’ involving 1,398 marker loci (Röder et al., 1998; Somers et al., 2004), (iii) an integrated map of durum wheat composed of 30,144 markers (Marone et al., 2013) (iv) the “Illumina iSelect 90 K SNP Array”-based genetic map with 40,267 loci (Wang et al., 2014) (v) the “AxiomR, Wheat 660 K SNP array”-based genetic map with 119,566 markers (Cui et al., 2017). The information on markers from individual investigations was used for consensus map development. The LPMerge R package was used for the development of a consensus linkage map (Endelman and Plomion, 2014). LPmerge utilizes linear programming to reduce the mean absolute error between the linkage maps and consensus maps as effectively as possible. This minimization is done under the constraints of linear inequality, which ensures that the order of the markers in the linkage maps is maintained. When linkage maps have incompatible marker orders, a minimum set of ordinal constraints is removed to resolve the problems.
QTL projection and meta-QTL analysis
Two different files i.e., QTL file and map file were prepared from the individual QTL mapping studies. The QTL file contains the following informations: name of the QTLs, chromosomes number, linkage group, LOD scores, PVE value of individual QTLs, genetic positions of the markers flanking the QTLs, and peak positions of QTLs. Whereas, the map files mainly included the following information-population type, size, mapping function considered for mapping, chromosome-wise markers, and their respective genetic positions. These QTL files and map files were uploaded to the BioMercator V4.2 software (Sosnowski et al., 2012) and QTL projection was performed following the guidelines given in the manual (https://www.ebi.ac.uk/eccb/2014/eccb14.loria.fr/programme/id_track/ID10-summary.pdf). In the QTLs for which CI information was not available, the CI (95%) was computed from the following empirical formulas for different types of mapping populations:
CI (95%) = 530/N x R2 for backcross and F2 populations (Visscher and Goddard., 2004)
CI (95%) = 287/N x R2 for doubled haploid lines (Liu et al., 2009)
CI (95%) = 163/N x R2 for RIL lines (Guo et al., 2006)
Where N denotes the number of individuals of the concerned mapping populations utilized for mapping and R2 is the percentage of phenotypic variation explained (PVE) by an individual QTL. Values 530, 287, and 163 are the constants derived from simulations considering some parameters such as the proportion of recombination per cM, size of the mapping population, etc. (Visscher and Goddard, 2004; Weller and Soller, 2004; Guo et al., 2006).
The meta-QTL analysis was performed via the Veyrieras two-step algorithm available from the software BioMercator V4.2 for individual chromosomes. The optimal QTL model was chosen in the first step when the lowest criterion values were obtained in at least three of the five selection models [Akaike Information Criterion (AIC), Corrected AIC, AIC model-3, Bayesian Information Criterion, and Average Weight of Evidence Criterion]. In the second step, a model was used to determine the number of MQTLs on each chromosome. Finally, the consensus locations and 95% CI of the MQTLs were calculated using the variances of initial QTL positions and their intervals, respectively (Sosnowski et al., 2012).
Determination of the physical position of the meta-QTLs
The nucleotide sequences of the MQTLs flanking markers were used for the determination of individual MQTLs physical coordinates. The flanking markers nucleotide sequences were retrieved from either of the following databases-(i) database for Triticeae and Avena (GrainGenes; https://wheat.pw.usda.gov/) for the markers such as SSR and ISSR (ii) JBrowse WHEAT UGRI (https://urgi.versailles.inra.fr/jbrowseiwgsc/) and CerealsDB for the SNP markers (https://www.cerealsdb.uk.net/cerealgenomics/CerealsDB/indexNEW.php). These sequences were BLASTed against wheat reference genome “Chinese Spring (RefSeq v1.0)” accessible at the EnsemblPlants database (https://plants.ensembl.org/index.html) to ascertain the physical positions of the markers flanking the MQTLs.
Checking the efficacy of meta-QTLs with genome wide association study
The physical positions of significant SNPs/marker-trait associations (MTAs) related to GPC identified through 15 GWAS studies published during 2017–2022 were compared with the MQTLs genomic coordinates reported in the present study. The overlapping of MQTLs with at least one significant SNP/MTA was considered as GWAS verified MQTLs.
The 15 GWA studies involved different association panels of wheat such as spring wheat, winter wheat (hard and soft), and durum/emmer wheat. The statistic regarding the type of wheat, population size, and SNPs with GPC in wheat from different GWA studies are given in (Supplementary Table S5).
Candidate genes and their expression analysis
The MQTLs comprising at least three initial QTLs were considered promising MQTLs which were further analyzed for candidate genes (CGs) identification. MQTLs with less than 2 Mb physical intervals were straightway examined for accessibility of gene models; whereas for the MQTLs with more than 2 Mb physical intervals, the first peak physical positions of MQTLs were estimated as per the formula used by Saini et al. (2022c) then, 2 Mb regions around the MQTL peaks were utilized for the detection of gene models. Information on genes available from each MQTL was retrieved using the BioMart tool available in the EnsemblPlants database.
Gene models detected as above were further subjected to in silico expression analysis using the ‘Wheat Expression Browser-expVIP’ (Expression Visualization and Integration Platform) (http://www.wheat-expression.com) (Ramírez-González et al., 2018). Relevant datasets (Gillies et al., 2012; Li et al., 2013; Pfeifer et al., 2014; Pearce et al., 2015; Clavijo et al., 2017) including expression datasets related to grains and related tissues were utilized for this purpose. Further, considering the importance of flag leaf senescence in regulating the protein contents in grains, datasets including expression data on genes showing expression during a time course of flag leaf senescence (Cantu et al., 2011; Borrill et al., 2019) were also utilized for the expression analysis. Gene models with more than 2 transcripts per million (TPM) expressions in relevant wheat tissues were considered in the current study. Further, heat maps were constructed by using the software “Morpheus” (https://software.broadinstitute.org/morpheus/) to exhibit the patterns of expressions of different genes in different tissues.
Over and above that, the nucleotide sequences of earlier associated known genes with GPC were subjected to BLAST analysis against the IWGSC RefSeq v1.0 accessible at the EnsemblePlants database. The physical coordinates of known genes were retrieved and compared with the genomic positions of MQTL regions to discover their co-localization.
Results
QTLs associated with grain protein content
Forty-eight (48) linkage-based mapping studies (involving 11 studies on tetraploid wheat and 37 on hexaploid wheat) pertaining to GPC-QTLs were reviewed and considered for the present study (Supplementary Table S1). The number of mapping studies, type of mapping population, and population size are described above. The chromosome-wise analysis revealed that the QTLs distribution across all the three sub-genomes was not uniform (Figure 1B). Sub-genomes A (180 QTLs) and B (182 QTLs) carried almost same number of QTLs associated with GPC, whereas, sub-genome D carried a small fraction of QTLs (only 97 QTLs). As many as 164 QTLs had a CI of less than 5 cM, whereas, the remaining QTLs had a CI of more than 5 cM with 88 QTLs possessing a CI of more than 20 cM (Figure 1C). LOD score of individual QTLs varied from ≤ 3.0 to a maximum of 31.8 with 23 QTLs having LOD scores of >10 (Figure 1D). As many as 306 QTLs contributed less than 10% variation to total phenotypic variation. There were 35 QTLs that had a PVE value of >20% (Figure 1E).
Consensus genetic map of wheat
The wheat consensus map constructed during the present study depicted significant variation for individual chromosomes with respect to genetic length (Supplementary Table S2). The consensus map covered a distance of 9,882.15 cM (chromosomal length ranging from 294.84 cM for 4D to 743.48 for 5A with an average of 470.58 cM) which accommodated 137,845 molecular markers mainly including SNPs, SSR, and other markers such as DArT, RFLP, ISSR, and AFLP. The sub-genomes A, B and D covered 4011.64, 2979.21 and 2891.3 cM genetic distances, respectively. The number of markers mapped on individual chromosomes varied from 361 markers on 4D to 18,944 markers on 3B. The sub-genome B possessed a maximum number of markers (62,780 markers) followed by subgenome A with 59,963 and subgenome D with 15,102 markers (Figure 2). The marker densities also differed among the three sub-genomes with sub-genome B showing a maximum density of 21.07 markers/cM and sub-genome D exhibiting a minimum density of 5.22 markers/cM.
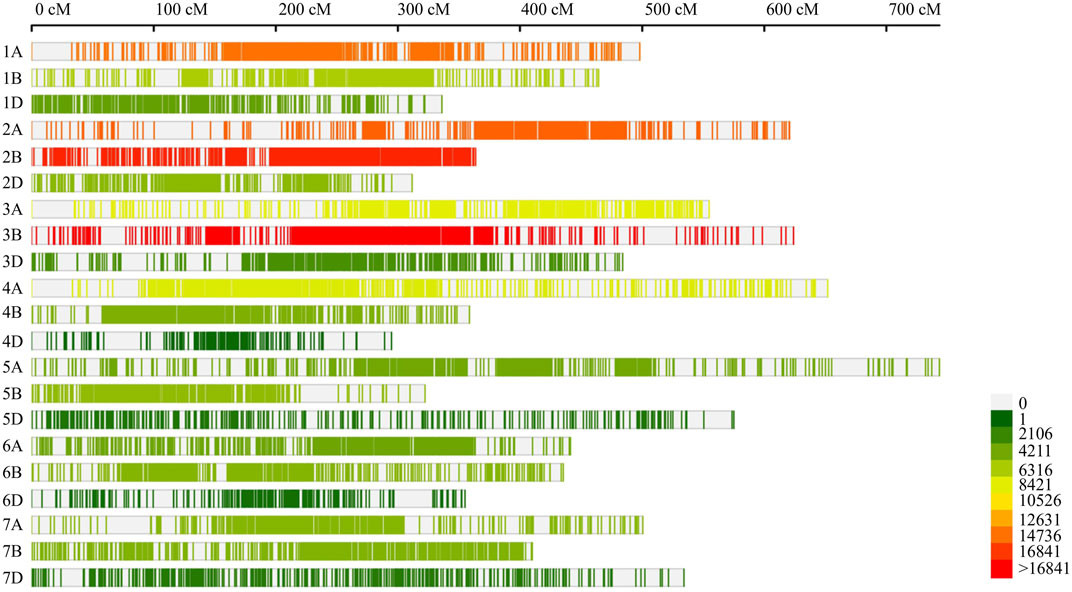
FIGURE 2. Marker density on consensus genetic map used for meta-QTL analysis in the current study. The number of loci mapped on individual chromosome.
QTLs projected on the consensus map and meta-QTLs predicted for grain protein content
From the 459 QTLs retrieved from 48 mapping studies, 304 QTLs could be projected onto the consensus genetic map. Due to some of the obvious reasons mentioned previously, the remaining 155 QTLs were unable to be projected onto the consensus map (Pal et al., 2022; Gudi et al., 2022). After QTL projection, a meta-analysis was performed which resulted in the identification of 65 potential genomic regions [including 57 MQTLs (each involving at least 2 QTLs derived from different studies) and 7 QTL hotspots (each involving multiple QTLs derived from a single study)] associated with GPC (Figures 3, 4A) based on 233 initial QTLs leaving 45 initial QTLs as singletons (single QTLs) and 26 QTLs with peaks outside the supporting intervals of identified potential genomic regions. Out of 57 MQTLs, a total of 24 MQTLs were predicted on sub-genome A, the maximum number of MQTLs was found on chromosome 7A, where there were seven MQTLs, followed by chromosome 5A which contained 4 MQTLs. In contrast, chromosomes 1A, 2A, 3A, and 4A each contained three MQTLs, and chromosome 6A had just one MQTL (Supplementary Table S3, Figure 4B).
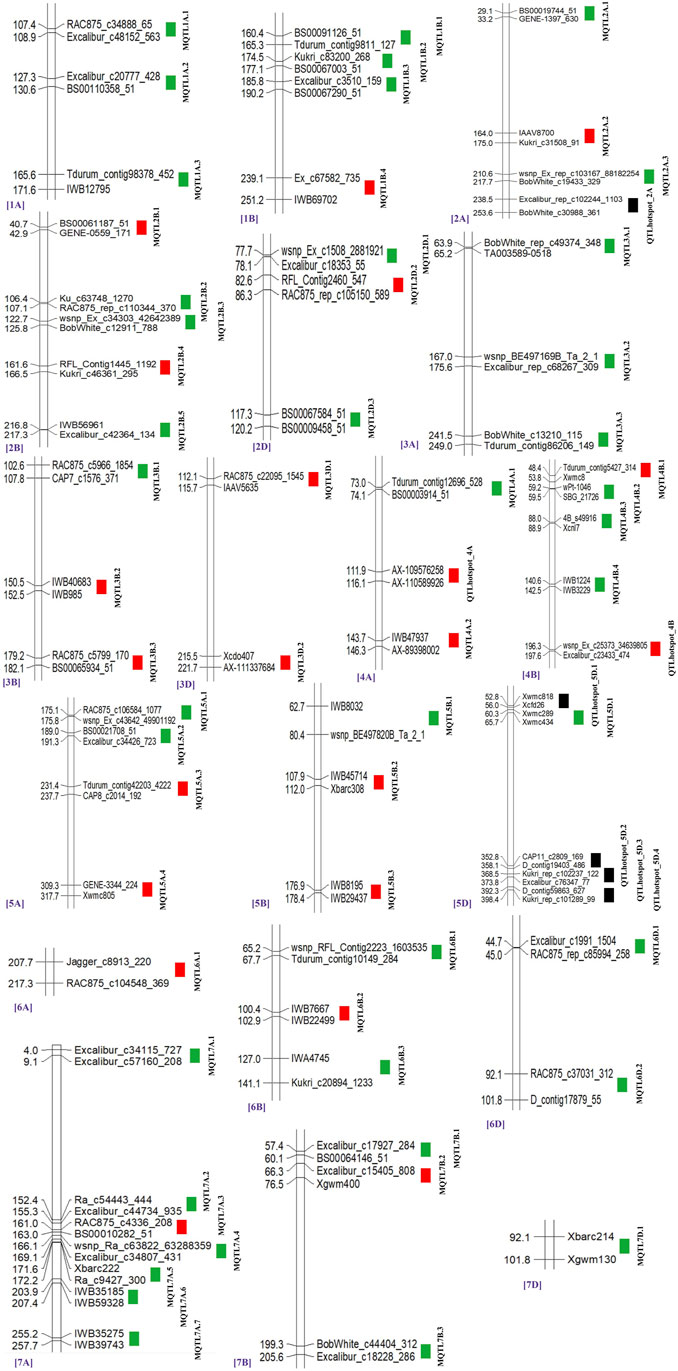
FIGURE 3. Distribution of MQTLs and QTL hotspots on different wheat chromosomes. GWAS-validated MQTL and QTL hotspots are shown with red boxes.
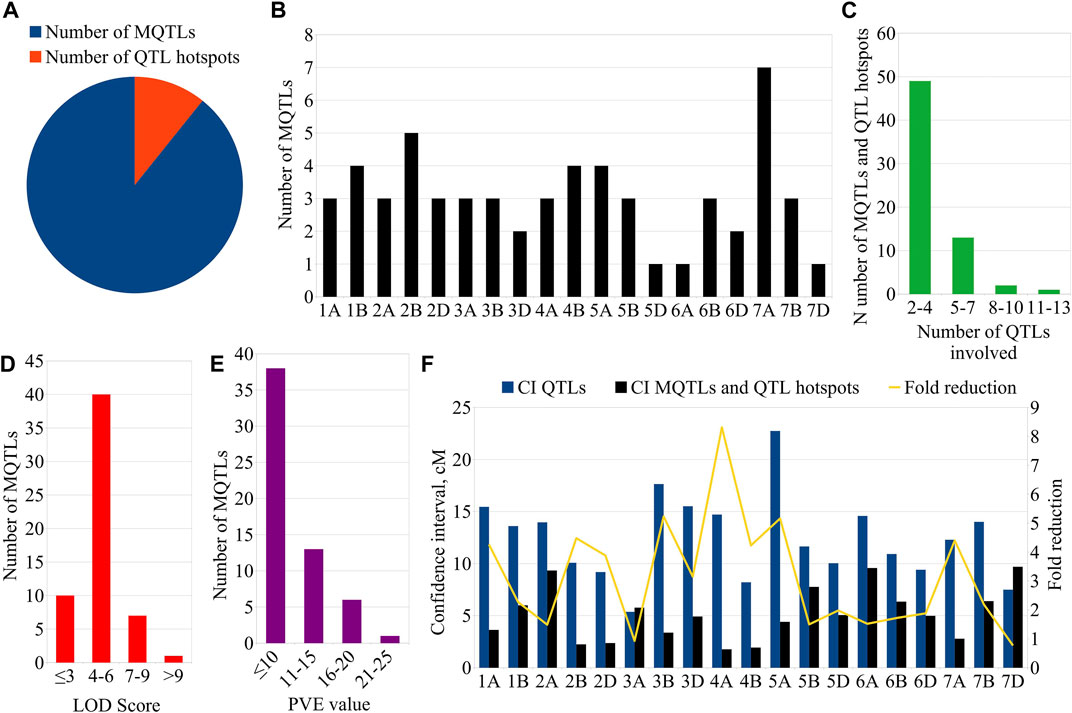
FIGURE 4. Key characteristics of MQTLs and QTL hotspots. (A) Proportion of MQTLs and QTL hotspots associated with GPC, (B) chromosome-wise distribution of MQTLs, (C) Number of QTLs involved in MQTLs and QTL hotspots, (D) LOD scores of the individual MQTLs, (E) PVE values of the MQTLs, (F) Fold reduction in CI of QTLs after meta-analysis.
There were 25 MQTLs available on sub-genome B, making it the sub-genome with the maximum number of MQTLs. Chromosome 2B was found to have the maximum number of 5 MQTLs. This was followed by chromosomes 1B and 4B each with 4 MQTLs, and chromosomes 3B, 5B, 6B, and 7B each with 3 MQTLs. On sub-genome D, a total of 9 MQTLs were predicted; chromosome 2D had the most, three MQTLs, followed by two MQTLs on each of chromosomes 3D, and 6D, but only one MQTL on each of chromosomes 5D and 7D, whereas, no MQTL was detected on chromosomes 1D and 4D. The number of QTLs per MQTL varied from 2 in 28 MQTLs to ≥5 QTLs in the 16 MQTLs including MQTL7A.2 involving 10 QTLs and MQTL3A.2 involving 13 QTLs (Figure 4C). Among the 7 QTL hotspots, 4 QTL hotspots were mapped on chromosome 5D and one each on chromosomes 2A, 4A, and 4B.
The average LOD score of the identified MQTLs varied from 2.80 (MQTL7D.1) to 18.40 (MQTL6B.2) (Supplementary Table S3, Figure 4D). The average PVE for MQTLs ranged from 3.80 (MQTL3B.3) to 21.34% (MQTL7D.1) (Figure 4E). The 57 MQTL and 7 QTL hotspots chromosome wise physical position, LOD score and PVE and CI are given (Tables 1, 2). Of the identified 57 MQTLs, nine MQTLs (viz., MQTL2B.1, MQTL2D.1, MQTL3A.2, MQTL3B.1, MQTL4A.1, MQTL4A.4, MQTL6A.1, MQTL7B.2, and MQTL7D.1) had more than 15% of PVE. Whereas the average PVE for QTL hotspots ranged from 6.60 to 24.78% and the number of QTLs involved in each hotspot ranged from 2 to 4 (Supplementary Table S4). With an average of 4.6 cM, the CI ranged from 0.3 to 17.71 cM for the reported MQTLs and QTL hotspots (Figure 4F). The CI reduction among the different wheat chromosomes varied significantly, with the average CI of MQTLs and QTL hotspots being 2.71 times less than that of original QTLs. The mean CI of MQTLs present on 4A reduced by 8.31 times followed by 5.23 and 5.15 times of MQTLs located on 3B and 5A, while, a slight reduction in CI was observed for MQTLs present on 3A (0.93 times) and 7D (0.77 times). The physical regions covered by MQTLs ranged from 140 bp to 224.02 Mb with an average of 15.2 Mb, whereas the physical regions occupied by QTL hotspots ranged from 1.81 Mb to 36.03 Mb with a mean of 8.82 Mb (Supplementary Table S3).
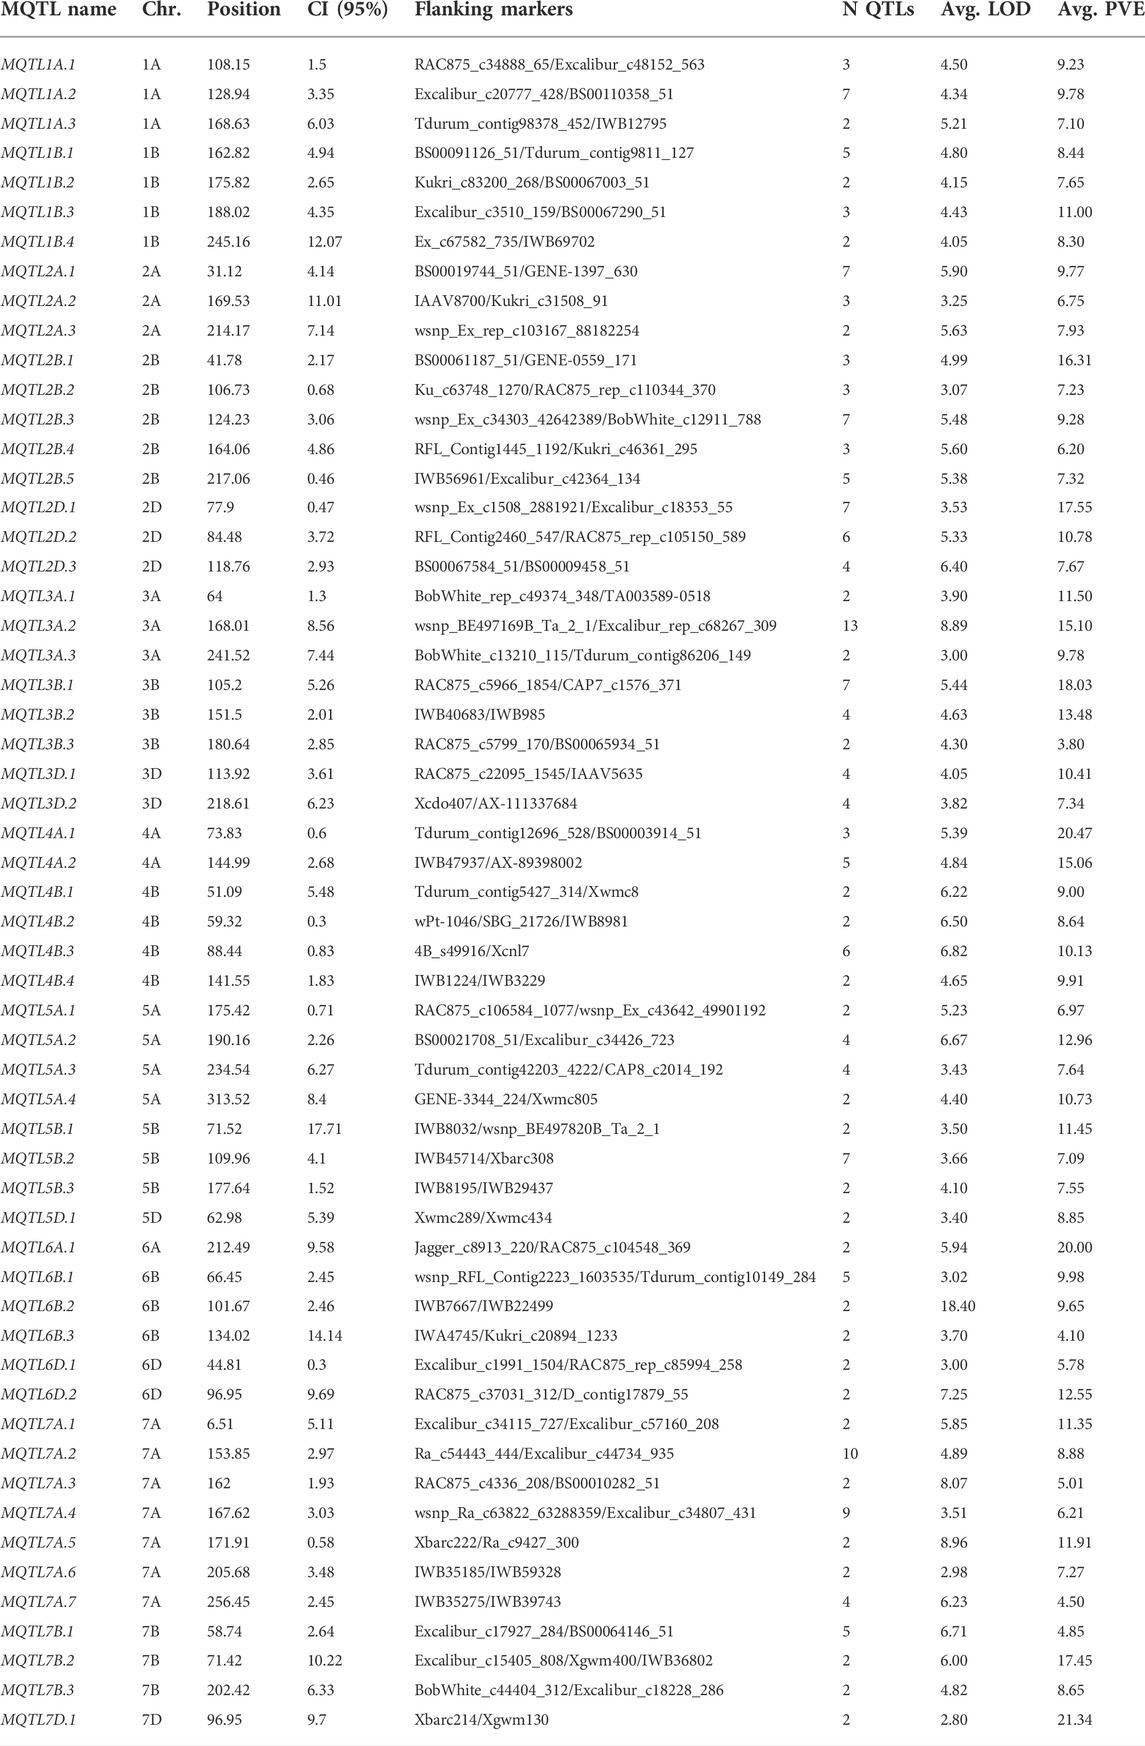
TABLE 1. MQTLs associated with GPC in wheat identified in the present study.
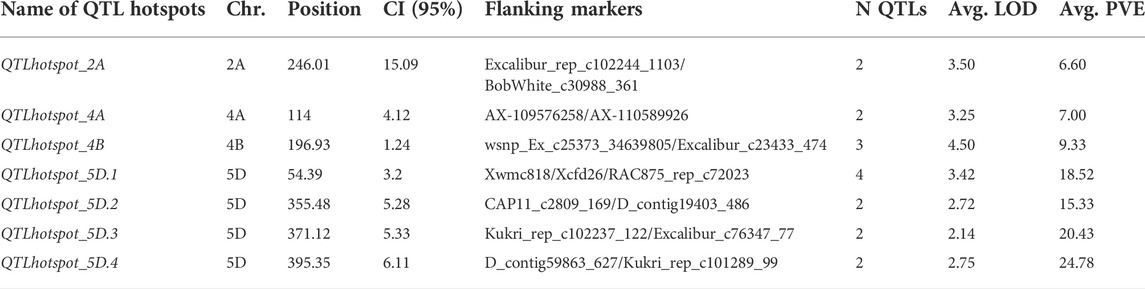
TABLE 2. QTL hotspots associated with GPC in wheat identified in the present study.
Verification of meta-QTLs with genome wide association study
The genomic positions of the MQTLs and QTL hotspots were compared with the genomic locations of marker-trait associations (MTAs) or significant SNPs identified in 15 earlier GWA studies (Supplementary Table S5) which utilized the association panels of hexaploid wheat (spring and winter type) and tetraploid wheat (durum and wild emmer type). This comparison enabled the identification of 19 MQTLs and 2 QTL hotspots which co-localized with 41 MTAs/SNPs identified in these previous studies (Supplementary Table S6, Figure 3). The number of MTAs/SNPs co-localized with an individual MQTL also differed. Of the 19 MQTLs, MQTL1B.4 co-localized with a maximum of 7 MTAs/SNPs identified in 5 GWA studies (Rapp et al., 2018; Muhu-Din Ahmed et al., 2020; Jiang et al., 2021; Lou et al., 2021; Leonova et al., 2022), followed by MQTL2B.1 co-localized with 6 MTAs/SNPs detected in 4 GWA studies (Liu et al., 2018; Chen J. et al, 2019; Liu et al., 2019; Rathan et al., 2022) and MQTL4A.1 co-localized with 4 MTAs/SNPs identified in one GWA study (Liu et al., 2018). Three MQTLs viz., MQTL3D.1, MQTL5B.3 and MQTL7B.2 coincided with three MTAs/SNPs identified in different GWA studies.
Candidate gene and expression analysis associated with identified meta-QTLs
A total of 32 promising MQTLs based on at least three original QTLs from different studies were chosen and investigated further for the identification of available gene models. This investigation enabled the identification of 705 gene models, with a maximum of 70 gene models available from MQTL2D.2 and a minimum of only one available from MQTL1A.2, MQTL1B.3, and MQTL7A.2 each (Supplementary Table S7). The expression analysis of 705 genes resulted in the detection of 285 significantly expressed genes with more than 2 TPM expressions in relevant wheat tissues such as leaves, spikes, and grains (Supplementary Table S7). Ninety-six promising candidate genes (CGs) believed to be associated with GPC in wheat were selected (Supplementary Table S7, Figure 5) from the significantly expressed genes which encode different types of proteins such as aminotransferases, early nodulin 93, glutamine synthetases, invertase/pectin methylesterase inhibitors, protein BIG GRAIN 1-like, cytochrome P450, Sec31, glycosyl transferases, hexokinases, small GTPases, UDP-glucuronosyl/UDP-glucosyltransferases, protein kinases, glycoside hydrolases, and EamA, SANT/Myb, GNAT, thioredoxin, phytocyanin, zinc finger, basic-leucine zipper, and homeobox domains containing proteins.
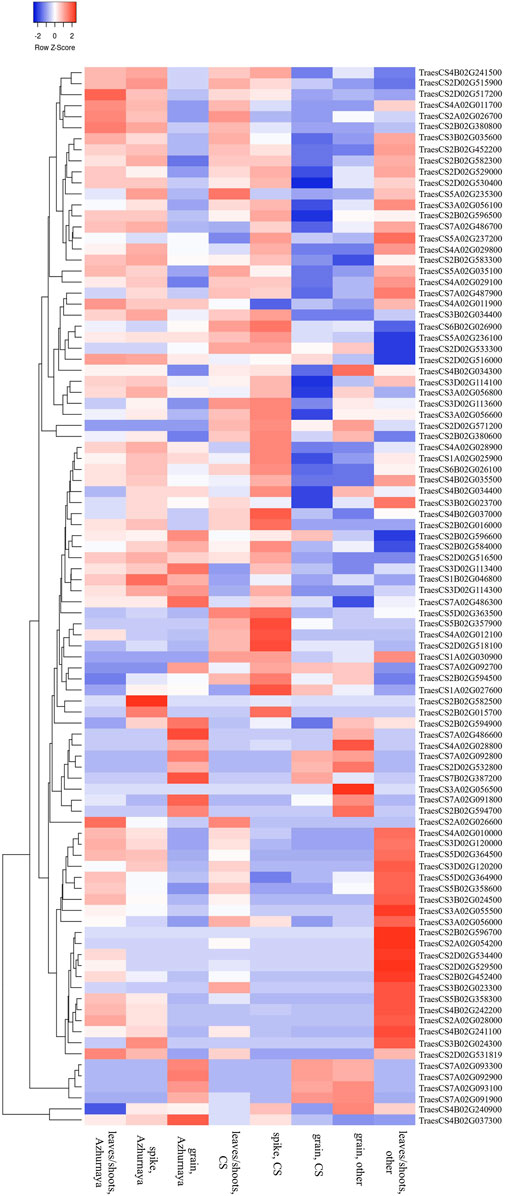
FIGURE 5. Expression patterns of selected high-confidence candidate genes in different wheat tissues.
Further, a comparison of known genes for GPC with genomic regions identified through meta-analysis may also assist the efforts being made to unravel the molecular mechanisms regulating GPC in wheat. Therefore, the association of known GPC genes with MQTLs and QTL hotspots was also investigated during the present study. Five such MQTLs (viz., MQTL1B.4, MQTL3A.3, MQTL3D.1, MQTL6B.3, and MQTL6D.2) and 2 QTL hotspots (QTLhotspot_4B and QTLhotspot_5D.4) were found to be associated with eight genes known to regulate GPC in wheat (Supplementary Table S8). These genes include the following- Glu-B1-1b (encoding for HMW glutenin subunit), Glu-1By9 (HMW glutenin subunit), TaNAC019-A (endosperm-specific transcription factor), TaNAC019-D (endosperm-specific transcription factor), GSr (glutamine synthetase), bZIP transcription factor SPA (Basic leucine zipper TF), GPC-B1 (NAC transcription factor), and TaBiP1 (endoplasmic reticulum chaperone binding protein).
Discussion
GPC is an essential trait that affects end-use quality and the economic worth of common and durum wheat (Kumar et al., 2018). Improvement in GPC content is the utmost breeding objective in wheat as chapatti making, bread making, and pasta preparation largely depend upon the GPC in both bread wheat and durum wheat. Conventional breeding techniques have been used to improve the GPC, but the expected rate of improvement has not been reached because of the strong environmental influence, the lack of a positive relationship betwixt grain yield and GPC, and the quantitative nature of the trait and low heritability (Balyan et al., 2013). With the introduction of molecular markers and next-generation sequencing, as well as other biotechnological interventions, multiple genomic regions (genes/QTLs) linked to GPC have been discovered in wheat using several mapping populations (Prasad et al., 2003; Zhao et al., 2010; Wang et al., 2012; Kumar et al., 2018; Ruan et al., 2021). Furthermore, it has been noted in several studies that QTLs found in one population may not be useful for improving traits in a different mapping population.
Meta-analysis is a novel and powerful tool which can help in integrating QTL information generated in multiple studies involving different types of populations and enable the identification of reliable and stable MQTLs linked with the target traits (Quraishi et al., 2017). Meta-analyses for different traits have been reported in major food crops such as rice, wheat, maize, etc., (Quraishi et al., 2017; Hu et al., 2021; Prakash et al., 2022). In wheat, meta-analyses have been performed for several traits which include yield and yield-associated parameters (Saini et al., 2022c), quality traits (Quraishi et al., 2011; Shariatipour et al., 2021; Soriano et al., 2021; Singh et al., 2022; Gudi et al., 2022); disease resistance (Liu et al., 2009; Soriano and Royo, 2015; Venske et al., 2019; Liu et al., 2020; Jan et al., 2021; Saini et al., 2022a) and abiotic stress tolerance (Kumar et al., 2021; Pal et al., 2021; Soriano et al., 2021). Previously, meta-analyses of QTLs linked with quality attributes in wheat were also undertaken (Quraishi et al., 2017; Soriano et al., 2021; Gudi et al., 2022).
Quraishi et al. (2017) found six MQTLs for GPC and eight MQTLs for baking quality utilizing only 155 QTLs in hexaploid wheat for the first time. Recently in 2021, Soriano et al. utilized 171 QTLs associated with different quality traits (viz., arabinoxylan, β-glucan, flour yellow color, grain mineral contents, GPC, SDS-sedimentation volume, and yellow pigment content) and identified 17 shared MQTLs (including QTLs for different quality traits, biotic and abiotic stress parameters) in durum wheat (Soriano et al., 2021). Most recently in 2022, Gudi et al. utilized QTLs reported after the year 2013 and identified several shared MQTLs for GPC (co-localized with different processing quality traits, dough rheology attributes, and nutritional traits). These earlier studies primarily involved the prediction of MQTLs for different traits taken together for different quality traits, biotic and abiotic stress parameters, and no effort was made to identify MQTLs for GPC utilizing all the available QTLs from both bread and durum wheat, thus reducing their utility in wheat breeding.
In contrast, the present study includes the projection of 304 QTLs out of 459 QTLs collected from literature published to date for GPC. The proportion of GPC QTLs projected on the consensus map in the current study is much greater than in earlier studies (Quraishi et al., 2017; Soriano et al., 2021; Gudi et al., 2022), which could be attributed to the presence of many QTLs and the use of a highly dense consensus map in the current study. In the present study, 57 MQTLs and 7 QTL hotspots associated with GPC were identified which were distributed across the three sub-genomes. The detection of 57 MQTLs and 7 QTL hotspots from 304 QTLs resulted in a 4.68-fold (304/65) reduction in the number of QTLs or genomic regions linked with GPC in wheat. Physical positions of four MQTLs (MQTL1B.4, MQTL4B.3, MQTL7B.2, and MQTL7B.3) predicted during the current study were reported to be overlapped with four MQTLs (durumMQTL1B.3, durumMQTL4B.4, durumMQTL7B.1, and durumMQTL7B.9) earlier identified to be associated with GPC in durum wheat (Soriano et al., 2021).
From a breeding viewpoint, it is important to determine the most reliable and robust MQTLs each based on numerous initial QTLs found in the various populations and environments. In the current study, 16 MQTLs each based on more than 5 original QTLs were observed. There were up to 13 initial QTLs associated with GPC in one MQTL on chromosome 3A (MQTL3A.2), which is significantly more than what was reported in earlier meta-analyses (Quraishi et al., 2017; Soriano et al., 2021; Gudi et al., 2022). The present study compiled extensive data on QTLs from different mapping populations. It effectively reduced the QTLs' CIs, enhancing the reliability of CG detection from potential MQTL regions. The mean CIs of MQTLs were 2.71 times lower than the CIs of the original QTLs included in the meta-analysis. As many as 15 MQTLs had CIs of less than 2 cM.
Validating meta-QTLs/QTL hotspots with genome wide association study
GWAS is an efficient approach for the dissection of complex traits by utilizing natural genetic diversity (Korte and Farlow, 2013). It is based on the principle of linkage disequilibrium which provides high-resolution power and allows the identification of significant MTAs or SNPs by utilizing high throughput genotyping and precise phenotypic data (Gupta et al., 2005). Meta-QTL analysis and GWAS both have their advantages and limitations that can complement each other. There were significant overlaps between the MQTLs predicted in this study and the MTAs identified by GWAS for GPC in wheat. Out of the 57 predicted MQTLs and 7 QTL hotspots, 19 MQTLs and 2 QTL hotspots overlapped with MTAs identified for GPC in recent GWA studies in wheat. In some of the earlier studies of meta-analysis, MQTLs for other traits of economic importance have also been validated using this method (Aduragbemi and Soriano, 2021; Gudi et al., 2022; Saini et al., 2021; Pal et al., 2022; Yang et al., 2021). In these earlier studies, only 38.66, 47.22, 78.57, 58.33, 69.23, and 61.37% of the physically anchored MQTLs were confirmed using GWAS data.
The number of MQTLs found in the current study that was confirmed by GWAS is within the range of MQTLs found in earlier studies. The varying proportions of MQTLs validated by GWAS-based MTAs/SNPs in different studies may be due to either of the following reasons: (i) the genetic material utilized in interval mapping (eventually in meta-analysis) and GWAS was completely different, (ii) neither method fully accounted for the genetic variations present in the gene pool for the target trait(s), (ii) GWAS is intended to detect MTAs with a minor allele frequency of more than 5%; nevertheless, linkage-based mapping studies can uncover rare alleles with more severe phenotypic effects, (iv) there were varying number of GWAS-MTAs available for analysis, (v) accuracy of physical positions of MQTLs to be compared with MTAs.
MQTL-assisted breeding for grain protein content improvement in wheat
Individual MQTL LOD scores varied from 2.80 to 18.40, with a mean of 5.15, whereas PVE values ranged from 3.80 to 21.34 percent, with a mean of 10.14 percent. Based on the above findings, the MQTLs were further filtered to identify some of the promising MQTLs for breeding, which we termed breeders' MQTLs, based on the following criteria: (a) CI less than 2.5 cM, (ii) PVE more than 10%, (iii) LOD more than 3.5, and (iv) dependency on at least three original QTLs from multiple studies; this effort enabled the detection of six breeder’s MQTLs (viz., MQTL2B.1, MQTL2D.1, MQTL3B.2, MQTL4A.1, MQTL4B.3, and MQTL5A.2) each located on different chromosomes 2B, 2D, 3B, 4A, 4B, and 5A (Supplementary Table S9). Three of these MQTLs (viz., MQTL2B.1, MQTL3B.2, MQTL4A.1) were also validated by GWA studies. The selected breeder’s MQTLs could be effectively utilized in MQTL-assisted breeding for the genetic enhancement of GPC in wheat. Two other MQTLs (viz., MQTL3A.2 and MQTL3B.1) located on chromosomes 3A and 3B, respectively, explained more than 15% of the phenotypic variations but had large CIs (8.56 and 5.26 cM, respectively) making them unsuitable for breeding programs. Although, these MQTLs could be considered for fine mapping and cloning in future studies.
Candidate genes associated with grain protein content
In the present study, a total of 705 gene models available from 32 promising MQTL regions were detected. Out of these 705 gene models, as many as 285 gene models (available from 30 MQTLs) showed significant expressions in different wheat tissues. The MQTL2D.2 had the maximum number of 35 significantly expressed genes, whereas, MQTL1B.3, MQTL7A.2 had no significantly expressed gene. Among the 285 significantly expressed genes, 96 high-confidence CGs were selected based on their probable roles in the regulation of GPC in wheat (Table 3). These genes encode for different proteins such as follows-aminotransferases, early nodulin 93, invertase/pectin methylesterase inhibitors, protein BIG GRAIN 1-like, cytochrome P450, glycosyl transferases, hexokinases, small GTPases, UDP-glucuronosyl/UDP-glucosyltransferases, and EamA, CBS, SANT/Myb, GNAT, thioredoxin, phytocyanin, and homeobox domains containing proteins. In an earlier study, Quraishi et al. (2017) identified three genes Triticin, Gliadin, Tri-ribulose-1,5-bisphosphate carboxylase/Viviparous as the candidates for three MQTLs located on chromosomes 1A, 2A, and 3A. Most recently in the year 2022, Gudi et al. identified 44 CGs for different quality traits in wheat. The majority of these genes were linked to proteins that bind metal ions, Zn-transporters, small hydrophilic seed proteins, amino acid transporters, sweet-sugar transporters, UDP-glucuronosyl/UDP-glucosyltransferases, sugar/inositol transporters, and other proteins (Gudi et al., 2022).
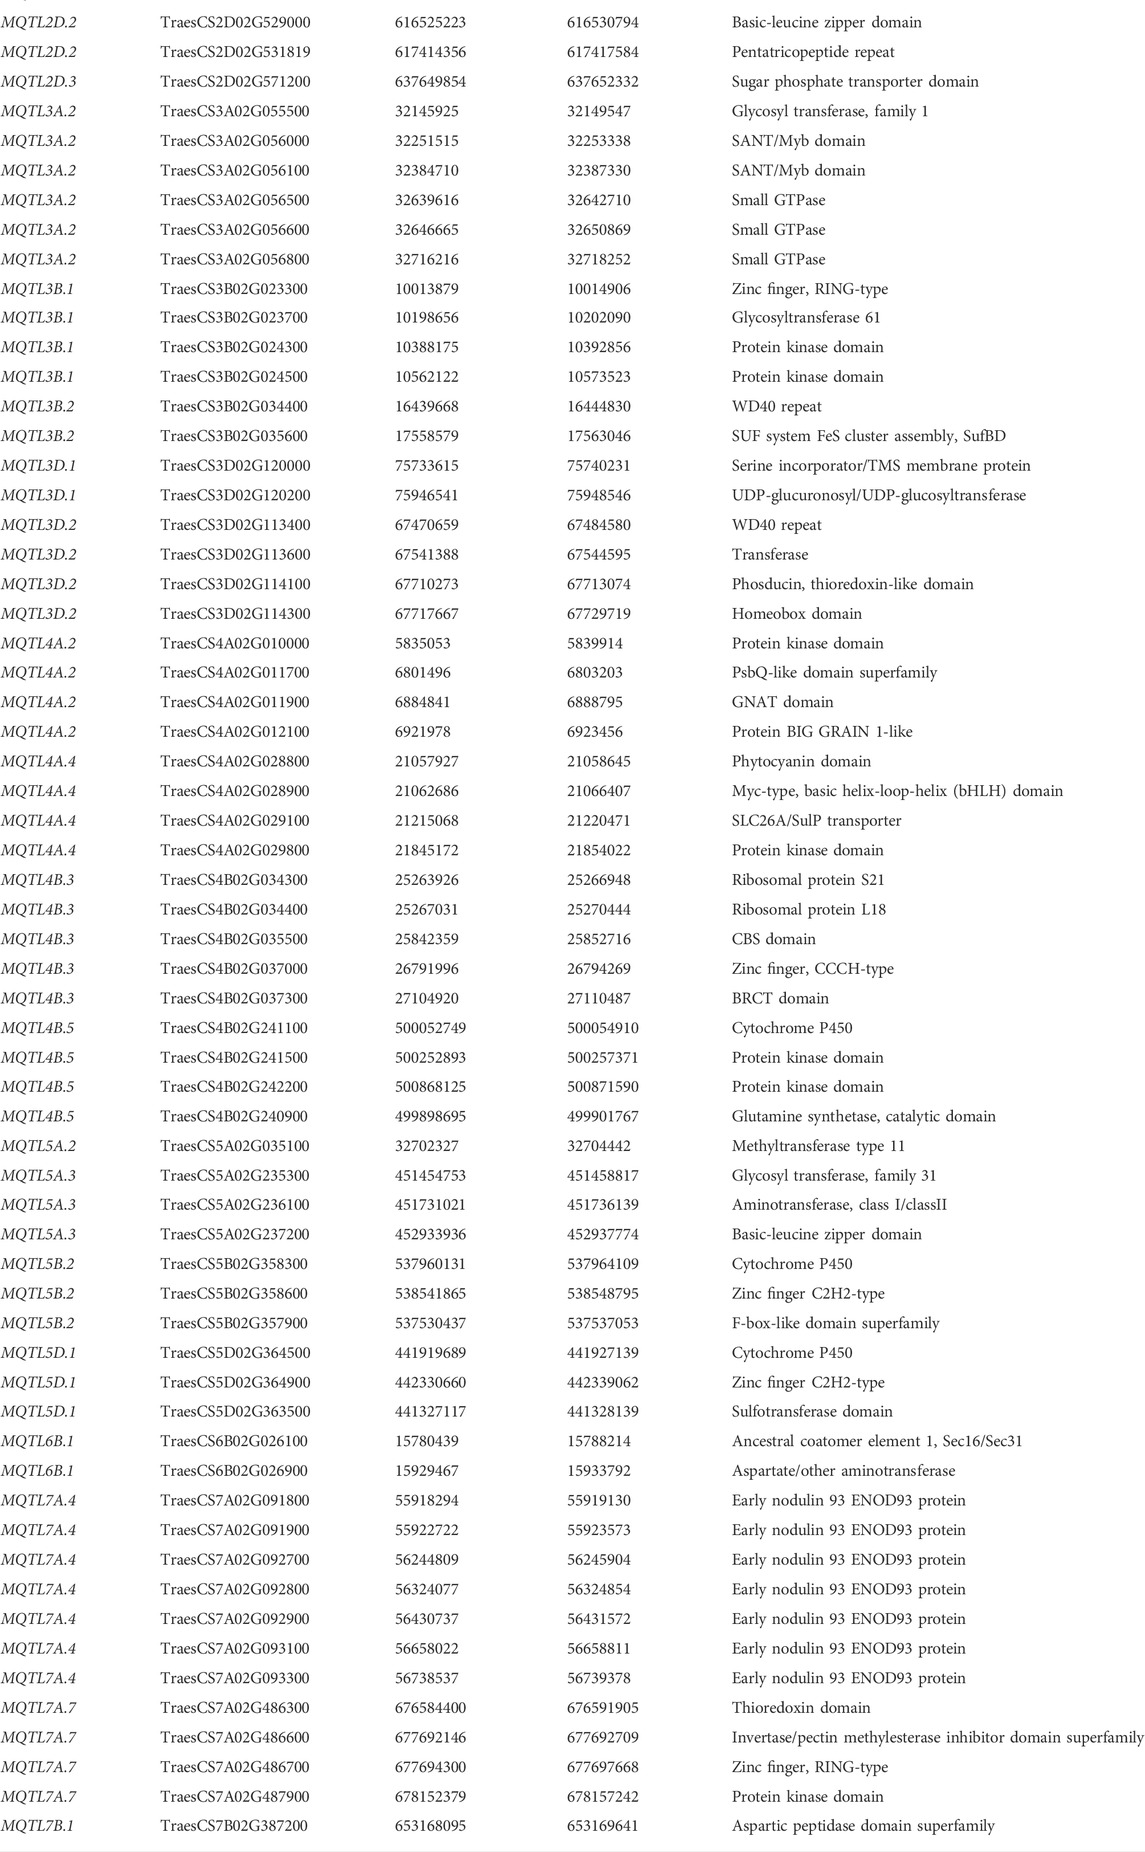
TABLE 3. High-confidence candidate genes associated with GPC in wheat.
The association of these high-confidence CGs with GPC may be discussed as follows- (i) Protein accumulation during the grain-filling stage is aided by the remobilization of amino acids from vegetative tissues, a procedure that is predicted to involve both amino acid importers and exporters. In a recent study in wheat, the UMAMIT family of transporters was characterized, with the majority of them carrying EamA domains. Gene TaUMAMIT17 exhibited significant amino acid export activity and played a key role in the enhancement of GPC (Fang et al., 2022). (ii) In a more recent study, semi-dominant alleles for a class III homeodomain-leucine zipper TF, HOMEOBOX DOMAIN-2 (HB-2) were identified which generate more flower-bearing spikelets and significantly improve GPC. (iii) Aminotransferases are known to enhance root absorption of a range of amino acids and to affect GPC positively (Peng et al., 2014). (iv) The endoplasmic reticulum produces the seed storage proteins glutelin and beta-globulin, which are then put into protein storage vacuoles. Small GTPase Sar1, which transports secretory proteins from the endoplasmic reticulum to the Golgi apparatus, is known to act as a molecular switch to regulate the assembly of coat protein complex II (Tian et al., 2013). (v) CBS domain-containing proteins are believed to have regulatory functions; therefore, such proteins may be functional in improving GPC in wheat grains (Leonova et al., 2022). (vi) Secretory24 (Sec24) and Sec31 (Sec31) promote anterograde transport of newly generated proteins from the endoplasmic reticulum to distinct compartments in the plant endometrium through shell protein complex II (Lv et al., 2021). (vii) Glutamine synthetases are known to play key roles in plant nitrogen assimilation and ammonium detoxification thereby regulating GPC in durum wheat (Nigro et al., 2016). (viii) Several members of the basic leucine zipper (bZIP) family have been identified to play a key role in the regulation of wheat grain storage protein synthesis (Li et al., 2020; Pfeifer et al., 2014). (ix) ENOD93 encodes early nodulin 93 proteins which are known to regulate nitrogen use efficiency in different crops including rice and wheat (Kant et al., 2010; Saini et al., 2021), thereby believed to play key roles in the regulation of GPC in wheat grains. Some of the key CGs discovered in this study may be validated or functionally characterized utilizing various methods such as over-expression, genome editing, knockout techniques, etc.
Comparing genomic regions identified through meta-analysis to known GPC genes can assist researchers in better comprehending the genetic architecture underpinning GPC. As a result, during the current study, a connection of MQTLs with known GPC genes was also explored. This study detected the co-localization of eight functionally known GPC genes with different MQTL regions, including Glu-B1-1b (Ravel et al., 2006), Glu-1By9 (Chen J. et al., 2019), GPC-B1 (Uauy et al., 2006), TaBiP1 (Zhu et al., 2014), GSr (Bernard et al., 2008), TaNAC019-A (Gao et al., 2021), TaNAC019-D (Gao et al., 2021), and bZIP-TF SPA (Boudet et al., 2019). MQTL1B.4 contained the Glu-B1-1b and Glu-1By9 genes, which are precursors of high-molecular-weight glutenin subunits, which produce glutenin when combined with low-molecular-weight subunits. Gluten proteins, which account for over 80% of total GPC, are produced by roughly the same amount of glutenins and gliadin (Ravel et al., 2006; Chen Q. et al., 2019). MQTL6B.3 contained the major gene GPC-B1 which encodes a NAC TF that causes 10–15% increase in GPC in wheat (Uauy et al., 2006). TaBiP1, co-localized with MQTL6D.2, encodes an important functional protein i.e., endoplasmic reticulum chaperone binding protein which is involved in the bio-synthesis of subunit types of high molecular weight-glutenin subunit (Zhu et al., 2014). GSr, which is co-localized with QTLhotspot_4B, encodes glutamine synthetase, which is important in absorbing ammonia at the key stages of nitrogen remobilization to the grain, hence regulating the GPC in wheat grains (Bernard et al., 2008). TaNAC019-A and TaNAC019-D, available from MQTL3A.3 and MQTL3D.1, respectively, encode NAC TFs that regulate starch and glutenin accumulation and its elite allele increases grain quality in wheat (Gao et al., 2021). bZIP transcription factor SPA, co-localizing with QTLhotspot_5D.4, is known to repress glutenin synthesis in common wheat (Boudet et al., 2019).
Conclusion
The current work is the first thorough meta-analysis of GPC QTLs in common and durum wheat. The meta-analysis identified 57 MQTLs and 7 QTL hotspots associated with GPC, of which 19 MQTLs and 2 QTL hotspots were also validated with GWA studies. Within these MQTL regions, 705 gene models were detected; of these genes, 285 genes displayed significant expression across different wheat tissues analyzed; and 96 high-confidence genes were chosen based on functional annotation, expression analysis, and literature survey and proposed for future basic studies. Additionally, data on the markers flanking the MQTLs can be included in genomic selection models to increase the precision of GPC predictions in wheat. Wheat breeders may make greater use of selected breeder’s MQTLs (viz., MQTL2B.1, MQTL2D.1, MQTL3B.2, MQTL4A.1, MQTL4B.3, and MQTL5A.2) and CGs uncovered in this study for genetic improvement of GPC in wheat.
Data availability statement
The datasets presented in this study can be found in online repositories. The names of the repository/repositories and accession number(s) can be found in the article/Supplementary Material and data on QTLs associated with GPC have also been made publicly available through a most comprehensive wheat QTL database (http://wheatqtldb.net/).
Author contributions
VT and DS conceived and planned this study. DS and PS performed the literature search, retrieved data, and developed consensus map, conducted meta-analysis. IS, HD, and RM helped PS in the interpretation of results and in writing of the first draft of the manuscript. VT and DS critically revised and edited the manuscript. All authors have read and agree to the final version of the manuscript.
Conflict of interest
The authors declare that the research was conducted in the absence of any commercial or financial relationships that could be construed as a potential conflict of interest.
Publisher’s note
All claims expressed in this article are solely those of the authors and do not necessarily represent those of their affiliated organizations, or those of the publisher, the editors and the reviewers. Any product that may be evaluated in this article, or claim that may be made by its manufacturer, is not guaranteed or endorsed by the publisher.
Supplementary material
The Supplementary Material for this article can be found online at: https://www.frontiersin.org/articles/10.3389/fgene.2022.1021180/full#supplementary-material
Abbreviations
CG, candidate gene; GWAS, genome wide association study; GPC, grain protein content; MQTL, Meta QTL.
References
Amo, A., and Soriano, J. M. (2022). Unravelling consensus genomic regions conferring leaf rust resistance in wheat via meta-QTL analysis. Plant Genome 15 (1), e20185. doi:10.1002/tpg2.20185
Balyan, H. S., Gupta, P. K., Kumar, S., Dhariwal, R., Jaiswal, V., Tyagi, S., et al. (2013). Genetic improvement of grain protein content and other health‐related constituents of wheat grain. Plant Breed. 132, 446–457. doi:10.1111/pbr.12047
Bernard, S. M., Møller, A. L. B., Dionisio, G., Kichey, T., Jahn, T. P., Dubois, F., et al. (2008). Gene expression, cellular localisation and function of glutamine synthetase isozymes in wheat (Triticum aestivum L.). Plant Mol. Biol. 67 (1), 89–105. doi:10.1007/s11103-008-9303-y
Bilgrami, S. S., Ramandi, H. D., Shariati, V., Razavi, K., Tavakol, E., Fakheri, B. A., et al. (2020). Detection of genomic regions associated with tiller number in Iranian bread wheat under different water regimes using genome-wide association study. Sci. Rep. 10 (1), 10–17. doi:10.1038/s41598-020-69442-9
Blanco, A., Mangini, G., Giancaspro, A., Giove, S., Colasuonno, P., Simeone, R., et al. (2012). Relationships between grain protein content and grain yield components through quantitative trait locus analyses in a recombinant inbred line population derived from two elite durum wheat cultivars. Mol. Breed. 30, 79–92. doi:10.1007/s11032-011-9600-z
Boehm, J. D., Ibba, M. I., Kiszonas, A. M., See, D. R., Skinner, D. Z., Morris, C. F., et al. (2017). Identification of genotyping-by-sequencing sequence tags associated with milling performance and end-use quality traits in hard red spring wheat (Triticum aestivum L.). J. Cereal Sci. 77, 73–83. doi:10.1016/j.jcs.2017.07.007
Borrill, P., Harrington, S. A., Simmonds, J., and Uauy, C. (2019). Identification of transcription factors regulating senescence in wheat through gene regulatory network modelling. Plant Physiol. 180, 1740–1755. doi:10.1104/pp.19.00380
Boudet, J., Merlino, M., Plessis, A., Gaudin, J. C., Dardevet, M., Perrochon, S., et al. (2019). The b ZIP transcription factor SPA Heterodimerizing Protein represses glutenin synthesis in Triticum aestivum. Plant J. 97 (5), 858–871. doi:10.1111/tpj.14163
Cantu, D., Pearce, S. P., Distelfeld, A., Christiansen, M. W., Uauy, C., Akhunov, E., et al. (2011). Effect of the down-regulation of the high Grain Protein Content (GPC) genes on the wheat transcriptome during monocarpic senescence. BMC Genomics 12 (1), 1–17. doi:10.1186/1471-2164-12-492
Chen, J., Zhang, F., Zhao, C., Lv, G., Sun, C., Pan, Y., et al. (2019a). Genome‐wide association study of six quality traits reveals the association of the TaRPP13L1 gene with flour colour in Chinese bread wheat. Plant Biotechnol. J. 17, 2106–2122. doi:10.1111/pbi.13126
Chen, Q., Zhang, W., Gao, Y., Yang, C., Gao, X., Peng, H., et al. (2019b). High molecular weight glutenin subunits 1Bx7 and 1By9 encoded by Glu-B1 locus affect wheat dough properties and sponge cake quality. J. Agric. Food Chem. 67 (42), 11796–11804. doi:10.1021/acs.jafc.9b05030
Clavijo, B. J., Venturini, L., Schudoma, C., Accinelli, G. G., Kaithakottil, G., Wright, J., et al. (2017). An improved assembly and annotation of the allohexaploid wheat genome identifies complete families of agronomic genes and provides genomic evidence for chromosomal translocations. Genome Res. 27, 885–896. doi:10.1101/gr.217117.116
Conti, V., Roncallo, P. F., Beaufort, V., Cervigni, G. L., Miranda, R., Jensen, C. A., et al. (2011). Mapping of main and epistatic effect QTLs associated to grain protein and gluten strength using a RIL population of durum wheat. J. Appl. Genet. 52, 287–298. doi:10.1007/s13353-011-0045-1
Cook, J. P., Heo, H. Y., Varella, A., Lanning, S., Blake, N., Sherman, J., et al. (2018). Evaluation of a QTL mapping population composed of hard red spring and winter wheat alleles using various marker platforms. Crop Sci. 58, 701–712. doi:10.2135/cropsci2017.08.0488
Cui, F., Zhang, N., Fan, X.-l., Zhang, W., Zhao, C.-h., Yang, L.-j., et al. (2017). Utilization of a Wheat660K SNP array-derived high-density genetic map for high-resolution mapping of a major QTL for kernel number. Sci. Rep. 7 (1), 1–12. doi:10.1038/s41598-017-04028-6
Endelman, J. B., and Plomion, C. (2014). LPmerge: an R package for merging genetic maps by linear programming. Bioinformatics 30, 1623–1624. doi:10.1093/bioinformatics/btu091
Fang, Z. T., Kapoor, R., Datta, A., and Okumoto, S. (2022). Tissue specific expression of UMAMIT amino acid transporters in wheat. Sci. Rep. 12 (1), 1–12. doi:10.1038/s41598-021-04284-7
Fatiukha, A., Filler, N., Lupo, I., Lidzbarsky, G., Klymiuk, V., Korol, A. B., et al. (2020). Grain protein content and thousand kernel weight QTLs identified in a durum× wild emmer wheat mapping population tested in five environments. Theor. Appl. Genet. 133, 119–131. doi:10.1007/s00122-019-03444-8
Gao, Y., An, K., Guo, W., Chen, Y., Zhang, R., Zhang, X., et al. (2021). The endosperm-specific transcription factor TaNAC019 regulates glutenin and starch accumulation and its elite allele improves wheat grain quality. Plant Cell 33 (3), 603–622. doi:10.1093/plcell/koaa040
Giancaspro, A., Giove, S. L., Zacheo, S. A., Blanco, A., and Gadaleta, A. (2019). Genetic variation for protein content and yield-related traits in a durum population derived from an inter-specific cross between hexaploid and tetraploid wheat cultivars. Front. Plant Sci. 10, 1509. doi:10.3389/fpls.2019.01509
Gill, T., Gill, S. K., Saini, D. K., Chopra, Y., de Koff, J. P., and Sandhu, K. S. (2022). A comprehensive review of high throughput phenotyping and machine learning for plant stress phenotyping. Phenomics 2, 156–183. doi:10.1007/s43657-022-00048-z
Gillies, S. A., Futardo, A., and Henry, R. J. (2012). Gene expression in the developing aleurone and starchy endosperm of wheat. Plant Biotechnol. J. 10, 668–679. doi:10.1111/j.1467-7652.2012.00705.x
Goffinet, B., and Gerber, S. (2000). Quantitative trait loci: A meta-analysis. Genetics 155, 463–473. doi:10.1093/genetics/155.1.463
Gudi, S., Saini, D. K., Singh, G., Halladakeri, P., Kumar, P., Shamshad, M., et al. (2022). Unravelling consensus genomic regions associated with quality traits in wheat using meta-analysis of quantitative trait loci. Planta 255, 115–119. doi:10.1007/s00425-022-03904-4
Guo, B., Sleper, D., Lu, P., Shannon, J., Nguyen, H., Arelli, P., et al. (2006). QTLs associated with resistance to soybean cyst nematode in soybean meta‐analysis of QTL locations—Retraction. Crop Sci. 46, 202. doi:10.2135/cropsci2005.04-0036
Gupta, P. K., Rustgi, S., and Kulwal, P. L. (2005). Linkage disequilibrium and association studies in higher plants: Present status and future prospects. Plant Mol. Biol. 57, 461–485. doi:10.1007/s11103-005-0257-z
Halder, J., Zhang, J., Ali, S., Sidhu, J. S., Gill, H. S., Talukder, S. K., et al. (2019). Mining and genomic characterization of resistance to tan spot, Stagonospora nodorum blotch (SNB), and Fusarium head blight in Watkins core collection of wheat landraces. BMC Plant Biol. 19 (1), 1–15. doi:10.1186/s12870-019-2093-3
Hu, C., Sadras, V. O., Lu, G., Zhang, P., Han, Y., Liu, L., et al. (2021). A global meta-analysis of split nitrogen application for improved wheat yield and grain protein content. Soil Tillage Res. 213, 105111. doi:10.1016/j.still.2021.105111
Iqbal, M., Moakhar, N. P., Strenzke, K., Haile, T., Pozniak, C., Hucl, P., et al. (2016). Genetic improvement in grain yield and other traits of wheat grown in Western Canada. Crop Sci. 56, 613–624. doi:10.2135/cropsci2015.06.0348
Jan, I., Saripalli, G., Kumar, K., Kumar, A., Singh, R., Batra, R., et al. (2021). Meta-QTLs and candidate genes for stripe rust resistance in wheat. Sci. Rep. 11, 1–13. doi:10.1038/s41598-021-02049-w
Jiang, P., Zhang, P., Wu, L., He, Y., Li, C., Ma, H., et al. (2021). Linkage and association mapping and kompetitive allele-specific pcr marker development for improving grain protein content in wheat. Theor. Appl. Genet. 134, 3563–3575. doi:10.1007/s00122-021-03913-z
Kant, S., Yong-Mei, B., and Rothstein, S. (2010). “OsENOD93-1, an Early Nodulin gene has an important role in improving nitrogen use efficiency in rice,”. In vitro cellular & development biology-animal (Spring ST, New York, NY 10013 USA: Springer), 46, S37–S38.
Korte, A., and Farlow, A. (2013). The advantages and limitations of trait analysis with GWAS: A review. Plant Methods 9, 29–9. doi:10.1186/1746-4811-9-29
Krishnappa, G., Singh, A. M., Chaudhary, S., Ahlawat, A. K., Singh, S. K., Shukla, R. B., et al. (2017). Molecular mapping of the grain iron and zinc concentration, protein content and thousand kernel weight in wheat (Triticum aestivum L.). PLoS One 12, e0174972. doi:10.1371/journal.pone.0174972
Kumar, A., Jain, S., Elias, E. M., Ibrahim, M., and Sharma, L. K. (2018). “An overview of QTL identification and marker-assisted selection for grain protein content in wheat,” in Eco-friendly agro-biological techniques for enhancing crop productivity, 245–274. doi:10.1007/978-981-10-6934-5_11
Kumar, S., Singh, V. P., Saini, D. K., Sharma, H., Saripalli, G., Kumar, S., et al. (2021). Meta-QTLs, ortho-MQTLs, and candidate genes for thermotolerance in wheat (Triticum aestivum L.). Mol. Breed. 41, 69–22. doi:10.1007/s11032-021-01264-7
Leonova, I. N., Kiseleva, A. A., Berezhnaya, A. A., Stasyuk, A. I., Likhenko, I. E., and Salina, E. A. (2022). Identification of QTLs for grain protein content in Russian spring wheat varieties. Plants 11 (3), 437. doi:10.3390/plants11030437
Li, L., Tacke, E., Hofferbert, H.-R., Lübeck, J., Strahwald, J., Draffehn, A. M., et al. (2013). Validation of candidate gene markers for marker-assisted selection of potato cultivars with improved tuber quality. Theor. Appl. Genet. 126, 1039–1052. doi:10.1007/s00122-012-2035-z
Li, Y., Fu, J., Shen, Q., and Yang, D. (2020). High-molecular-weight glutenin subunits: Genetics, structures, and relation to end use qualities. Int. J. Mol. Sci. 22 (1), 184. doi:10.3390/ijms22010184
Liu, S., Hall, M. D., Griffey, C. A., and McKendry, A. L. (2009). Meta‐analysis of QTL associated with Fusarium head blight resistance in wheat. Crop Sci. 49, 1955–1968. doi:10.2135/cropsci2009.03.0115
Liu, J., Feng, B., Xu, Z., Fan, X., Jiang, F., Jin, X., et al. (2018). A genome-wide association study of wheat yield and quality-related traits in southwest China. Mol. Breed. 38, 1–11. doi:10.1007/s11032-017-0759-9
Liu, J., Huang, L., Wang, C., Liu, Y., Yan, Z., Wang, Z., et al. (2019). Genome-wide association study reveals novel genomic regions associated with high grain protein content in wheat lines derived from wild emmer wheat. Front. Plant Sci. 10, 464. doi:10.3389/fpls.2019.00464
Liu, Y., Salsman, E., Wang, R., Galagedara, N., Zhang, Q., Fiedler, J. D., et al. (2020). Meta-QTL analysis of tan spot resistance in wheat. Theor. Appl. Genet. 133, 2363–2375. doi:10.1007/s00122-020-03604-1
Lou, H., Zhang, R., Liu, Y., Guo, D., Zhai, S., Chen, A., et al. (2021). Genome-wide association study of six quality-related traits in common wheat (Triticum aestivum L.) under two sowing conditions. Theor. Appl. Genet. 134, 399–418. doi:10.1007/s00122-020-03704-y
Lv, L., Zhao, A., Zhang, Y., Li, H., and Chen, X. (2021). Proteome and transcriptome analyses of wheat near isogenic lines identifies key proteins and genes of wheat bread quality. Sci. Rep. 11 (1), 1–15. doi:10.1038/s41598-021-89140-4
Marcotuli, I., Gadaleta, A., Mangini, G., Signorile, A. M., Zacheo, S. A., Blanco, A., et al. (2017). Development of a high-density SNP-based linkage map and detection of QTL for β-glucans, protein content, grain yield per spike and heading time in durum wheat. Int. J. Mol. Sci. 18, 1329. doi:10.3390/ijms18061329
Marone, D., Russo, M. A., Laidò, G., De Vita, P., Papa, R., Blanco, A., et al. (2013). Genetic basis of qualitative and quantitative resistance to powdery mildew in wheat: From consensus regions to candidate genes. BMC Genomics 14 (1), 1–17. doi:10.1186/1471-2164-14-562
Muhu-Din Ahmed, H. G., Sajjad, M., Zeng, Y., Iqbal, M., Habibullah Khan, S., Ullah, A., et al. (2020). Genome-wide association mapping through 90K SNP array for quality and yield attributes in bread wheat against water-deficit conditions. Agriculture 10, 392. doi:10.3390/agriculture10090392
Nigro, D., Fortunato, S., Giove, S. L., Paradiso, A., Gu, Y. Q., Blanco, A., et al. (2016). Glutamine synthetase in durum wheat: Genotypic variation and relationship with grain protein content. Front. Plant Sci. 7, 971. doi:10.3389/fpls.2016.00971
Pal, N., Saini, D. K., and Kumar, S. (2021). Meta-QTLs, ortho-MQTLs and candidate genes for the traits contributing to salinity stress tolerance in common wheat (Triticum aestivum L.). Physiol. Mol. Biol. Plants. 27, 2767–2786. doi:10.1007/s12298-021-01112-0
Pal, N., Jan, I., Saini, D. K., Kumar, K., Kumar, A., Sharma, P. K., et al. (2022). Meta-QTLs for multiple disease resistance involving three rusts in common wheat (Triticum aestivum L.). Res. Sq. 135, 1–22. doi:10.21203/rs.3.rs-1282977/v1
Pearce, S., Vazquez-Gross, H., Herin, S. Y., Hane, D., Wang, Y., Gu, Y. Q., et al. (2015). WheatExp: An RNA-seq expression database for polyploid wheat. BMC Plant Biol. 15 (1), 1–8. doi:10.1186/s12870-015-0692-1
Peng, J. H., Sun, D., and Nevo, E. (2011). Domestication evolution, genetics and genomics in wheat. Mol. Breed. 28, 281–301. doi:10.1007/s11032-011-9608-4
Peng, B., Kong, H., Li, Y., Wang, L., Zhong, M., Sun, L., et al. (2014). OsAAP6 functions as an important regulator of grain protein content and nutritional quality in rice. Nat. Commun. 5 (1), 1–12. doi:10.1038/ncomms5847
Peng, Y., Zhao, Y., Yu, Z., Zeng, J., Dong, J., Ma, W., et al. (2022). Wheat quality formation and its regulatory mechanism. Front. Plant Sci. 13, 834654. doi:10.3389/fpls.2022.834654
Pfeifer, M., Kugler, K. G., Sandve, S. R., Zhan, B., Rudi, H., Hvidsten, T. R., et al. (2014). Genome interplay in the grain transcriptome of hexaploid bread wheat. Science 345, 1250091. doi:10.1126/science.1250091
Prakash, N. R., Lokeshkumar, B. M., Rathor, S., Warraich, A. S., Yadav, S., Vinaykumar, N. M., et al. (2022). Meta‐analysis and validation of genomic loci governing seedling and reproductive stage salinity tolerance in rice. Physiol. Plant. 174, e13629. doi:10.1111/ppl.13629
Prasad, M., Kumar, N., Kulwal, P., Röder, M., Balyan, H., Dhaliwal, H., et al. (2003). QTL analysis for grain protein content using SSR markers and validation studies using NILs in bread wheat. Theor. Appl. Genet. 106, 659–667. doi:10.1007/s00122-002-1114-y
Quraishi, U. M., Murat, F., Abrouk, M., Pont, C., Confolent, C., Oury, F. X., et al. (2011). Combined meta-genomics analyses unravel candidate genes for the grain dietary fiber content in bread wheat (Triticum aestivum L.). Funct. Integr. Genomics 11, 71–83. doi:10.1007/s10142-010-0183-2
Quraishi, U. M., Pont, C., Ain, Q.-u., Flores, R., Burlot, L., Alaux, M., et al. (2017). Combined genomic and genetic data integration of major agronomical traits in bread wheat (Triticum aestivum L.). Front. Plant Sci. 8, 1843. doi:10.3389/fpls.2017.01843
Ramírez-González, R., Borrill, P., Lang, D., Harrington, S., Brinton, J., Venturini, L., et al. (2018). The transcriptional landscape of polyploid wheat. Science 361 (6403), eaar6089. doi:10.1126/science.aar6089
Rapp, M., Lein, V., Lacoudre, F., Lafferty, J., Müller, E., Vida, G., et al. (2018). Simultaneous improvement of grain yield and protein content in durum wheat by different phenotypic indices and genomic selection. Theor. Appl. Genet. 131, 1315–1329. doi:10.1007/s00122-018-3080-z
Rathan, N. D., Krishna, H., Ellur, R. K., Sehgal, D., Govindan, V., Ahlawat, A. K., et al. (2022). Genome-wide association study identifies loci and candidate genes for grain micronutrients and quality traits in wheat (Triticum aestivum L.). Sci. Rep. 12, 1–15. doi:10.1038/s41598-022-10618-w
Ravel, C., Praud, S., Murigneux, A., Linossier, L., Dardevet, M., Balfourier, F., et al. (2006). Identification of Glu-B1-1 as a candidate gene for the quantity of high-molecular-weight glutenin in bread wheat (Triticum aestivum L.) by means of an association study. Theor. Appl. Genet. 112 (4), 738–743. doi:10.1007/s00122-005-0178-x
Röder, M. S., Korzun, V., Wendehake, K., Plaschke, J., Tixier, M.-H., Leroy, P., et al. (1998). A microsatellite map of wheat. Genetics 149, 2007–2023. doi:10.1093/genetics/149.4.2007
Ruan, Y., Yu, B., Knox, R. E., Zhang, W., Singh, A. K., Cuthbert, R., et al. (2021). Conditional mapping identified quantitative trait loci for grain protein concentration expressing independently of grain yield in Canadian durum wheat. Front. Plant Sci. 12, 642955. doi:10.3389/fpls.2021.642955
Saini, D. K., Devi, P., and Kaushik, P. (2020). Advances in genomic interventions for wheat biofortification: A review. Agronomy 10 (1), 62. doi:10.3390/agronomy10010062
Saini, D. K., Chopra, Y., Pal, N., Chahal, A., Srivastava, P., and Gupta, P. K. (2021). Meta-QTLs, ortho-MQTLs and candidate genes for nitrogen use efficiency and root system architecture in bread wheat (Triticum aestivum L.). Physiol. Mol. Biol. Plants. 27, 2245–2267. doi:10.1007/s12298-021-01085-0
Saini, D. K., Chahal, A., Pal, N., Srivastava, P., and Gupta, P. K. (2022a). Meta-analysis reveals consensus genomic regions associated with multiple disease resistance in wheat (Triticum aestivum L.). Mol. Breed. 42, 11–23. doi:10.1007/s11032-022-01282-z
Saini, D. K., Chopra, Y., Singh, J., Sandhu, K. S., Kumar, A., Bazzer, S., et al. (2022b). Comprehensive evaluation of mapping complex traits in wheat using genome-wide association studies. Mol. Breed. 42, 1–52. doi:10.1007/s11032-021-01272-7
Saini, D. K., Srivastava, P., Pal, N., and Gupta, P. (2022c). Meta-QTLs, ortho-meta-QTLs and candidate genes for grain yield and associated traits in wheat (Triticum aestivum L.). Theor. Appl. Genet. 135, 1049–1081. doi:10.1007/s00122-021-04018-3
Sandhu, K. S., Aoun, M., Morris, C. F., and Carter, A. H. (2021a). Genomic selection for end-use quality and processing traits in soft white winter wheat breeding program with machine and deep learning models. Biology 10 (7), 689. doi:10.3390/biology10070689
Sandhu, K. S., Mihalyov, P. D., Lewien, M. J., Pumphrey, M. O., and Carter, A. H. (2021b). Combining genomic and phenomic information for predicting grain protein content and grain yield in spring wheat. Front. Plant Sci. 12, 613300. doi:10.3389/fpls.2021.613300
Sandhu, N., Pruthi, G., Raigar, P., Singh, M. P., Phagna, K., Kumar, A., et al. (2021c). Meta-QTL analysis in rice and cross-genome talk of the genomic regions controlling nitrogen use efficiency in cereal crops revealing phylogenetic relationship. Front. Genet. 12, 807210. doi:10.3389/fgene.2021.807210
Shafi, S., Saini, D. K., Khan, M. A., Bawa, V., Choudhary, N., Dar, W. A., et al. (2022). Delineating meta-QTLs for anthracnose resistance in common bean 2 (Phaseolus vulgaris L.). Front. Plant Sci. 13, 966339. doi:10.3389/fpls.2022.966339
Shariatipour, N., Heidari, B., and Richards, C. M. (2021). Meta-analysis of QTLome for grain zinc and iron contents in wheat (Triticum aestivum L.). Euphytica 217, 86–14. doi:10.1007/s10681-021-02818-8
Sidhu, J. S., Singh, D., Gill, H. S., Brar, N. K., Qiu, Y., Halder, J., et al. (2020). Genome-wide association study uncovers novel genomic regions associated with coleoptile length in hard winter wheat. Front. Genet. 10, 1345. doi:10.3389/fgene.2019.01345
Singh, R., Saripalli, G., Gautam, T., Kumar, A., Jan, I., Batra, R., et al. (2022). Meta-QTLs, ortho-MetaQTLs and candidate genes for grain Fe and Zn contents in wheat (Triticum aestivum L.). Physiol. Mol. Biol. Plants. 28, 637–650. doi:10.1007/s12298-022-01149-9
Somers, D. J., Isaac, P., and Edwards, K. (2004). A high-density microsatellite consensus map for bread wheat (Triticum aestivum L.). Theor. Appl. Genet. 109, 1105–1114. doi:10.1007/s00122-004-1740-7
Soriano, J. M., Colasuonno, P., Marcotuli, I., and Gadaleta, A. (2021). Meta-QTL analysis and identification of candidate genes for quality, abiotic and biotic stress in durum wheat. Sci. Rep. 11 (1), 1–15. doi:10.1038/s41598-021-91446-2
Soriano, J. M., and Royo, C. (2015). Dissecting the genetic architecture of leaf rust resistance in wheat by QTL meta-analysis. Phytopathology 105, 1585–1593. doi:10.1094/phyto-05-15-0130-r
Sosnowski, O., Charcosset, A., and Joets, J. (2012). BioMercator V3: An upgrade of genetic map compilation and quantitative trait loci meta-analysis algorithms. Bioinformatics 28, 2082–2083. doi:10.1093/bioinformatics/bts313
Su, Y., Liao, P., Song, D., Huang, S., He, J., Gao, X., et al. (2020). Application of Aegilops tauschii–Triticum aestivum recombinant inbred lines for grain protein content quantitative trait loci detection and wheat improvement. Can. J. Plant Sci. 100, 425–434. doi:10.1139/cjps-2019-0225
Tian, L., Dai, L. L., Yin, Z. J., Fukuda, M., Kumamaru, T., Dong, X. B., et al. (2013). Small GTPase Sar1 is crucial for proglutelin and α-globulin export from the endoplasmic reticulum in rice endosperm. J. Exp. Bot. 64 (10), 2831–2845. doi:10.1093/jxb/ert128
Uauy, C., Brevis, J. C., and Dubcovsky, J. (2006). The high grain protein content gene Gpc-B1 accelerates senescence and has pleiotropic effects on protein content in wheat. J. Exp. Bot. 57, 2785–2794. doi:10.1093/jxb/erl047
Venske, E., Dos Santos, R. S., Farias, D. d. R., Rother, V., Da Maia, L. C., Pegoraro, C., et al. (2019). Meta-analysis of the QTLome of Fusarium head blight resistance in bread wheat: Refining the current puzzle. Front. Plant Sci. 10, 727. doi:10.3389/fpls.2019.00727
Visscher, P. M., and Goddard, M. E. (2004). Prediction of the confidence interval of quantitative trait loci location. Behav. Genet. 34, 477–482. doi:10.1023/B:BEGE.0000023652.93162.e8
Wang, L., Cui, F., Wang, J., Jun, L., Ding, A., Zhao, C., et al. (2012). Conditional QTL mapping of protein content in wheat with respect to grain yield and its components. J. Genet. 91, 303–312. doi:10.1007/s12041-012-0190-2
Wang, S., Wong, D., Forrest, K., Allen, A., Chao, S., Huang, B. E., et al. (2014). Characterization of polyploid wheat genomic diversity using a high‐density 90 000 single nucleotide polymorphism array. Plant Biotechnol. J. 12, 787–796. doi:10.1111/pbi.12183
Weller, J. I., and Soller, M. (2004). An analytical formula to estimate confidence interval of QTL location with a saturated genetic map as a function of experimental design. Theor. Appl. Genet. 109, 1224–1229. doi:10.1007/s00122-004-1664-2
Yang, Y., Amo, A., Wei, D., Chai, Y., Zheng, J., Qiao, P., et al. (2021). Large-scale integration of meta-QTL and genome-wide association study discovers the genomic regions and candidate genes for yield and yield-related traits in bread wheat. Theor. Appl. Genet. 134 (9), 3083–3109. doi:10.1007/s00122-021-03881-4
Zhao, L., Zhang, K.-P., Liu, B., Deng, Z.-y., Qu, H.-L., and Tian, J.-C. (2010). A comparison of grain protein content QTLs and flour protein content QTLs across environments in cultivated wheat. Euphytica 174, 325–335. doi:10.1007/s10681-009-0109-z
Zhu, J., Hao, P., Chen, G., Han, C., Li, X., Zeller, F. J., et al. (2014). Molecular cloning, phylogenetic analysis, and expression profiling of endoplasmic reticulum molecular chaperone BiP genes from bread wheat (Triticum aestivum L.). BMC Plant Biol. 14 (1), 1–16. doi:10.1186/s12870-014-0260-0
Keywords: mQTLs, QTL hotspots, candidate gene, expression analysis, wheat
Citation: Saini P, Sheikh I, Saini DK, Mir RR, Dhaliwal HS and Tyagi V (2022) Consensus genomic regions associated with grain protein content in hexaploid and tetraploid wheat. Front. Genet. 13:1021180. doi: 10.3389/fgene.2022.1021180
Received: 17 August 2022; Accepted: 13 September 2022;
Published: 28 September 2022.
Edited by:
Sunil S. Gangurde, University of Georgia, United StatesReviewed by:
Madhvi Sharma, Khalsa College, IndiaShasidhar Yaduru, International Crops Research Institute for the Semi-Arid Tropics (ICRISAT), India
Shriram Mirajkar, Shivaji University, India
Copyright © 2022 Saini, Sheikh, Saini, Mir, Dhaliwal and Tyagi. This is an open-access article distributed under the terms of the Creative Commons Attribution License (CC BY). The use, distribution or reproduction in other forums is permitted, provided the original author(s) and the copyright owner(s) are credited and that the original publication in this journal is cited, in accordance with accepted academic practice. No use, distribution or reproduction is permitted which does not comply with these terms.
*Correspondence: Vikrant Tyagi, dmlrcmFudHR5YWdpOTdAZ21haWwuY29t