
94% of researchers rate our articles as excellent or good
Learn more about the work of our research integrity team to safeguard the quality of each article we publish.
Find out more
ORIGINAL RESEARCH article
Front. Genet., 06 December 2022
Sec. Computational Genomics
Volume 13 - 2022 | https://doi.org/10.3389/fgene.2022.1015885
 Bernadette Wendel1*
 Markus Heidenreich1Monika Budde2Maria Heilbronner2
 Mojtaba Oraki Kohshour2
 Sergi Papiol2,3
 Peter Falkai3
 Thomas G. Schulze2,4,5
 Urs Heilbronner2Heike Bickeböller1
A popular approach to reduce the high dimensionality resulting from genome-wide association studies is to analyze a whole pathway in a single test for association with a phenotype. Kernel machine regression (KMR) is a highly flexible pathway analysis approach. Initially, KMR was developed to analyze a simple phenotype with just one measurement per individual. Recently, however, the investigation into the influence of genomic factors in the development of disease-related phenotypes across time (trajectories) has gained in importance. Thus, novel statistical approaches for KMR analyzing longitudinal data, i.e. several measurements at specific time points per individual are required. For longitudinal pathway analysis, we extend KMR to long-KMR using the estimation equivalence of KMR and linear mixed models. We include additional random effects to correct for the dependence structure. Moreover, within long-KMR we created a topology-based pathway analysis by combining this approach with a kernel including network information of the pathway. Most importantly, long-KMR not only allows for the investigation of the main genetic effect adjusting for time dependencies within an individual, but it also allows to test for the association of the pathway with the longitudinal course of the phenotype in the form of testing the genetic time-interaction effect. The approach is implemented as an R package, kalpra. Our simulation study demonstrates that the power of long-KMR exceeded that of another KMR method previously developed to analyze longitudinal data, while maintaining (slightly conservatively) the type I error. The network kernel improved the performance of long-KMR compared to the linear kernel. Considering different pathway densities, the power of the network kernel decreased with increasing pathway density. We applied long-KMR to cognitive data on executive function (Trail Making Test, part B) from the PsyCourse Study and 17 candidate pathways selected from Reactome. We identified seven nominally significant pathways.
Pathway analyses or gene-set analyses are association studies, which test whole gene sets or pathways for association with a phenotype of interest (Holmans, 2010; Mooney and Wilmot, 2015). In contrast to a genome-wide association analysis (GWAS) in which a great number of individual SNP association tests are performed, a smaller group of genes or SNPs is tested simultaneously. Thus, the multiple testing problem of a GWAS is tremendously mitigated. In the last two decades, many different general approaches and particular tools have been developed for pathway analysis (Holmans, 2010; Mooney and Wilmot, 2015; de Leeuw et al., 2016).
In this paper, we focus on kernel machine regression (KMR) (Liu et al., 2007; Ge et al., 2016), a machine-learning algorithm (Liu et al., 2007) with great flexibility. KMR is a semi-parametric regression analysis (Liu et al., 2007) initially designed to analyze case-control studies (Liu et al., 2008; Wu et al., 2010; Wu et al., 2011) or quantitative data (Liu et al., 2007; Wu et al., 2011; Ge et al., 2016). KMR models the environmental (non-genetic) parameters parametrically and the high-dimensional genetic data (e.g., genotype information) non-parametrically (Liu et al., 2007; Freytag et al., 2013). The genetic data are transformed into a similarity matrix containing for every pair of individuals quantitative values, which describe the genetic similarities of the pairs of individuals (Schaid, 2010; Ge et al., 2016). This matrix is denoted as kernel matrix. The transformation is performed by a kernel function, which can have different forms depending on the desired similarity concept (Freytag et al., 2013). There are many possibilities to model a pathway as the only requirement of the kernel function is to be positive semidefinite (Schaid, 2010; Schaid, 2010) For example, a popular kernel is the linear kernel (Wu et al., 2010; Freytag et al., 2013). New kernels have been also defined, e.g., a kernel adjusting for size bias (Freytag et al., 2012) or a kernel integrating the network information of a pathway (Freytag et al., 2013). The latter was possible thanks to the development of different pathway databases, e.g., Reactome (Jassal et al., 2019), Pathway Commons (Rodchenkov et al., 2019) or KEGG (Kanehisa et al., 2017). Different versions and extensions of KMR have been developed to address various research questions (for a summary see (Larson et al., 2019)). KMR analyzing more complex phenotype data, e.g., family samples (Malzahn et al., 2014; Yan et al., 2015) is just one example.
Longitudinal studies assess multiple, thus correlated, measurements over time for each single individual (Molenberghs and Verbeke, 2000; Caruana et al., 2015). They enable researchers to study the time course of the investigated phenotype. A number of statistical methods have been and are still being developed especially in this context. An important aspect of longitudinal studies is the frequently high number of missing data or unequal measurement points (Caruana et al., 2015). A popular method to overcome this challenge are linear mixed models (LMM) (Molenberghs and Verbeke, 2000) in which so-called random effects are added to correct for the dependence structure of the different measurements. A random effect enables the modeling of an individual development for each subject. LMMs can handle missing phenotype data under the assumption that the data are at least missing at random (MAR) (Molenberghs and Verbeke, 2000).
In the genetic context, these LMMs can be applied to perform longitudinal GWASs (Wendel et al., 2021). Using this, we previously (Wendel et al., 2021) investigated the genetic influence of individual SNPs on the course over time of executive functions, which control and coordinate mental processes. These GWASs demonstrated the versatility of LMMs in genetic association studies. Thus, the next step is to investigate pathways for association with longitudinal phenotypes, for example, the genomic basis of the longitudinal course of executive functions. For this, we can exploit that LMMs share an estimation equivalence with KMR models (Liu et al., 2007).
The aim of this work is to develop a longitudinal pathway analysis to test for the association between genetic factors and the longitudinal phenotype applying KMR and simultaneously allowing integrating network information. To be able to analyze longitudinal data, we extended KMR to long-KMR. Other authors have also studied longitudinal data (Yan et al., 2015; Ge et al., 2016; Wang et al., 2016) and created a KMR extension (Yan et al., 2015; Yan et al., 2018). However, in this extension only single genes can be tested for association (Yan et al., 2018) and these genes can solely be modeled with a weighted linear kernel. In our longitudinal pathway analysis, the whole pathway can be modeled with different kernels respectively prior to testing. For example, a linear kernel or a network-based kernel (Freytag et al., 2013), which enables the integration of network information in KMR can be applied. Moreover, different genetic effects including main, interaction, and joint genetic (main and interaction) effects can be considered. Thus, in long-KMR, we can model and test not only a main genetic effect, but most importantly also a genetic time-interaction effect. The latter translates to an association of the pathway with the trajectory of the considered phenotype.
In a simulation study, we assessed the properties of long-KMR regarding several aspects. We considered longitudinal studies with two and four measurement points. We compared the performance of long-KMR when applying a linear kernel or a network kernel. We also studied the influence of the pathway topology on the performance of the network kernel with a focus on the density of the pathway.
Finally, as a real-world application, we use long-KMR on the data from our previous longitudinal GWASs (Wendel et al., 2021) on executive functions of the PsyCourse Study (Budde et al., 2018). For this phenotype we chose several candidate pathways to be investigated with long-KMR.
In summary, in this paper we first present the theoretical aspects of long-KMR and the network kernel. We then describe the simulation approach used to evaluate our method, and, lastly, provide a real-world example of long-KMR.
In this section, we introduce the KMR analysis and its extension to analyze longitudinal data. We describe our simulation approach to investigate the type I error rate and power. Lastly, we present an application of long-KMR as example and give details on the PsyCourse Study data and the pathways used.
Let us assume
where
The KMR model can be read as a LMM with
where y is the vector of phenotypes for
where
where
where
where
Next, we will apply long-KMR to test a genetic (
where
In long-KMR, we can also integrate network information on the studied pathway by applying the network-based kernel (Freytag et al., 2013) (noted as network kernel in the following). The network kernel is defined as
We studied type I error rates and power in different scenarios to assess the performance of long-KMR for different genetic effects and the network kernel. The type I error rate is defined as the proportion of simulations that have a p-value < α in the simulations of the model with no genetic effects (null model). Here we set α to equal 5%, 1%, 0.5%, and 0.1%, respectively. In the scenarios in which we simulated genetic effects, we determined the power as the proportion of simulations with a p-value <5% threshold. In total, we compared the power for three different genetic effect models. We simulated two single-effect models containing either a main genetic effect or a time-interaction effect. We also created a more complex model, the joint model, which comprises a main genetic effect and a time-interaction effect. The joint model was only studied in a limited number of scenarios, as portrayed in Table 1. For the single-effect models, we had the same scenarios to evaluate the type I error rates and the power. We assessed the influence of the number of measurement points comparing two-measurement models with four-measurement models. The type I error rates and respective power of the linear kernel (LIN) and the network kernel (NET) were compared. For the latter, we only used the unadjusted network kernel (NET), as all genes had the same size. For two measurement points representing a pre/post-analysis, we applied the ANCOVA model (Table 1) to compare their performances with long-KMR. For the four-measurement models, we compared the performance of long-KMR with the previously published KMgene package (Yan et al., 2018). Further, we compared the analysis of complete phenotype data with incomplete phenotype data with 25% or 50% of the data missing [assuming missing at random mechanism (MAR)].
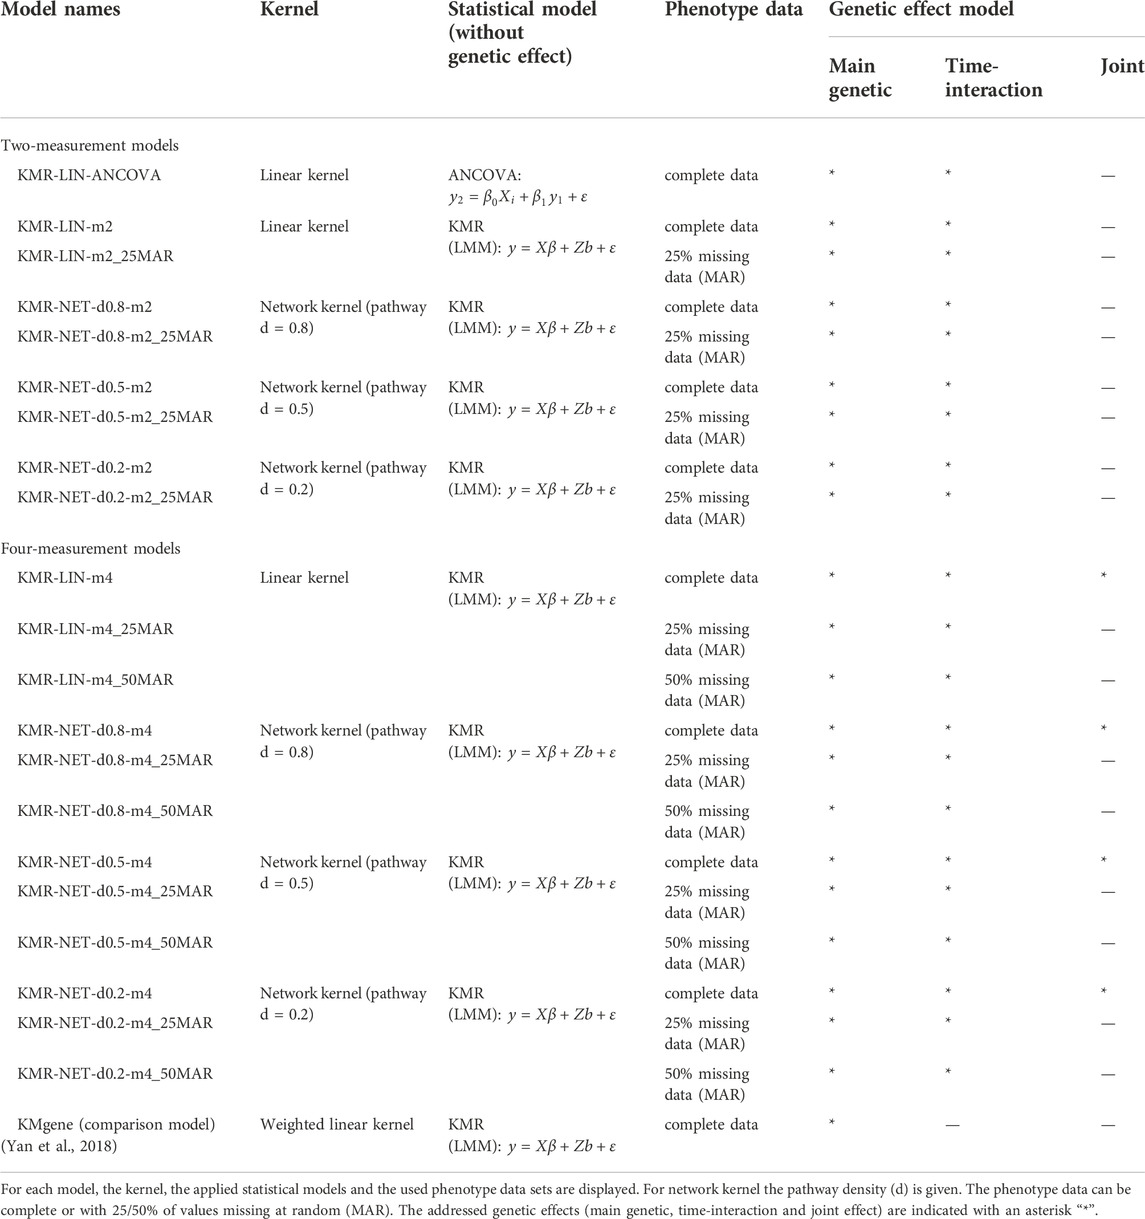
TABLE 1. Models of simulation study.
To evaluate the performance of the network kernel on pathways with different characteristics, we focused on the density (=d) of a pathway. This density is a graph-theoretical characteristic defined as the ratio of the number of present connections divided by the maximum number of possible connections in a pathway (d
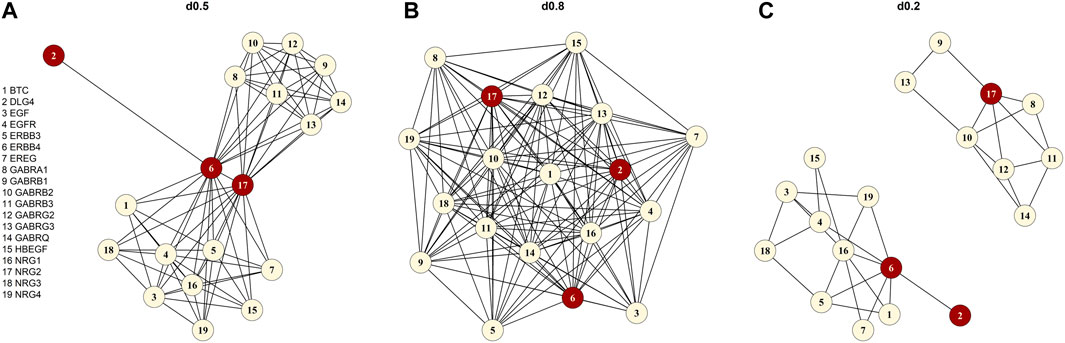
FIGURE 1. Graphical illustration of the “signaling by ERBB4” pathway (A) original form without the chemical compound (d0.5), (B) the simulated high-density pathway (d0.8), (C) the artificially created low-density pathway (d0.2). The red vertices are the three defined causal genes (NRG2, ERBB4 and DLG4).
We sampled genotypes for 10,000 individuals with HAPGEN2 (Su et al., 2011) using common (MAF ≥ 0.05) variants of chromosome one of the CEU sample of the International HapMap Project (HapMap 3 release 2) (Altshuler et al. 2010). In analogy to our foundation pathway “signaling by ERBB4” with 19 genes (Figure 1), we created 19 “pseudo-” genes all with a size of 50 SNPs (in total: 950 SNPs). The 950 SNPs were simulated in the region between 742 kbp and 112,709 kbp with a separation of 500 kbp between SNPs of the single “pseudo-” genes to prevent LD. We assign the simulated SNPs to a “pseudo-” gene. For each simulation setting, we created 100 smaller genotype matrices each containing 950 SNPs and 1,000 individuals. To achieve this, we randomly drew genotypes for 1,000 individuals from the previously simulated 10,000 individual sample (elementary matrix). For each of the 100 genotype matrices, we simulated 1,000 quantitative phenotypes according to the LMM below, resulting in a total number of 100,000 replications [similar to (Yan et al., 2015)].
For the null model corresponding to the null hypothesis of no genetic effects, we simulated the quantitative phenotypes according to the following LMM for an individual
where
where
For the power simulations, we added genetic effects to our null model to simulate the phenotypes. All models comprised three causal “pseudo-” genes each with three causal SNPs (in total: nine causal SNPs). The effect sizes
To compare the type I error rate and power of long-KMR with KMgene (Yan et al., 2015; Yan et al., 2018) we performed a simulation with KMgene for 1,000 individuals and four measurement points. Here, only the main genetic effect model was simulated because of the characteristics of KMgene (Yan et al., 2018). For every simulated gene (in total: 19, each with 50 SNPs), we obtained a gene-level p-value, which we combined with the Fisher’s method (Fisher, 1925; Larson et al., 2017) to receive a pathway p-value. This p-value combination was performed with the R package metap (Dewey, 2022).
The PsyCourse Study is a longitudinal, multi-center study comprising patients with diagnoses from the affective-to-psychotic spectrum and neurotypical individuals. A large battery of different phenotypes, including demographics, cognition, self- and observer rating scales, are assessed at up to four measurement points each 6 months apart (Budde et al., 2018). For our application, we analyzed 1,594 genotyped individuals including patients from the affective-to-psychotic spectrum (411 bipolar I disorder, 113 bipolar II disorder, 466 schizophrenia, 90 schizoaffective disorder, 10 schizophreniform disorder, 6 brief psychotic disorder and 94 with recurrent depression) and 404 control individuals. The diagnoses were determined according to the criteria in the Diagnostic and Statistical Manual of Mental Disorders, Fourth Edition (DSM-IV); a subset of individuals suffering from schizophrenia (45 individuals) was diagnosed according to ICD-10 criteria. Different centers in Germany and Austria conducted the recruitment of the study participants. All individuals provided written informed consent, and the study protocol was approved by the respective ethics committees at each study center [see ref. (Budde et al., 2018)]. Based on their symptoms, the individuals were broadly distinguished into an “affective” group (618, predominantly affective symptoms including bipolar disorder I and II and recurrent depression) or a “psychotic” group (572, predominantly psychotic symptoms encompassing schizophrenia, schizoaffective, schizophreniform, and brief psychotic disorder).
As phenotype of interest, we chose the Trail Making Test, part B (TMT-B) (Bowie and Harvey, 2006). TMT-B is applied to assess set-shifting, one of the three latent core skills of executive functions (Diamond, 2013; Friedman et al., 2016), a specific group of cognitive abilities. During the test, an individual is required to connect numbers (numbers: 1–26) and letters of the alphabet in ascending alternating order, for which the time (in seconds) to finish this task is measured to represent the test score. Study participants with a time >300 s were set to 300 s according to the recommendation by (Strauss et al., 2006). The higher the TMT-B score of an individual is, the greater the cognitive impairment.
Genotyping was performed with the Illumina Infinium Global Screening Array-24 Kit (version 3.0 or version 1.0) and the imputation took place on the Michigan imputation server (Das et al., 2016) with the haplotype reference consortium as reference panel. Quality control (QC) steps were performed according to standard procedures described elsewhere (Smigielski et al., 2021). In the analysis, we included approximately 3.5 million imputed SNPs with a MAF >0.05. We used PLINK v1.9 (Chang et al., 2015) (https://www.cog-genomics.org/plink/) to compute the ancestry principal components.
We focused on pathways on the Reactome database (Jassal et al., 2019) downloaded from Pathway Commons database Version 12 (Rodchenkov et al., 2019) (Reactome version 69, date: 01|14|22). First, we selected pathways based on different keywords connected to executive functions including dopamine, serotonin, GABA, glutamate, NDMA, synaptic, voltage-gated potassium channels, plasticity, and prefrontal cortex. The keywords resulted in 130 pathways, which we reduced to the 17 pathways finally studied (Table 2). We selected the 17 pathways according to different criteria. First, we only used pathways that we were able to download. The pathway had to be between 15 and 100 genes in size, and the number of chemical compounds (CHEBI) in the pathway had to be at most five. For each pathway, we specified the density (d) by applying the igraph package (Csardi and Nepusz, 2006) and included only pathways with d ≤ 0.95. The 17 selected pathways with specific characteristics e.g., number of genes, density, and average degree are displayed in Table 2. The average degree of a pathway is the average number of connections of a gene (=node). Originating from the list of 17 pathways, we chose “signaling by ERBB4” (Stern, 2019) (https://reactome.org/content/detail/R-HSA-1236394) as foundation pathway for our simulation study. This pathway was selected for its moderate size of 19 genes and because it only contains one CHEBI. The network consists of only one graph component, also denoted as connected (i.e., any gene can be reached from any other gene via a path). Most importantly, the pathway has an intermediate density of 0.46, which was a good basis for further artificial pathways we generated with high and low densities. “Signaling by ERBB4” is connected to schizophrenia (Banerjee et al., 2010) and schizophrenia endophenotypes, e.g. cognitive functions (Banerjee et al., 2010; Tian et al., 2017; Shi and Bergson, 2020) and thus is biologically very interesting. We deleted the CHEBI, as SNPs are the genomic basis in our analysis and a CHEBI cannot be assigned.
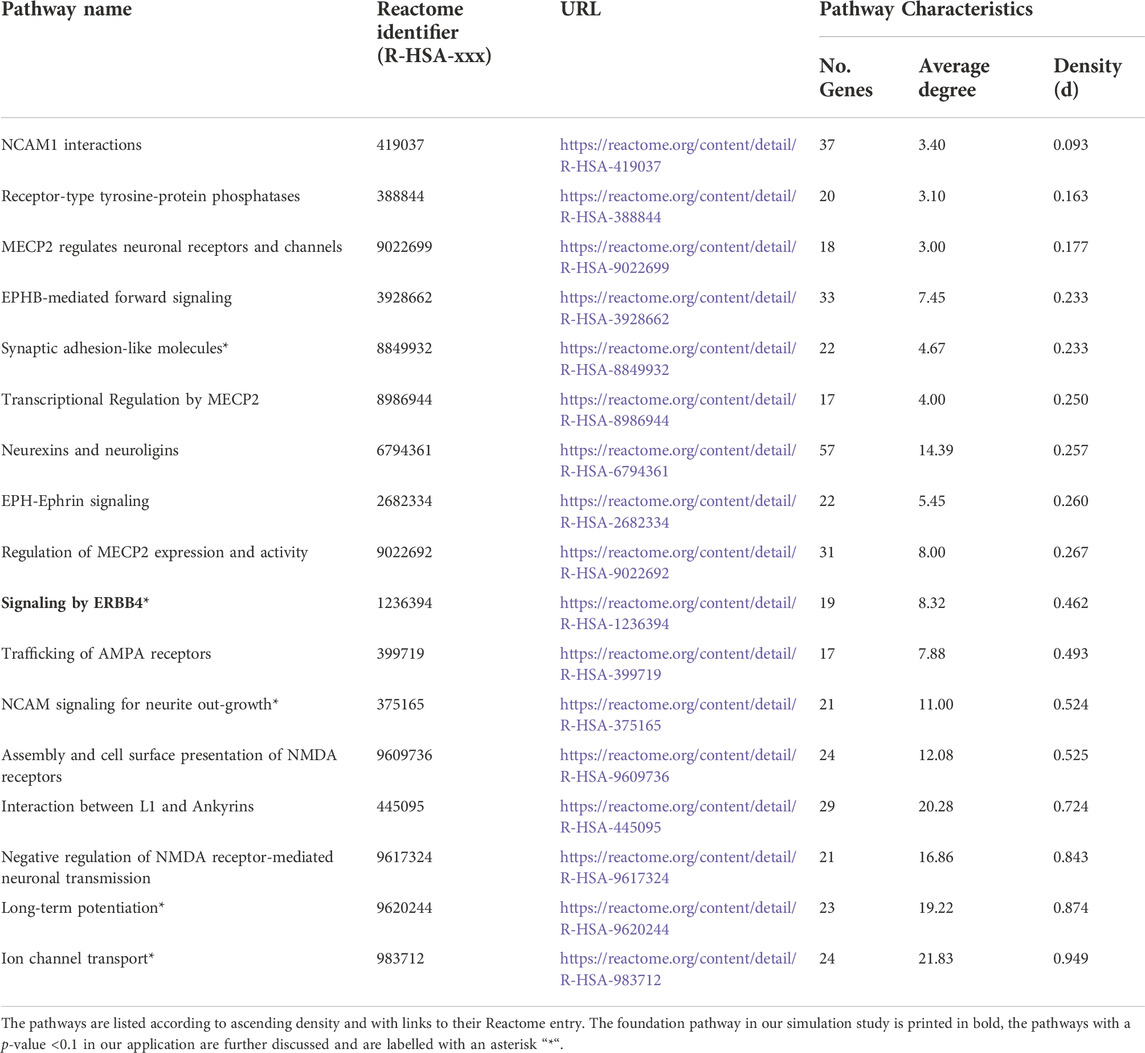
TABLE 2. Selected pathways investigated in the real-data example.
Each of the 17 pathways was tested for association with TMT-B. To fulfil the normality assumption, the TMT-B was log-transformed (lgTMT-B). We included the following fixed effects in the model: sex, age at first measurement point, diagnostic group (affective, psychotic, and control), time, and the top five ancestry principal components. A random intercept and a random slope for the time effect were also added. We tested each pathway for a potential main genetic and a time-interaction effect. The linear kernel (LIN), the unadjusted network (NET), and the size-adjusted network kernel (ANET) were applied. We assigned a SNP to a gene of a pathway based on its genomic location with a mapping window of
where
We performed all analyses with R (R Core Team, 2021), which we also used to implement the KMR for quantitative longitudinal data and cross-sectional binary and quantitative data as an R package kalpra (kernel approach for longitudinal pathway regression analysis) available at https://gitlab.gwdg.de/bernadette.wendel/kalpra. In addition to the linear and network kernels, a quadratic kernel is also available. The pathway information can be directly downloaded and transformed into an annotation and adjacency matrix. The computational aspects for some example analyses are provided in Supplementary Table S1.
The type I error rate in our simulation study is defined, as mentioned above, as the proportion of simulations for which we obtained a p-value < α (α = 5%, 1%, 0.5%, and 0.1%) in the null simulations without genetic effects. The type I error rates were maintained overall at the different α thresholds for the models in our simulation scenarios. We did detect individual type I error rates only slightly exceeding the respective significance levels, e.g., 5% and 1%, for three models (KMR-NET-d0.5-m2, KMR-NET-d0.8-m2, and KMR-NET-d0.8-m4). However, all the values lie in the range of expected random variations (confidence intervals of the null model simulations carried out, data not shown). KMR-NET-d0.8-m2 presented the largest increase in type I error of 5.09% at the significance level of 5%. Table 3 displays the type I error rates. The error rates of the different network kernels (all densities) were overall higher compared to the linear kernel and were closer to the nominal level. The combined pathway p-values of the KMgene analysis revealed an inflation of the error rates. The error rates for the analyses of the missing aspect for the different network kernel were also maintained (Supplementary Table S2). Figure 2 displays a QQ-plot of the distribution of the multiple error rates for all models analyzing complete data distinguished between the two-measurement and four-measurement models including KMgene.
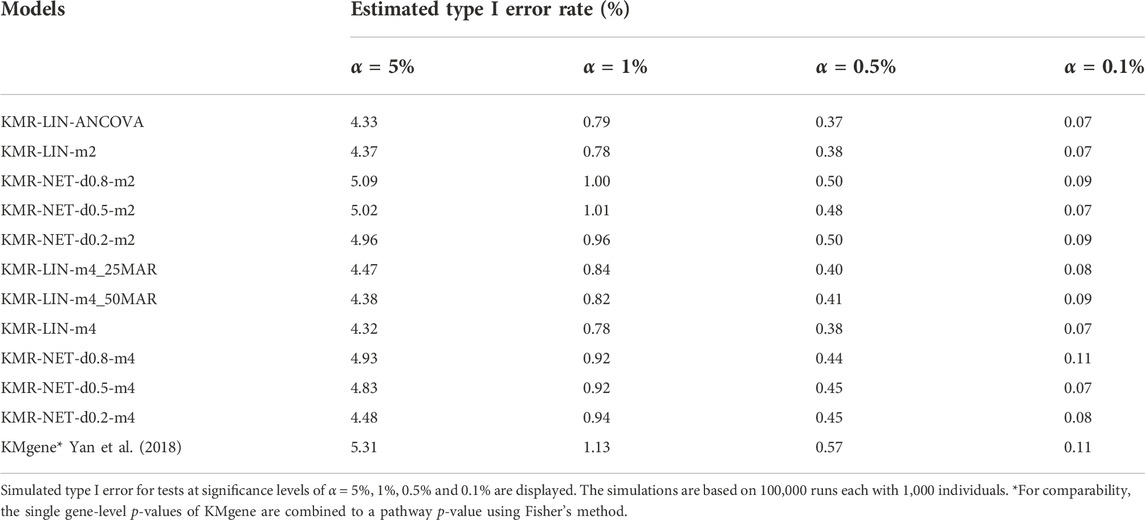
TABLE 3. Type I error rates of the simulation studies.
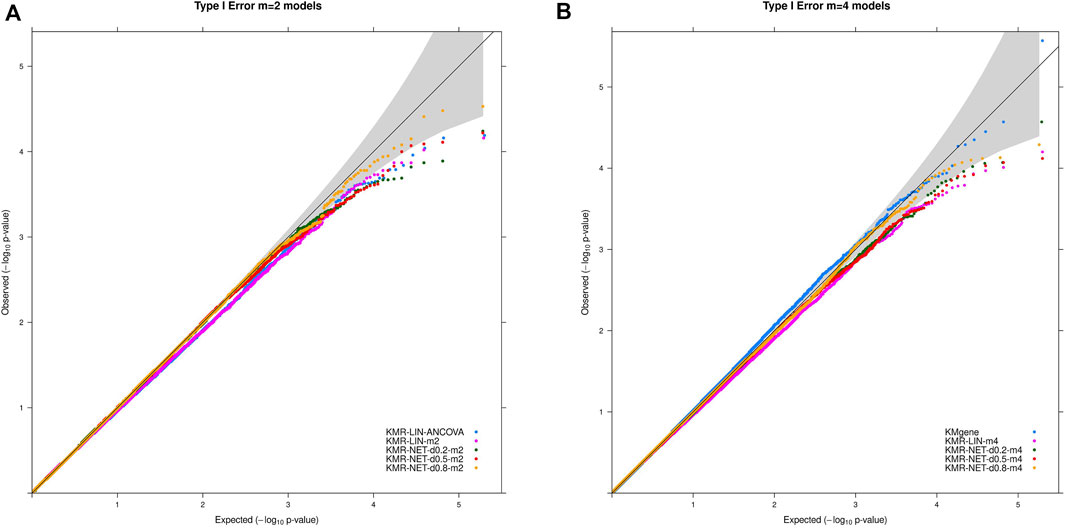
FIGURE 2. QQ-plots for the type I error rate for our simulation studies divided for the (A) two-measurement and (B) four-measurement models and the comparison model KMgene.
For the two single-genetic-effect models (main genetic and time-interaction model), the power comparison of the two-measurement models revealed that the LMM had the highest power independent of effect size and for either kernel. ANCOVA had the lowest power for the two-measurement models in comparison. Table 4 displays the results for the effect size β = 0.04. Increasing the number of measurement points resulted in an improvement of the power for long-KMR, in particular for the time-interaction effect (an increase from 21% to 52% (time-interaction effect) compared to 33%–36% (main genetic effect)). Overall, the time-interaction effect yielded a higher power for the four-measurement models, especially for the smaller effect sizes 0.04 (Table 4) and 0.06 (Supplementary Table S3). An additional power benefit compared to the linear kernel was achieved when applying the network kernel. For the main genetic effect with effect size 0.04, the network kernel in the two-measurement models demonstrate a higher power than KMR-LIN-m4. However, the power gain for the network kernel depends on the pathway density. The power increases with decreasing density (d0.2 > d0.5 > d0.8). A direct comparison of the power for the linear and network kernels for the four-measurement models is displayed in Figures 3A,B for the main genetic effect and the time-interaction effect, respectively. The power differences between KMR-LIN-m4 and KMR-NET-d0.8-m4, the pathway with the highest density, fluctuated in the different settings (Table 4; Supplementary Tables S3,S4). In the joint modeling of main genetic and time-interaction effects, the network kernel with the lowest density displayed the highest power. Table 5 illustrates the results for a genetic effect size of 0.04. Here, at the significance level of 5% the linear kernel had the second highest power followed by KMR-NET-d0.5-m4 and KMR-NET-d0.8-m4 (Table 5). As displayed in Figure 3C, the power of LIN-m4 and KMR-NET-d0.5-m4 are very similar at different significance levels.
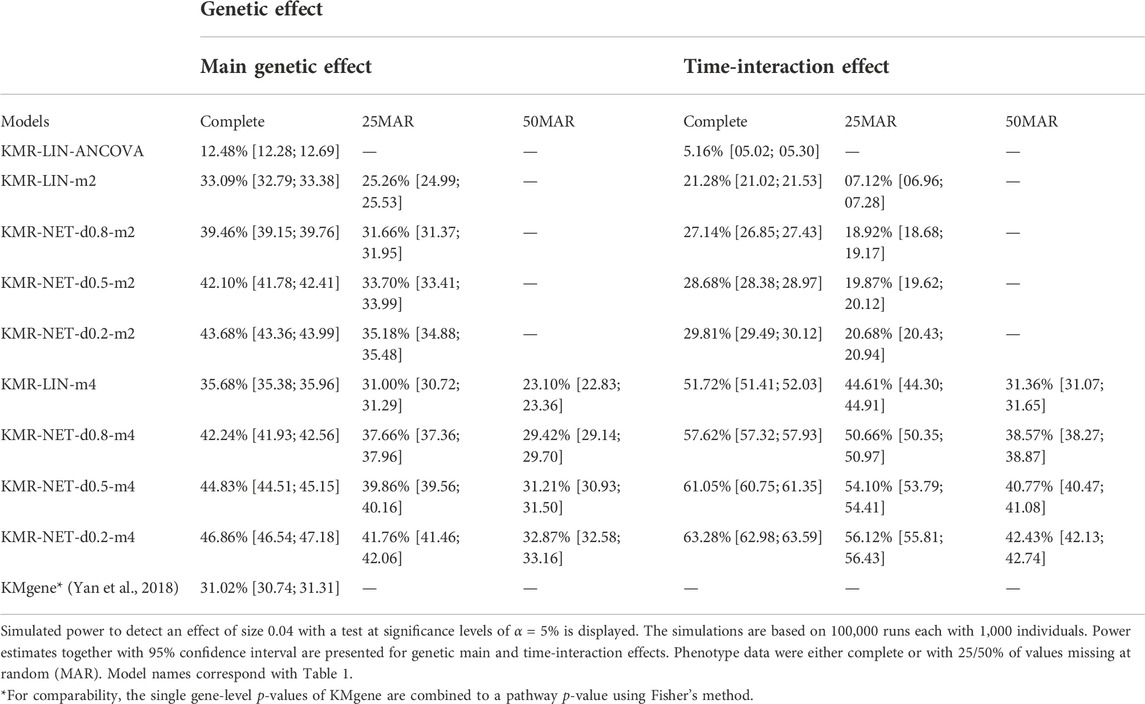
TABLE 4. Power results of the simulation study.
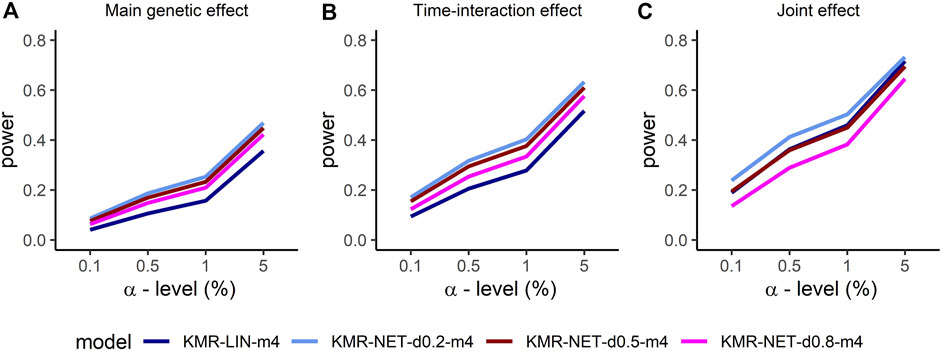
FIGURE 3. Comparison of the power for the four-measurement models (KMR-LIN, KMR-NET-d0.2, KMR-NET-d0.5, KMR-NET-d0.8) with complete phenotype data and effect size β = 0.04 for the different genetic effect models with (A) the main genetic (B) the time-interaction and (C) the joint effect in our simulation study.
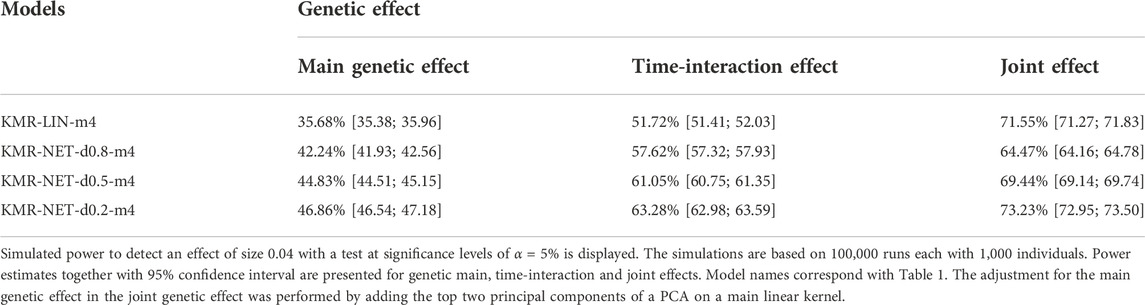
TABLE 5. Power comparison for main, time-interaction and joint effects.
The analyses performed with different percentages of missing data revealed similar features for the single-effect models, with a general decrease of power compared to the analysis of a complete phenotype data set (Table 4). In general, the power increased with increasing effect sizes (β = 0.04, 0.06, and 0.08). For example, for KMR-LIN-m4 testing the main genetic effect, the power increased from 36% (β = 0.04) to 78% (β = 0.06, Supplementary Table S3), and then to 98% (β = 0.08, Supplementary Table S4). In the pathway analysis, the comparison model KMgene yielded a significantly lower power compared to KMR-LIN-m4 for the same simulation scenario (N = 1,000, m = 4). This effect increased with increasing effect size β.
In our real-world data sample, we analyzed 1,518 individuals with at least one TMT-B measurement including 591 “affective,” 533 “psychotic,” and 394 mentally healthy individuals. The mean age at the first measurement point was 41 years [sd: 13.8] 48% of the samples were female (for more details see Supplementary Table S5). At all four measurement points, the psychotic group attained the highest TMT-B score; only at measurement points 1 and 3 were the differences for the psychotic and affective groups significant (see CI of Supplementary Figure S1). The control group demonstrated at each measurement point a significant difference and attained the lowest TMT-B score (Supplementary Figure S1). Previously, we identified a phenotypic outlier, an individual with the highest possible score at each measurement point assessed. Here we focused on the results without the outlier. The results did not change qualitatively when removing the outlier (data not shown).
Thirteen of the 17 tested pathways overlapped at least with one other pathway in at least one gene. The four independent (i.e., pathways not overlapping) were “ion channel transport,” “EPH-ephrin signaling,” “receptor-type tyrosine-protein phosphatases,” and “regulation of MECP2 expression and activity” (Table 2). We did not find any pathways significantly associated with the phenotype TMT-B after multiple testing correction (p-value <0.0033 = αGao) for either applied kernel (LIN, NET, and ANET). However, we identified seven pathways in total as achieving a p-value <0.05, which are represented in bold in Table 6 with the respective kernel used. For example, the “synaptic adhesion-like molecules” pathway is nominally significant for the main genetic effect for ANET, NET, and LIN. The “signaling by ERBB4” pathway, which poses as the foundation of our simulation, was nominally significant with all three kernels when testing the main genetic effect. For the time-interaction effect, we identified only one pathway, “ion channel transport,” as nominally significant. This pathway has the smallest p-value of all pathways (0.0089). To compare the different kernels, we ranked all pathways according to their p-values. Table 6 lists the top five pathways for each kernel stratified by the main genetic and time-interaction effects. For both network kernels, we noted a very similar ranking of the top five pathways in the respective genetic effects, whereas for the linear kernel the detected pathways varied between the genetic effect models. Considering the p-value ranking, the “synaptic adhesion-like molecules” pathway stood out as the one with smallest p-value (rank 1) in all analyses.
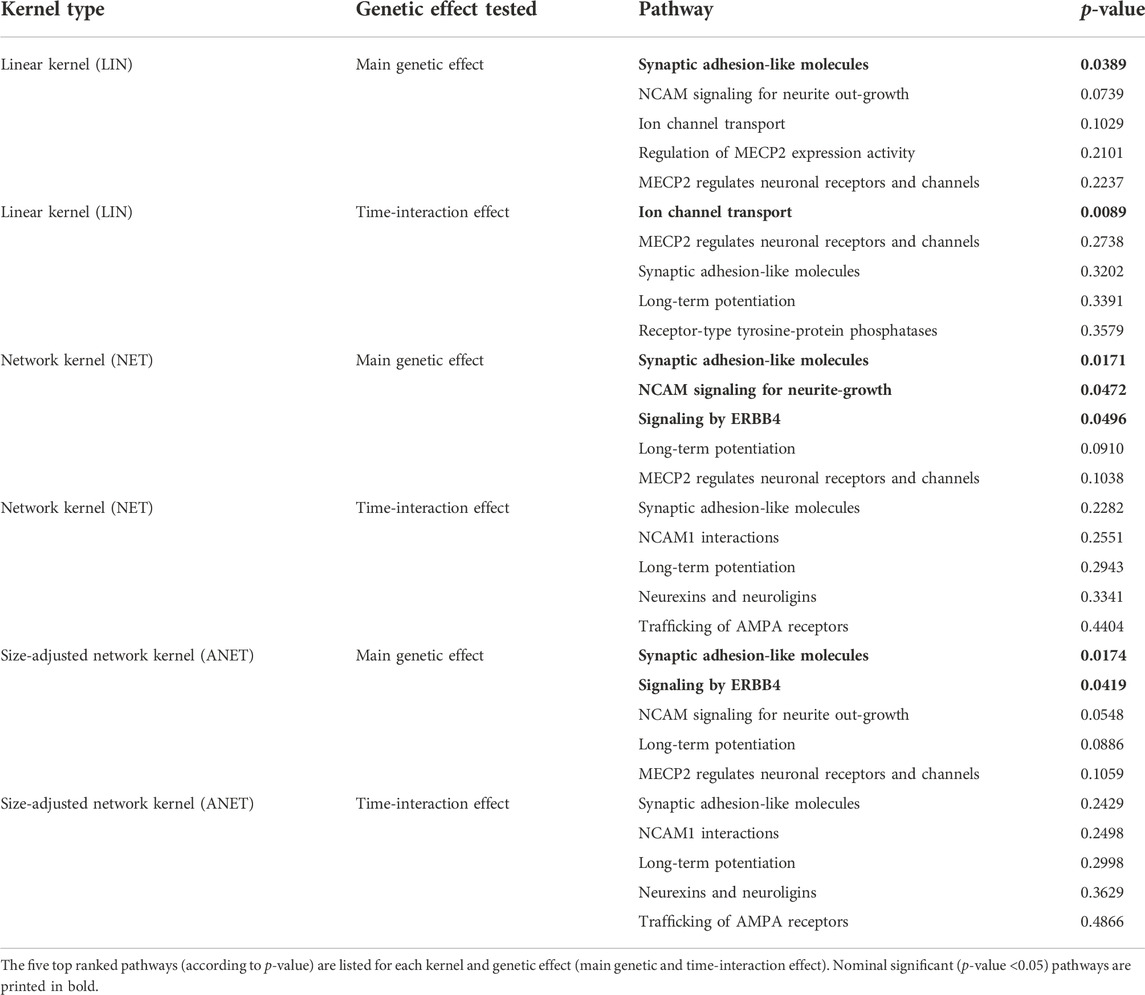
TABLE 6. Results of the real-data analyses without outlier.
Here we present long-KMR, a topology-based pathway analysis method for longitudinal data, which applies kernel machine regression. The methodological basis of long-KMR is presented. To create long-KMR the connection of KMR and LMM are exploited. In addition, we use the network kernel (Freytag et al., 2013) integrating network information into the model. A simulation study is conducted to assess the performance of long-KMR. The models applied in the simulation study are displayed in Table 1. Different aspects are studied, including the influence of the number of measurement points and varying pathway densities. We modeled and tested a main genetic effect and a time-interaction effect for association, the latter testing the association of a pathway with the trajectory of the phenotype TMT-B. Furthermore, we considered an approach to analyze a joint model containing the main genetic effect and the time-interaction effect in a computationally effective way. Lastly, we applied long-KMR to a cognitive phenotype from the PsyCourse Study (Budde et al., 2018).
As expected, the power of long-KMR increases with growing number of measurement points, in particular for the time-interaction effect. This can be traced back to the information that is added to the model at each measurement point, increasing the probability of detecting an effect. Thus, we also identified a larger power loss when analyzing the time-interaction effect with incomplete phenotype data (missing measurements).
The performance of long-KMR improves further when we apply the network kernel instead of the linear kernel, in particular in the single-effect models. We observe that the network kernel has at least the same power as the linear kernel. The power benefit of the network kernel is more pronounced when testing in the presence of smaller genetic effect sizes. For larger genetic effect sizes the power is already extremely high (approx. 98%–99%, Supplementary Table S4), thus the power increase is less noticeable. This power gain is due to the integration of additional pathway information on gene interactions and network topology (Freytag et al., 2013). Here, the topology characteristics of the pathway network play an important role. As the network kernel was developed to exploit the connection of a pathway (Freytag et al., 2013) we studied the influence of the pathway density, identifying a power increase with decreasing pathway density. The higher the density, the more the respective power of network and linear kernel converged. Mathematically, a pathway with many connections (high density) leads to a denser adjacency matrix
In the joint model including both main and time-interaction effect, the network kernel demonstrated a slightly different performance for different pathway densities. We consider four measurement points only. The network kernel with density 0.2 (lowest density) still has the highest power but only slightly higher when compared to the linear kernel (approx. 72%–73%). The network kernels with densities 0.5 and 0.8 have surprisingly low power compared to the linear kernel. This phenomenon is perhaps due to the simulation of the genetic effect as purely linear effect and enhanced by the application of two different kernel functions in one model. We simulate the genetic effects in a linear fashion and thus we observe the performance of the network kernel in worst-case scenarios. Nevertheless, the network kernel improved long-KMR slightly when the pathway density is not too high. In general, long-KMR is preferable except when testing a very dense pathway. The latter should be acknowledged and considered when interpreting the results of long-KMR under a specific kernel.
It should also be taken into account that a possible misspecification of a pathway, for example, in the form of wrongly described gene connections leads to an inaccurate pathway topology and pathway characteristics, e.g., density. This can lead to power changes in the analysis. Thus, one of the greatest challenges to topology-based pathway analyses remains the possible inaccuracy and perhaps incompleteness of the studied pathways. Here, future work is required to minimize possible misclassifications. In the future, it would be also worthwhile analyzing other pathway characteristics, e.g., the betweenness centrality or diameter of the pathway, and their influence on power of the long-KMR with the network kernel. However, these aspects should also be considered beforehand in one-measurement settings in order to determine any indication of the performance being affected and thus keep the computational costs associated with the analysis of an extensive longitudinal scenario down to an acceptable level. Additionally, more complex simulation models could be considered, including e.g., genetic effect models in which causal SNP effects interact with each other and the causal SNPs vary between main and interaction effects. Here it is expected that these scenarios are even more advantageous for the network kernel. However, this exceeds the scope of this communication.
When comparing the different two-measurement models either for the main effect or for the time-interaction effect, long-KMR has the higher power and is the preferred option, in spite of its longer computation time, in particular when using the network kernel. As expected ANCOVA has lower power. Note that the ANCOVA model only uses the second measurement point as dependent variable (Table 1) and loses information regarding the time effect. For the main genetic effect, we even observed that by applying the network kernel compared to the linear kernel, the power loss resulting from the smaller number of measurement points is reduced.
For the four-measurement models the comparison with KMgene (Yan et al., 2015; Yan et al., 2018) on pathway level reveals that our long-KMR has higher power. In addition, the KMgene type I error rates were slightly inflated (Table 3) for the Fisher method. Thus, we used a second p-value combination approach according to Stouffer (Larson et al., 2017), yielding even slightly more inflated p-values (data not illustrated). Thus, our approach represents the suitable choice when analyzing a whole pathway. KMgene remains a solid approach when analyzing single genes.
In our application, a total of seven pathways were nominally significant (Table 6). Six of the seven pathways were associated with TMT-B when testing for the main effect. We looked more closely at the pathways with a p-value <0.1, i.e., “synaptic adhesion-like molecules,” “signaling by ERBB4,” “long-term potentiation,” and “NCAM signaling for neurite growth.” The first three pathways contain the gene DLG4. This synaptic gene encodes for the density protein 95 (PSD95) and plays a critical role in the activity regulation of NMDA (N-methyl-d-aspartate) receptors in schizophrenic patients (Cheng et al., 2010; Tian et al., 2017). It is important for learning and memory (Tian et al., 2017) and as a predictor of cognitive deficits (Fan et al., 2018). DLG4 is also part of the complex DLG4-NMDA-DLGAP1, which was associated with influencing executive functions, in particular the set-shifting abilities (cognitive flexibility) in attention deficit hyperactivity disorder individuals (Fan et al., 2018). NMDA receptors, which are highly influenced by DLG4, are important in many neuropsychiatric disorders that have a cognitive flexibility impairment (Fan et al., 2018), e.g., schizophrenia (Cheng et al., 2010). Two other schizophrenia susceptibility genes are NRG1 and ERBB4 (Banerjee et al., 2010; Tian et al., 2017), which are part of the “signaling by ERBB4” and “long-term potentiation” pathway together with DLG4. The signaling pathway of NRG1 and ERBB4 has been identified as influencing the transmission of glutamate and GABA (Banerjee et al., 2010), which are implicated in playing a role in executive functions (Hatoum et al., 2020). NRG1-ERBB4 signaling has also been discussed as a target of gene therapy in adults with neurodevelopmental disorders to reduce cognitive impairment, e.g., in executive functions (Shi and Bergson, 2020). They modulate different synaptic processes, such as long-term potentiation, and are essential for the development of the nervous system (Ledonne and Mercuri, 2019), proper brain function and cognitive processes (Ledonne and Mercuri, 2019). The “long-term potentiation” pathway is also strongly influenced by the above-mentioned NMDA glutamate receptors and is strongly involved with learning and memory processes (Lisman et al., 2012; Lüscher and Malenka, 2012). For the fourth pathway, “NCAM signaling for neurite outgrowth,” the neural cell adhesion molecule (NCAM) also plays an important role in the nervous system (Li et al., 2013).
Of the seven pathways nominally significant, “ion channel transport” was the only pathway to prove significant for the time-interaction effect and when modelled with the linear kernel. This pathway had the lowest p-value (0.0089). Ion channels are implicated in influencing the susceptibility to or the pathogenesis of psychiatric diseases (Imbrici et al., 2013), and are integral to synaptic functioning.
Overall, we demonstrated that our longitudinal topology-based pathway analysis displays a power gain and a great flexibility to model pathways and genetic effects. Our approach enables the choice between the popular linear kernel and a network kernel that integrates pathway topology information. The latter demonstrated superiority depending on the density of the pathway of interest. The approach is implemented as the R package kalpra, which is available at https://gitlab.gwdg.de/bernadette.wendel/kalpra.
The data analyzed in this study is subject to the following licenses/restrictions: Due to the sensitivity of individual genetic information, the dataset presented in this study are available upon reasonable request. Requests to access these datasets should be directed to the authors.
The studies involving human participants were reviewed and approved by the respective ethics committees at each study center. The patients/participants provided their written informed consent to participate in this study.
Conceptualization and core writing team: BW, UH, and HB; methodology, analysis tools, and analysis: BW; contribution to analysis tools: MH; data curation: MB, MH, SP, PF, TGS, and UH; writing-original draft: BW; writing-review and editing: all authors. All authors contributed to the article and approved the submitted version.
TGS and PF are supported by the Deutsche Forschungsgemeinschaft (German Research Foundation; DFG) within the framework of the projects http://www.kfo241.de and http://www.PsyCourse.de (SCHU 1603/4-1, 5-1, 7-1; FA241/16-1). BW and HB are supported by the DFG (KFO241, BI 576 15-1). TGS received additional support from the German Federal Ministry of Education and Research (BMBF) within the framework of the BipoLife network (01EE1404H), IntegraMent (01ZX1614K), e:Med Program (01ZX1614K) and the Lisa Oehler Foundation (Kassel, Germany). TGS was further supported by the grants GEPI-BIOPSY (01EW 2005) and MulioBio (01EW 2009) from ERA-NET Neuron (BMBF). SP was supported by a 2016 NARSAD Young Investigator Grant (25015) from the Brain and Behavior Research Foundation. UH was supported by European Union’s Horizon 2020 Research and Innovation Program (PSY-PGx, Grant agreement No. 945151).
The authors would like to thank Andrew Entwistle for proofreading the manuscript. Further, we acknowledge support by the Open Access Publication Funds of the Göttingen University.
The authors declare that the research was conducted in the absence of any commercial or financial relationships that could be construed as a potential conflict of interest.
All claims expressed in this article are solely those of the authors and do not necessarily represent those of their affiliated organizations, or those of the publisher, the editors and the reviewers. Any product that may be evaluated in this article, or claim that may be made by its manufacturer, is not guaranteed or endorsed by the publisher.
The Supplementary Material for this article can be found online at: https://www.frontiersin.org/articles/10.3389/fgene.2022.1015885/full#supplementary-material
Altshuler, D. M., Gibbs, R. A., Peltonen, L., Altshuler, D. M., Gibbs, R. A., Peltonen, L., et al. (2010). Integrating common and rare genetic variation in diverse human populations. Nature 467 , 7311, 52–58. doi:10.1038/nature09298
Banerjee, A., MacDonald, M. L., Borgmann-Winter, K. E., and Hahn, C.-G. (2010). Neuregulin 1- erbB4 pathway in schizophrenia: From genes to an interactome. Brain Res. Bull. 83, 132–139. doi:10.1016/j.brainresbull.2010.04.011
Bowie, C. R., and Harvey, P. D. (2006). Administration and interpretation of the Trail making test. Nat. Protoc. 1 (5), 2277–2281. doi:10.1038/nprot.2006.390
Budde, M., Anderson-Schmidt, H., Gade, K., Reich-Erkelenz, D., Adorjan, K., Kalman, J. L., et al. (2018). A longitudinal approach to biological psychiatric research: The PsyCourse study. Am. J. Med. Genet. B Neuropsychiatr. Genet. 180 (2), 89–102. doi:10.1002/ajmg.b.32639
Caruana, E. J., Roman, M., Hernández-Sánchez, J., and Solli, P. (2015). Longitudinal studies. J. Thorac. Dis. 7, E537–E540. doi:10.3978/j.issn.2072-1439.2015.10.63
Chang, C. C., Chow, C. C., Tellier, L. C., Vattikuti, S., Purcell, S. M., and Lee, J. J. (2015). Second-generation PLINK: Rising to the challenge of larger and richer datasets. GigaScience 4, 7. doi:10.1186/s13742-015-0047-8
Cheng, M.-C., Lu, C.-L., Luu, S.-U., Tsai, S.-U., Hsu, S.-H., Chen, T.-T., et al. (2010). Genetic and functional analysis of the DLG4 gene encoding the post-synaptic density protein 95 in schizophrenia. PLoS ONE 5, e15107. doi:10.1371/journal.pone.0015107
Csardi, G., and Nepusz, T. (2006). The igraph software package for complex network research. InterJournal. Available: https://igraph.org/.
Das, S., Forer, L., Schönherr, S., Sidore, C., Locke, A. E., Kwong, A., et al. (2016). Next-generation genotype imputation service and methods. Nat. Genet. 48, 1284–1287. doi:10.1038/ng.3656
Davies, R. B. (1980). Algorithm AS 155: The distribution of a linear combination of χ 2 random variables. Appl. Stat. 29, 323. doi:10.2307/2346911
de Leeuw, C. A., Neale, B. M., Heskes, T., and Posthuma, D. (2016). The statistical properties of gene-set analysis. Nat. Rev. Genet. 17, 353–364. doi:10.1038/nrg.2016.29
Dewey, M. (2022). metap: meta-analysis of significance values. R package version 1.8, Diamond, A. (2013 Executive Functions. Annu. Rev. Psychol. 64 (1), 135–168. doi:10.1146/annurev-psych-113011-143750
Fan, Z., Qian, Y., Lu, Q., Wang, Y., Chang, S., and Yang, L. (2018). DLGAP1 and NMDA receptor-associated postsynaptic density protein genes influence executive function in attention deficit hyperactivity disorder. Brain Behav. 8, e00914. doi:10.1002/brb3.914
Freytag, S., Bickeböller, H., Amos, C. I., Kneib, T., and Schlather, M. (2012). A novel kernel for correcting size bias in the logistic kernel machine test with an application to rheumatoid arthritis. Hum. Hered. 74, 97–108. doi:10.1159/000347188
Freytag, S., Manitz, J., Schlather, M., Kneib, T., Amos, C. I., Risch, A., et al. (2013). A network-based kernel machine test for the identification of risk pathways in genome-wide association studies. Hum. Hered. 76, 64–75. doi:10.1159/000357567
Friedman, N. P., Miyake, A., Altamirano, L. J., Corley, R. P., Young, S. E., Rhea, A., et al. (2016). Stability and change in executive function abilities from late adolescence to early adulthood: A longitudinal twin study. Dev. Psychol. 52 (2), 326–340. doi:10.1037/dev0000075
Gao, Q., He, Y., Yuan, Z., Zhao, J., Zhang, B., and Xue, F. (2011). Gene- or region-based association study via kernel principal component analysis. BMC Genet. 12, 75. doi:10.1186/1471-2156-12-75
Ge, T., Smoller, J. W., and Sabuncu, M. R. (2016). “Kernel machine regression in neuroimaging genetics,” in Machine learning and medical imaging (Netherlands: Elsevier).
Hatoum, A. S., Morrison, C. L., Mitchell, E. C., Lam, M., Benca-Bachman, C. E., Reineberg, A. E., et al. (2020). Genome-wide association study of over 427,000 individuals establishes executive functioning as a neurocognitive basis of psychiatric disorders influenced by GABAergic processes. bioRxiv [Preprint]. doi:10.1101/674515
Heilbronner, U., Adorjan, K., Anderson-Schmidt, H., Budde, M., Comes, A. L., Gade, K., et al. (2021). The PsyCourse codebook. Version 5.0
Hendricks, A. E., Dupuis, J., Logue, M. W., Myers, R. H., and Lunetta, K. L. (2013). Correction for multiple testing in a gene region. Eur. J. Hum. Genet. 22, 414–418. doi:10.1038/ejhg.2013.144
Holmans, P. (2010). Statistical methods for pathway analysis of genome-wide data for association with complex genetic traits. Adv. Genet. 72, 141–179. doi:10.1016/B978-0-12-380862-2.00007-2
Imbrici, P., Conte Camerino, D., and Tricarico, D. (2013). Major channels involved in neuropsychiatric disorders and therapeutic perspectives. Front. Genet. 4, 76. doi:10.3389/fgene.2013.00076
Jassal, B., Matthews, L., Viteri, G., Gong, C., Lorente, P., Fabregat, A., et al. (2019). The reactome pathway knowledgebase. Nucleic Acids Res. 48, D498. doi:10.1093/nar/gkz1031
Kanehisa, M., Furumichi, M., Tanabe, M., Sato, Y., and Morishima, K. (2017). Kegg: New perspectives on genomes, pathways, diseases and drugs. Nucleic Acids Res. 45, D353–D361. doi:10.1093/nar/gkw1092
Larson, N. B., Chen, J., and Schaid, D. J. (2019). A Review of kernel methods for genetic association studies. Genet. Epidemiol. 43, 122–136. doi:10.1002/gepi.22180
Larson, N. B., McDonnell, S., Albright, L. C., Teerlink, C., Stanford, J., Ostrander, E. A., et al. (2017). gsSKAT: Rapid gene set analysis and multiple testing correction for rare-variant association studies using weighted linear kernels. Genet. Epidemiol. 41, 297–308. doi:10.1002/gepi.22036
Ledonne, A., and Mercuri, N. B. (2019). On the modulatory roles of neuregulins/ErbB signaling on synaptic plasticity. Int. J. Mol. Sci. 21, 275. doi:10.3390/ijms21010275
Li, S., Leshchyns'ka, I., Chernyshova, Y., Schachner, M., and Sytnyk, V. (2013). The neural cell adhesion molecule (NCAM) associates with and signals through p21-activated kinase 1 (Pak1). J. Neurosci. 33, 790–803. doi:10.1523/JNEUROSCI.1238-12.2013
Lisman, J., Yasuda, R., and Raghavachari, S. (2012). Mechanisms of CaMKII action in long-term potentiation. Nat. Rev. Neurosci. 13, 169–182. doi:10.1038/nrn3192
Liu, D., Ghosh, D., and Lin, X. (2008). Estimation and testing for the effect of a genetic pathway on a disease outcome using logistic kernel machine regression via logistic mixed models. BMC Bioinforma. 9, 292. doi:10.1186/1471-2105-9-292
Liu, D., Lin, X., and Ghosh, D. (2007). Semiparametric regression of multidimensional genetic pathway data: Least-squares kernel machines and linear mixed models. Biometrics 63, 1079–1088. doi:10.1111/j.1541-0420.2007.00799.x
Lüscher, C., and Malenka, R. C. (2012). NMDA receptor-dependent long-term potentiation and long-term depression (LTP/LTD). Cold Spring Harb. Perspect. Biol. 4, a005710. doi:10.1101/cshperspect.a005710
Malzahn, D., Friedrichs, S., Rosenberger, A., and Bickeböller, H. (2014). Kernel score statistic for dependent data. BMC Proc. 8, S41. doi:10.1186/1753-6561-8-S1-S41
Molenberghs, G., and Verbeke, G. (2000). Linear mixed models for longitudinal data. New York: Springer.
Mooney, M. A., and Wilmot, B. (2015). Gene set analysis: A step-by-step guide. Am. J. Med. Genet. B Neuropsychiatr. Genet. 168, 517–527. doi:10.1002/ajmg.b.32328
R Core Team (2021). R: A language and environment for statistical computing. Available: https://www.R-project.org/(Accessed September 3, 2021).
Rodchenkov, I., Babur, O., Luna, A., Aksoy, B. A., Wong, J. V., Fong, D., et al. (2019). Pathway commons 2019 update: Integration analysis and exploration of pathway data. Nucleic Acids Res. 48, D489–D497. doi:10.1093/nar/gkz946
Schaid, D. J. (2010). Genomic similarity and kernel methods I: Advancements by building on mathematical and statistical foundations. Hum. Hered. 70, 109–131. doi:10.1159/000312641
Schaid, D. J. (2010). Genomic similarity and kernel methods II: Methods for genomic information. Hum. Hered. 70, 132–140. doi:10.1159/000312643
Schölkopf, B., Smola, A., and Müller, K.-R. (1997). “Kernel principal component analysis,” in Lecture notes in computer science (Germany: Springer Berlin Heidelberg).
Schölkopf, B., Smola, A., and Müller, K.-R. (1998). Nonlinear component analysis as a kernel eigenvalue problem. Neural Comput. 10, 1299–1319. doi:10.1162/089976698300017467
Shi, L., and Bergson, C. M. (2020). Neuregulin 1: An intriguing therapeutic target for neurodevelopmental disorders. Transl. Psychiatry 10, 190. doi:10.1038/s41398-020-00868-5
Smigielski, L., Papiol, S., Theodoridou, A., Heekeren, K., Gerstenberg, M., Wotruba, D., et al. (2021). Polygenic risk scores across the extended psychosis spectrum. Transl. Psychiatry 11, 600. doi:10.1038/s41398-021-01720-0
Stern, D. F. (2019). Signaling by ERBB4. Reactome - a curated knowledgebase of biological pathways. Nucleic Acids Res 33, D428–32. doi:10.3180/r-hsa-1236394.3
Strauss, E., Sherman, E. M. S., and Spreen, O. (2006). A compendium of neuropsychological tests - administration, norms, and commentary. New York: Oxford University Press.
Su, Z., Marchini, J., and Donnelly, P. (2011). HAPGEN2: Simulation of multiple disease SNPs. Bioinformatics 27, 2304–2305. doi:10.1093/bioinformatics/btr341
Tian, J., Geng, F., Gao, F., Chen, Y.-H., Liu, J.-H., Wu, J.-L., et al. (2017). Down-regulation of neuregulin1/ErbB4 signaling in the Hippocampus is critical for learning and memory. Mol. Neurobiol. 54, 3976–3987. doi:10.1007/s12035-016-9956-5
van Buuren, S., and Groothuis-Oudshoorn, K. (2011). mice: Multivariate imputation by chained equations in R. J. Stat. Softw. 45, 1–67. doi:10.18637/jss.v045.i03
Wang, Z., Xu, K., Zhang, X., Wu, X., and Wang, Z. (2016). Longitudinal SNP-set association analysis of quantitative phenotypes. Genet. Epidemiol. 41, 81–93. doi:10.1002/gepi.22016
Wendel, B., Papiol, S., Andlauer, T. F. M., Zimmermann, J., Wiltfang, J., Spitzer, C., et al. (2021). A genome-wide association study of the longitudinal course of executive functions. Transl. Psychiatry 11, 386. doi:10.1038/s41398-021-01510-8
Wu, M. C., Kraft, P., Epstein, M. P., Taylor, D. M., Chanock, S. J., Hunter, D. J., et al. (2010). Powerful SNP-set analysis for case-control genome-wide association studies. Am. J. Hum. Genet. 86, 929–942. doi:10.1016/j.ajhg.2010.05.002
Wu, M. C., Lee, S., Cai, T., Li, Y., Boehnke, M., and Lin, X. (2011). Rare-variant association testing for sequencing data with the sequence kernel association test. Am. J. Hum. Genet. 89, 82–93. doi:10.1016/j.ajhg.2011.05.029
Yan, Q., Fang, Z., and Chen, W. (2018). KMgene: A unified r package for gene-based association analysis for complex traits. Bioinformatics 34, 2144–2146. doi:10.1093/bioinformatics/bty066
Keywords: pathway analysis, kernel machine regression, longitudinal data, network, PsyCourse Study
Citation: Wendel B, Heidenreich M, Budde M, Heilbronner M, Oraki Kohshour M, Papiol S, Falkai P, Schulze TG, Heilbronner U and Bickeböller H (2022) Kalpra: A kernel approach for longitudinal pathway regression analysis integrating network information with an application to the longitudinal PsyCourse Study. Front. Genet. 13:1015885. doi: 10.3389/fgene.2022.1015885
Received: 10 August 2022; Accepted: 24 November 2022;
Published: 06 December 2022.
Edited by:
Ka-Chun Wong, City University of Hong Kong, Hong Kong SAR, ChinaReviewed by:
Madan Kundu, Daiichi Sankyo, United StatesCopyright © 2022 Wendel, Heidenreich, Budde, Heilbronner, Oraki Kohshour, Papiol, Falkai, Schulze, Heilbronner and Bickeböller. This is an open-access article distributed under the terms of the Creative Commons Attribution License (CC BY). The use, distribution or reproduction in other forums is permitted, provided the original author(s) and the copyright owner(s) are credited and that the original publication in this journal is cited, in accordance with accepted academic practice. No use, distribution or reproduction is permitted which does not comply with these terms.
*Correspondence: Bernadette Wendel, YmVybmFkZXR0ZS53ZW5kZWxAbWVkLnVuaS1nb2V0dGluZ2VuLmRl
Disclaimer: All claims expressed in this article are solely those of the authors and do not necessarily represent those of their affiliated organizations, or those of the publisher, the editors and the reviewers. Any product that may be evaluated in this article or claim that may be made by its manufacturer is not guaranteed or endorsed by the publisher.
Research integrity at Frontiers
Learn more about the work of our research integrity team to safeguard the quality of each article we publish.