 Mohammad Jafar Tanin1*
 Achla Sharma1*
 Dinesh Kumar Saini1
 Satinder Singh1
 Lenika Kashyap1
 Puja Srivastava1G. S. Mavi1
 Satinder Kaur2
 Vijay Kumar1Vineet Kumar1
 Gomti Grover1
 Parveen Chhuneja2V. S. Sohu1
- 1Department of Plant Breeding and Genetics, Punjab Agricultural University, Ludhiana, India
- 2School of Agricultural Biotechnology, Punjab Agricultural University, Ludhiana, India
The high performance and stability of wheat genotypes for yield, grain protein content (GPC), and other desirable traits are critical for varietal development and food and nutritional security. Likewise, the genotype by environment (G × E) interaction (GEI) should be thoroughly investigated and favorably utilized whenever genotype selection decisions are made. The present study was planned with the following two major objectives: 1) determination of GEI for some advanced wheat genotypes across four locations (Ludhiana, Ballowal, Patiala, and Bathinda) of Punjab, India; and 2) selection of the best genotypes with high GPC and yield in various environments. Different univariate [Eberhart and Ruessll’s models; Perkins and Jinks’ models; Wrike’s Ecovalence; and Francis and Kannenberg’s models], multivariate (AMMI and GGE biplot), and correlation analyses were used to interpret the data from the multi-environmental trial (MET). Consequently, both the univariate and multivariate analyses provided almost similar results regarding the top-performing and stable genotypes. The analysis of variance revealed that variation due to environment, genotype, and GEI was highly significant at the 0.01 and 0.001 levels of significance for all studied traits. The days to flowering, plant height, spikelets per spike, grain per spike, days to maturity, and 1000-grain weight were specifically affected by the environment, whereas yield was mainly affected by the environment and GEI. Genotypes, on the other hand, had a greater impact on the GPC than environmental conditions. As a result, a multi-environmental investigation was necessary to identify the GEI for wheat genotype selection because the GEI was very significant for all of the evaluated traits. Yield, 1000-grain weight, spikelet per spike, and days to maturity were observed to have positive correlations, implying the feasibility of their simultaneous selection for yield enhancement. However, GPC was observed to have a negative correlation with yield. Patiala was found to be the most discriminating environment for both yield and GPC and also the most effective representative environment for GPC, whereas Ludhiana was found to be the most effective representative environment for yield. Eventually, two NILs (BWL7508, and BWL7511) were selected as the top across all environments for both yield and GPC.
Introduction
Bread wheat (Triticum aestivum L.) is considered to be the most valuable source of calories and protein across the world (Pal et al., 2022). It is widely grown in different parts of the world, including India, where it is an important staple crop, particularly in the northern region (mainly Punjab State). In many studies, grain protein content (GPC) has been observed to be the most important factor influencing end-use quality and thus has a significant impact on the economic importance of wheat (Saini et al., 2020). As a direct consequence, GPC improvement in wheat has become a top priority in wheat breeding research projects, particularly for those looking at improvement in nutritional quality (Shewry, 2009; Gudi et al., 2022), especially for the people who cannot afford supplements to fulfill their daily recommended intake of protein. Since a negative association is generally observed between GPC and grain yield, developing an elite wheat cultivar having higher yield potential and GPC is considered a major challenge, taking the current growing rate of food requirements into consideration. Breeders can target desirable stable genotypes having high yield potential and GPC based on the results of selection in different environments and more advanced approaches such as genomic selection (Sandhu et al., 2021a, 2021b; Gill et al., 2021, 2022; Saini et al., 2022). Biotic as well as abiotic stresses usually play a considerable role in grain yield and GPC fluctuations, which are closely associated with the immediate response of cultivars to environmental changes (Verma et al., 2015). This type of inconsistency or alteration is known as genotype by environment interaction (GEI), and it has been observed in several crops, including wheat (Ahmed et al., 2011; Mengesha et al., 2019; Ahakpaz et al., 2021).
Wheat breeders have always faced difficulty integrating both high grain yield and high GPC into individual wheat genotypes, mainly because of the following factors: 1) grain yield and GPC are highly influenced by the environment; 2) GPC and grain yield typically have a negative correlation with each other; and 3) both yield and GPC have low to moderate level of heritability and are controlled by a large number of genes (Khazratkulova et al., 2015). Further, the wide range of environmental dependent variables that are available in wheat growing regions brings up the idea that there might be a strong directional interaction present between genotype and environment. This interaction, therefore, occurs whenever the yield potential of individual plant is significantly influenced by the environment in which they are evaluated (Malosetti et al., 2013). To study GEI, two major steps are always considered to be performed: 1) phenotypic characterization of the germplasm in a multi-location trial, which subsequently demonstrates the possible existence of environmental diversity available in growing regions; and 2) analysis of the observed data to explain the structure of the current interaction between genotype and environment and consequently to display the possible environmental-related parameters that help predict the behavior of genotypes in untested environments (Hilmarsson and Roi, 2021). As a result, rather than selecting according to the average performance of cultivars conferring a wider level of adaptation, it is preferred to arrange environments with identical G x E performances into mega-environments to select individual plants conferring local adaptations to different environmental circumstances (Gauch and Zobel, 1997; Gauch, 2013). Moreover, designing a multi-environmental trial to verify the stability and performance (mainly in terms of yield) of wheat genotypes is a critical requirement for successfully developing and releasing elite wheat varieties.
Analysis of variance (ANOVA) is generally performed to ascertain the presence of GEI utilizing the data collected from the multi-environment trials. These measures are further used to distinguish between random (including location, replication, year, and environment) and fixed effects (such as genotypes). Nonetheless, one of ANOVA’s major flaws is its inability to distinguish genotypic variances in a non-additive base as an interaction between genotype and environment (Shahriari et al., 2018). In the literature, different statistical methods have been used to explain different parts of GEI. These methods have led to the identification of stable genotypes across locations by measuring genotypic stability. Two different approaches, including univariate (Eberhart and Ruessll’s models, Perkins and Jinks’ models, Wricke’s Ecovalnece, and Francis and Kanenberg’s model) and multivariate (AMMI and GGE biplot) stability prediction procedures, are generally utilized to better understand the phenotypic stability patterns. Pattern analysis, cluster analysis, principal component analysis (PCA), and biplot analysis are commonly utilized multivariate techniques for discovering trends of GEI (Myint et al., 2019). The biplot techniques are currently applied to diagrammatically represent the complex relationships available between the variables (genotypes, environments, and GEI) as well as to determine relatively stable genotypes throughout the environments and similarly prove the interaction structures (Shahriari et al., 2018). Singular value decomposition (SVD) and visual presentation of two-way matrices, such as the GEI statistical data, are used to develop biplots. The two most commonly used biplot analysis methods are as follows: 1) the additive main effects and multiplicative interaction (AMMI) model and 2) the genotype main effects and GE effects (GGE) model (Gauch, 2008). Furthermore, plant breeders are more interested in the above-mentioned statistical methods (AMMI and GGE) because these methods can be applied to any two-way measure, which can come from a variety of experiments. The AMMI model employs ANOVA to examine the main effects of genotypes and environments, as well as PCA to look at residual interaction features (Singh et al., 2019). In AMMI1, the PCA1 and substantial effect of the trait are represented by the abscissa line and ordinate, respectively. But AMMI2 is a graphical depiction of summarized information based on both PC1 and PC2 values, which has significant privileges as compared to regression-based statistical tools. The GGE biplot provides a more significant diagrammatical depiction as compared to AMMI model to identify genotypes conferring best performance across all the environments under study (Shrestha et al., 2021).
Furthermore, as the environment in specific areas becomes more unpredictable over time, yield stability and broad adaptability are becoming increasingly important (Singh et al., 2019). In cereals, the AMMI technique was used in multi-environment experiments to characterize the most stable cultivar(s) (Sabaghnia et al., 2008; Sharifi et al., 2017). Several other studies have been successfully implemented cultivar stability analysis using both genotype and environmental assessments, as well as the GGE biplot-adopted multi-environment test, with great success (e.g., Mostafavi et al., 2011; Bishnoi and Om Perkash, 2020; Ruswandi et al., 2021). On the other hand, Gauch et al. (2008), criticized the GGE biplot structure for decomposing G + GxE, but still reported that biplots interpret G + GxE more accurately than AMMI matrices. GGE biplot analyses have widely been utilized to characterize mega-environments, examine genotype rankings, and further identify discriminativeness and representativeness in evaluated environments (Verma et al., 2015). In a multi-dimensional environment, AMMI can better identify GEI and depict it using a biplot. Both GGE and AMMI analysis models have been utilized successfully in many studies to investigate interaction patterns in multi-environment trials to discover stable genotypes of different cereals, including wheat (Singh et al., 2019; Hilmarsoon and Rio, 2021; Khan et al., 2021). The objectives for this study were to examine GEI, the performance and stability of advanced wheat genotypes, the correlation of grain yield with GPC and agronomic traits, and to ascertain the representativeness and discriminativeness abilities of the environments where wheat is grown.
Materials and methods
Plant materials
The current research was conducted in the Department of Plant Breeding and Genetics, Punjab Agricultural University (PAU), Ludhiana, Punjab, India. For this study, a total of 13 wheat genotypes, including 9 near isogenic lines (NILs) and 4 checks, including one advanced breeding line (BWL6228), and three commercial wheat varieties (PBW761, PBW725 and HD3086), were utilized. A set of NILs was previously generated in Department of Plant Breeding and Genetics, PAU, with an aim to introgress Gpc-B1 gene from GLUPRO into the background of a high-yielding wheat variety (PBW550). PBW550 was released by Punjab Agricultural University, Ludhiana, for cultivation under timely sown irrigated condition of north western plain zone (NWPZ), including Punjab. The variety is known for its short duration, bold, hard, and amber colored shiny grain with above average quality parameters. From this set of developed NILs, we selected the 9 most agronomically superior wheat NILs for the present study (information on pedigree of these NILs is provided in Table 1). Subsequently, the presence of Gpc-B1 in the above-mentioned NILs using the appropriate KASP marker (data not provided) was also confirmed. For the purpose of the analysis, all the NILs and checks were termed as genotypes.
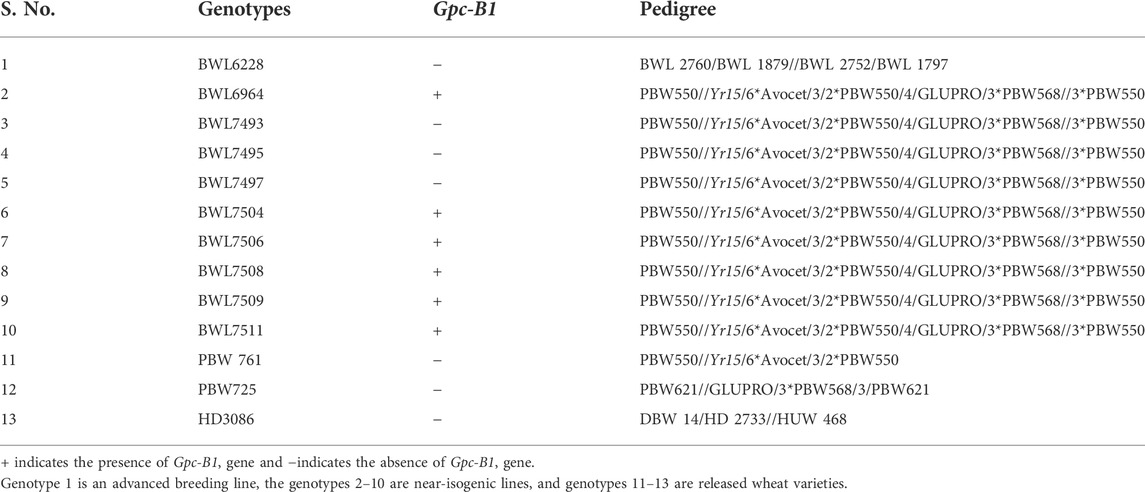
TABLE 1. List and pedigree of the selected genotypes (nine NILs, one advanced breeding line and three released varieties) evaluated in the present study.
Testing environments and crop management practices
The research trials were conducted across four locations (Ludhiana, Ballowal, Patiala, and Bathinda) of Punjab for two consecutive main crop seasons (2019–20 and 2020–21) in Punjab, India. Temperature, rainfall (Table 2) and other ecological conditions differed significantly across the environments (integration of location and time). In each environment, the experiment was conducted in a randomized block design (RBD) with three replications. Each genotype was planted in a separate plot of size 5.4 m2 (4.5 m long with six rows, and the distance between two rows was 20 cm). One experimental trial was sown at the wheat experimental area, wheat section, Department of Plant Breeding and Genetics, PAU, Ludhiana, and the other three were sown at the regional research stations (RRSs) of PAU located in Ballowal, Patiala, and Bathinda, respectively. All the trials were sown from November 10—November 25 in both the years 2019–20 and 2020–21. In each year, during the cropping season, weeding, irrigation, fertilizer application, and all other field management activities were applied according to the standard agronomical package recommended by PAU (https://www.pau.edu/content/ccil/pf/pp_rabi.pdf). The standard rate of fertilizer prescribed by PAU (N = 50 kg/acre, p = 25 kg P2O5/acre, and K = 12 kg K2O/acre) was applied for raising the crop. In each research location, the field was mechanically prepared in accordance with the local farmers’ interests. Furthermore, insect and disease prevention practices were implemented wherever required. Similarly, manual weeding was practiced as per requirement, and weeds were controlled with herbicide application prior to and after field preparation and also across the surrounding marginal areas of the experimental field.
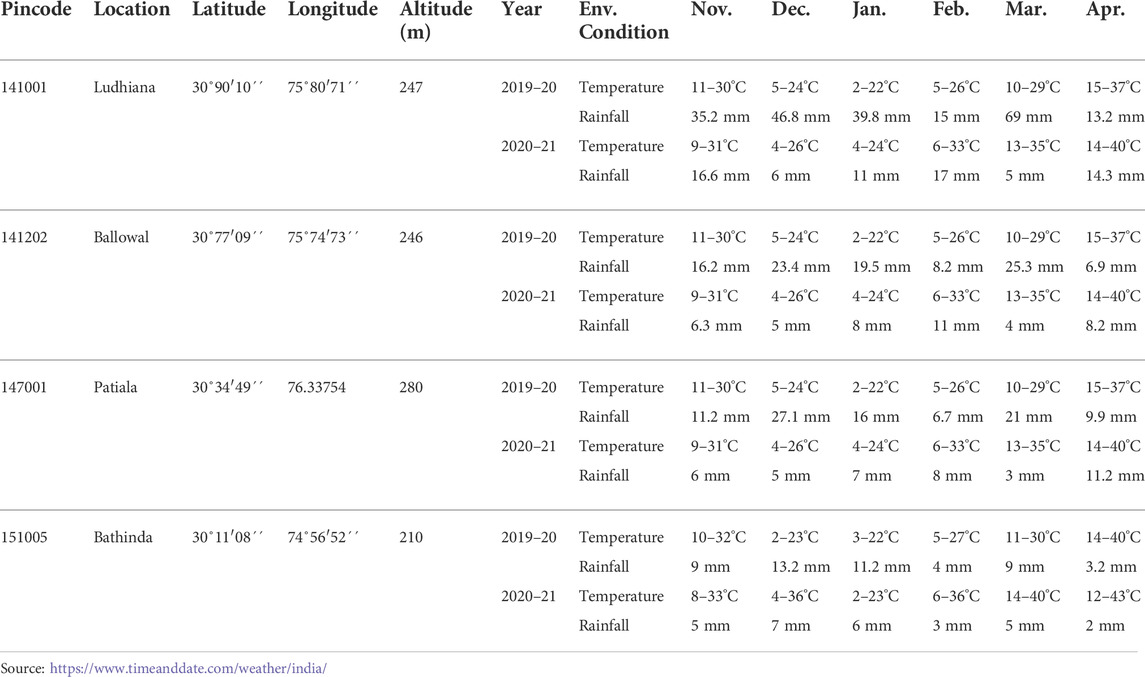
TABLE 2. Details of environmental condition for the experimental locations (Ludhiana, Ballowal, Patiala, and Bathinda) during two consecutive years (2019–20, and 2020–21).
Data collection
Data was recorded on different traits including number of days to flowering (DTF), number of days to maturity (DTM), plant height (cm; PH), number of spikelet per spike (SPS), number of grains per spike (GPS), thousand grain weight (g; TGW), grain yield (kg/plot), and grain protein content (%; GPC). These traits have an immediate and positive impact on grain yield and quality. Pre-harvest (viz., DTF, DTM, PH) and post-harvest (viz., GPS, SPS, TGW, yield and GPC) data were collected in the field, wheat quality laboratory, and molecular wheat laboratory, wheat section, Department of Plant Breeding and Genetics, PAU. Five randomly selected individual plants from each plot were considered for data recording. Data on the various traits was collected on wheat genotypes for two consecutive years (2019–20 and 2020–21) in the following manner: The DTF was recorded when 75% of the spikes emerged from boots in each plot. The DTM was recorded as the number of days from sowing to date when 75% of the spikes in plots turned yellow. PH was measured using the meter rod by placing the meter along the plant from base to tip of the ear at maturity. SPS was determined by counting the number of total spikelets on each spike. The GPS was measured by threshing the representative spikes individually and collecting, cleaning, and counting the grains manually. From harvested grains, 1000 seeds were taken from each plot, and their weight was recorded as a TGW. After threshing of each plot, the grain was weighted and considered as yield per plot. The whole grain analyzer “Infratec1241” (M/S Foss Analytical AB, Sweden) was used to measure the GPC in the grains. It is based upon the principle of near-infrared light, which is transmitted through the grains. The 200 g grain samples were scanned with a bandwidth of 7 nm in the range of 850–1050 nm, and there were 100 data points per scan.
Statistical analysis
Using different packages of R software version 4.0.5, the data on different quantitative traits was subjected to a combined ANOVA to determine whether there was any variation among all the variables considered during the current study. Environments were considered random variables, while genotypes were treated as fixed variables. The Pearson correlation along with the pattern were prepared using “corroplot” package of R software, using the following model given as:
Results
Correlation
Figure 1 provides information regarding the correlation values and patterns among the different traits in question with a particular focus on yield and GPC across all the environments. Yield was observed to have a highly significant negative correlation with GPC (−0.52), while conferring a highly significant positive correlation with TGW (0.66), DTM (0.57). GPC had a highly significant negative correlation with DTF (−0.55), PH (−0.57), DTM (-0.83), TGW (−0.75), and yield (−0.52).
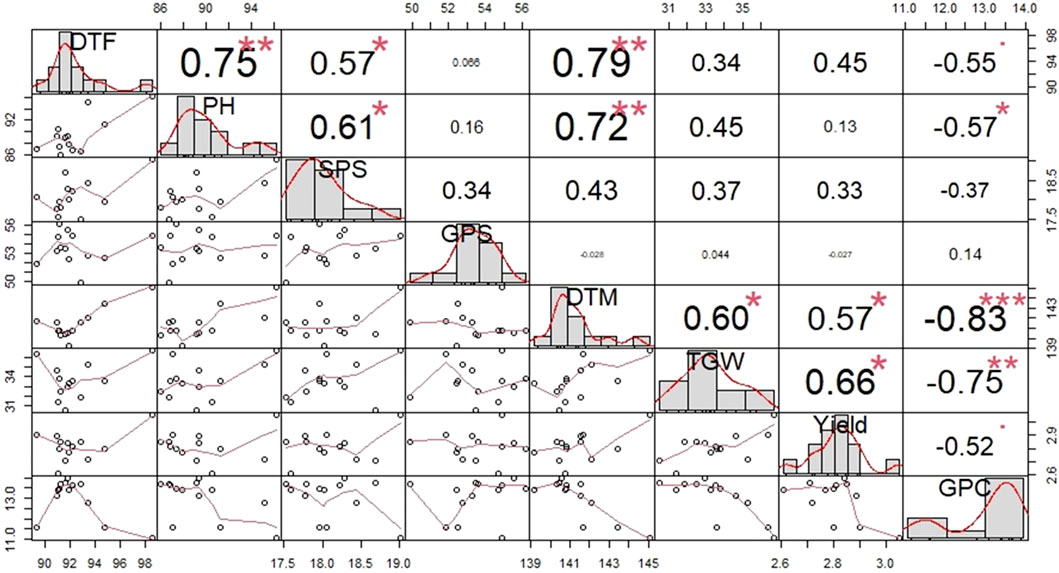
FIGURE 1. Pattern of correlation and level of significance observed among different traits across all the environments in 13 bread wheat genotypes. DTF, Number of days to flowering; PH, Plant height; SPS, Number of spikelets per spike; GPS, Number of grain per spike; DTM, Number of days to maturity; TGW, 1000-grain weight; GPC, Grain protein content.
Pooled analysis of variance for yield, grain protein content and their related traits
The pooled ANOVA was performed to unravel the main effect and determine the interaction present within and among the sources of variations that are analyzed during the present study. The pooled ANOVA concerning all the eight traits is presented in Table 3. The variance due to genotype (G), location (L), year (Y), G × Y, G × L, and G × Y × L for all the eight traits was highly significant, either at 0.001% or at 0.01% level of significance. A high level of variability was observed in wheat genotypes for key traits related to yield and GPC.
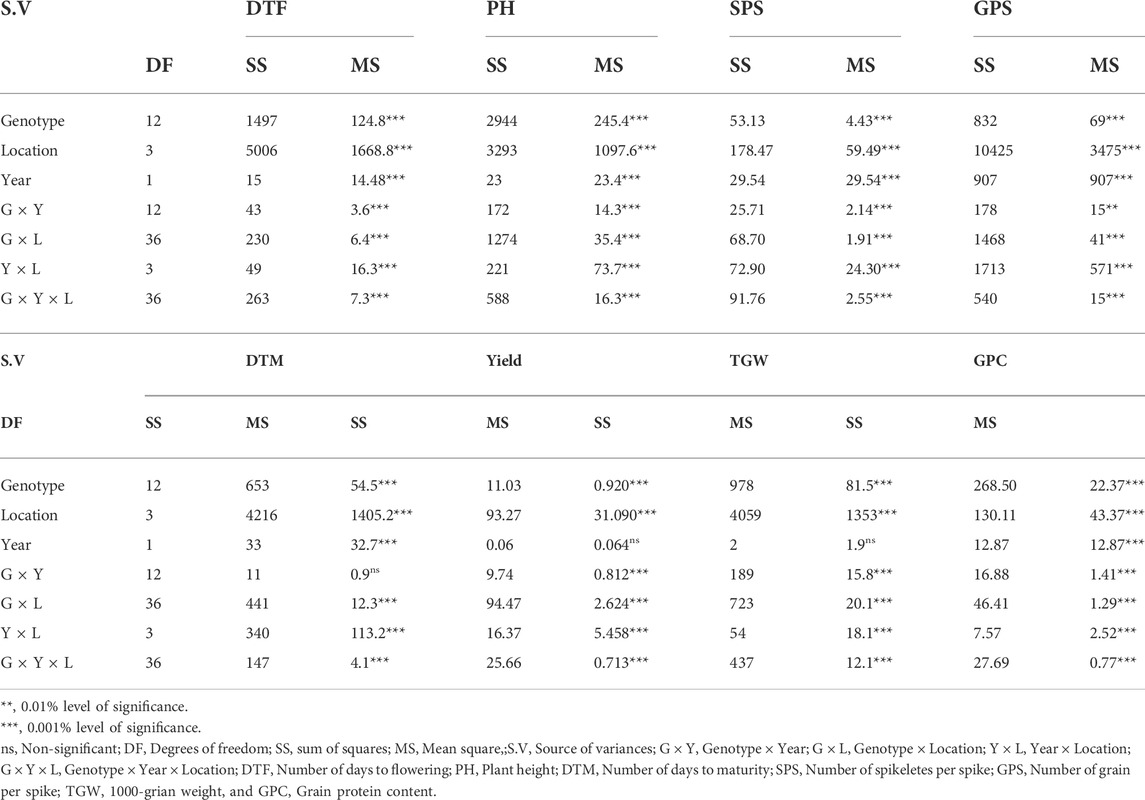
TABLE 3. Combined analysis of variances for grain protein content, yield and key yield-related traits of 13 bread wheat genotypes across eight environments.
Univariate analyses
The data for different regression stability analyses is presented in Table 4 (concerning GPC, and yield) and Supplementary Table S1 (concerning DTF, DTM, SPS, GPS, TGW, and PH). In this study, we focused specially on yield and GPC. For yield, based on the Eberhart and Russell (1966) model, the deviations from the regression (S2di) indicated that, BWL7495, BWL7509, and PBW761 are stable genotypes and, accordingly, the coefficient of regression (bi) showed that they are adaptable, particularly to unfavorable environments (bi = 0.7491 for BWL7495, bi = 0.5863 for BWL7509, and bi = 0.607 for PBW761), but BWL7511 showed adaptability specific to high-yielding environments (bi = 1.1432). The genotypes, BWL7495, BWL7509, PBW725, HD3086, and PBW761 are categorized in the class of stable and high-yielding genotypes, which are adapted particularly to low-performing environments. These genotypes are grouped in this class based on their regression values, which is lower than one. Based on mean grain yield, the BWL7497, BWL7509, PBW761, and PBW725 showed the highest yield and, therefore, were preferred over other genotypes. These genotypes are grouped based on their mean in the high-yielding class. Based on Perkins and Jinks regression analysis, the genotype BWL6964 had a positive coefficient, but the genotypes, BWL7495, BWL7509, and PBW761 had negative coefficient values. Consequently, BWL6964 was observed to be stable due to its highest regression value and adapted specifically to high-yielding environments. Furthermore, the variation in the mean value for yield could be described by the respective responses of genotypes across environments. The regression value close to 1 confirms that genotypes perform in a stable manner across all the environments. The genotypes BWL7508 (bi = 1.15, CV = 16.6%, Bi = 0.15, mean = 2.83 kg/plot; Table 4, and Supplementary Table S2) and BWL7511 (bi = 1.14, CV = 14.87%, Bi = 0.14, mean = 2.81 kg/plot; Table 4, and Supplementary Table S2) were selected as the most stable and producing high yield.
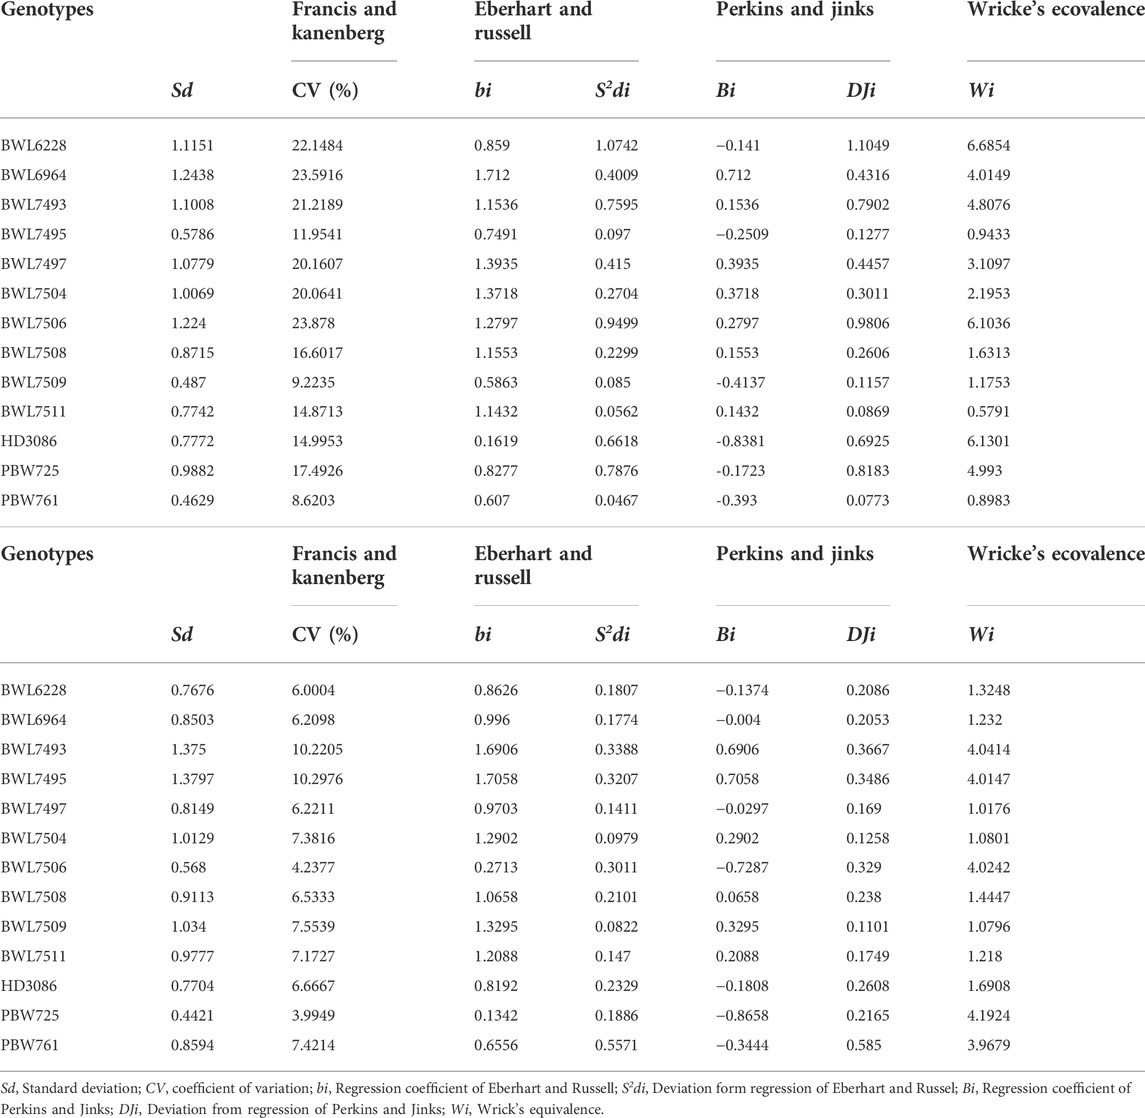
TABLE 4. Six univariate stability parameters and standard deviation for (A) yield and (B) GPC of 13 wheat genotypes across four locations (Ludhiana, Ballowal, Patiala, and Bathinda) of Punjab in two consecutive years 2019–20, and 2020–21. (A) Yield and (B) Grain protein content (GPC).
In the case of GPC, the (S2di) showed that BWL6228, BWL6964, PBW761, and PBW725 are the genotypes with high stability, and based on (bi) they are considered to have specific adaptation to low-yielding environments (bi = 0.862 for BWL6228, bi = 0.996 for BWL6964, bi = 0.65 for PBW761, and bi = 0.134 for PBW725), but BWL7511 is observed to be particularly adapted to high-yielding environments (bi = 1.2088). The genotypes BWL6228, BWL6964, BWL7497, BWL7506, PBW761, PBW725, and HD3086 are grouped as the high-GPC and stable genotypes and showed specific adaptability to unfavorable environments because they had regression value of less than 1 (bi < 1). On the other hand, BWL6964, BWL7504, BWL7508, and BWL7509 had GPC greater than the average mean, and therefore, they could be more desirable than other genotypes. They are considered as high-GPC genotypes based on their GPC mean. According to Perkins and Jinks’ regression model, the genotype BWL7495 showed a positive regression value, but the genotypes BWL6228, BWL6964, BWL7511, PBW761, and PBW725 showed negative regression values. Therefore, BWL7495 was recorded as a stable genotype because of its highest coefficient value (Bi = 0.705) and therefore, it was adapted particularly to favorable environments. The regression value near to 1 indicates that genotypes perform at a stable level across all the environments. The genotypes BWL7508 (bi = 1.06, CV = 6.53%, Bi = 0.06, mean = 13.94%), and BWL7511 (bi = 1.20, CV = 7.17, Bi = 0.20, mean = 13.63%) were identified as the most stable genotypes and had high GPC.
Additive main effects and multiplicative interaction based analysis of variance for yield, grain protein content and their related traits
The AMMI based ANOVA involving all the eight traits evaluated in the present study is given in Table 5. The results revealed that the DTF, PH, SPS, GPS, TGW, yield, GPC, and DTM are significantly influenced at a 0.001% level of significance by G, E, and GEI. The environment explained more than 50% of the total variation for all the traits except yield, GPC, and PH. For instance, the proportion of total variation contributed by G, E, and GEI for grain yield was 43.78, 4.4, and 51.83%, respectively. In the case of GPC, genotype, GEI, and E contribution explained 52.64, 17.84, and 29.52% of the total phenotypic variation, respectively. The genotype contributed less than 35% of the total observed variation for all the traits except GPC.
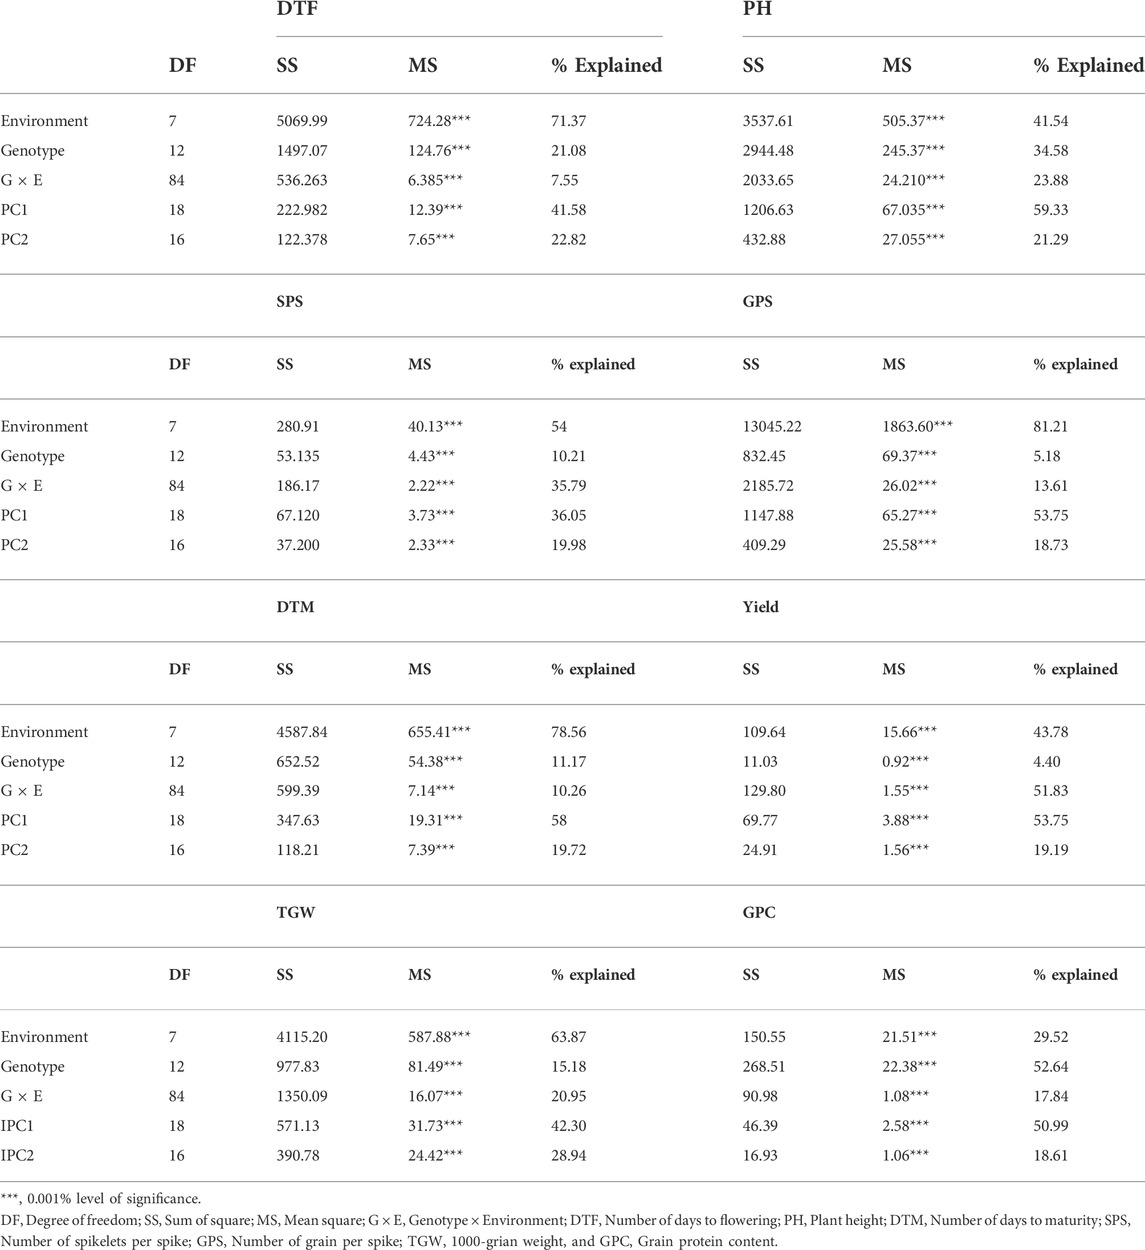
TABLE 5. AMMI-based ANOVA for yield, GPC and their related traits of 13 bread wheat genotypes across four locations (Ludhiana, Ballowal, Patiala, and Bathinda) of Punjab in two consecutive years 2019–20, and 2020–21.
Genotype × environment interaction based on additive main effects and multiplicative interaction model
It allowed us the opportunity to look at the biplot graph when it was chosen to apply AMMI-based analysis to examine both the adaptability and stability of genotypes. The predicted variation among and within the main effects of either G or E, as well as the multiplicative interaction of the GEI, are efficiently used to explain the biplot graphs. In a biplot graph, the main effects (mean performance of tested genotypes) are displayed by the abscissa, while the possible interaction among the axes (IPCA1 and IPCA2) is represented by the ordinate (Oliveira et al., 2014). Thus, the higher PCA1, the higher the proportion of GEI and, consequently, the lower stability of lines under study or vice versa. By keeping this in view, a high-yielding genotype with an IPCA1 score adjacent to the zero line is preferred. On the other hand, poor stability is related to low performance of the trait, hence this genotype is not preferred. Different responses of environment to genotypic stability for the tested genotypes were observed in the present study. Figure 2 represents the AMMI1 based analysis of 13 genotypes and 8 environments for yield, and GPC. Based on PCA1 value, the ENV4 is determined as the major player to the stability performance of genotypes in case of yield and GPC. On the other hand, BWL7495 and PBW761 for yield (Figure 2A), BWL7504 for GPC (Figure 2B) secured an IPCA1 value of close to zero suggesting minor environmental effect on these genotypes.
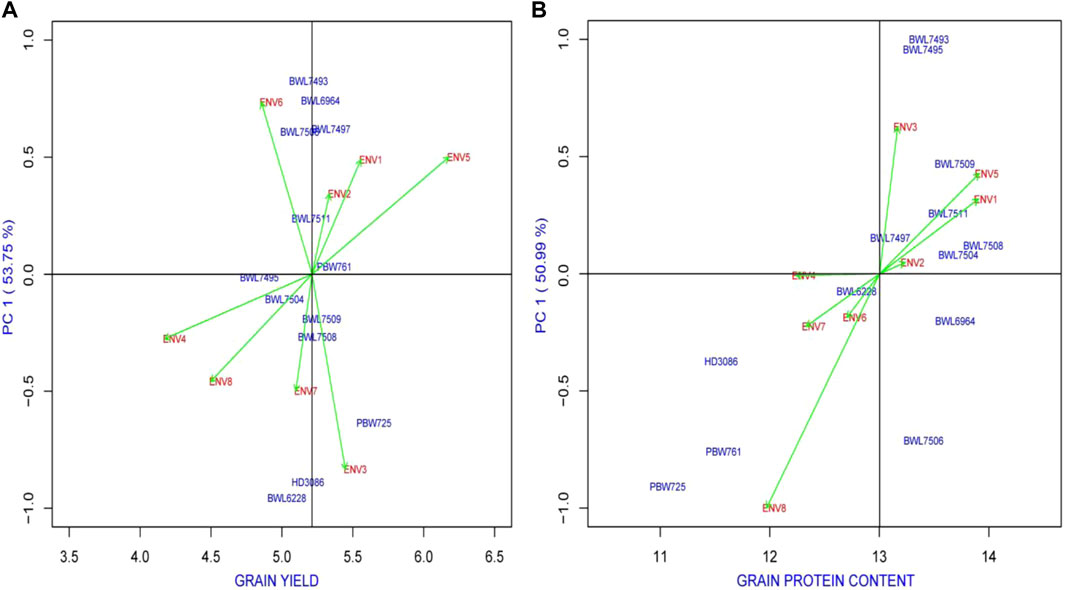
FIGURE 2. The “AMMI1” graphs displays the main effect and IPC1 effect values describing relationship among examined genotype and environment of 13 bread wheat genotypes across four locations (Ludhiana, Ballowal, Patiala, and Bathinda) of Punjab in two consecutive years (2019–20, and 2020–21) for (A) yield (kg/plot) and (B) GPC (%). (ENV1, and ENV5 = Ludhiana; ENV2, and ENV6 = Ballowal; ENV3, and ENV7 = Patiala; ENV4, and ENV8 = Bathinda).
For AMMI2, the biplot graph representing the environment and genotype stability performance of yield and GPC is provided in Figure 3. In case of AMMI2, the genotypes and environments with lower IPCA1 and IPCA2 value that are securing a closer position to the origin are considered as the most stable ones which explained lower interaction between environment and genotype. In the present study, the BWL7508, BWL7509, and BWL7511 for instance, considered as the most stable wheat genotypes in terms of yield (Figure 3A), based on the their positions near to the origin. In case of GPC, the BWL7497, BWL7504, and BWL7511 are suggested as the most stable ones (Figure 3B). On the other hand, ENV2 and ENV4 secured positions near to origin and considered the most stable environments for all the genotypes in terms of yield and GPC, respectively.
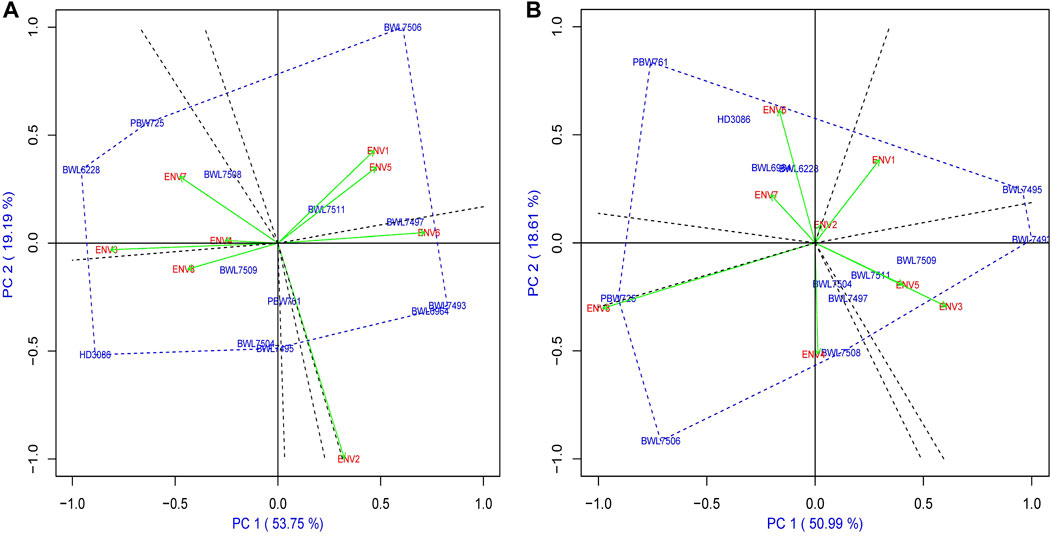
FIGURE 3. The “AMMI2” graphs displays both the axes of interaction (IPCA1 and IPCA2) values for genotype effect and genotype by environment interaction effect of 13 bread wheat genotypes across four locations (Ludhiana, Ballowal, Patiala, and Bathinda) of Punjab in two consecutive years (2019–20 and 2020–21) for (A) yield (kg/plot) and (B) GPC (%). (ENV1, and ENV5 = Ludhiana; ENV2, and ENV6 = Ballowal; ENV3, and ENV7 = Patiala; ENV4, and ENV8 = Bathinda).
GGE biplot based evaluation of genotype × environment interaction
The predominant control of the genotype and its interaction with the environment is considered the fundamental origin of variations whenever, evaluating the genotypes across the multi-location trials. The three important indicators which could be determined by biplot are considered to be capable of defining the GEI are as follows: 1) the “which-won-where” graph, which is an efficient pattern to display the principle of GEI; 2) the stability vs. genotype mean performance across different environments tested in the study; and 3) the representativeness and discriminating abilities of the tested environments.
“Which-won-where” approach
The polygon-view of a GGE biplot analysis illustrates the which-won-where structure of a multi-environment experiment, which is consequently the most efficient and simplest manner of characterizing the genotype and its further interaction with the environment. Figures 4A,B describe the which-won-where structure of biplot analysis for yield and GPC of 13 wheat genotypes distributed over all the 6 sectors/sections, while the 8 tested environments are distributed over 4 sectors for yield and 3 sectors for GPC. In terms of yield, sector 1 consists of ENV1 and ENV5 along with wheat genotypes BWL7497, BWL7506, and BWL7511; sector 2 contains ENV2 and ENV6 with BWL6964 and BWL7493; sector 5 carries ENV4 and ENV7 with BWL7508 and PBW726; and sector 6 consists of ENV3 and ENV8 with BWL6228 (Figure 4A). The genotypes are more suitable and confer a high level of performance and stability in the environment within the same sector. The elite variety PBW725 is observed to be the most away from the biplot origin and also the polygon vertex line, indicating that PBW725 confers a high level of adaptability and yield performance specific to ENV4 and ENV7, but shows poor stability across all other tested environments. In case of GPC, sector 2 carries ENV1 with BWL7509, sector 3 contains ENV2, ENV3, ENV4, ENV5, ENV6, and ENV7 along with wheat genotype BWL7511, and sector 4 carries ENV8 with BWL6964, BWL7504, BWL7506, and, BWL7508 confirming that these genotypes are more suitable and confer a high level of performance and stability in the environment within the same sector, but less stable and poor performance across environments in different sectors. In case of GPC, the genotype BWL7506 showed the longest distance from the biplot center and the polygon vertex line which indicates that BWL7506 confers high stability and has good performance as well as good adaptation specifically to ENV8, but poor adaptation to other environments (Figure 4B). Furthermore, the genotype with close contact to the vertex line of the polygon in a section where the environments are also observed in that section showed that the observed genotype conferred higher performance and adaptation in that particular environment. In case of GPC, for instance, the genotype BWL7497 was in close contact with vertex line, therefore, had high-GPC performance and adaptability specifically to ENV1. A genotype connected to a polygon vertex line where no environment is observed indicates that the genotype is providing lower yield or performance over all the environments. Even more, the genotypes inside the polygon are less affected by the environment than the genotypes at the corners are.
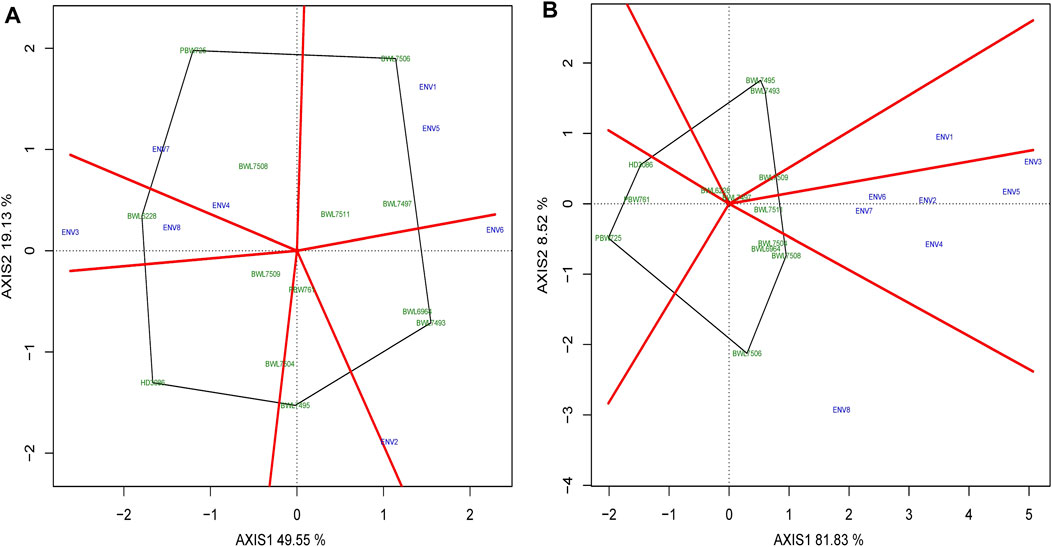
FIGURE 4. The polygon view of “Which-won-where” model of GGE biplot representing the performance of 13 bread wheat genotypes and their interactions with environment across four locations (Ludhiana, Ballowal, Patiala, and Bathinda) of Punjab in two consecutive years (2019–20, and 2020–21) based on (A) yield (kg/plot and (B) GPC (%). (ENV1, and ENV5 = Ludhiana; ENV2, and ENV6 = Ballowal; ENV3, and ENV7 = Patiala; ENV4, and ENV8 = Bathinda).
Means versus stability model of GGE biplot and evaluation of wheat genotypes
After the which–won–where model of GGE biplot recommended the dominating wheat genotypes under certain environments, it became essential to evaluate the average stability and performance of all wheat NILs before making a selection choice. The performance and stability of the genotypes are graphically represented by the GGE biplot using average environmental coordinates (AEC). If single value portioning (SVP) is equal to 1, the AEC line crosses through the origin of the biplot. This biplot graph is made up of two lines which are perpendicular to each other: 1) the AEC abscissa and 2) the AEC ordinate. The arrowhead in Figures 5A,B represents the AEC, which is the average of the first and second PCA values of the evaluated environments. The AEC abscissa is the line crossing through the origin and arrowhead, pointing to higher mean performance of certain traits, and its length indicates the magnitude of the genotype’s performance for a particular trait, which is either above or below the average performance of the genotype with respect to the right or left side of the origin point, respectively. The ordinate is the line perpendicular to the abscissa at the origin point, and its length determines the GE interaction associated with the genotype, where a longer ordinate is associated with greater variability and poor stability.
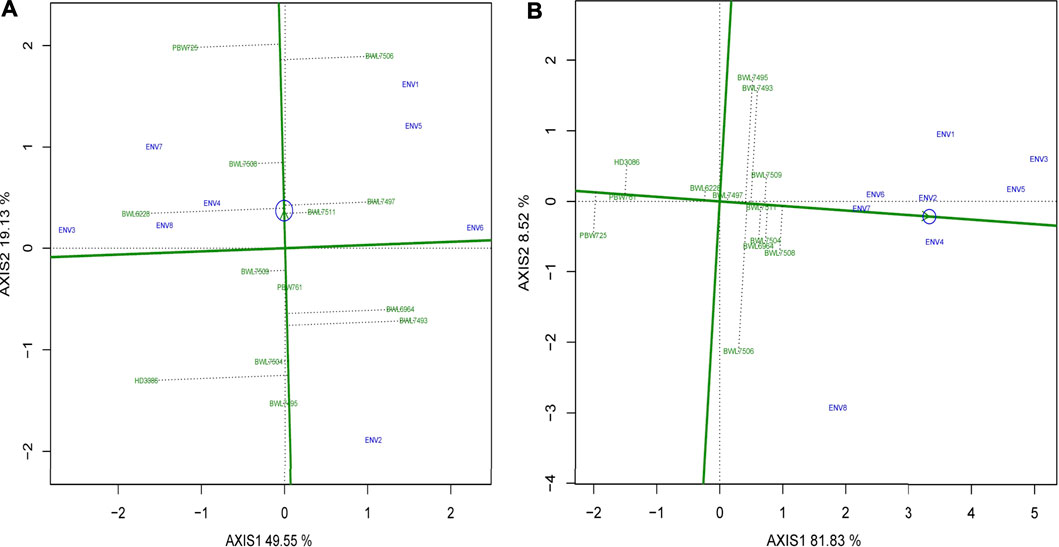
FIGURE 5. The “mean versus stability” model describing the interaction effect of 13 bread wheat genotypes evaluated across four locations (Ludhiana, Ballowal, Patiala, and Bathinda) of Punjab in two consecutive years (2019–20, and 2020–21) for (A) yield (kg/plot) and (B) GPC (%). (ENV1, and ENV5 = Ludhiana; ENV2, and ENV6 = Ballowal; ENV3, and ENV7 = Patiala; ENV4, and ENV8 = Bathinda).
Figure 5A indicates that the wheat genotypes BWL7497, BWL7508, and BWL7511 have above-average yield and greater stability, while BWL6228, BWL7506, and PBW725 also have above-average yield, but show poor stability. On the other hand, genotypes BWL7495, BWL7504, BWL7509, and BPW761 are stable but show yield below the average and BWL6964, BWL7493 and HD3086 have yield below-average and show less stability. The Figure 5B shows that the.
BWL6964, BWL7497, BWL7504, BWL7506, BWL7508, BWL7509, and BWL7511 have above-average GPC and higher stability whereas BWL7493, and BWL7495 also have above-average GPC, but show less stability. Furthermore, the BWL6228, PBW761, PBW725, and HD3086 have GPC below-average and show more stability. Based on mean versus stability model, ideal genotypes line on the arrowhead, conferring the best performance and maximum stability while the distance between arrowhead and other genotypes determines their specific trait potential. Figures 5A,B indicate that BWL7508, and BWL7511 are the most desirable genotypes for yield and GPC, respectively, which are greatly close to the arrowhead, followed by BWL7497 for yield and BWL7504 for GPC.
Ranking the ideal wheat genotypes
The arrowhead contains the best performing genotypes, but it is not always possible to be the ideal one. Two coordinate axes are sketched to rank the genotypes (Figures 6A,B): a straight line connecting the arrowhead with the origin of the graph (first axis) and a line exactly perpendicular to the first axis at the origin (second axis). The genotypes may then be ranked based on involvement in the circles and position located away from the arrowhead in the ordinate by viewing circles anywhere along the arrowhead. Using the ranking graph of biplot, the best and ideal genotype could be detected. The PBW725 variety is close to the arrowhead, which is considered the ideal genotype for grain yield (Figure 6A), followed by BWL7506 and so on. In the case of GPC (Figure 6B), BWL7511 is noted as the best genotype due to its closeness to the arrowhead, followed by BWL7509 and BWL7504. If we rank all the genotypes for yield based on biplot ranking decisions, it would be as follows: PBW725 > BWL7506 > BWL7508 > BWL7511 > BWL7497 > BWL6228 > BWL7509 > PBW761 > BWL6964 > BWL7493 > BWL7504 > HD3086 > BWL7495 (Table 6). Furthermore, the ranking of genotypes for yield and GPC based on biplot decision is consistent with the average performance of the genotypes for these two and other concerning traits over all the 8 environments (Supplementary Table S2).
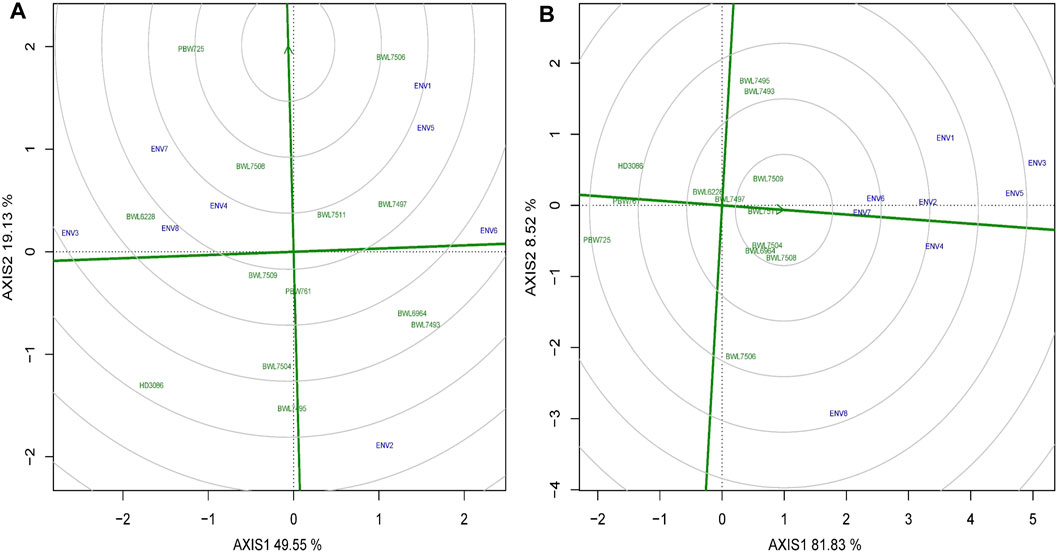
FIGURE 6. The “ranking genotypes” model of biplot assess other genotypes against the ideal genotype conferring genotype interaction and GEI for 13 bread wheat genotypes evaluated across four locations (Ludhiana, Ballowal, Patiala, and Bathinda) of Punjab in two consecutive years (2019–20, and 2020–21) for (A) yield (kg/plot), and (B) GPC (%). (ENV1, and ENV5 = Ludhiana; ENV2, and ENV6 = Ballowal; ENV3, and ENV7 = Patiala; ENV4, and ENV8 = Bathinda).
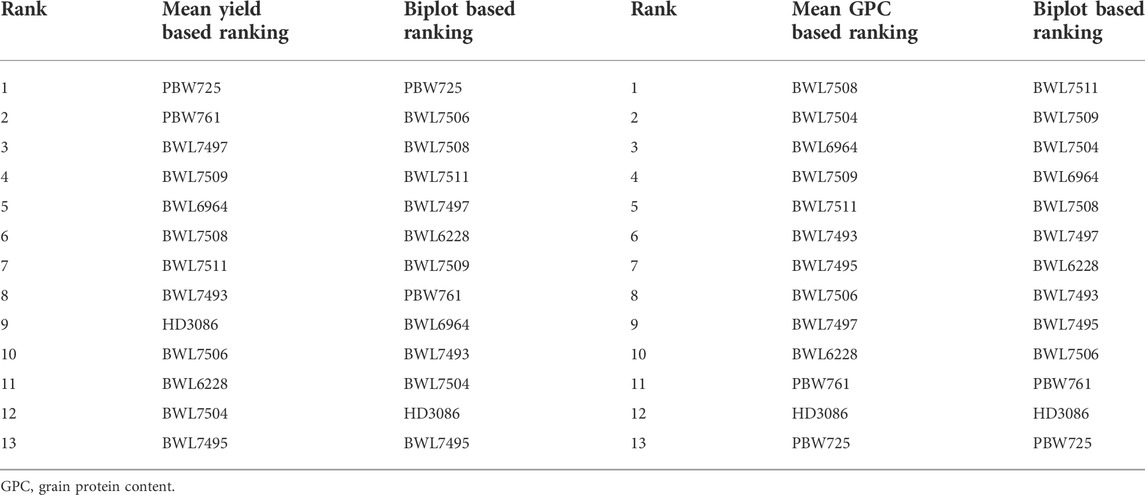
TABLE 6. Ranking of 13 bread wheat genotypes based on yield and GPC mean and biplot decision.
Discriminativeness vs. representativeness of the environments
Identifying the ideal environment for testing of genotypes is more challenging for a successful breeding project aimed to select the best genotypes. Discriminativeness (an environment’s capacity to discriminate among the genotypes) and representativeness (an environment’s potential to represent all other environments evaluated) are two characteristics that indicate how perfect the tested environments are. The Figures 7A,B describes the “descriminitiveness vs. representativeness” model of biplot. The GGE biplot tests discriminativeness using the environmental vectors; the longer the environment vector, the larger the standard deviation within the environment, suggesting more discriminative ability. The selection of better genotypes is ideal in an environment with a long vector that makes a narrower angle with the AEC abscissa line. Consequently as illustrated in Figures 7A,B, ENV1 for yield and ENV3 for GPC have relatively longer vectors and narrower angles with AEC abscissa lines indicating that these environments have a better discriminating and representing capacities for yield and GPC. However, the average of grain yield and GPC were higher in ENV1 and ENV5 as compared to other environments (Supplementary Tables S3, S4). The cosine of the angle between the AEC line, and the environment vector is almost equal to the correlation coefficient between the mean performance of genotype over the environment and the genotype values in that environment. The narrower the angle between the AEC line and the environment vector (used to test the genotype), the better the environment in comparison to those that confer larger angles. The direction of the AEC abscissa line is shown by an arrow, whereas the environment mean is indicated by a tiny circle, and the length of the test environment vector reflects the discriminating accuracy level. The length of each environment vector indicates how good (discriminating capacity) it is for distinguishing genotypes in the environment.
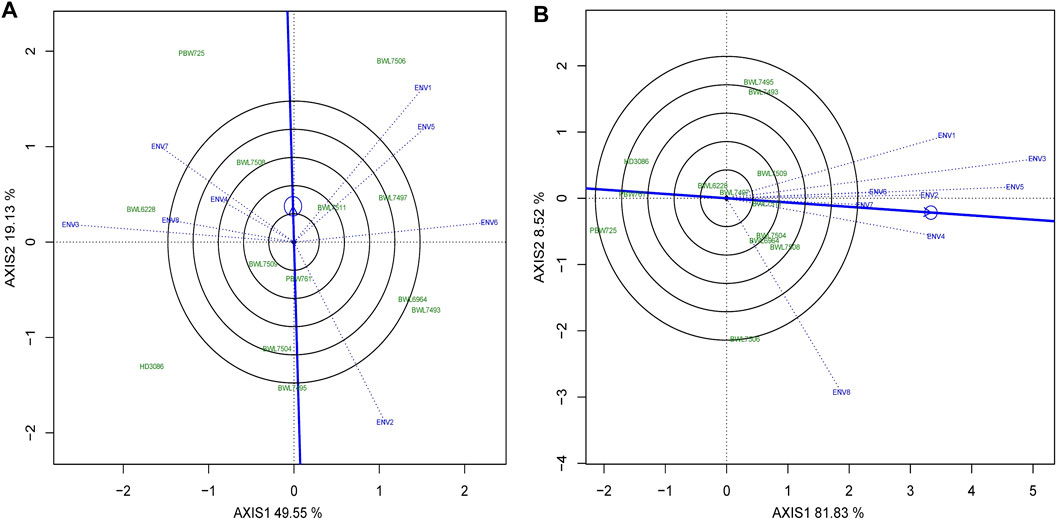
FIGURE 7. The “Discrimitiveness vs. Representativeness” model of biplot evaluate the genotypes anianst the ideal genotypes conferring genotype interaction and GEI for 13 bread wheat genotypes across four locations (Ludhiana, Ballowal, Patiala, and Bathinda) of Punjab in two consecutive years (2019–20, and 2020–21) for (A) yield (kg/plot) and (B) GPC (%). (ENV1, and ENV5 = Ludhiana; ENV2, and ENV6 = Ballowal; ENV3, and ENV7 = Patiala; ENV4, and ENV8 = Bathinda).
Discussion
India is considered one of the major countries in terms of wheat production and consumption in the world. In the present study, the AMMI and pooled-based analysis of variance showed a high and significant amount of variation among 13 wheat genotypes based on eight different traits. The high level of genetic variation, which is significantly observed in the present as well as in previously published studies, using near-isogenic lines confirmed the availability of a golden opportunity to employ the near-isogenic population for wheat improvement programmes with a special focus on GPC and yield (Bányai et al., 2017; Kokhmetova et al., 2017). In this study, we particularly focused on yield and GPC for the following reasons: 1) wheat grain yield is very important since it is a stable source of food for the world’s population 2) GPC is an important determinant of food quality 3) combining higher grain yield and higher GPC in an individual wheat variety is considered as an important determinant of food and nutritional security in the world.
The yield had a strong positive correlation with 1000-grian weight (0.66). This finding is consistent with results previously reported in wheat (Mecha et al., 2017; Baye et al., 2020). The positive association of yield with 1000-grian weight suggests that it could be possible to effectively select for both the traits concurrently. Yield also showed a positive correlation with SPS (0.33), DTF (0.45), PH (0.13), and DTM (0.57). Ojha et al. (2018) reported a positive correlation between yield and plant height. A similar positive correlation between yield and spikelet per spike and the number of days to maturity was reported by Dutamo et al. (2015). Similarly, the positive correlation between yield and the number of DTF was previously reported in wheat (Gelalcha and Hanchinal, 2013). On the other hand, the significantly negative correlation between yield and GPC is in agreement with the results previously reported by some other studies (Brevis and Dubcovsky, 2010; Blanco et al., 2012). This is mostly due to a shorter grain filling period and early senescence which comes as a linked trait when introgressing Gpc-B1 gene.
In comparison to the effects of environment (29.52%) and GEI (17.84%), the effect of genotype (52.64%) highly contributed to the total variation in GPC. As a result, the genotypic component of variation explained a significant portion of the total variation for the GPC, implying that genotypes differed more than environments. However, for the remaining traits except yield, the contribution of environmental effects was higher than the effect of both the genotype and GEI to the total variances for DTF (71.37%), PH (41.54%), SPS (54%), GPS (81.21%), DTM (78.56%), and TGW (63.87%). The effect of GEI (51.83%) was higher than the effect of both the environment (43.78%) and genotype (4.4%) for yield. The greater contribution of GEI and environment to the total variation in grain yield was also observed in several earlier studies in wheat (e.g., Amare et al., 2015; Verma et al., 2015; Singh et al., 2019) and in some other crops (e.g., Rakshit et al., 2012; Mukuze et al., 2020). The highly significant contribution of the GEI effect to the total differences in yield indicates that the response of various wheat genotypes to variation in environmental factors was entirely different, implying that selection of environment-specific genotypes is required. Furthermore, the greater contribution of GEI to variation in yield over genotype suggests that there may be some different mega-environments available across the examined environments (Enyew et al., 2021). On the other hand, much larger environmental effect shows that a MET needs to be done to find stable, and high-yielding genotypes that are more adaptable and can be used in specific agro-climatic conditions.
Previously, Finlay and Wilkinson (1963) used a number of stability metrics, such as linear regression analysis, as a stability indicator. In GEI, Eberhart and Russell (1966) underlined the significance of incorporating both linear and nonlinear variables when determining the stability of a genotype. Based on this approach, the term “stable genotype” refers to a genotype that behaves uniformly under all studied conditions/environments. Consequently, the stable genotype has a high mean performance (bi = 1.0) and the lowest deviations from regression (S2di = 0). The regression value explains the adaptability of the evaluated genotypes across the assessed environments. The desirable stability required for a genotype is considered as a regression value approaching 1, and a higher mean performance is superior. A genotype having a lower mean performance, a regression value of less than one, and non-significant S2di does not adapt effectively to favorable environments, and therefore might be marked as a genotype with adaptability to low-yielding environments (Shrestha et al., 2021). On the other hand, genotypes having a higher mean performance, a regression value greater than one, and a non-significant S2di are considered as low-stable genotype. These groups of genotypes effectively perform across high-yielding conditions but not so well in low-yielding environments. Consequently, they are able to effectively adapt across different conditions (Shrestha et al., 2021). In the case of yield, the genotypes BWL6964, BWL7493, BWL7497, BWL7504, BWL7506, and BWL7511 possess regression values greater than 1, which indicates that they are suited to high-yielding environments, while the genotypes BWL6228, BWL7495, BWL7509, PBW761, PBW725, and HD3086 possess regression values less than 1, which implies that they are suited to low-yielding environments (Table 4). Similar results were also obtained by (Tanin and Gupta, 2018) in Indian mustard and by Shrestha et al. (2021) in maize. For GPC, the genotypes BWL 7493, BWL7495, BWL7504, BWL7508, BWL7509, and BWL7511 had regression values greater than 1, which implied that they adapted to favorable environments, while the genotypes BWL6228, BWL6964, BWL7497, BWL7508, PBW761, PBW725, and HD3086 had regression values less than 1, which confirmed that they are more desirable for unfavorable environments (Table 4).
In this case, the observed variation related to genotype and GEI facilitated the selection process of the ideal genotypes for desired characters, and in such cases, reducing the possible influence of environmental component effects is important (Singh et al., 2019). In this case, the AMMI2 model was considered the most effective analysis pattern to explain the genotypic stability of yield, genomic based variance available among the genotypes, and further provide interesting knowledge regarding the GEI (Oliveira et al., 2014). In addition, if the environments possess smaller IPCA1 and IPCA2 values (near to the origin of biplot), they provide a larger contribution to genotypic stability but contribute a smaller proportion to the GEI (Hilmarsson and Rio, 2021). As a result, ENV2 and ENV4 were the major players in the genotypic stability of grain yield and GPC, respectively. In the AMMI2 biplot, genotypes with the longest distance from the centre of the biplot located near to an evaluated environment are recorded as high-yielding genotypes with great adaptability in such a tested environment (Enyew et al., 2021). In the case of grain yield, the genotypes BWL7495 and BWL7504 were located close to ENV2 in the present study, implying their strong yield potential and greater adaptability specific to this environment as compared to other environments. Similarly, the genotypes BWL6964, BWL7493, and BWL7497 had better performance in ENV6. For GPC, the genotypes BWL7506, and PBW725 were placed close to ENV8, indicating their high GPC potential and better adaptability specific to this environment over other environments. Also, the genotype BWL7493 was observed to have greater GPC performance in ENV3. Whenever different genotypes respond differently to different environments, it strongly suggests the presence of GEI and the existence of variation among environmental components such as soil fertility, precipitation, and temperature. As a result, the selection of wheat genotypes specific to each environment across various agro-climatic conditions is suggested. Environment-specific genotypes with high-yielding and high-GPC potential have already been reported in wheat (Groos et al., 2003; Singh et al., 2019) and other cereal crops (Bantayehu et al., 2011; Solonechnyi et al., 2018).
The “which-won-where” model of GGE biplot was applied to select the top-performing genotypes by explaining the GEI, mega-environment clustering, and environment or genotype specific adaptation (Bishwas et al., 2021; Khan et al., 2021). The genotypes with the longest distance from the origin of biplot are considered the best across all or some of the evaluated environments, and were classified as environment-specific genotypes, because they showed more variation in regards to change in environmental components (Singh et al., 2020). The “which-won-where” model of biplot grouped all the evaluated environments into three and two mega-environments involving different genotypes with high-potential for grain yield and GPC, respectively. In terms of yield, mega-environments 1 contained ENV1, and ENV5 where BWL7506 was considered the best high-yielding genotype, mega-environments 2 contained ENV2, and ENV6 where BWL7493 was recorded as the top yielding genotype, mega-environments 3 contained ENV3, and ENV8, where BWL6228 was observed as the most high-yielding genotype, and mega-environments 4 contained ENV4, and ENV7 where PBW725 was considered the high-performing genotype. On the other hand, for GPC, mega-environment 1 contained only ENV1 where BWL 7509 was observed as the high-GPC genotype, while mega-environment 2 involved ENV2, ENV3, ENV4, ENV5, ENV6, and ENV7 where BWL7511 were recorded as the top-performers, and mega-environment 3 involved only ENV8 where BWL7506 and BWL7508 were observed as top-GPC genotypes. The examined environments were grouped into mega-environments and further identification of mega-environment specific genotypes is the sustainable method to use GEI according to the interests of breeders (Yan and Tinker, 2005). Investigation of mega-environments has been previously reported in different cereals, including wheat (Gerrish et al., 2019), rice (Krishnamurthy et al., 2017), maize (Pererira et al., 2021), and barley (Hernandez-Segundo et al., 2009).
The ranking model of GGE biplot is capable of identifying the high-ranking genotypes with great stability based on AEC decisions (Singh et al., 2020). The AEC based ranking model of biplot recorded the genotypes BWL7497, BWL7506, BWL7508, BWL7511, and PBW725 as the high-ranking for yield, and the genotypes BWL6964, BWL7504, and BWL7508, BWL7509, and BWL7511 as the high-ranking for GPC. However, in the case of yield, the BWL6228, BWL7497, BWL7509, and BWL7511 were recorded as poorly stable genotypes because of the effect of GEI components. Also, for GPC, BWL6228, BWL6964, BWL7497, and BWL7508 were observed as the genotypes with lower stability, which is associated with a GEI effect. Previously published studies on wheat also reported that top-performing genotypes are not always the stable ones (Bassi and Sanchez-Garcia, 2017; Popevic et al., 2020). One of the most useful features of the GGE biplot is the graphical representation of genotypes with the best mean performance and stability. Based on the mean vs. stability model of GGE biplot, the genotypes with the highest AEC prediction (top mean) combined with the shortest stability vector (greatest stability) are considered the best genotypes (Farshadfar et al., 2012; Khan et al., 2021). Accordingly, BWL7508, and BWL7511 were selected as high-performers and highly stable genotypes for yield and GPC. Based on all this, it is concluded that the GGE biplot is the best analysis method as compared with AMMI model for the identification and selection of top genotypes with the most efficient stabilities and the highest performing capabilities. This method has already been used in many studies to identify the top-performing and well-stable genotypes in wheat (Bishwas et al., 2021) and some other cereals, including rice (Mostafavi et al., 2011), maize (Ruswandi et al., 2021) and barley (Ghazvini et al., 2021).
GGE biplot analysis identified the genotypes BWL7497, BWL7506, BWL7508, BWL7511, and PBW725 as the high-yielding and, similarly, BWL6964, BWL7504, BWL7509, and BWL7508, BWL7511 as the top performing genotypes for GPC across all environments. Among all the genotypes, BWL7508, and BWL7511 were selected as ideal genotypes for their great stability, top mean yield, and GPC across all the environments. It is true that these two traits are negatively correlated, but if we deal with a large number of segregants during development of the material, a few lines can be identified combining both GPC and yield. Balancing yield and quality together in a wheat cultivar is a tedious task and can be achieved through some inter-trait trade-offs. The reduction in yield is primarily mediated through a reduction in 1000-grain weight in the Gpc-B1 positive lines. But in such cases, the number of effective tillers and grins per spike is adjusted to compensate for the yield. A similar result is observed in some previously conducted studies in the wheat germaplasm with Indian origin (Vishwakarma et al., 2014, 2016; Gupta et al., 2022). The present study remarkably identified that the acceptable level of stability and top-performing potential in one genotype for a character are not the same in other characters. This could be due to the role of different genes in the regulation of the different characters or may be because of variation in expression patterns of genes in different genotypes as a direct effect of different environmental factors, such as different abiotic stresses. Several earlier studies have reported similar results in wheat (Du et al., 2020), soybean (Chaves et al., 2017) and rice (Balakrshnan et al., 2016).
In this study, it was found that different univariate, AMMI, and GGE biplot analyses showed somewhat consistent results in terms of the stability potential of the genotypes. The high ranking genotypes were somewhat different, but we selected the genotypes based on their stable performance for both the yield and GPC, and similar results were obtained across all the univariate and multivariate analyses. The AMMI and GGE biplot showed different results in terms of the discriminating potential of environments. As a result, the environments in the AMMI model were closer to the origin than in the GGE biplot. Keeping the discriminating potential of the AMMI model in view, the GGE biplot model is also successfully employed to examine the multi-location data for stability analysis of wheat and rice genotypes (Khan et al., 2021). In the present study, the GGE biplot model observed the genotype and GEI more efficiently as compared to the AMMI model. The same result was recently reported by Khan et al. (2021). Furthermore, in this study, the biplot graph was extremely successful in mega environment classification, identification of representative and discriminative environments, and genotype ranking. A similar result was observed by Oladosu et al. (2017), where the stability performance of rice genotypes was analyzed. The GGE biplot is considered an extremely valuable statistical technique to deeply understand the GEI in a multi-environmental test. However, the decisions for genotypic stability were similar in both the univariate and multivariate analyses. These results are consistent with the results reported in some previously published studies (e.g., Singh et al., 2019; Bishwas et al., 2021). This type of dissimilarity is not avoidable due to different statistical analysis models that were employed in the present study.
Conclusion
In the present study, a multi-environmental investigation was conducted to evaluate 13 wheat genotypes across different environments to select ideal genotypes. We provided detailed information on the effect of GEI, the stability and adaptability of genotypes to specific environments, and the ability of environments to distinguish between DTF, DTM, PH, SPS, GPS, yield, TGW, and GPC in Punjab State, India. Of these traits, we focused on grain yield and GPC because of their importance to food and nutritional security in the world. These two traits were significantly influenced by environmental, genotype, and GEI effects. Based on the results of this study, it is clearly observed that the wheat near-isogenic lines are the best breeding materials that carry potential variation to improve yield and GPC in wheat. The GGE biplot and AMMI were reported to be the best models to show the effects of GEI in a graph and select the best genotypes with the most adaptability and the best performance. Among the genotypes, BWL7508, and BWL7511 were observed to be highly stable and well performed in terms of yield and GPC across all the environments. In the case of yield, ENV1 and ENV3 were identified as the most representative and discriminating environments for yield, respectively. On the other hand, for GPC, ENV3 and ENV7 were observed to be the most discriminating and representative environments, respectively. Thus, these environments could be further used for the identification of the best genotypes and the selection of high-performing genotypes with environment specific adaptability.
Data availability statement
The original contributions presented in the study are included in the article/Supplementary Material, further inquiries can be directed to the corresponding authors.
Author contributions
AS, VSS, PS, GSM, and SK conceptualized the study. MJT, VyK, VtK, and GG performed the phenotyping and collected the data. MJT, LK, and SS analyzed the data. MJT, DKS, and AS wrote the original draft. PC provided technical support during this research. All the authors contributed to the article and read the manuscript.
Acknowledgments
MJT is thankful to USAID-sponsored Grain Research and Innovation (GRAIN) project for providing GRAIN graduate degree scholarship to MJT for his PhD programme.
Conflict of interest
The authors declare that the research was conducted in the absence of any commercial or financial relationships that could be construed as a potential conflict of interest.
Publisher’s note
All claims expressed in this article are solely those of the authors and do not necessarily represent those of their affiliated organizations, or those of the publisher, the editors and the reviewers. Any product that may be evaluated in this article, or claim that may be made by its manufacturer, is not guaranteed or endorsed by the publisher.
Supplementary material
The Supplementary Material for this article can be found online at: https://www.frontiersin.org/articles/10.3389/fgene.2022.1001904/full#supplementary-material
References
Ahakpaz, F., Abdi, H., Neyestani, E., Hesami, A., Mohammadi, B., Mahmoudi, K. N., et al. (2021). Genotype-by-environment interaction analysis for grain yield of barley genotypes under dryland conditions and the role of monthly rainfall. Agric. Water Manag. 245, 1–9. doi:10.1016/j.agwat.2020.106665
Ahmed, Z. U., Panaullah, G. M., Gauch, H., McCouch, S. R., Tyagi, W., Kabir, M. S., et al. (2011). Genotype and environment effects on rice (Oryza sativa L.) grain arsenic concentration in Bangladesh. Plant Soil 338, 367–382. doi:10.1007/s11104-010-0551-7
Amare, K., Zeleke, H., and Bultosa, G. (2015). Variability for yield, yield related traits and association among traits of sorghum (Sorghum Bicolor (L.) Moench) varieties in Wollo, Ethiopia. J. Plant Breed. Crop Sci. 7, 125–133. doi:10.5897/JPBCS2014.0469
Balakrishnan, D., Subrahmanyam, D., Badri, J., Raju, A. K., Rao, Y. V., Beerelli, K., et al. (2016). Genotype × environment interactions of yield traits in backcross introgression lines derived from Oryza sativa cv. Swarna/Oryza nivara. Front. Plant Sci. 7, 1–19. doi:10.3389/fpls.2016.01530
Bantayehu, M., Zelleke, H., and Assefa, A. (2011). Genotype by environment interactions (G x E) and stability analyses of malting Barley (Hordeum distichon L.) genotypes across northwestern Ethiopia. Ethiop. J. Agric. Sci. 21 (1-2), 168–178.
Bányai, J., Maccaferri, M., Cané, M. A., Monostori, I., Spitkó, T., Kuti, C., et al. (2017). Phenotypical and physiological study of near-isogenic durum wheat lines under contrasting water regimes. South Afr. J. Bot. 108, 248–255. doi:10.1016/j.sajb.2016.11.001
Bassi, F. M., and Sanchez‐Garcia, M. (2017). Adaptation and stability analysis of ICARDA durum wheat elites across 18 countries. Crop Sci. 57 (5), 2419–2430. doi:10.2135/cropsci2016.11.0916
Baye, A., Berihun, B., Bantayehu, M., and Derebe, B. (2020). Genotypic and phenotypic correlation and path coefficient analysis for yield and yield-related traits in advanced bread wheat (Triticum aestivum L.) lines. Cogent Food & Agric. 6 (1), 1–17. doi:10.1080/23311932.2020.1752603
Bishnoi, O. P. (2020). GGE biplot based stability analysis of durum wheat genotypes using statistical package GGEBiplotGUI. Int. J. Agric. Environ. Biotechnol. 13 (2), 149–153. doi:10.30954/0974-1712.02.2020.5
Bishwas, K. C., Poudel, M. R., and Regmi, D. (2021). AMMI and GGE biplot analysis of yield of different elite wheat line under terminal heat stress and irrigated environments. Heliyon 7 (6), e07206–10. doi:10.1016/j.heliyon.2021.e07206
Blanco, A., Mangini, G., Giancaspro, A., Giove, S., Colasuonno, P., Simeone, R., et al. (2012). Relationships between grain protein content and grain yield components through quantitative trait locus analyses in a recombinant inbred line population derived from two elite durum wheat cultivars. Mol. Breed. 30 (1), 79–92. doi:10.1007/s11032-011-9600-z
Brevis, J., and Dubcovsky, J. (2010). Effects of the chromosome region including the Gpc-B1 locus on wheat grain and protein yield. Crop Sci. 50 (1), 93–104. doi:10.2135/cropsci2009.02.0057
Changizi, M., Choukan, R., Heravan, E. M., Bihamta, M. R., and Darvish, F. (2014). Evaluation of genotype × environment interaction and stability of corn hybrids and relationship among univariate parametric methods. Can. J. Plant Sci. 94 (7), 1255–1267. doi:10.4141/cjps2013-386
Chaves, M. V. A., Silva, N. S., Silva, R. H. O., Jorge, G. L., Silveira, I. C., Medeiros, L. A., et al. (2017). Research Article Genotype x environment interaction and stability of soybean cultivars for vegetative-stage characters. Genet. Mol. Res. 16 (3), 1–10. doi:10.4238/gmr16039795
Du, Y. L., Xi, Y., Cui, T., Anten, N. P., Weiner, J., Li, X., et al. (2020). Yield components, reproductive allometry and the tradeoff between grain yield and yield stability in dryland spring wheat. Field Crops Res. 257, 1–10. doi:10.1016/j.fcr.2020.107930
Dutamo, D., Alamerew, S., Eticha, F., and Assefa, E. (2015). Path coefficient and correlation studies of yield and yield associated traits in bread wheat (Triticum aestivum L.) germplasm. World Appl. Sci. J. 33 (11), 1732–1739. doi:10.5829/idosi.wasj.2015.33.11.15617
Eberhart, S. A., and Russell, W. A. (1966). Stability parameters for comparing varieties 1. Crop Sci. 6, 36–40. doi:10.2135/cropsci1966.0011183X000600010011x
Enyew, M., Feyissa, T., Geleta, M., Tesfaye, K., Hammenhag, C., and Carlsson, A. S. (2021). Genotype by environment interaction, correlation, AMMI, GGE biplot and cluster analysis for grain yield and other agronomic traits in sorghum (Sorghum bicolor L. Moench). Plos one 16 (10), e0258211–22. doi:10.1371/journal.pone.0258211
Farshadfar, E., Mohammadi, R., Aghaee, M., and Vaisi, Z. (2012). GGE biplot analysis of genotype x environment interaction in wheat-barley disomic addition lines. Aust. J. Crop Sci. 6 (6), 1074–1079.
Finlay, K. W., and Wilkinson, G. N. (1963). The analysis of adaptation in a plant breeding programme. Aust. J. Agric. Res. 14, 742–754. doi:10.1071/AR9630742
Francis, T. R., and Kannenberg, L. W. (1978). Yield stability studies in short-season maize: I. A descriptive method for grouping genotypes. Can. J. Plant Sci. 58, 1029–1034. doi:10.4141/cjps78-157
Gauch, H. G. (2013). A simple protocol for AMMI analysis of yield trials. Crop Sci. 53, 1860–1869. doi:10.2135/cropsci2013.04.0241
Gauch, H. G., Piepho, H. P., and Annicchiarico, P. (2008). Statistical analysis of yield trials by AMMI and GGE: Further considerations. Crop Sci. 48, 866–889. doi:10.2135/cropsci2007.09.0513
Gauch, H. G., and Zobel, R. W. (1997). Identifying mega-environments and targeting genotypes. Crop Sci. 37, 311–326. doi:10.2135/cropsci1997.0011183X003700020002x
Gelalcha, S., and Hanchinal, R. R. (2013). Correlation and path analysis in yield and yield components in spring bread wheat (Triticum aestivum L.) genotypes under irrigated condition in Southern India. Afr. J. Agric. Res. 8 (24), 3186–3192. doi:10.5897/AJAR2013.6965
Gerrish, B. J., Ibrahim, A. M., Rudd, J. C., Neely, C., and Subramanian, N. K. (2019). Identifying mega-environments for hard red winter wheat (Triticum aestivum L.) production in Texas. Euphytica 215 (7), 1–9. doi:10.1007/s10681-019-2448-8
Ghazvini, H., Bagherikia, S., Pour-Aboughadareh, A., Sharifalhossaini, M., Razavi, S. A., Mohammadi, S., et al. (2021). GGE biplot analysis of promising barley lines in the cold regions of Iran. J. Crop Improv. 36, 461–472. doi:10.1080/15427528.2021.1977448
Gill, H. S., Halder, J., Zhang, J., Brar, N. K., Rai, T. S., Hall, C., et al. (2021). Multi-trait multi-environment genomic prediction of agronomic traits in advanced breeding lines of winter wheat. Front. Plant Sci. 12, 1–14. doi:10.3389/fpls.2021.709545
Gill, T., Gill, S. K., Saini, D. K., Chopra, Y., de Koff, J. P., and Sandhu, K. S. (2022). A comprehensive review of high throughput phenotyping and machine learning for plant stress phenotyping. Phenomics 2, 156–183. doi:10.1007/s43657-022-00048-z
Groos, C., Robert, N., Bervas, E., and Charmet, G. (2003). Genetic analysis of grain protein-content, grain yield and thousand-kernel weight in bread wheat. Theor. Appl. Genet. 106 (6), 1032–1040. doi:10.1007/s00122-002-1111-1
Gupta, P. K., Balyan, H. S., Chhuneja, P., Jaiswal, J. P., Tamhankar, S., Mishra, V. K., et al. (2022). Pyramiding of genes for grain protein content, grain quality, and rust resistance in eleven Indian bread wheat cultivars: A multi-institutional effort. Mol. Breed. 42 (4), 1–16. doi:10.1007/s11032-022-01277-w
Hernandez‐Segundo, E., Capettini, F., Trethowan, R., van Ginkel, M., Mejia, A., Carballo, A., et al. (2009). Mega‐environment identification for barley based on twenty‐seven years of global grain yield data. Crop Sci. 49 (5), 1705–1718. doi:10.2135/cropsci2008.04.0227
Hilmarsson, H. S., Rio, S., and Sanchez, J. I. y. (2021). Genotype by environment interaction analysis of agronomic spring barley traits in Iceland using AMMI, factorial regression model and linear mixed model. Agronomy 11 (3), 1–15. doi:10.3390/agronomy11030499
Khan, M. M. H., Rafii, M. Y., Ramlee, S. I., Jusoh, M., and Al Mamun, M. (2021). AMMI and GGE biplot analysis for yield performance and stability assessment of selected Bambara groundnut (Vigna subterranea L. Verdc.) genotypes under the multi-environmental trials (METs). Sci. Rep. 11 (1), 1–17. doi:10.1038/s41598-021-01411-2
Khazratkulova, S., Sharma, R. C., Amanov, A., Ziyadullaev, Z., Amanov, O., Alikulov, S., et al. (2015). Genotype × environment interaction and stability of grain yield and selected quality traits in winter wheat in Central Asia. Turk. J. Agric. For. 39, 920–929. doi:10.3906/tar-1501-24
Kokhmetova, A., Sharma, R. C., Rsaliyev, S., Galymbek, K., Baymagambetova, K., Ziyaev, Z., et al. (2017). Evaluation of Central Asian wheat germplasm for stripe rust resistance. Plant Genet. Resour. 16 (02), 178–184. doi:10.1017/S1479262117000132
Krishnamurthy, S. L., Sharma, P. C., Sharma, D. K., Ravikiran, K. T., Singh, Y. P., Mishra, V. K., et al. (2017). Identification of mega-environments and rice genotypes for general and specific adaptation to saline and alkaline stresses in India. Sci. Rep. 7 (1), 1–14. doi:10.1038/s41598-017-08532-7
Malosetti, M., Ribaut, J. -M., and van Eeuwijk, F. A. (2013). The statistical analysis of multi-environment data: Modeling genotype-by-environment interaction and its genetic basis. Front. Physiol. 4, 44–17. doi:10.3389/fphys.2013.00044
Mecha, B., Alamerew, S., Assefa, A., Dutamo, D., and Assefa, E. (2017). Correlation and path coefficient studies of yield and yield associated traits in bread wheat (Triticum aestivum L.) genotypes. Adv. Plants Agric. Res. 6 (5), 128–136. doi:10.15406/apar.2017.06.00226
Mengesha, W., Menkir, A., Meseka, S., Bossey, B., Afolabi, A., Burgueno, J., et al. (2019). Factor analysis to investigate genotype and genotype × environment interaction effects on pro-vitamin A content and yield in maize synthetics. Euphytica 215 (11), 1–15. doi:10.1007/s10681-019-2505-3
Mostafavi, K., Imeni, S. H., and Zare, M. (2011). Stability analysis of rice genotypes based GGE biplot Method in North of Iran. J. Appl. Sci. Res. 7 (11), 1690–1694.
Mukuze, C., Tukamuhabwa, P., Maphosa, M., Dari, S., Obua, T., Kongai, H., et al. (2020). Evaluation of the performance of advanced generation soybean [Glycine max (L.) Merr.] genotypes using GGE biplot. J. Plant Breed. Crop Sci. 12 (3), 246–257. doi:10.5897/JPBCS2020.0905
Myint, K. A., Amiruddin, M. D., Rafi, M. Y., Abd Samad, M. Y., Ramlee, S. I., Yaakub, Z., et al. (2019). Genetic diversity and selection criteria of MPOB-Senegal oil palm (Elaeis guineensis Jacq.) germplasm by quantitative traits. Industrial Crops Prod. 139, 1–11. doi:10.1016/j.indcrop.2019.111558
Neisse, A. C., Kirch, J. L., and Hongyu, K. (2018). AMMI and GGE biplot for genotype environment interaction: A medoid–based hierarchical cluster analysis approach for high–dimensional data. Biom. Lett. 55 (2), 97–121. doi:10.2478/bile-2018-0008
Ojha, R., Sarkar, A., Aryal, A., Rahul, K. C., Tiwari, S., Poudel, M., et al. (2018). Correlation and path coefficient analysis of wheat (Triticum aestivum L.) genotypes. Farming Manag. 3 (2), 136–141. doi:10.31830/2456-8724.2018.0002.19
Oladosu, Y., Rafii, M. Y., Abdullah, N., Magaji, U., Miah, G., Hussain, G., et al. (2017). Genotype × environment interaction and stability analyses of yield and yield components of established and mutant rice genotypes tested in multiple locations in Malaysia. Acta Agric. Scand. Sect. B —. Soil & Plant Sci. 67 (7), 590–606. doi:10.1080/09064710.2017.1321138
Oliveira, E. J. D., Freitas, J. P. X. D., and Jesus, O. N. D. (2014). AMMI analysis of the adaptability and yield stability of yellow passion fruit varieties. Sci. Agric. 71 (2), 139–145. doi:10.1590/S0103-90162014000200008
Pal, N., Saini, D. K., and Kumar, S. (2022). Breaking yield ceiling in wheat: Progress and future prospects. India: Wheat. Intech.Open. doi:10.5772/intechopen.102919
Pereira, F. D. C., Ramalho, M. A. P., Resende, M. F. R. D., and Pinho, R. G. V. (2021). Mega-environment analysis of maize breeding data from Brazil. Sci. Agric. 79, 1–10. doi:10.1590/1678-992X-2020-0314
Perkins, J. M., and Jinks, J. L. (1968). Environmental and genotype-environmental components of variability. 3. Multiple lines and crosses. Heredity 23, 339–356. doi:10.1038/hdy.1968.48
Popović, V., Ljubičić, N., Kostić, M., Radulović, M., Blagojević, D., Ugrenović, V., et al. (2020). Genotype× environment interaction for wheat yield traits suitable for selection in different seed priming conditions. Plants 9 (12), E1804–E1814. doi:10.3390/plants9121804
Pour-Aboughadareh, A., Khalili, M., Poczai, P., and Olivoto, T. (2022). Stability indices to deciphering the genotype-by-environment interaction (GEI) effect: An applicable review for use in plant breeding programs. Plants 11 (3), 414–424. doi:10.3390/plants11030414
Rad, M. N., Kadir, M. A., Rafii, M. Y., Jaafar, H. Z., Naghavi, M. R., and Ahmadi, F. (2013). Genotype environment interaction by AMMI and GGE biplot analysis in three consecutive generations of wheat (Triticum aestivum) under normal and drought stress conditions. Aust. J. Crop Sci. 7 (7), 956–961.
Rakshit, S., Ganapathy, K., Gomashe, S., Rathore, A., Ghorade, R., Kumar, M. N., et al. (2012). GGE biplot analysis to evaluate genotype, environment and their interactions in sorghum multi-location data. Euphytica 185 (3), 465–479. doi:10.1007/s10681-012-0648-6
Ruswandi, D., Syafii, M., Maulana, H., Ariyanti, M., Indriani, N. P., and Yuwariah, Y. (2021). GGE biplot analysis for stability and adaptability of maize hybrids in western region of Indonesia. Int. J. Agron. 2021, 1–9. doi:10.1155/2021/2166022
Sabaghnia, N., Sabaghpour, S. H., and Dehghani, H. (2008). The use of an AMMI model and its parameters to analyse yield stability in multi-environment trials. J. Agric. Sci. 146 (5), 571–581. doi:10.1017/S0021859608007831
Saini, D. K., Chopra, Y., Singh, J., Sandhu, K. S., Kumar, A., Bazzer, S., et al. (2022). Comprehensive evaluation of mapping complex traits in wheat using genome-wide association studies. Mol. Breed. 42 (1), 1–28. doi:10.1007/s11032-021-01272-7
Saini, D. K., Devi, P., and Kaushik, P. (2020). Advances in genomic interventions for wheat biofortification: A review. Agronomy 10 (1), 62–28. doi:10.3390/agronomy10010062
Sandhu, K. S., Aoun, M., Morris, C. F., and Carter, A. H. (2021b). Genomic selection for end-use quality and processing traits in soft white winter wheat breeding program with machine and deep learning models. Biology 10 (7), 1–19. doi:10.3390/biology10070689
Sandhu, K. S., Mihalyov, P. D., Lewien, M. J., Pumphrey, M. O., and Carter, A. H. (2021a). Combining genomic and phenomic information for predicting grain protein content and grain yield in spring wheat. Front. Plant Sci. 12, 1–14. doi:10.3389/fpls.2021.613300
Shahriari, Z., Heidari, B., and Dadkhodaie, A. (2018). Dissection of genotype × environment interactions for mucilage and seed yield in Plantago species: Application of AMMI and GGE biplot analyses. PloS One 13 (5), e0196095–33. doi:10.1371/journal.pone.0196095
Sharifi, P., Aminpanah, H., Erfani, R., Mohaddesi, A., and Abbasian, A. (2017). Evaluation of genotype × environment interaction in rice based on AMMI model in Iran. Rice Sci. 24 (3), 173–180. doi:10.1016/j.rsci.2017.02.001
Shrestha, J., Subedi, S., Acharya, R., Sharma, S., and Subedi, M. (2021). Grain yield stability of maize (Zea mays L.) hybrids using ammi model and GGE biplot analysis. SAARC J. Agric. 19 (2), 107–121. doi:10.3329/sja.v19i2.57675
Singh, B., Das, A., Parihar, A. K., Bhagawati, B., Singh, D., Pathak, K. N., et al. (2020). Delineation of Genotype-by-Environment interactions for identification and validation of resistant genotypes in mungbean to root-knot nematode (Meloidogyne incognita) using GGE biplot. Sci. Rep. 10 (1), 4108–4114. doi:10.1038/s41598-020-60820-x
Singh, C., Gupta, A., Gupta, V., Kumar, P., Sendhil, R., Tyagi, B. S., et al. (2019). Genotype x environment interaction analysis of multi-environment wheat trials in India using AMMI and GGE biplot models. Crop Breed. Appl. Technol. 19 (3), 309–318. doi:10.1590/1984-70332019v19n3a43
Solonechnyi, P., Kozachenko, M., Vasko, N., Gudzenko, V., Ishenko, V., Kozelets, G., et al. (2018). AMMI and GGE biplot analysis of yield performance of spring barley (Hordeum vulgare L.) varieties in multi environment trials. AgricultForest. 64 (1), 121–132. doi:10.17707/AgricultForest.64.1.15
Tanin, M. J., Kumar, A., and Gupta, S. K. (2018). Phenotypic stability for yield and some quality traits in Brassica juncea L. Int. J. Curr. Microbiol. Appl. Sci. 7 (02), 1–7. doi:10.20546/ijcmas.2018.702.060
Verma, A., Chatrath, R., and Sharma, I. (2015). AMMI and GGE biplots for G×E analysis of wheat genotypes under rain fed conditions in central zone of India. J. Appl. Nat. Sci. 7 (2), 656–661. doi:10.31018/jans.v7i2.662
Vishwakarma, M. K., Arun, B., Mishra, V. K., Yadav, P. S., Kumar, H., and Joshi, A. K. (2016). Marker-assisted improvement of grain protein content and grain weight in Indian bread wheat. Euphytica 208 (2), 313–321. doi:10.1007/s10681-015-1598-6
Vishwakarma, M. K., Mishra, V. K., Gupta, P. K., Yadav, P. S., Kumar, H., and Joshi, A. K. (2014). Introgression of the high grain protein gene Gpc-B1 in an elite wheat variety of Indo-Gangetic Plains through marker assisted backcross breeding. Curr. Plant Biol. 1, 60–67. doi:10.1016/j.cpb.2014.09.003
Wricke, G. (1962). Uber eine methodezur erfassung der ekologischen streubreite in feldversuchen. Z. Pflanzenzuecht. 47, 92–96.
Yan, W., and Tinker, N. A. (2005). An integrated biplot analysis system for displaying, interpreting, and exploring genotype× environment interaction. Crop Sci. 45 (3), 1004–1016. doi:10.2135/cropsci2004.0076
Keywords: grain protein content, stability analysis, G × E interaction, univariate analysis, multivariate analysis, wheat
Citation: Tanin MJ, Sharma A, Saini DK, Singh S, Kashyap L, Srivastava P, Mavi GS, Kaur S, Kumar V, Kumar V, Grover G, Chhuneja P and Sohu VS (2022) Ascertaining yield and grain protein content stability in wheat genotypes having the Gpc-B1 gene using univariate, multivariate, and correlation analysis. Front. Genet. 13:1001904. doi: 10.3389/fgene.2022.1001904
Received: 24 July 2022; Accepted: 15 August 2022;
Published: 07 September 2022.
Edited by:
Karansher Singh Sandhu, Bayer Crop Science, United StatesReviewed by:
Reyazul Rouf Mir, Sher-e-Kashmir University of Agricultural Sciences and Technology, IndiaSanchi Bhimrajka, University of Delhi, India
Anju Biswas, University of Florida, United States
Copyright © 2022 Tanin, Sharma, Saini, Singh, Kashyap, Srivastava, Mavi, Kaur, Kumar, Kumar, Grover, Chhuneja and Sohu. This is an open-access article distributed under the terms of the Creative Commons Attribution License (CC BY). The use, distribution or reproduction in other forums is permitted, provided the original author(s) and the copyright owner(s) are credited and that the original publication in this journal is cited, in accordance with accepted academic practice. No use, distribution or reproduction is permitted which does not comply with these terms.
*Correspondence: Mohammad Jafar Tanin, amFmYXJ0YW5pbkBnbWFpbC5jb20=; Achla Sharma, YWNobGFAcGF1LmVkdQ==