- 1Department of Biostatistics, University of Pittsburgh, Pittsburgh, PA, United States
- 2Department of Mathematics, Ruhr-University Bochum, Bochum, Germany
- 3Department of Epidemiology and Biostatistics, Memorial Sloan Kettering Cancer Center, New York, NY, United States
We present a new R package PRECISION.seq for assessing the performance of depth normalization in microRNA sequencing data. It provides a pair of microRNA sequencing data sets for the same set of tumor samples, additional pairs of data sets simulated by re-sampling under various patterns of differential expression, and a collection of numerical and graphical tools for assessing the performance of normalization methods. Users can easily assess their chosen normalization method and compare its performance to nine methods already included in the package. PRECISION.seq enables an objective and systematic evaluation of normalization methods in microRNA sequencing using realistically distributed and robustly benchmarked data under a wide range of differential expression patterns. To our best knowledge, this is the first such tool available. The data sets and source code of the R package can be found at https://github.com/LXQin/PRECISION.seq.
Introduction
Depth normalization is a critical preprocessing step for accurate and reproducible analysis of transcriptomic sequencing data (Bullard et al., 2010). Methods for depth normalization have been newly proposed or repurposed from normalization methods previously developed for microarray data (Dillies et al., 2013). Their performances have been evaluated primarily for RNA sequencing data and a thorough assessment is still in need for microRNAs (miRNAs), a class of small RNAs regulating gene expression and closely linked to carcinogenesis, which tend to be expressed in a tissue-specific manner with a small number of markers abundantly expressed (Dillies et al., 2013; Maza et al., 2013).
To enable such an assessment, we collected two data sets for the same set of tumor samples, where one set was collected using uniform handling and balanced library assignment and the second was collected over time and without such careful study design (Qin et al., 2020). The former can be used to assess miRNAs’ differential expression (DE) status, serving as a benchmark; the latter can be used to assess the use of normalization methods against the benchmark. Furthermore, we devised a re-sampling-based strategy for simulating additional data set pairs and developed a workflow for performing the paired-data-sets based assessment. We have built these data and the workflow into an R package named PRECISION.seq, PaiREd miCrorna analysIs of differential expresSION for sequencing, for interested researchers to assess methods.
Implementation
MiRNAs were sequenced for 27 myxofibrosarcoma samples and 27 pleomorphic malignant fibrous histiocytoma samples twice, once with uniform handling (serving as the “benchmark” data) and a second time in the order of sample collection over the years resulting in unwanted depth variations (serving as the “test” data) (Qin et al., 2020). The first data set can be accessed by data.benchmark and the second by data.test.
The overall normalization assessment is provided by the function precision.seq() following three steps: first, the test data is normalized using one or multiple methods; second, differential expression between the two subtypes is determined in the un-normalized benchmark data and normalized test data using either voom-limma or edgeR (Robinson, McCarthy, and Smyth 2010; Law et al., 2014); lastly, the DE statuses determined in the benchmark data are used as a gold standard for assessing the performance of normalization methods in the test data.
Our package currently includes nine normalization methods that are relatively commonly used in the literature. Among them, six methods are based on scaling: Total Count, Upper Quartile, Median, Trimmed Mean of M-values (TMM), DESeq, PoissonSeq (Anders and Huber 2010; Robinson and Oshlack 2010; Li et al., 2012; Dillies et al., 2013); three methods are based on regression: Quantile Normalization, Surrogate Variable Analysis for Sequencing (SVASeq), and Remove Unwanted Variation (RUV, including three sub-methods RUVg, RUVr, RUVs) (Irizarry et al., 2003; Leek 2014; Risso et al., 2014). The computational speed of these normalization methods is very fast, in the range of a fraction of seconds for scaling methods and about a second for the RUV methods, using a PC with AMD Ryzen 5 3600 6-Core Processor 3.60 GHz. Users can also add any additional normalization method to the workflow by providing its normalized test data to the precision.seq() function.
The differential expression analysis results are compared numerically and graphically between the normalized test data and the un-normalized benchmark data. Treating the latter as a gold standard and dichotomizing the p-values at a user-specified significance level, the pip.statistics() function calculates the True Positive Rate (TPR), False Positive Rate (FPR), False Discovery Rate (FDR), and False Negative Rate (FNR). To assess the impact of each individual normalization method, functions are included to draw 1) Relative Log Expression (RLE) plot for log2 count data (fig.RLE()), 2) Volcano plot for p-values versus group mean differences (fig.volcano()), and 3) Venn diagram of DE statuses (fig.venn()) (Gandolfo and Speed 2018). To compare across normalization methods, functions are provided to draw 1) Scatter plot of FNRs and FDRs (fig.FDR_FNR()), 2) Concordance At the Top (CAT) plot of the p-value ranking (fig.CAT()), and 3) Dendrogram for hierarchically clustering p-values using the Euclidean distance and the Ward’s minimum variance linkage (fig.dendrogram()) (Waldron et al., 2012).
Additional paired data sets can be simulated under various scenarios of differential expression using the simulation.algorithm() function that implements the re-sampling-based algorithm introduced in (Qin et al., 2020). Briefly, sample group labels are shuffled for the benchmark data by: 1) clustering the 54 samples to two clusters and randomly selecting nine samples in each cluster to serve as the ‘anchor samples’ for the two new sample groups; 2) randomly allocating the remaining 36 samples to these two new sample groups. The same sample shuffling is then applied to the test data. We have used this algorithm to pre-simulate 20,000 pairs of data sets and categorized them based on the proportion of differential expression and the median of mean differences across markers. To save computation time, users can extract the pre-simulated data sets under a desired differential expression pattern using the simulated.data() function. The simulated data sets can be analyzed by calling the function pip.simulated.data() and the results can be summarized and displayed by calling the fig.FDR_FNR.boxplot() function.
Example Usage
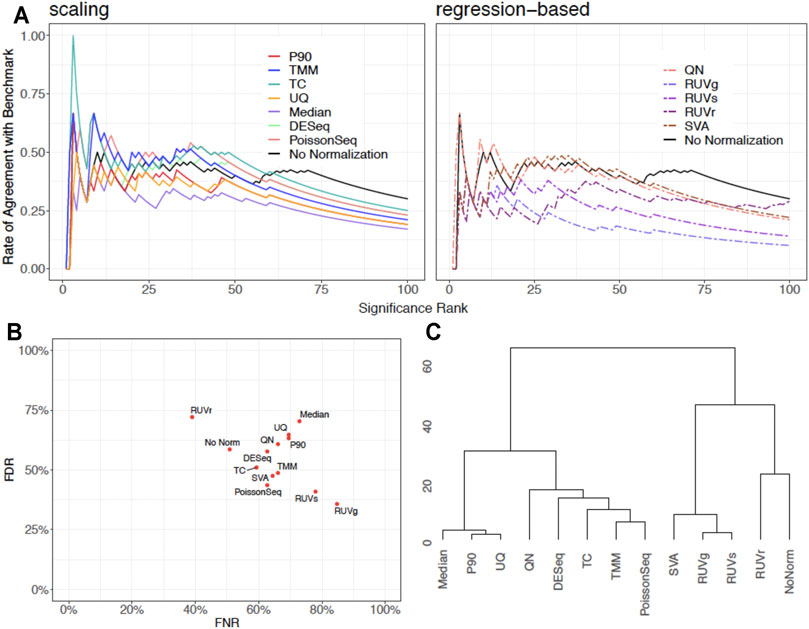
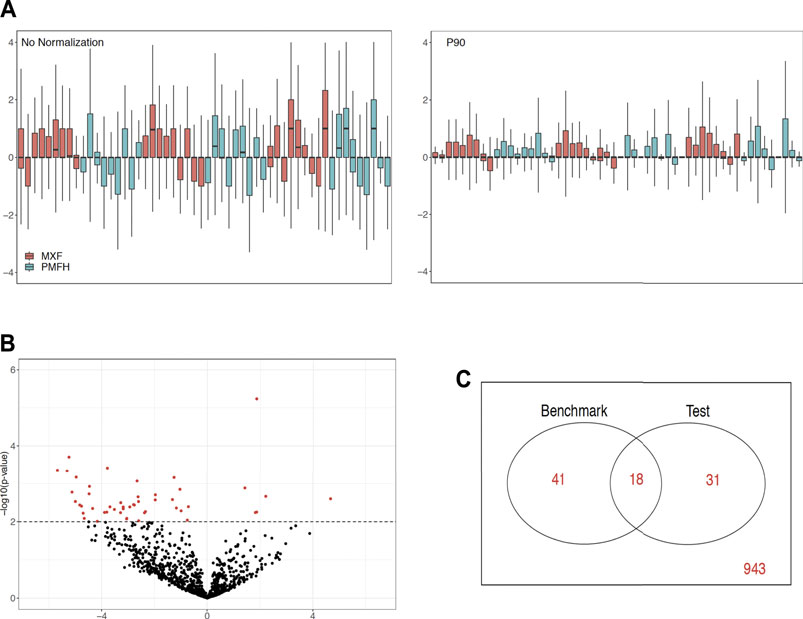
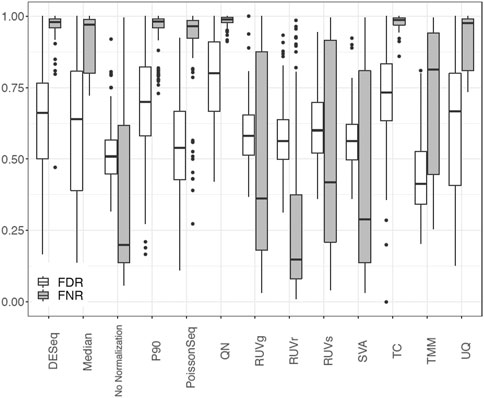
We showcase the use of the benchmarking pipeline for scaling normalization by the 90th percentile (P90). We assess the performance of P90 in comparison with the nine aforementioned methods using the function precision.seq(). Assessment is first done with the pair of empirical data sets (Figure 1). As expected, P90 performs similarly to Upper Quartile and Median Normalization due to their related manner of normalizing the data. More specifically, P90 is a moderate performer resembling Upper Quartile and Median Normalization in terms of p-value ranking; it has an FDR of 63.27% and an FNR of 69.49%; its p-values cluster closely with those for Upper Quartile and Median. Method-specific plots for P90 are provided in Figure 2. Further assessment is done using 100 pairs of simulated data sets that have a DE proportion around 20% and a median of mean differences around 3. P90 shows mediocre FDR and poor FNR, generally comparable to Total Count and Quantile Normalization and slightly worse than Upper Quartile and Median (Figure 3).

FIGURE 1. Graphical display of empirical assessment results for P90 normalization in comparison with no normalization and nine normalization methods using PRECISION.seq. (A) CATplot of p-value ranking determined in the test data that undergoes scaling normalization (left panel) or regression-based normalization (right panel), in comparison with no normalization. (B) Scatterplot of False Negative Rate and False Discovery Rate among the normalization methods. (C) Dendrogram for clustering the p-values in the test data before and after normalization.

FIGURE 2. Graphical display of method-specific empirical assessment results for P90 normalization using PRECISION.seq. (A) RLE plot for log2 count data before (left panel) and after P90 (right panel), (B) Volcano plot for p-values versus group mean differences after P90, (C) Venn diagram of DE statuses before versus after P90 normalization.

FIGURE 3. Boxplot of FDR and FNR in 100 pairs of simulated data sets for P90 normalization in comparison with no normalization and nine normalization methods using PRECISION. seq.
Summary
In this paper, we introduce an R package, called PRECISION.seq, for assessing the performance of depth normalization methods in miRNA sequencing using realistically distributed and robustly benchmarked data under a range of differential expression scenarios. To the best of our knowledge, this is the first such tool available. One limitation of our tool is that it does not offer varied scenarios for the number of samples or the range of sequencing depth in the samples.
Data Availability Statement
Publicly available datasets were analyzed in this study. This data can be found here: https://github.com/LXQin/PRECISION.seq.DATA.
Ethics Statement
This study uses publicly available data whose collection was approved by the Memorial Sloan Kettering Cancer Center Institutional Review Board.
Author Contributions
JZ, YD, and LXQ contributed to conception and design of the study. JZ and YD developed the R package. JZ and LXQ wrote the first draft of the manuscript. All authors contributed to manuscript revision, read, and approved the submitted version.
Funding
This work was supported by National Institutes of Health (CA214845 to LXQ, HG012124 to LXQ, CA217694, CA008748).
Conflict of Interest
The authors declare that the research was conducted in the absence of any commercial or financial relationships that could be construed as a potential conflict of interest.
Publisher’s Note
All claims expressed in this article are solely those of the authors and do not necessarily represent those of their affiliated organizations, or those of the publisher, the editors, and the reviewers. Any product that may be evaluated in this article, or claim that may be made by its manufacturer, is not guaranteed or endorsed by the publisher.
References
Anders, S., and Huber, W. (2010). Differential Expression Analysis for Sequence Count Data. Genome Biol. 11 (10), R106. doi:10.1186/gb-2010-11-10-r106
Bullard, J. H., Purdom, E., Hansen, K. D., and Dudoit, S. (2010). Evaluation of Statistical Methods for Normalization and Differential Expression in MRNA-Seq Experiments. BMC Bioinformatics 11 (1), 94. doi:10.1186/1471-2105-11-94
Dillies, M.-A., Rau, A., Aubert, J., Hennequet-Antier, C., Jeanmougin, M., Servant, N., et al. (2013). A Comprehensive Evaluation of Normalization Methods for Illumina High-Throughput RNA Sequencing Data Analysis. Brief. Bioinform. 14 (6), 671–683. doi:10.1093/bib/bbs046
Gandolfo, L. C., and Speed, T. P. (2018). RLE Plots: Visualizing Unwanted Variation in High Dimensional Data. PLoS One 13 (2), e0191629. doi:10.1371/journal.pone.0191629
Irizarry, R. A., Hobbs, B., Collin, F., YasminBeazer-Barclay, D., Antonellis, K. J., Scherf, U., et al. (2003). Exploration, Normalization, and Summaries of High Density Oligonucleotide Array Probe Level Data. Biostatistics 4 (2), 249–264. doi:10.1093/biostatistics/4.2.249
Law, C. W., Chen, Y., Shi, W., and Smyth, G. K. (2014). Voom: Precision Weights Unlock Linear Model Analysis Tools for RNA-Seq Read Counts. Genome Biol. 15 (2), R29. doi:10.1186/gb-2014-15-2-r29
Leek, J. T. (2014). Svaseq: Removing Batch Effects and Other Unwanted Noise from Sequencing Data. Nucleic Acids Res. 42 (21), e161. doi:10.1093/nar/gku864
Li, J., Witten, D. M., Johnstone, I. M., and Tibshirani, R. (2012). Normalization, Testing, and False Discovery Rate Estimation for RNA-Sequencing Data. Biostatistics 13 (3), 523–538. doi:10.1093/biostatistics/kxr031
Maza, E., Frasse, P., Senin, P., Bouzayen, M., and Zouine, M. (2013). Comparison of Normalization Methods for Differential Gene Expression Analysis in RNA-Seq Experiments. Communicative Integr. Biol. 6, e25849. doi:10.4161/cib.25849
Qin, L. X., Zou, J., Shi, J., Lee, A., Mihailovic, A., Farazi, T. A., et al. (2020). Statistical Assessment of Depth Normalization for Small RNA Sequencing. JCO Clin. Cancer Inform. 4 (June), 567–582. doi:10.1200/CCI.19.00118
Risso, D., Ngai, J., Speed, T. P., and Dudoit, S. (2014). Speed, and Sandrine DudoitNormalization of RNA-Seq Data Using Factor Analysis of Control Genes or Samples. Nat. Biotechnol. 32 (9), 896–902. doi:10.1038/nbt.2931
Robinson, M. D., McCarthy, D. J., and Smyth, G. K. (2010). EdgeR: A Bioconductor Package for Differential Expression Analysis of Digital Gene Expression Data. Bioinformatics 26 (1), 139–140. doi:10.1093/bioinformatics/btp616
Robinson, M. D., and Oshlack., A. (2010). A Scaling Normalization Method for Differential Expression Analysis of RNA-Seq Data. Genome Biol. 11 (3), R25. doi:10.1186/gb-2010-11-3-r25
Keywords: microRNA, sequencing, normalization, benchmarking, software
Citation: Zou J, Düren Y and Qin L-X (2022) PRECISION.seq: An R Package for Benchmarking Depth Normalization in microRNA Sequencing. Front. Genet. 12:823431. doi: 10.3389/fgene.2021.823431
Received: 27 November 2021; Accepted: 31 December 2021;
Published: 28 January 2022.
Edited by:
Simon Charles Heath, Center for Genomic Regulation (CRG), SpainReviewed by:
Hongmei Jiang, Northwestern University, United StatesChuang Ma, Northwest A and F University, China
Copyright © 2022 Zou, Düren and Qin. This is an open-access article distributed under the terms of the Creative Commons Attribution License (CC BY). The use, distribution or reproduction in other forums is permitted, provided the original author(s) and the copyright owner(s) are credited and that the original publication in this journal is cited, in accordance with accepted academic practice. No use, distribution or reproduction is permitted which does not comply with these terms.
*Correspondence: Li-Xuan Qin, cWlubEBtc2tjYy5vcmc=
†These authors have contributed equally to this work and share first authorship
 Jian Zou
 Yannick Düren
 Li-Xuan Qin