- College of Horticulture, Qingdao Agricultural University, Qingdao, China
Brassinosteroid (BR), a kind of polyhydroxylated steroid hormone, plays an important role in physiological and biochemical processes in plants. Studies were mainly focused on BR signaling and its exogenous spraying to help enhance crop yields. Few research studies are centered on the accumulation pattern of BR and its mechanism. Yet, it is crucial to unlock the mystery of the function of BR and its cross action with other hormones. Tea (Camellia sinensis (L.) O. Kuntze) is one of the important economic crops in some countries, and new shoots are the raw materials for the preparation of various tea products. Different concentrations of exogenous BR were reported to have different effects on growth and development. New shoots of tea plants can thus be considered a valuable research object to study the accumulation pattern of BR. In this study, the quantity of five BR components (brassinolide, 28-norbrassinolide, 28-homobrassinolide, castasterone, and 28-norcastasterone) in different tissues of tea plants, including buds (Bud), different maturity of leaves (L1, L2), and stems (S1, S2) were determined by UPLC-MS/MS. A total of 15 cDNA libraries of the same tissue with three repetitions for each were constructed and sequenced. The BR-accumulation pattern and gene expression pattern were combined together for weighted gene co-expression network analysis (WGCNA). BR-accumulation-relative genes were then screened using two methods, based on the K.in value and BR biosynthetic pathway (ko00905), respectively. The result showed that photosynthesis-related genes and CYP450 family genes were actively involved and might play important roles in BR accumulation and/or its accumulation pattern. First and foremost, feedback inhibition was more likely to dominate the accumulation pattern of BR in the new shoots of tea plants. Moreover, three conserved miRNAs with their target transcriptional factors and target mRNAs had been figured out from negative correlation modules that might be strongly linked to the BR-accumulation pattern. Our study provided an experimental basis for the role of BR in tea plants. The excavation of genes related to the accumulation pattern of BR provided the possibility of cross-action studies on the regulation of BR biosynthesis and the study between BR and other hormones.
Introduction
Brassinosteroid (BR), known as the sixth natural phytohormone, is a polyhydroxylated steroid hormone (Liu L. et al., 2021). BR promotes cell elongation, cell division (Que et al., 2018; Oh et al., 2020; Conway et al., 2021), seed germination (Zhong et al., 2021), and fruit ripening (He et al., 2018) during growth and development, and it also plays an important regulatory role in plants under stress (Farooq et al., 2009; Procházka et al., 2016; Soares et al., 2020). A proven strategy to know how BR works is to figure out the biosynthesis pathway of BR in plants. At present, there are three main forms of BR in plants: C27-BR, C28-BR, and C29-BR (Bajguz et al., 2020). Many reactions, catalytic enzymes and biosynthetic genes have been excavated through the C28-BR biosynthetic pathway (Figure 1A), and it has been well understood. The C28-BR biosynthesis pathway starts from campesterol (CR), a biosynthetic substrate, and can be carried out through two parallel pathways, which are campestanol (CN)-dependent and CN-independent pathways, respectively. In the CN-dependent pathway, first, CR is catalyzed to form CN by enzymes such as DET2, and then CN → 6-deoxocathasterone (6-deoxoCT) →6-deoxoteasterone (6-deoxoTE) →3-dehydro-6-deoxoteasterone (6-deoxo-3-DT) → 6-deoxotyphasterol (6-deoxoTY), which are catalyzed by CYP90C1, ROT3/CYP90D1, CPD/CYP90A1, and isomerase, respectively. In the CN-independent pathway, CR directly forms 6-deoxoTY through a 5-step catalytic reaction as follows: CR→(22S)-22-hydroxycampesterol (22-OHCR)→(22S,24R)-22-hydroxyergost-4-en-3-one (22-OH-4-en-3-one)→(22S,24R)-22-hydroxy-5-ergostan-3-one (22-OH-3-one)→6-deoxoTY, and this process is catalyzed by DWF4/CYP90B1, CPD/CYP90A1, DET2, isomerase, CYP90C1, and ROT3/CYP90D1. The two pathways converge at 6deoxoTY, which is hydroxylated to 6-deoxocastasterone (6-deoxoCS). Then, 6-deoxoCS is catalyzed to form castasterone (CS). This step is catalyzed by BR6ox1/CYP85A1 and BR6ox2/CYP85A2. Finally, CS is catalyzed to BL by BR6ox2/CYP85A2. In addition, CR is finally transformed into 28-norbrassinolide (28-norBL) in the C27-BR pathway, and b-sitosterol is finally transformed into 28-homobrassinolide (28-homoBL) in the C29-BR pathway. 28-norcastasterone (28-norCS) and 28-homocastasterone (28-homoCS) in the two pathways are also the direct substrates of CS (Figure 1B) (Fujioka et al., 2000; Fujioka et al., 2002; Fujioka and Yokota, 2003; Kim et al., 2005; Fujita et al., 2010; Toshiyuki et al., 2012; Yuan et al., 2015; Toshiyuki and Ohnishi, 2018).
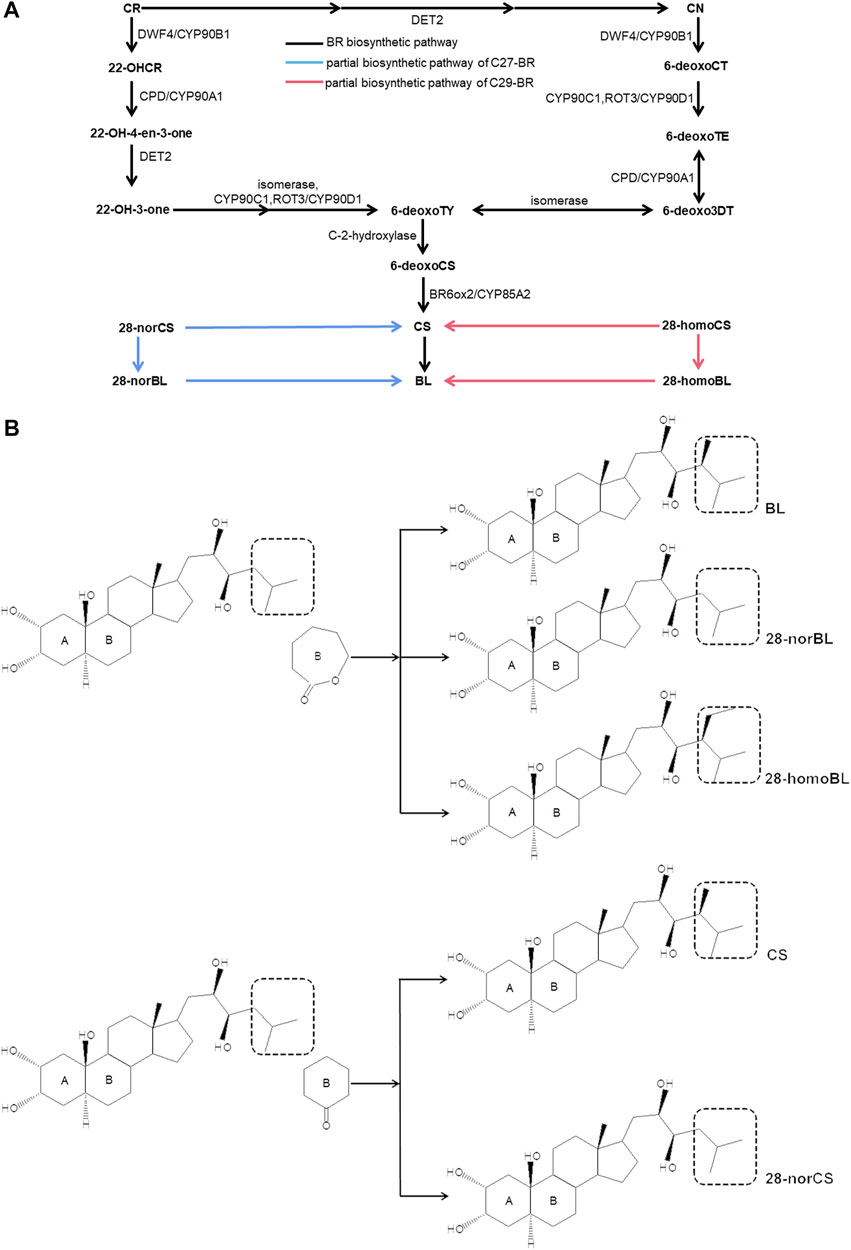
FIGURE 1. BR biosynthetic pathway. (A) BR biosynthetic pathway. (B) Structure of five BR (CS, 28-norCS, BL, 28-norBL, 28-homoBL). Campesterol (CR); campestanol (CN); 6-deoxocathasterone (6-deoxoCT); 6-deoxoteasterone (6-deoxoTE); 3-dehydro-6-deoxoteasterone (6-deoxo-3-DT); 6-deoxotyphasterol (6-deoxoTY); (22S)-22-hydroxycampesterol (22-OHCR); (22S,24R)-22-hydroxyergost-4-en-3-one (22-OH-4-en-3-one); castasterone (CS); brassinolide (BL); 28-norcastasterone (28-norCS); 28-homocastasterone (28-homoCS); 28-norbrassinolide (28-norBL); and 28-homobrassinolide (28-homoBL). The black box of a dashed line in the left could be replaced by the one in the right within the same brace in (B).
Although the BR biosynthetic pathway is relatively well understood, a central problem that cannot be ignored is that the phenomenon by which it accumulates in plants, and the reasons for its accumulation are not well understood. Recently, studies of BR were mainly focused on the signal transduction, the function of relative transcription factors (TFs), and enhancing crop yields by spraying exogenous BR (Divi and Krishna, 2009; Liu D. et al., 2021; Liu H. et al., 2021; Wang et al., 2021). It is reported that different concentrations of exogenous BR have different effects on plants, and gene expressions, and enzyme activities in the biosynthetic pathway of BR were inhibited when the accumulation of BR in plants became high (Ha et al., 2018). That is, the accumulation of BR may play a subtle and important coordinating role in maintaining BR and/or balancing the level of BR and other hormones. Thus, it is necessary and important to understand the accumulation pattern of BR and its mechanism. The tea plant (Camellia sinensis (L.) O. Kuntze) has become one of the important economic crops in many countries, such as China, India, and Japan (Liu Z. et al., 2021). In addition, studies reported the application of exogenous BR could improve the tea quality and yield (Li et al., 2016; Li et al., 2017; Li et al., 2018). They also found that different concentrations of BR have different effects on tea plants. Meanwhile, new shoots of tea plants are the major raw materials for the processing of various tea products (Zhang Z. et al., 2021). New shoots of tea plants can thus be considered a valuable research object to study the accumulation of BR and their accumulation patterns.
In this study, five main components of BR, brassinolide (BL), 28-norbrassinolide (28-norBL), 28-homobrassinolide (28-homoBL), castasterone (CS), and 28-norcastasterone (28-norCS) (Figure 1B) in different tissues of new shoots in tea plants (Figure 2A) were determined by using ultra-performance liquid chromatography–tandem mass spectrometry (UPLC-MS/MS). The RNA-seq data of five tissues from the new shoots of tea plants and the accumulation mode of BR were banded together to mine potential genes involved in BR biosynthesis. Then, the connectivity of genes involved in the accumulation mode of BR was sorted by two different methods, which were from the perspective of the K.in value and BR pathway (ko00905), respectively. The genes related to the accumulation pattern of BR involved in metabolic pathways were then enriched by the analysis of Kyoto Encyclopedia of Genes and Genomes (KEGG). The main BR-accumulation pattern and connections between the relative genes and their potential roles in effecting the accumulation pattern of BR were discussed. Our study on the contents of BR-related substances and the accumulation pattern will provide an experimental basis for the role of BR in tea plants. Moreover, the excavation of genes related to the accumulation pattern of BR will provide the possibility of cross-action studies on the regulation of BR biosynthesis and the study between BR and other hormones.
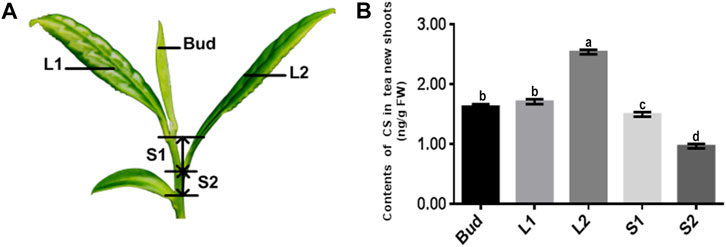
FIGURE 2. The content of CS in different tissues of new shoots in tea plants. (A) Bud, leaf, and stem samples were collected from top to bottom, named bud, L1, L2, S1, and S2. (B) Content of CS in five tissues of tea tree’s new shoots. Data values are the mean ± SD of three independent biological samples. Different letters above the bars indicate significantly different values (p < 0.05).
Methods and Materials
Plant Materials
Four-year-old Pingyang Tezaocha (PYTZ) (Camellia sinensis (L.) O. Kuntze) tea plants were grown in an experimental research garden at Qingdao Agricultural University (latitude 35°N, longitude 119°E, Qingdao city, China) under natural conditions. Samples of five different tissues were collected from top to bottom: bud (Bud), the first leaf below the bud (L1), the second leaf with higher maturity below the bud (L2), the stem between the first leaf and the second leaf (S1), and the more mature stem between the second leaf and the fish leaf (S2) were collected from the top to bottom in order (Figure 2A). The standards of the samples could be referred to the previous published experimental method (Zhao et al., 2019). For each operation three repetitions were needed, with each repetition conducted on at least three tea seedlings. These samples were immediately frozen in liquid nitrogen after collection and stored in a −80°C refrigerator for extraction and quantification of BR, RNA isolation for sequencing, and qRT-PCR as described below.
Extraction and Quantification of BR
Plant tissue (1 g) (fresh samples of Bud, L1, L2, S1 and S2 mentioned above) was grounded to powder form with a grinding machine, and then, transferred into a 10-ml centrifuge tube. Stable isotope-labeled BR [2H3] BL (1 ng/g) and [2H3] CS (1 ng/g) were added into the mixture followed by extraction with acetonitrile (5 ml) for 12 h in a refrigerator at −18°C. The acetonitrile exacted sample was centrifuged at 10,000 g under 4°C for 20 min. Then, the extracted sample was blown dry with nitrogen and re-dissolved with acetonitrile. All the obtained solutions were combined, and graphitized carbon black, Cl8-bonded silica, and ethylenediamine-N-propyl-bonded silica were added, vortexed, mixed for 5 min, and centrifuged to collect the super sample effluent. The oleoresin sterols adsorbed on the material were then desorbed with methanol (2 ml), the upper sample effluent and desorption solution were combined, and the solvent was evaporated. The sample residue was dissolved with a buffer solution (20 mM ammonium formate acetonitrile/water, 1/4, V/V, pH9, 5 ml). The five compound standards of BR, BL, 28-norBL, 28-homoBL, CS, and 28-norCS and stable isotope-labeled standards [2H3] brassinolide and [2H3] castasterone were purchased from Olchemim Ltd (Olomouc, Czech Republic). All solutions were extracted with pre-activated phenylboronic acid magnetic condensation (20 mg) and were centrifuged, and the supernatant was discarded. After washing with acetonitrile containing 0.5% ammonia, the extracted BR was desorbed with a water/acetonitrile solution (1/9, V/V) containing 3% H2O2, and after blowing the solvent dry, the volume was fixed to 100 μl, of which 80 μl was used for subsequent UPLC-MS/MS analysis (Ding et al., 2013).
Library Construction, Sequencing, and Data Analysis
Total RNA for each sample (Bud, L1, L2, S1, and S2 mentioned above) was isolated using RNAiso-mate and a plant tissue kit (Takara, Tokyo, Japan). The quality, purity, concentration, and integrity of the RNA were accordingly checked. RNA samples with a 260/280 ratio around 1.8, 260/230 ratio around 2.0, and RNA integrity number more than 8.0 were used for sequencing and quantitative analysis. For mRNA library construction, total RNA were first enriched by using Oligo (dT) beads, fragmented into short fragments using a fragmentation buffer, and then reverse transcribed into cDNA with random primers. Then, the enriched mRNA and second-strand cDNA were synthesized by using DNA polymerase I, RNase H, dNTP, and a buffer. Then, the cDNA fragments were purified with a QiaQuick PCR extraction kit, end repaired, poly (A) added, and ligated to Illumina sequencing adapters. The ligation products were size selected by agarose gel electrophoresis, PCR amplified, and sequenced on an Illumina HiSeq™ 3000 sequencer using PE150 method by RiboBio Co., Ltd (Guangzhou, China). Raw reads containing adapters, low quality bases, and short reads that could be mapped to the ribosome RNA were removed before assembly and further analysis in the transcriptome. Then, the clean reads of each sample were mapped to the reference genome (NCBI Sequence Read Archive Database under accession number PRJNA381277) by Tophat2 (Trapnell et al., 2010). Gene abundances were quantified by using software RSEM (Bo et al., 2011). Data analysis was performed by Gene Denovo Biotechnology Co. (Guangzhou, China). The fragments per kilobase of transcript per million mapped reads (FPKM) were used to calculate gene expression among samples. For the significance analysis of differences, the two-tailed student’s test was used to estimate the significance of the difference between the pairwise comparisons. Using the SPSS statistical program, the one-way ANOVA was used to compare the statistical significance of the differences between the groups, and then the least significant difference post hoc test was performed when p < 0.05.
Weighted Gene Co-Expression Network Analysis and Visualization of Gene Networks
WGCNA is a system biology method for hierarchical clustering and identification of co-expressed genes. The R software package (v1.47) of WGCNA was used to calculate the intra module connectivity and module correlation (MM) of each gene. Firstly, it was assumed that the gene network follows a scale-free distribution, and then the adjacency matrix was further transformed into a topological overlap matrix (TOM), so as to establish a hierarchical clustering tree (Langfelder and Horvath, 2008). The generated gene tree was cut and distinguished by dynamic tree cutting method (minimum module size = 50) to produce different modules. After the preliminary module division, the modules with similar expression patterns were combined according to the module similarity to form a dynamic tree. Subsequent analyses were carried out according to the combined module (Esposito et al., 2021). The KEGG pathway enrichment analysis was performed using the KEGG database (http://www.genome.jp/kegg/) (Minoru et al., 2008). After multiple test correction, the path with Q value ≤0.05 was defined as significantly enriched genes. The Q value was the correction of p-value after FDR (Benjamini and Hochberg, 1995). We screened the genes of interest in the positive and negative correlation modules separately, then screened the relationship pairs of miRNAs and TFs and their target mRNAs, and finally, constructed the co-expression network using Cytoscape version 3.7.2 (http://www.cytoscape.org/).
Quantitative Real-Time Polymerase Chain Reaction Analysis
Total RNA was isolated from Bud, L1, L2, S1, and S2 by using an RNA extraction kit (Code No. 9108, Takara, Tokyo, Japan), and then converted to cDNA by using a PrimeScript®RT reagent kit according to the manufacturer’s protocol (Code No. RR047A, Takara, Tokyo, Japan). GAPDH was used a normalization reference. Gene specific primers of the twelve selected genes were designed by using primer5. All the primer sequences were also shown in Supplementary Table S3. The qRT-PCR was carried out on a CFX96 Real-Time PCR detection instrument (Bio-Rad, Inc., Hercules, CA, United States) with a SYBR Premix Ex TaqTMII Kit (Tli RNase H Plus) (Code No. RR820A, Takara, Tokyo, Japan). The reaction mixtures were studied under the following parameters: 95°C for 30 s, 30 cycles at 95°C for 5 s, 60°C for 30 s. The relative expression of genes were calculated by using the 2^ −∆∆Ct analysis method (Livak and Schmittgen, 2001). The qRT-PCR of each gene was performed with three technical replicates and biological replicates. The calculation method of significance analysis was the same as the above mentioned in 2.3.
Results
Low Contents of BR Biosynthetic Metabolites and Their Distribution in the New Shoots of Tea Plants
The contents of five main substances of BR biosynthetic metabolites (Supplementary Table S1), BL, 28-norBL, 28-homoBL, CS, and 28-norCS had been detected in the new shoots of tea plants via UPLC-MS/MS. Only CS and 28-CS could be quantitated, even so, their contents were quite low (Supplementary Table S1). Within that, 28-CS could not be checked out in sample S2. The accumulation pattern of CS in the five samples of tea plants at different developmental stages was thus to be considered the key point. By quantitative analysis, the results showed that the contents of CS in Bud, L1, L2, S1, and S2 were 1.63, 1.71, 2.54, 1.50, and 0.97 (ng/g, FW), respectively (with ±0.04 error interval). Through the data, the content of CS in mature leaves (L2) was more than that in tender leaves (L1), the content of CS in old stems (S2) was less than that in tender stems (S1), and the content of CS in bud (Bud) was more than that in stems (S1, S2) (Figures 2A, B).
Expression Characters of Whole Genes in the New Shoots of Tea Plants
To figure out candidate genes that may affect the accumulation of BR metabolites in the new shoots of tea plants, the transcriptome of buds, leaves, and stems had been sequenced and analyzed. The qualities of fifteen libraries, including the total length of clean reads, the percentages of Q20 and Q30, percentage of GC content, and the ratio of mapping to reference genome, met the requirements of subsequent analyses and are shown in Supplementary Table S2. The pearson correlation analysis showed a high consistency among the replicates, suggesting that the transcriptome data deserves to be relied upon for subsequent studies (Supplementary Figure S1).
Focalization of BR-Accumulation–Related Genes Based on the K.in Value
To explore the genes in tea plants that may be related to the accumulation of metabolites in the BR biosynthetic pathway, the correlation between the content of CS in the BR biosynthetic pathway and the expression of all genes from the transcriptome of new shoots in tea plants was analyzed by applying WGCNA. The results showed that according to the content of CS, all genes could be divided into nine modules (Figure 3), among which, “grey60” (r = 0.81, p = 3e-04) and “pink” (r = 0.8, p = 4e-04) were positive correlation modules, involving 600 and 2326 genes, respectively. Meanwhile, “black” (r = −0.74, p = 0.002) and “brown” (r = −0.7, p = 0.004) were negative correlation modules, involving 8605 and 8262 genes, respectively.
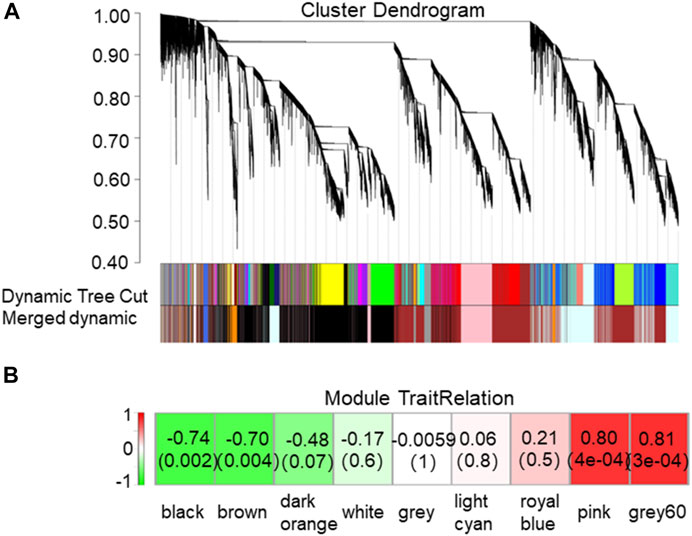
FIGURE 3. Network analysis dendrogram showing modules identified by weighted gene co-expression network analysis (WGCNA). (A) Nine modules, each associated with a leaf in the tree corresponds to an individual gene. (B) Association between modules and traits. The color of each module is the same as that in (A). The left column represents the color scale for module/feature dependencies from -1 to 1. Each cell in the right row contains the corresponding number of correlations and p-values. The bottom line represents the module name corresponding to the cell above.
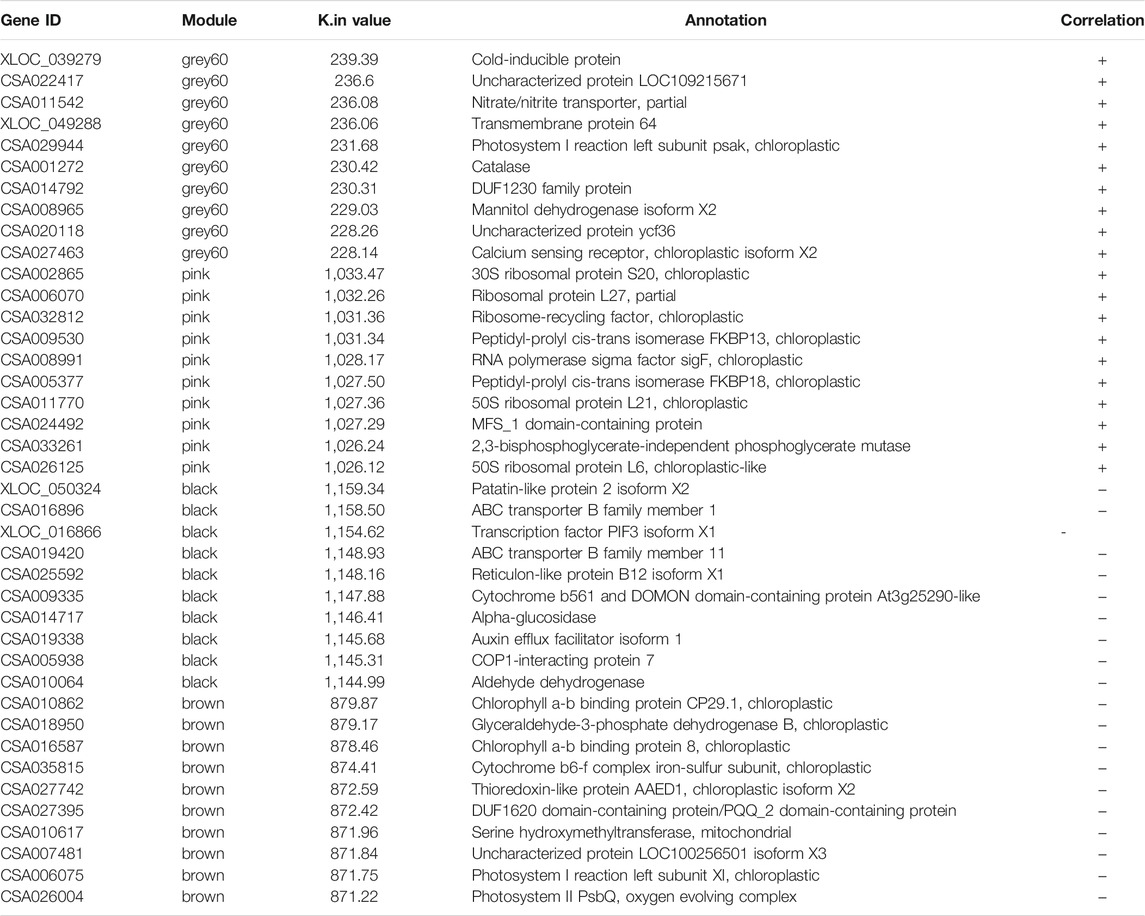
The screening of the key genes (hub genes) in the positive and negative modules was according to the comprehensive consideration of the degree of module correlation and connectivity within the module (all .k within the “K.in value”). The higher the absolute value of the “K.in value”, the more active the function or core position of the gene might have/be. Based on this, the number of “grey60”, 600, was used as the base number and top 600 genes from each other three modules was selected according to the K.in value to perform the KEGG analysis (Figure 4). The result showed that in the metabolism pathway, genes were significantly enriched in three biosynthetic pathways: photosynthesis-antenna proteins (ko00196), photosynthesis (ko00195), and porphyrin and chlorophyII metabolisms (ko00860). To further find out what kinds of specific annotation of high K.in value genes in each module have, ten genes with the highest K.in value as hub genes in each of the two positively correlated modules (“grey60” and “pink”) was selected and analyzed (Table 1). Nine genes in the positive correlation modules were associated with chloroplasts and photosynthesis, including two in “grey60” and seven in “pink” was filtered. The same analysis was performed to the two negative modules of “black” and “brown”. It was worth noting that eight genes were also turned out to be associated with chloroplasts and photosynthesis, in which one belonged to “black” and seven belonged to “brown” (Table 1). Usually, chloroplast-related genes belonging to the photosystem has majority participation in the process of photosynthesis.
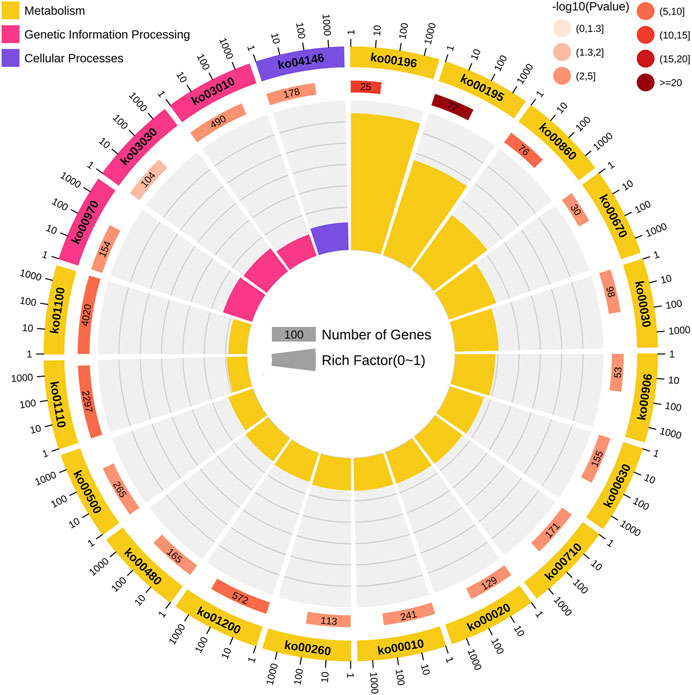
FIGURE 4. Kyoto Encyclopedia of Genes and Genomes (KEGG) pathway enrichment analysis of genes among the four modules with high correlation. From the outermost circle to the inner circle: the first circle represents the path of the top 20 enrichment, and the outside of the circle is the coordinate ruler of the number of genes. Different colors represent different classes. Yellow represents metabolism; pink represents genetic information processing; and purple represents cellular processes. The second circle represents the numbers and p-values of the pathways in the background genes. The more the background numbers of the genes, the longer the bar, and the smaller the p-values, the redder the color. The third circle represents the rich-factor value of each pathway (the number of genes in the pathway divided by all the numbers in the path).
Interestingly, the K.in value of “pink” was much higher than that of “grey60” in the positive modules, and the K.in value of “black” was much higher than that of “brown” in the negative modules. In addition, the K.in value of negative modules was higher than that of positive modules. Thus to sum up for this result, genes in the negative modules were more likely to have more active function or were in the core position, and photosynthesis genes were intensively enriched in affecting the pattern of BR metabolites (Table 1).
Focalization of BR-Accumulation–Related Genes Based on the BR Biosynthetic Pathway (ko00905)
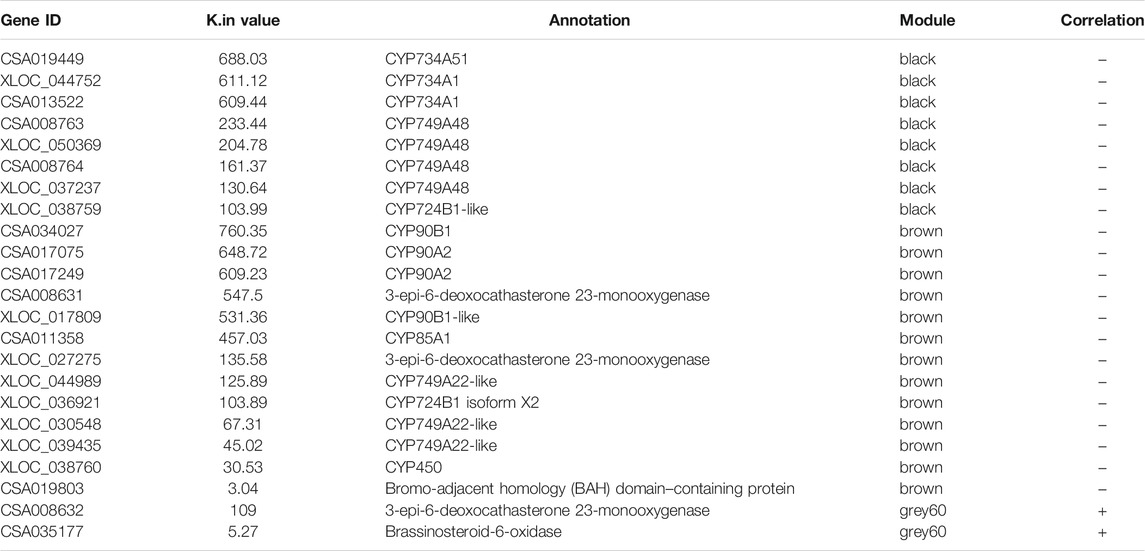
The above part of the analysis was based on the annotation of genes with a high K.in value in the positive and negative modules. In this section, we selected the BR-accumulation–related genes again, first and foremost based on the BR biosynthetic pathway (ko00905) and then considered and combined with their K.in value and expression levels. The analysis began with ko00905 of the BR biosynthetic pathway, screened all the genes in the pathway, then ranked them based on the K.in value, and removed the genes with fairly low expression levels. Twenty-three genes in the BR biosynthetic pathway may contribute significantly to the accumulation mode of CS (Table 2). Among them, twenty-one genes belonged to the negative modules black and brown, and two genes belonged to the positive module “grey60”. Among the twenty-one genes in the negative modules, eight genes belonged to the “black”, and all were CYP450 family members, CYP734A51, CYP734A1, CYP749A48, and CYP724B1-like. The other thirteen genes belonged to the “brown”, in which ten genes belonged to the CYP450 family, CYP90B1, CYP90A2, CYP90B1-like, CYP85A1, CYP749A22-like, CYP724B1 isoform X2, and CYP450; three genes belonged to the BR biosynthetic pathway; two were 3-epi-6-deoxocathasterone 23-monooxygenase; and the other one was coding bromo-adjacent homology (BAH) domain–containing protein. Both genes in the positive module belonged to “grey60”, one of which was 3-epi-6-deoxocathasterone 23-monooxygenase, and the other gene was brassinosteroid-6-oxidase. The electron expressions of the twenty-three genes calculated by their fragments per kilobase of transcript per million mapped reads (FPKM) could be found in Supplementary Figure S2.
Thereby making a summary for this result, genes in the negative modules were likely to have a crucial effect, and the genes belonged to CYP450 family, may play a key role in affecting the BR-accumulation pattern. It was evident from these results that, regardless of which analysis methods were performed, the important genes affecting the accumulation pattern of BR metabolites and gene expression patterns were mainly distributed in the negative correlation modules.
qRT-PCR Verification of Gene Expressions in Positive/Negative Modules
To verify the expression of genes that were screened in the above four modules, twelve genes were selected representatively for qRT-PCR, of which six belonged to the positive modules and six belonged to the negative modules (Figure 5). As it was shown, the expression levels of the twelve genes showed significant differences. In the positive correlation modules, the expression of each gene (the former six genes) in L2 was higher than that in any other tissues. Five of the selected genes showed a trend of rising in Bud–L1–L2, and then decreasing in L2–S1–S2. In the negative modules, the expression of each gene (the later six genes) showed a different trend compared with that in the positive modules. We had further confirmed their consistency in the transcriptome based on FPKM.
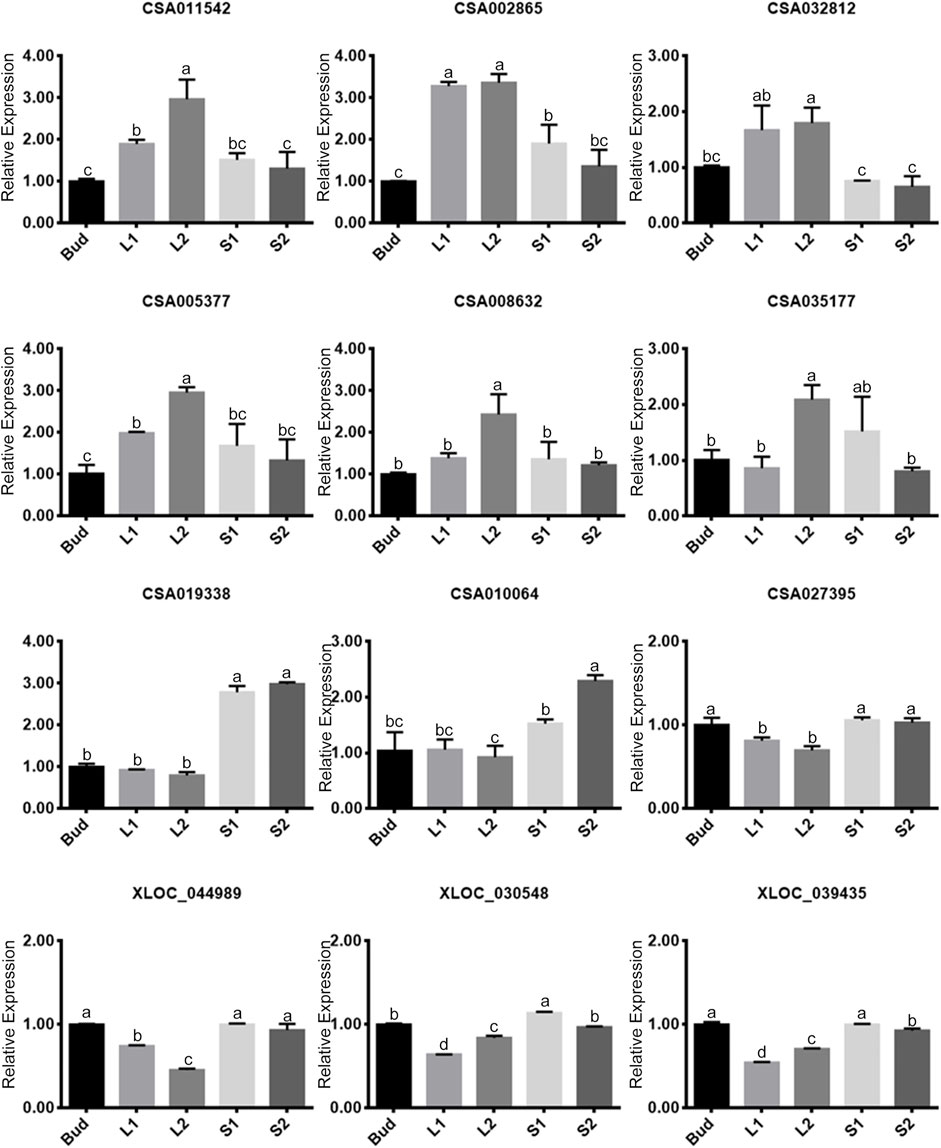
FIGURE 5. Relative expressions of twelve selected genes by quantitative real-time polymerase chain reaction (qRT-PCR). The former six genes belong to positive modules, and the later six genes belong to negative modules. Data values are the mean ± SD of three independent biological samples. Bars labeled with different lower case letters mean significant difference (p-value less than 0.05), while with the same ones mean insignificance (p-value higher than 0.05).
Discussion
Photosynthetic Genes Played an Active Role in the BR-Accumulation Pattern in the New Shoots of Tea Plants
So far, many studies had reported that phytohormones of BR can regulate plant growth and development and respond to stress through photosynthesis. In soybeans, BR increased photosynthesis and chlorophyll content in soybean leaves during water stress, resulting in enhanced chlorophyll synthesis and photosynthetic enzyme activity (Zhang et al., 2008). In peppers, BR mitigated the adverse effects of drought on photosynthesis by significantly attenuating drought-induced photosynthesis and by increasing the dissipation of excitation energy in leave’s photosystemII (PS II) antennae (Hu et al., 2013). Under the condition of long-term low temperature stress, BR maintained the activity of photosynthetic organs and improved the photosynthetic potential of the tung tree. Along with the maintenance of the stability of the leaf structure, morphology, and function, suffering of tung trees from cold stress could be alleviated (Zhang et al., 2019).
In our study, photosynthetic genes were found to be intensively involved in the BR-accumulation pattern in new shoots of the tea plant, by the KEGG analysis and hub-gene screening. Throughout the forty genes with the top K.in values in both positive and negative modules, up to 42.5% of the genes (with nine genes in positive modules and eight genes in negative modules) were related to photosynthesis, including PLP2, chlorophyll a-b binding protein, photosystem I reaction center subunit XI, ribosomal protein, and so on (Table 1). Most photosynthetic genes originated in chloroplasts, where chloroplasts provide the main place for photosynthesis. It is not hard to deduce that photosynthetic genes played an active role in the BR-accumulation pattern in the new shoots of tea plants. Meanwhile, 90–95% of the biological output directly comes from the products of photosynthesis or at least be affected by photosynthesis, such as sugar, caffeine, tea polyphenols, and other substances, which are the main influencing factors in affecting the quality of tea.
A Structural Gene Family, CYP450, May Have Core Effect in BR-Accumulation Pattern
The biosynthetic pathway of BR had been clearly studied, including CN-dependent and CN-independent pathways. In the two branches of the biosynthetic pathway, a variety of cytochrome p450 (CYP450) family genes were involved (Figure 1A), and they are homologous. Of all the eight steps in the direct biosynthesis of BL (CN-independent pathways), five genes belonged to the CYP450 family, and in the CN-dependent pathway, CYP450 family genes participate in half of the catalytic process. CYP450, a mono-oxygenase encoded by the supergene family, is a huge family in the plant kingdom and plays an indispensable role in the metabolic reaction of plants (Nebert et al., 1989). The CYP450 family is involved in a variety of secondary metabolic reactions in plants, including the biosynthesis and metabolism of terpenoids, alkaloids, sterols, fatty acids, and phytohormones (Schuler and Werck-Reichhart, 2003).
Precisely, our results showed that CYP450 family genes were intensively screened by the analysis of combining the BR biosynthetic pathway an the K.in value based on WGCNA and expression levels (Table 2, Supplementary Figure S2). Thus, it could conclude that CYP450 family genes may have a core effect in the accumulation of BR and BR-accumulation pattern. It had been implicated in many studies; in rice, CYP734As acted as a multifunctional multisubstrate enzyme that controlled the content of endogenous bioactive BR by directly inactivating CS and inhibiting CS biosynthesis by reducing the level of BR precursors (Sakamoto et al., 2011). In pea, two CYP85As with CS biosynthetic activity, CYP85A1 (Pisum sativum BR C-6 oxidase 1, also PsBR6ox1) and CYP85A6 (Pisum sativum BR C-6 oxidase 6, also PsBR6ox6), were capable of converting 6-deoxyribonucleic acid to CS (Jager et al., 2007). These results confirmed our deduction that CYP450 genes had an important role in the accumulation of BR and BR-accumulation pattern. Although there have been many reports showing the important role of CYP450 as a “universal biocatalyst”, the study in other plant species such as the tea tree plant is relatively lagging behind than in the model plant Arabidopsis thaliana (Zhu et al., 2019), which needs to be explored in future research.
TFs Affecting BR-Accumulation Pattern by Regulating Structural Genes in BR Biosynthetic Pathway
As is known, TFs are important components in the transcriptional regulatory process which play an important role in plant growth and development (Lai et al., 2019; Romani and Moreno, 2021). In our study, two kinds of TFs were abundantly enriched in positively correlated modules in the BR biosynthetic pathway, bHLH, and MYB/MYB-related families (Figure 6). Up to now, only a small number of studies are on the TFs affecting the accumulation pattern of BR biosynthesis by regulating BR structural genes.GhFP1, a bHLH-coding protein, could activate BR biosynthesis in cotton. Three BR biosynthetic genes, GhCPD (GhCYP90A1), GhDWF4 (GhCYP90B1), and GhDET2 were upregulated in GhFP1 overexpressed fibers and downregulated in GhFP1 RNAi fibers, respectively (Liu et al., 2020). Besides, a BR biosynthetic gene, DWF4 (CYP90B1) could be regulated by three MYB factors (MYB28, MYB34, and MYB122) in Arabidopsis (Guo et al., 2013). Therefore, it is highly likely that TFs such as bHLH and MYB could regulate structural genes in influencing the content and distribution of BR in the new shoots of tea plants.
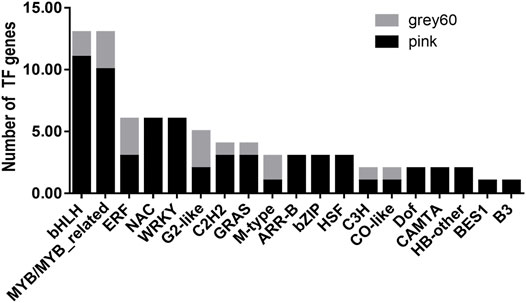
FIGURE 6. The distribution of TFs in the positive correlation modules and the construction of co-expression network. Types and numbers of transcription factors (TFs) genes in “grey60” and “pink” modules.
Another noteworthy thing, a very important TF BRI1-ems-suppressor 1 (BES1) appeared in the “pink” module (Figure 6). According to previous reports, two transcription factors have been identified in the BR signal transduction pathway (Wang et al., 2002; Yin et al., 2002), and BES1 is one of them. After the signal cascade of BR first receptor BRI1 and its co-receptor brassinosteroid insensitive 1(BRI1)–associated kinase receptor 1 (BAK1) was triggered, the negative regulator BRI1 kinase inhibitor 1 (BKI1) was released and the negative regulator brassinosteroid insensitive 2 (BIN2) ceased its activity. This led to the induction and accumulation of two transcription factors BES1 and brassinazole-resistant 1 (BZR1) in the nucleus. Then, activated BES1 and its homologue BZR1 were involved in BR biosynthesis, regulating responsive genes, and affecting plant growth and stress resistance processes (Chen et al., 2019; Li et al., 2019; Cao et al., 2020). BES1 might have been playing an important positive role in the BR signal transduction in the new shoots of tea plants.
Three Conserved miRNA Families May Play Important Roles in Coordinating the BR-Accumulation Pattern
MicroRNAs (miRNAs) were first identified in nematodes almost three decades ago (Lee et al., 1993). Since then, plenty of miRNAs genes were identified in animals, plants, and viruses. MiRNAs are post-transcriptional regulators of a large number of target genes by guiding target mRNAs for degradation or by repressing translation (Zhao and Srivastava, 2007). We knew from the above series of results that the BR biosynthetic pathway was more obviously negatively regulated (Table 1, Table 2). In this study, we constructed a miRNA–TF-target gene network in the negative correlation modules. We introduced one-to-one correspondence data of miRNA-TF-target genes from our previous study focused on the conserved miRNAs and then got the regulation network as in Figure 7 (Zhao et al., 2019), including three miRNAs, five TFs and two down-stream target mRNA genes. From the network, miR160, miR166, and miR172 regulate two target genes belonging to the CYP450 family (CYP734A1 and CYP749A48) through three types of TF genes, ARF, HD-ZIP, and AP2. The CYP450 family genes again showed a high correlation in the BR biosynthetic pathway.
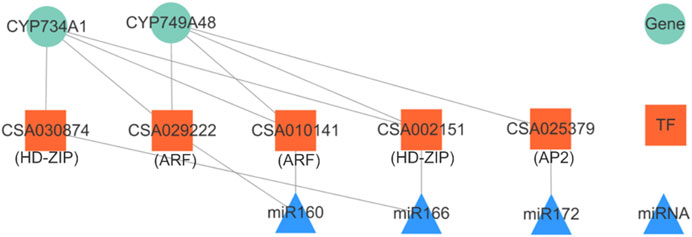
FIGURE 7. miRNA–TF-target genes network in negative correlation modules. The upper triangle represents miRNAs, the middle square represents TFs, and the lowest circle represents target genes.
Consequently, we could conclude that the conserved miRNAs, miR160, miR166, and miR172, might be indispensable in the accumulation of BR and/or its mechanism. Moreover, another network pair miR5168–HD ZIP (CSA015090)–CYP734A51 had also been figured out. Our point of view could also be supported in some studies. In Arabidopsis, miR160 promoted hypocotyl elongation through cleavage of its targets ARF10, ARF16, and ARF17 in the presence of BRZ (a kind of BR biosynthetic inhibitor) (Dai et al., 2020). In addition, we found a potential regulatory relationship between miR160 and CYP734A1, which has not been reported so far. In Arabidopsis, miR172 could regulate vegetative growth patterns by modulating BR sensitivity. Overexpression of miR172 could increase its sensitivity to BR, leading to a partial suppression of the leaf phenotypes of bak1 (Kim et al., 2014).
Feedback Inhibition Might Dominate the Accumulation Pattern of BR
The above results and analysis, whether based on the K.in value or pathway (ko00905), showed that the negative modules played a dominant role in BR accumulation (Table 1, Table 2). This may suggest that the feedback inhibition of BR is very important for maintaining its content balance in plants (Chung et al., 2012). In Arabidopsis, BL treatment reduced the expressions of CPD/CYP90A1, DWF4/CYP90B1, CYP90C1, ROT3/CYP90D1, CYP85A1, and CYP85A2 to approximately 10% or less of the level detected in the control group. They found that in Arabidopsis all CYP85 and CYP90 gene activities are controlled by BR-dependent feedback regulation (Bancos et al., 2002). In rice, high levels of exogenous BR could induce inactivation of GA and inhibit its biosynthetic pathway, resulting in the decrease of the GA level and ultimately inhibiting the cell elongation. The situation of low levels of exogenous BR is the opposite. On the other hand, high levels of GA could promote the signal transduction of BR, while low levels of GA could inhibit the signal transduction and biosynthetic pathway of BR (Tong et al., 2014).
Many examples of spraying exogenous BR had confirmed that the concentration of BR determines whether it plays a positive or negative regulatory role on growth and development. Within a certain concentration range, spraying exogenous BR could promote tobacco leaf elongation, cell division, and expansion along with the increase in the concentration of BR, thus promoting the growth and expansion of tobacco leaves (Zhang J. et al., 2021). High concentrations of BR negatively regulated the stomata movement by inhibiting ABA-induced stomatal closure and the induction and subsequent production of ROS by ABA on some genes involved in reactive oxygen species (ROS) generation in Arabidopsis (Ha et al., 2018). The feedback control of the transcripts of genes in the biosynthetic pathway of BR was also confirmed in our research (related research under review). Besides, the miRNA–TF-target mRNA that might play an indispensable regulatory role could be taken seriously in the future study. It is reasonable to believe that feedback inhibition might dominate the accumulation pattern of BR in tea plants.
Conclusion
Our study centered on the accumulation of BR and its potential mechanism in the new shoots of tea plants. Positive modules and negative modules were classified based on the combination analysis of the content of BR metabolite and the expression levels of all genes according to the RNA-seq of different tissues in the new shoots. Photosynthesis-relevant genes and CYP450 family genes have considerably high probability in affecting the biosythesis of BR and BR-accumulation pattern. Genes with a high K.in value in negative modules have a crucial effect in the accumulation of BR and/or its mechanism. Feedback inhibition might dominate the accumulation pattern of BR in tea plants. Our findings provided a theoretical basis for further study of the regulation of the BR biosynthetic pathway and the possibility of cross-action studies between BR and other hormones in plants.
All the abbreviations in the manuscript could be found in Supplementary Table S4.
Data Availability Statement
The original raw data of the 15 libraries were submitted to the public database with the NCBI Sequence Read Archive Database under accession PRJNA781111.
Author Contributions
LZ and PW conceived the study. HZ, DY, and LZ performed the experiment and analyzed the data. PW and XZ detected the content of BR. ZD provided the transcriptome data. HZ and LZ wrote the paper. All authors read and approved the final manuscript.
Funding
This work was supported by the Nature Science Foundation of the Shandong province (ZR2021MC011) and Graduate Innovation Program of Qingdao Agricultural University (QNYCX20034).
Conflict of Interest
The authors declare that the research was conducted in the absence of any commercial or financial relationships that could be construed as a potential conflict of interest.
Publisher’s Note
All claims expressed in this article are solely those of the authors and do not necessarily represent those of their affiliated organizations, or those of the publisher, the editors, and the reviewers. Any product that may be evaluated in this article, or claim that may be made by its manufacturer, is not guaranteed or endorsed by the publisher.
Acknowledgments
We acknowledge Gene de novo Co., Ltd. at Guangzhou and Metware Biotechnology Co., Ltd. at Wuhan for their assistance in original data processing.
Supplementary Material
The Supplementary Material for this article can be found online at: https://www.frontiersin.org/articles/10.3389/fgene.2021.809608/full#supplementary-material
References
Bajguz, A., Chmur, M., and Gruszka, D. (2020). Comprehensive Overview of the Brassinosteroid Biosynthesis Pathways: Substrates, Products, Inhibitors, and Connections. Front. Plant Sci. 11, 1034. doi:10.3389/fpls.2020.01034
Bancosİ, S., Nomura, T., Sato, T., Molnár, G., Bishop, G. J., Koncz, C., et al. (2002). Regulation of Transcript Levels of the Arabidopsis Cytochrome P450 Genes Involved in Brassinosteroid Biosynthesis. Plant Physiol. 130, 504–513. doi:10.1104/pp.005439
Benjamini, Y., and Hochberg, Y. (1995). Controlling the False Discovery Rate: A Practical and Powerful Approach to Multiple Testing. J. R. Stat. Soc. Ser. B (Methodological) 57, 289–300. doi:10.1111/j.2517-6161.1995.tb02031.x
Cao, X., Khaliq, A., Lu, S., Xie, M., Ma, Z., Mao, J., et al. (2020). Genome‐wide Identification and Characterization of the BES1 Gene Family in Apple ( Malus Domestica ). Plant Biol. J. 22, 723–733. doi:10.1111/plb.13109
Chen, W., Lv, M., Wang, Y., Wang, P.-A., Cui, Y., Li, M., et al. (2019). BES1 Is Activated by EMS1-TPD1-SERK1/2-Mediated Signaling to Control Tapetum Development in Arabidopsis thaliana. Nat. Commun. 10, 4164. doi:10.1038/s41467-019-12118-4
Chung, Y., Choe, V., Fujioka, S., Takatsuto, S., Han, M., Jeon, J.-S., et al. (2012). Constitutive Activation of Brassinosteroid Signaling in the Arabidopsis Elongated-D/bak1 Mutant. Plant Mol. Biol. 80, 489–501. doi:10.1007/s11103-012-9963-5
Conway, S. J., Walcher-Chevillet, C. L., Barbour, K. S., and Kramer, E. M. (2021). Brassinosteroids Regulate Petal spur Length in Aquilegia by Controlling Cell Elongation. Ann. Bot. 128, 931–942. doi:10.1093/aob/mcab116
Dai, X., Lu, Q., Wang, J., Wang, L., Xiang, F., and Liu, Z. (2021). MiR160 and its Target Genes ARF10, ARF16 and ARF17 Modulate Hypocotyl Elongation in a Light, BRZ, or PAC-dependent Manner in Arabidopsis: miR160 Promotes Hypocotyl Elongation. Plant Sci. 303, 110686. doi:10.1016/j.plantsci.2020.110686
Ding, J., Mao, L. J., Yuan, B. F., and Feng, Y. Q. (2013). A Selective Pretreatment Method for Determination of Endogenous Active Brassinosteroids in Plant Tissues: Double Layered Solid Phase Extraction Combined with Boronate Affinity Polymer Monolith Microextraction. Plant Methods 9, 13–19. doi:10.1186/1746-4811-9-13
Divi, U. K., and Krishna, P. (2009). Brassinosteroid: a Biotechnological Target for Enhancing Crop Yield and Stress Tolerance. New Biotechnol. 26, 131–136. doi:10.1016/j.nbt.2009.07.006
Esposito, S., Aversano, R., Bradeen, J., D'amelia, V., and Carputo, D. (2021). Co〆xpression Gene Network (WGCNA) Analysis of Cold‐tolerant Solanum Commersonii Reveals New Insights in Response to Low Temperatures. Crop Sci.
Farooq, M., Wahid, A., Basra, S. M. A., and Islam-ud-Din, D. (2009). Improving Water Relations and Gas Exchange with Brassinosteroids in Rice under Drought Stress. J. Agron. Crop Sci. 195, 262–269. doi:10.1111/j.1439-037x.2009.00368.x
Fujioka, S., Noguchi, T., Sekimoto, M., Takatsuto, S., and Yoshida, S. (2000). 28-Norcastasterone Is Biosynthesized from Castasterone. Phytochemistry 55, 97–101. doi:10.1016/s0031-9422(00)00261-2
Fujioka, S., Takatsuto, S., and Yoshida, S. (2002). An Early C-22 Oxidation branch in the Brassinosteroid Biosynthetic Pathway. Plant Physiol. 130, 930–939. doi:10.1104/pp.008722
Fujioka, S., and Yokota, T. (2003). Biosynthesis and Metabolism of Brassinosteroids. Annu. Rev. Plant Biol. 54, 137–164. doi:10.1146/annurev.arplant.54.031902.134921
Fujita, S., Ohnishi, T., Watanabe, B., Yokota, T., Takatsuto, S., Fujioka, S., et al. (2010). Arabidopsis CYP90B1 Catalyses the Early C-22 Hydroxylation of C27, C28 and C29 Sterols. Plant J. 45, 765–774. doi:10.1111/j.1365-313X.2005.02639.x
Guo, R., Qian, H., Shen, W., Liu, L., Zhang, M., Cai, C., et al. (2013). BZR1 and BES1 Participate in Regulation of Glucosinolate Biosynthesis by Brassinosteroids in Arabidopsis. J. Exp. Bot. 64, 2401–2412. doi:10.1093/jxb/ert094
Ha, Y. M., Shang, Y., Yang, D., and Nam, K. H. (2018). Brassinosteroid Reduces ABA Accumulation Leading to the Inhibition of ABA-Induced Stomatal Closure. Biochem. Biophysical Res. Commun. 504, 143–148. doi:10.1016/j.bbrc.2018.08.146
He, Y., Li, J., Ban, Q., Han, S., and Rao, J. (2018). Role of Brassinosteroids in Persimmon (Diospyros Kaki L.) Fruit Ripening. J. Agric. Food Chem. 66, 2637–2644. doi:10.1021/acs.jafc.7b06117
Hu, W.-h., Yan, X.-h., Xiao, Y.-a., Zeng, J.-j., Qi, H.-j., and Ogweno, J. O. (2013). 24-Epibrassinosteroid Alleviate Drought-Induced Inhibition of Photosynthesis in Capsicum Annuum. Scientia Horticulturae 150, 232–237. doi:10.1016/j.scienta.2012.11.012
Jager, C. E., Symons, G. M., Nomura, T., Yamada, Y., Smith, J. J., Yamaguchi, S., et al. (2007). Characterization of Two Brassinosteroid C-6 Oxidase Genes in Pea. Plant Physiol. 143, 1894–1904. doi:10.1104/pp.106.093088
Kim, B. H., Kwon, Y., Lee, B.-h., and Nam, K. H. (2014). Overexpression of miR172 Suppresses the Brassinosteroid Signaling Defects of Bak1 in Arabidopsis. Biochem. Biophysical Res. Commun. 447, 479–484. doi:10.1016/j.bbrc.2014.04.011
Kim, T. U., Chung, W. O., Kim, Y. O., and Kim, S. I. (2005). 6-Deoxocastasterone and its Biosynthetic Precursors from Primary Roots of Maize. ChemInform 36, 1099–1102. doi:10.1002/chin.200502194
Lai, X., Stigliani, A., Vachon, G., Carles, C., Smaczniak, C., Zubieta, C., et al. (2019). Building Transcription Factor Binding Site Models to Understand Gene Regulation in Plants. Mol. Plant 12, 743–763. doi:10.1016/j.molp.2018.10.010
Langfelder, P., and Horvath, S. (2008). WGCNA: an R Package for Weighted Correlation Network Analysis. BMC Bioinformatics 9, 559. doi:10.1186/1471-2105-9-559
Lee, R. C., Feinbaum, R. L., and Ambros, V. (1993). The C. elegans Heterochronic Gene Lin-4 Encodes Small RNAs with Antisense Complementarity to Lin-14. Cell 75, 843–854. doi:10.1016/0092-8674(93)90529-y
Li, B., Dewey, C. N., and Al, E. (2011). RSEM: Accurate Transcript Quantification from RNA-Seq Data with or without a Reference Genome. BMC Bioinformatics 12, 323–339. doi:10.1186/1471-2105-12-323
Li, Q., Guo, L., Wang, H., Zhang, Y., Fan, C., and Shen, Y. (2019). In Silico genome-wide Identification and Comprehensive Characterization of the BES1 Gene Family in Soybean. Heliyon 5, e01868. doi:10.1016/j.heliyon.2019.e01868
Li, X., Ahammed, G. J., Li, Z.-X., Zhang, L., Wei, J.-P., Shen, C., et al. (2016). Brassinosteroids Improve Quality of Summer Tea (Camellia Sinensis L.) by Balancing Biosynthesis of Polyphenols and Amino Acids. Front. Plant Sci. 7, 1304. doi:10.3389/fpls.2016.01304
Li, X., Wei, J.-P., Ahammed, G. J., Zhang, L., Li, Y., Yan, P., et al. (2018). Brassinosteroids Attenuate Moderate High Temperature-Caused Decline in Tea Quality by Enhancing Theanine Biosynthesis in Camellia Sinensis L. Front. Plant Sci. 9, 1016. doi:10.3389/fpls.2018.01016
Li, X., Zhang, L., Ahammed, G. J., Li, Z.-X., Wei, J.-P., Shen, C., et al. (2017). Nitric Oxide Mediates Brassinosteroid-Induced Flavonoid Biosynthesis in Camellia Sinensis L. J. Plant Physiol. 214, 145–151. doi:10.1016/j.jplph.2017.04.005
Liu, D., Cui, Y., Zhao, Z., Li, S., Liang, D., Wang, C., et al. (2021a). Genome-wide Identification and Characterization of the BES/BZR Gene Family in Wheat and Foxtail Millet. BMC Genomics 22, 682. doi:10.1186/s12864-021-08002-5
Liu, H., Liu, L., Liang, D., Zhang, M., Jia, C., Qi, M., et al. (2021b). SlBES1 Promotes Tomato Fruit Softening through Transcriptional Inhibition of PMEU1. iScience 24, 102926. doi:10.1016/j.isci.2021.102926
Liu, L., Xie, Z., Lu, L., Qanmber, G., Chen, G., Li, S., et al. (2021c). Identification of BR Biosynthesis Genes in Cotton Reveals that GhCPD-3 Restores BR Biosynthesis and Mediates Plant Growth and Development. Planta 254, 75. doi:10.1007/s00425-021-03727-9
Liu, Z., Han, Y., Zhou, Y., Wang, T., Lian, S., and Yuan, H. (2021d). Transcriptomic Analysis of tea Plant (Camellia Sinensis) Revealed the Co-expression Network of 4111 Paralogous Genes and Biosynthesis of Quality-Related Key Metabolites under Multiple Stresses. Genomics 113, 908–918. doi:10.1016/j.ygeno.2020.10.023
Liu, Z. H., Chen, Y., Wang, N. N., Chen, Y. H., Wei, N., Lu, R., et al. (2020). A Basic helix-loop-helix Protein (GhFP1) Promotes Fibre Elongation of Cotton ( Gossypium Hirsutum ) by Modulating Brassinosteroid Biosynthesis and Signalling. New Phytol. 225, 2439–2452. doi:10.1111/nph.16301
Livak, K. J., and Schmittgen, T. D. (2001). Analysis of Relative Gene Expression Data Using Real-Time Quantitative PCR and the 2−ΔΔCT Method. Methods 25, 402–408. doi:10.1006/meth.2001.1262
Minoru, K., Michihiro, A., Susumu, G., Masahiro, H., Mika, H., Masumi, I., et al. (2008). KEGG for Linking Genomes to Life and the Environment. Nucleic Acids Res. 36, 480–484.
Nebert, D. W., Nelson, D. R., Adesnik, M., Coon, M. J., Estabrook, R. W., Gonzalez, F. J., et al. (1989). The P450 Superfamily: Updated Listing of All Genes and Recommended Nomenclature for the Chromosomal Loci. Dna 8, 1–13. doi:10.1089/dna.1.1989.8.1
Oh, M. H., Honey, S. H., and Tax, F. E. (2020). The Control of Cell Expansion, Cell Division, and Vascular Development by Brassinosteroids: A Historical Perspective. Int. J. Mol. Sci. 21. doi:10.3390/ijms21051743
Ohnishi, T., Godza, B., Watanabe, B., Fujioka, S., Hategan, L., Ide, K., et al. (2012). CYP90A1/CPD, a Brassinosteroid Biosynthetic Cytochrome P450 of Arabidopsis, Catalyzes C-3 Oxidation. J. Biol. Chem. 287, 31551–31560. doi:10.1074/jbc.M112.392720
Procházka, P., Štranc, P., Kupka, I., Štranc, J., and Pazderů, K. (2016). Forest Seed Treatment with Brassinosteroids to Increase Their Germination under Stress Conditions. J. Sci. 61, 291–296.
Que, F., Khadr, A., Wang, G.-L., Li, T., Wang, Y.-H., Xu, Z.-S., et al. (2018). Exogenous Brassinosteroids Altered Cell Length, Gibberellin Content, and Cellulose Deposition in Promoting Carrot Petiole Elongation. Plant Sci. 277, 110–120. doi:10.1016/j.plantsci.2018.10.010
Romani, F., and Moreno, J. E. (2021). Molecular Mechanisms Involved in Functional Macroevolution of Plant Transcription Factors. New Phytol. 230, 1345–1353. doi:10.1111/nph.17161
Sakamoto, T., Kawabe, A., Tokida-Segawa, A., Shimizu, B.-i., Takatsuto, S., Shimada, Y., et al. (2011). Rice CYP734As Function as Multisubstrate and Multifunctional Enzymes in Brassinosteroid Catabolism. Plant J. 67, 1–12. doi:10.1111/j.1365-313x.2011.04567.x
Schuler, M. A., and Werck-Reichhart, D. (2003). Functional Genomics of P450s. Annu. Rev. Plant Biol. 54, 629–667. doi:10.1146/annurev.arplant.54.031902.134840
Soares, T. F. S. N., Dias, D. C. F. d. S., Oliveira, A. M. S., Ribeiro, D. M., and Dias, L. A. d. S. (2020). Exogenous Brassinosteroids Increase lead Stress Tolerance in Seed Germination and Seedling Growth of Brassica Juncea L. Ecotoxicology Environ. Saf. 193, 110296. doi:10.1016/j.ecoenv.2020.110296
Tong, H., Xiao, Y., Liu, D., Gao, S., Liu, L., Yin, Y., et al. (2014). Brassinosteroid Regulates Cell Elongation by Modulating Gibberellin Metabolism in Rice. Plant Cell 26, 4376–4393. doi:10.1105/tpc.114.132092
Toshiyuki, , and Ohnishi, (2018). Recent Advances in Brassinosteroid Biosynthetic Pathway: Insight into Novel Brassinosteroid Shortcut Pathway. J. Pestic. Sci. 43, 159–167. doi:10.1584/jpestics.D18-040
Trapnell, C., Williams, B. A., Pertea, G., Mortazavi, A., Kwan, G., Van Baren, M. J., et al. (2010). Transcript Assembly and Quantification by RNA-Seq Reveals Unannotated Transcripts and Isoform Switching during Cell Differentiation. Nat. Biotechnol. 28, 511–515. doi:10.1038/nbt.1621
Wang, L., Yu, P., Lyu, J., Hu, Y., Han, C., Bai, M. Y., et al. (2021). BZR1 Physically Interacts with SPL9 to Regulate the Vegetative Phase Change and Cell Elongation in Arabidopsis. Int. J. Mol. Sci. 22. doi:10.3390/ijms221910415
Wang, Z.-Y., Nakano, T., Gendron, J., He, J., Chen, M., Vafeados, D., et al. (2002). Nuclear-localized BZR1 Mediates Brassinosteroid-Induced Growth and Feedback Suppression of Brassinosteroid Biosynthesis. Developmental Cell 2, 505–513. doi:10.1016/s1534-5807(02)00153-3
Yin, Y., Wang, Z.-Y., Mora-Garcia, S., Li, J., Yoshida, S., Asami, T., et al. (2002). BES1 Accumulates in the Nucleus in Response to Brassinosteroids to Regulate Gene Expression and Promote Stem Elongation. Cell 109, 181–191. doi:10.1016/s0092-8674(02)00721-3
Yuan, L. B., Peng, Z. H., Zhi, T. T., Zho, Z., Liu, Y., Zhu, Q., et al. (2015). Brassinosteroid Enhances Cytokinin-Induced Anthocyanin Biosynthesis in Arabidopsis Seedlings. Biol. Plant. 59, 99–105. doi:10.1007/s10535-014-0472-z
Zhang, F., Lu, K., Gu, Y., Zhang, L., Li, W., and Li, Z. (2019). Effects of Low-Temperature Stress and Brassinolide Application on the Photosynthesis and Leaf Structure of Tung Tree Seedlings. Front. Plant Sci. 10, 1767. doi:10.3389/fpls.2019.01767
Zhang, J., Zhang, Y., Khan, R., Wu, X., Zhou, L., Xu, N., et al. (2021a). Exogenous Application of Brassinosteroids Regulates Tobacco Leaf Size and Expansion via Modulation of Endogenous Hormones Content and Gene Expression. Physiol. Mol. Biol. Plants 27, 847–860. doi:10.1007/s12298-021-00971-x
Zhang, M., Zhai, Z., Tian, X., Duan, L., and Li, Z. (2008). Brassinolide Alleviated the Adverse Effect of Water Deficits on Photosynthesis and the Antioxidant of Soybean (Glycine max L.). Plant Growth Regul. 56, 257–264. doi:10.1007/s10725-008-9305-4
Zhang, Z., Zhao, X., Zhang, Z., Huang, X., Zhang, L., and Sun, P. (2021b). Cellulose Accumulation in the Secondary Cell walls Is Negatively Correlated with the Tenderness of New Shoots in Camellia Sinensis. Physiol. Plant 172, 1700–1710. doi:10.1111/ppl.13376
Zhao, L., Chen, C., Wang, Y., Shen, J., and Ding, Z. (2019). Conserved MicroRNA Act Boldly during Sprout Development and Quality Formation in Pingyang Tezaocha (Camellia Sinensis). Front. Genet. 10, 237. doi:10.3389/fgene.2019.00237
Zhao, Y., and Srivastava, D. (2007). A Developmental View of microRNA Function. Trends Biochem. Sci. 32, 189–197. doi:10.1016/j.tibs.2007.02.006
Zhong, C., Patra, B., Tang, Y., Li, X., Yuan, L., and Wang, X. (2021). A Transcriptional Hub Integrating Gibberellin-Brassinosteroid Signals to Promote Seed Germination in Arabidopsis. J. Exp. Bot. 72, 4708–4720. doi:10.1093/jxb/erab192
Keywords: BR-accumulation pattern, BR biosynthetic pathway, feedback inhibition, new shoots of tea plants, negative correlation module
Citation: Zhang H, Yang D, Wang P, Zhang X, Ding Z and Zhao L (2022) Feedback Inhibition Might Dominate the Accumulation Pattern of BR in the New Shoots of Tea Plants (Camellia sinensis). Front. Genet. 12:809608. doi: 10.3389/fgene.2021.809608
Received: 05 November 2021; Accepted: 28 December 2021;
Published: 22 February 2022.
Edited by:
Vinod K. K., Indian Agricultural Research Institute (ICAR), IndiaReviewed by:
Ashokraj Shanmugam, UPASI Tea Research Foundation, IndiaMa Chun Lei, Tea Research Institute (CAAS), China
Wenyan Han, Tea Research Institute (CAAS), China
Copyright © 2022 Zhang, Yang, Wang, Zhang, Ding and Zhao. This is an open-access article distributed under the terms of the Creative Commons Attribution License (CC BY). The use, distribution or reproduction in other forums is permitted, provided the original author(s) and the copyright owner(s) are credited and that the original publication in this journal is cited, in accordance with accepted academic practice. No use, distribution or reproduction is permitted which does not comply with these terms.
*Correspondence: Zhaotang Ding, ZHp0dGVhQDE2My5jb20=; Lei Zhao, emhhb2xlaV90ZWFAMTYzLmNvbQ==
 Hanghang Zhang
 Dong Yang
 Peiqiang Wang
 Xinfu Zhang
 Zhaotang Ding
 Lei Zhao