- 1School of Electronic and Communication Engineering, Shenzhen Polytechnic, Shenzhen, China
- 2Institute of Fundamental and Frontier Sciences, University of Electronic Science and Technology of China, Chengdu, China
- 3School of Information, Shanxi University of Finance and Economics, Taiyuan, China
- 4Research Institute of Big Data Science and Industry, Shanxi University, Taiyuan, China
- 5School of Life Science, Shanxi University, Taiyuan, China
- 6Beidahuang Industry Group General Hospital, Harbin, China
Unexplained genetic variation that causes complex diseases is often induced by gene-gene interactions (GGIs). Gene-based methods are one of the current statistical methodologies for discovering GGIs in case-control genome-wide association studies that are not only powerful statistically, but also interpretable biologically. However, most approaches include assumptions about the form of GGIs, which results in poor statistical performance. As a result, we propose gene-based testing based on the maximal neighborhood coefficient (MNC) called gene-based gene-gene interaction through a maximal neighborhood coefficient (GBMNC). MNC is a metric for capturing a wide range of relationships between two random vectors with arbitrary, but not necessarily equal, dimensions. We established a statistic that leverages the difference in MNC in case and in control samples as an indication of the existence of GGIs, based on the assumption that the joint distribution of two genes in cases and controls should not be substantially different if there is no interaction between them. We then used a permutation-based statistical test to evaluate this statistic and calculate a statistical p-value to represent the significance of the interaction. Experimental results using both simulation and real data showed that our approach outperformed earlier methods for detecting GGIs.
1 Introduction
Genome-wide association studies (GWAS) has been used to investigate the associations between genetic variants and complex disorders with great success. Researchers have discovered more than 71,000 unique single nucleotide polymorphisms (SNPs) associated to diseases throughout the last decade (Hindorff et al., 2009; Zhang et al., 2016; Zeng et al., 2017; Guo et al., 2018; Buniello et al., 2019; Loos, 2020; Li et al., 2021). Traditional GWAS, on the other hand, concentrated on the independent, additive, and cumulative effects of individual SNPs on specific diseases. The majority of associated SNPs are common genetic variants with small effects that only explain a portion of complex disease heritability. Many genes, environmental variables, and interactions play a crucial role in the underlying genetic architecture of complex diseases (Cordell, 2009; Moore et al., 2010; Jiang et al., 2018; Liu et al., 2018; Liu et al., 2019a; Zhang et al., 2019; Chen et al., 2020; Luo et al., 2020; Liu et al., 2021; Shao et al., 2021; Su et al., 2021; Wang et al., 2021). As a result, genetic interactions are thought to enlighten studies into “missing heritability” (Manolio et al., 2009; Fang et al., 2019; Young, 2019; Tang et al., 2020; Song et al., 2021) and give important knowledge for constructing topologies for complex disease-related pathway.
Genetic interaction was originally explored at the SNP level, named epistasis. Methods (Li et al., 2015a; Ritchie and Van Steen, 2018; Lyu et al., 2020) can be classified into three categories based on their search strategy: exhaustive methods, searching methods, and machine learning-based methods, such as statistics based on entropy (Dong et al., 2008) and odds-ratios (Emily, 2012); MDR (Ritchie et al., 2003), BEAM (Zhang and Liu, 2007), BOOST (Wan et al., 2010), Epi-GTBN (Guo et al., 2019), GenEpi (Chang et al., 2020), and some accelerate methods (Nobre et al., 2021). For example, a logistic regression analysis revealed a significant interaction between the genes ERAP1 (rs27524) and HLA-C (rs10484554) in psoriasis (
The effectiveness of gene-based methods in GWAS marginal association studies should be extended to the study of gene-gene interaction (GGIs) (Emily, 2018; Emily et al., 2020). This strategy offers a number of possible benefits. For starters, it often has substantially fewer genes than SNPs, which dramatically decreases the number of pairwise testing. To discover GGIs in pair of 20,000 genes, for example,
Many statistical and computational approaches for detecting gene-based GGIs have been established. Peng et al.(Peng et al., 2010) introduced the canonical correlation-based U statistic (CCU). They calculated canonical correlation of two genes in both cases and controls. They next used CCU to calculate the difference in correlation, which revealed the presence of GGIs between the two genes. However, this strategy only considered linear correlation in the study. CCU was then expanded to Kernelized CCU (KCCU) (Yuan et al., 2012; Larson et al., 2013), where the kernel discovered a nonlinear relationship. Emily (Emily, 2016) recently introduced AGGrGATOr, a method that combines p-values of interaction tests at the marker-level to assess how a pair of genes interacted, which was a strategy that Ma et al. (Ma et al., 2013) previously utilized to discover interactions under quantitative traits. GBIGM is a non-parametric entropy-based approach suggested by Li et al. (Li et al., 2015b).
In this paper, we propose a new approach called gene-based, gene-gene interaction through a maximal neighborhood coefficient (GBMNC), which uses the maximal neighborhood coefficient (MNC) (Cheng et al., 2020) to identify gene-gene interaction of complex diseases at the gene-level in case-control studies. MNC measures a wide variety of dependence with no bias toward relationship types between two random vectors of arbitrary, but not necessarily equal, dimensions; this is superior to Pearson’s correlation, which only consider linear correlations. We introduced a statistic that uses the difference of MIC in cases and controls as an indicator of occurrence of GGIs, bases on the assumption that the joint distribution of two genes should not be significantly different in case and in control samples if there is no interaction between them (i.e. independent) under complex diseases. In simulation studies, our method exhibited an outstanding performance in recognizing the underlying GGIs at the gene level under a variety of conditions. Its application using real data sets showed accurate identification of GGIs.
2 Materials and Methods
The statistical procedure for GBMNC is described in depth in this section. We give different parameter settings for simulation studies to evaluate the power to identify GGIs and the ability to control type-I error. Then, we adopted a real-world Rheumatoid Arthritis data set from the WTCCC (Wellcome Trust case Control Consortium) database to evaluate out method’s effectiveness in a real situation.
2.1 GBMNC
2.1.1 Preliminaries and Notation
Here, we take genes, a couple of SNPs, as the basic unit. Suppose that we have
where
and
In this work, to investigate whether there is a statistical interaction between two genes in a qualitative phenotype, we designed a statistic based on the maximal neighborhood coefficient to characterize the GGI intensity. We applied a permutation strategy to estimate the distribution of the statistic. Our approach was based on the intuition that, if there was no interaction between two genes, then, if they were independent of the case set, they should be independent of the control set; if they were dependent on the case set, they should be dependent on the control set as well, and the “strength” of such dependence should be the same for the case and control sets. Pearson’s correlation coefficient measures the degree of dependence between two random variables. However, it can only measure linear dependency and not nonlinear dependency, and it is not very convenient for random variables that take a value in
2.1.2 Maximal Neighborhood Coefficient
MNC is an association measure that decipher the potential complex associations from neighborhood insight. It assumes that if a relationship exists between two variables, the samples of each variable will appear to have a similar neighborhood tendency to approximate that relationship, and MNC can find those common neighborhood structures by exploring the possible neighborhoods of each variable. By introducing a
Let
MNC is defined based on the neighborhood characteristic matrix (NM) of a sample set
Based on the equation above, the neighborhood mutual information of
With the definition of
where
MNC Satisfies the Following Properties
1) Symmertry:
2) Comparability:
3) Generality:
4) Equitability:
2.1.3 Illustration of the GBMNC Workflow
Assume there are
To get a p-value, we needed to estimate the distribution of
We summarized the process of GBMNC in the algorithm below (Algorithm 1) and presented the overall workflow (Figure 1).
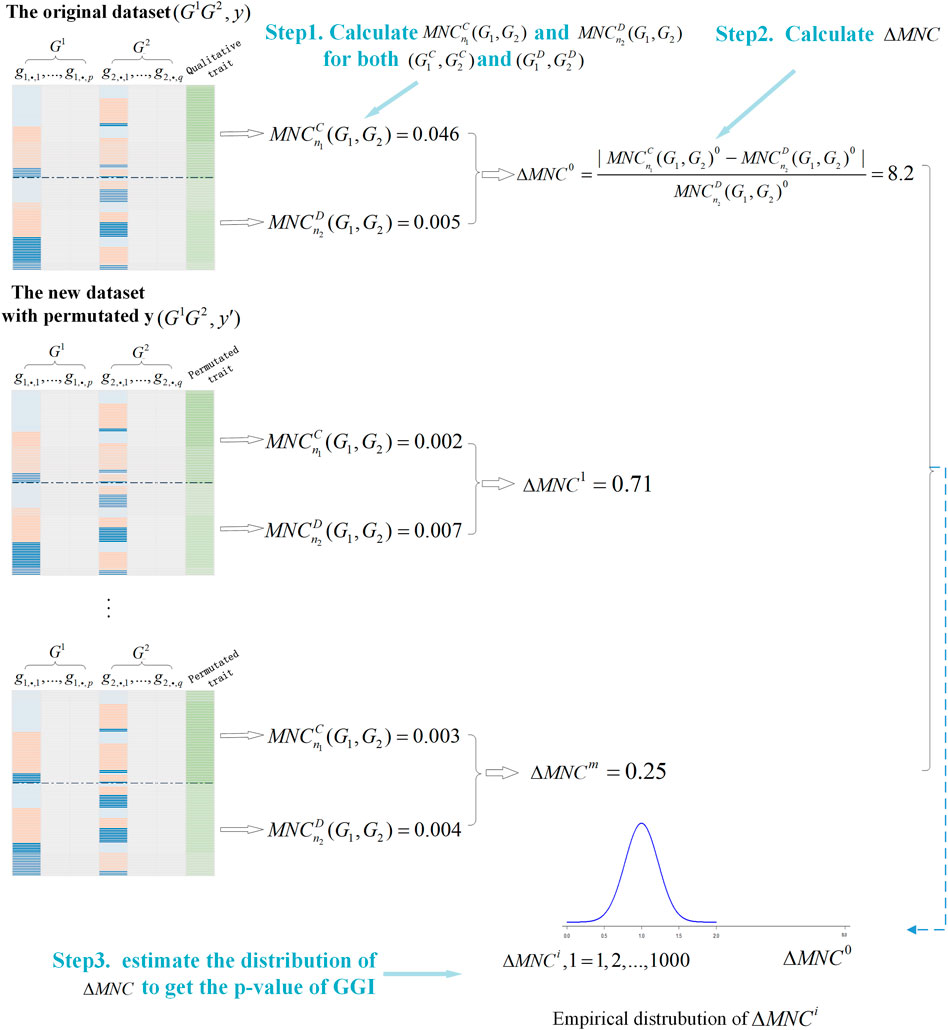
FIGURE 1. Illustration of the Gene-Based gene-gene interaction through a Maximal Neighborhood Coefficient (GBMNC) workflow for detection of gene-based, gene-gene interaction.
Algorithm 1 GBMNC
Data: Genotype
Result: significant p-value for interaction between
1 Calculate
2 Calculate the difference
3 for
4 Randomly permute label
5 Repeat Steps 1 and 2;
6 end
7 Estimated p-value of
2.2 Simulation Study
To assess the performance of GBMNC to control type I error and the power to detect GGIs, we compared GBMNC with KCCA (Larson et al., 2013), GBIGM (Li et al., 2015b), and AGGrEGATOr (Emily, 2016).
2.2.1 Simulation With GAMETES
The goal of this simulation study was to evaluate the performance of the GBMNC procedure to detect gene-gene interaction. We set all simulated datasets to have 50 SNPs. Among them, two SNPs were functional, and the remaining 48 SNPs were non-functional. The 50 SNPs formed five genes, and each had 10 SNPs. The two functional SNPs were put into the first and second genes. We chose the publicly available tool GAMETES (Urbanowicz et al., 2012) to generate the simulated genotype data. This tool was designed to generate pure and strict epistasis models. Pure and strict epistasis models are the most difficult disease-related patterns to identify. Such associations can only be observed if all n-loci are included in the disease model. This requirement makes these types of models an attractive gold standard for simulation studies of complex multi-locus effects.
Evaluation of Type-I error: The type-I error indicates the ability of a method to reject the null hypothesis when it is true (i.e., the false positive rate). We used GAMETES to generate the custom disease model (Table 1) with one causal SNP pair.
Evaluation of power of the test: The power of a test indicates the probability that the method rejects the null hypothesis correctly when the alternative hypothesis is true. In this simulation study, we generated 100 data sets for each parameter settings. The power under each parameter setting was expressed by the frequency, and the null hypothesis of the data set was rejected correctly at the significance level of
1) To assess the impact of heritability
2) To evaluate the influence of sample size, we set heritability to be 0.025, MAF
For GBMNC, KCCU, AGGrEGATOr, and GBIGM, if the number of data sets with a significance level less than
GBIGM and AGGrEGATOr methods are nonparametric methods, so no parameters need to be specific. We only set the ratio of the trimmed jackknife to 0.05 (
2.3 Experiments Using Rheumatoid Arthritis Data
To evaluate GBMNC’s ability to process real GGIs in a qualitative data set, we analyzed the susceptibility of a series of pairs of genes in Rheumatoid Arthritis (RA). RA is a chronic autoimmune disease that causes pannus development and cartilage and bone loss in synovial joints. It leads to progressive bone deterioration and interferes with bone repair. In this work, we used the WTCCC (2007) data set, which includes genotype data from the British population obtained by the Affymetrix GeneGhip 500 k. Our dataset was pre-processed in the following ways:
1) We used pathway hsa05323 from the KEGG pathway database to validate the GGIs in the RA. The WTCCC data set’s genotyping coordinates can be found in UCSC hg18/NCBI Build36. This pathway contained 90genes. Many of the genes belonged to the protein combinations MHCII and V-ATPase. Because numerous GGIs happened on their own, we only chose representative genes from each protein combination and then remove the others. Finally, 48genes remained, resulting in a total of
2) We collected the detailed gene information from the NCBI Build36 annotation file, and for each gene, we inserted a 10 kb buffer region both downstream and upstream of the originally defined gene location. For each gene, all SNPs within the area were chosen.
3) According to the quality control of GWAS, samples that included gender that did not match the chromosome X heterozygote rates were removed. SNPs were also removed if any of the following requirements were met: the missing rate in the sample was
3 Results and Discussion
The experimental environment for all the following results was a workstation with an Intel Xeon CPU E5-2,620 v2 at 2.10GHz, 96 GB of DDR3, and python3.6.
3.1 Simulation Study
3.1.1 Evaluation of Type-I Error
For type-I error, we varied the sample size from 1,000 to 5,000. Except for GBIGM with

TABLE 2. Type-I error for KCCU, GBIGM, AGGrEGATOr, and GBMNC when varying the sample size from 1,000 to 5,000.
3.1.2 Evaluation of the Power of GBMNC
Impact of heritability: To evaluate the statistical power of our GBMNC and the other three methods, we used 10 heritability-MAF combinations, with a population prevalence of 0.2, a sample size of 4,000, and heritability that varied from 0.01 to 0.2 (Table 3). The bold in Table 3 shows the best-performed method in each model under a given heritability-MAF combination. Notice that a larger value indicates better performance. On average, GBMNC was the best performing algorithm in this comparison. It largely outperformed the other methods, but not for all the data sets; it was inferior to AGGrEGATOr for some data sets. However, its performance was remarkably consistent, and it was the top performer for most data sets. AGGrEGATOr achieved the same performance when MAF was 0.2 and heritability was >0.05.
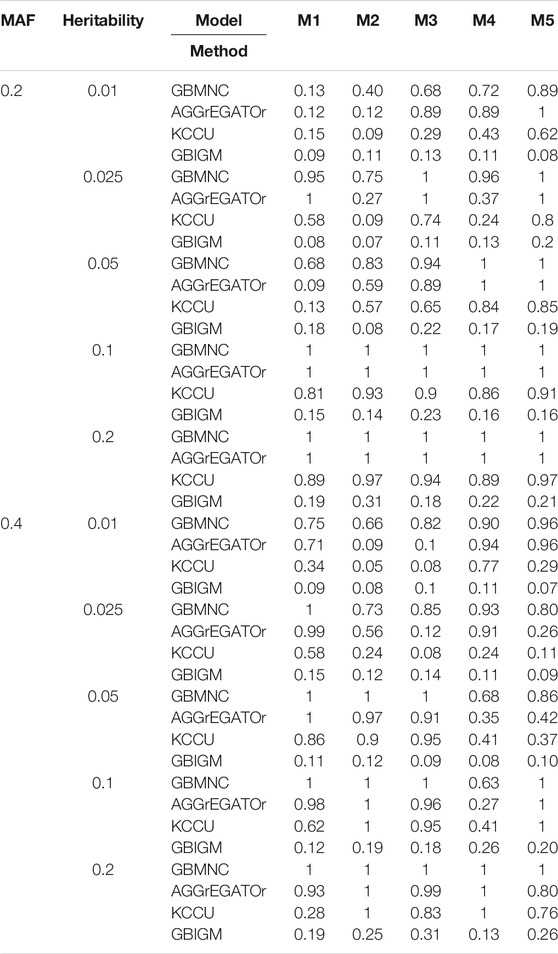
TABLE 3. The statistical power of simulation studies for GBMNC, AGGrEGATOr, KCCU and GBIGM under 10 heritability-MAF combinations, with
The power of all the methods was significantly affected by heritability (i.e., the effect size of interaction) (Table 4). A larger heritability led to better performance for all methods under a specific MAF. When heritability varied from 0.01 to 0.025, GBMNC almost doubled its power for a given sample size of 4,000 with MAF
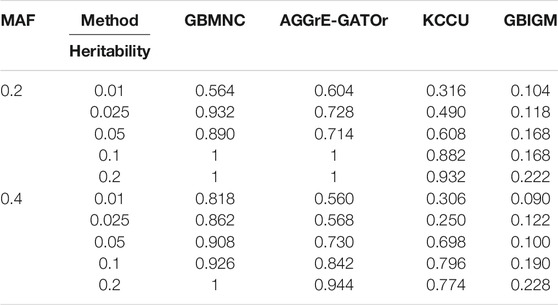
TABLE 4. Average power for GBMNC, AGGrEGATOr, KCCU, and GBIGM under 10 heritability-MAF combinations, with heritability
It is worth noting that under the same combination of habitability and MAF, GBMNC was more stable under models with different COR compared with AGGrEGATOr (Figure 2). KCCU detected the interaction of some simulated disease models in our study, and it had a similar performance pattern with AGGrEGATOr. However, AGGrEGATOr was much more powerful in most of the simulated scenarios. GBIGM had little power to detecting pure gene-gene interaction,. This result replicated Emily's (Emily, 2016) result of the simulation.
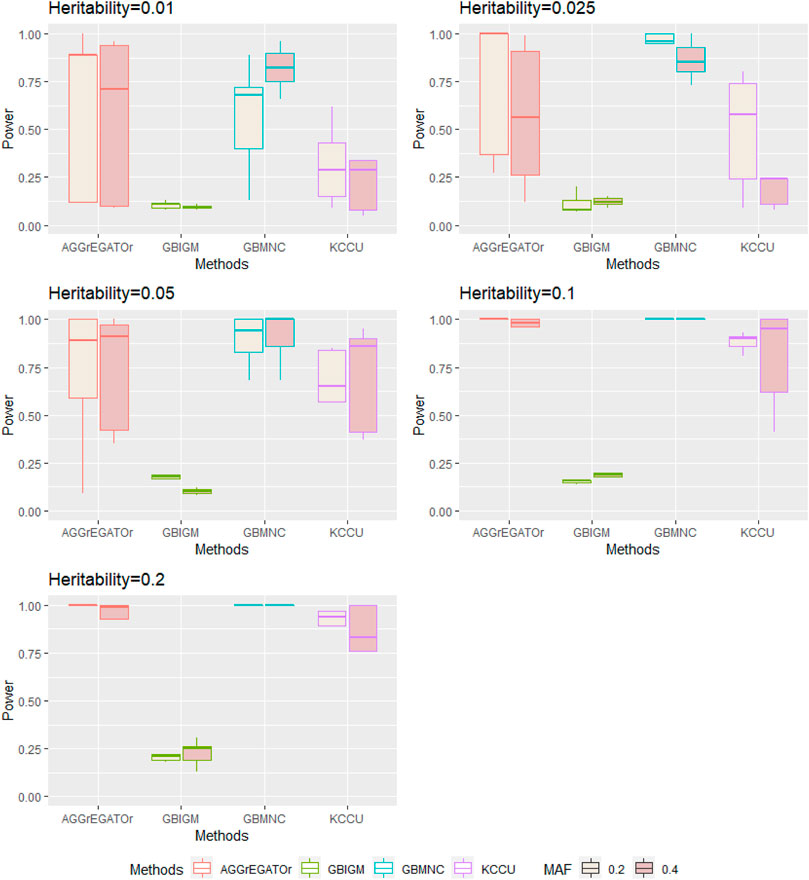
FIGURE 2. Illustration of the distribution of power of each method in each heritability-MAF combination with
Impact of sample size: The sample size of the data set had a considerable effect on power. Let the sample size be
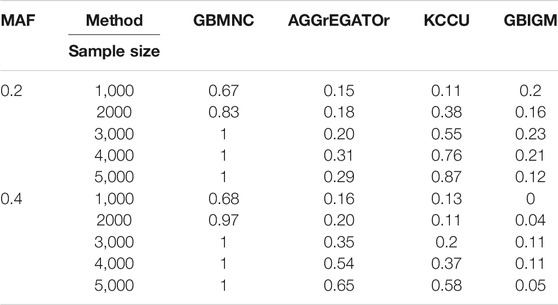
TABLE 5. The statistical power of simulation studies for GBMNC, AGGrEGATOr, KCCU, and GBIGM under models with
In conclusion, in simulated studies, our results showed that GBMNC detected gene-gene interaction effectively, in which a pair of SNPs was a causal factor by the purely and strictly epistasis model without main effect, which can only be observed if all 2-loci are included in the disease model. Compared with other methods, GBMNC identified a broad range of epistatic signals accurately.
3.2 Experiments Using Rheumatoid Arthritis Data
RA is a chronic autoimmune disease where HLA genes, TNF family, and TRAF1 are important genetic risk factors in the development. Each unique gene pair of the hsa05323 pathway was evaluated in the RA study, which resulted in
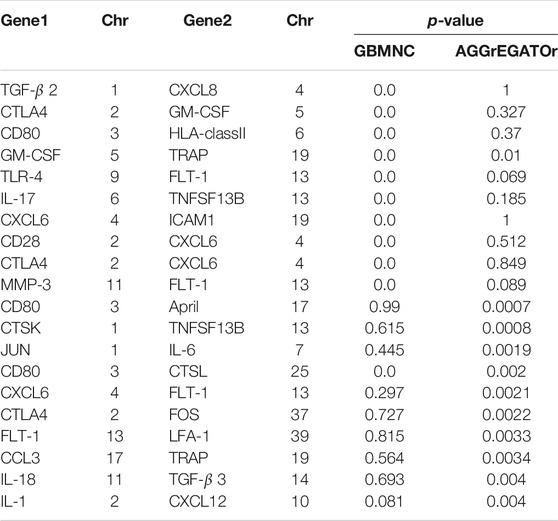
TABLE 6. The calculated p-value for the 20 gene pairs using GBMNC and AGGrEGATOr. p-values in bold font indicate that they are significant. The “Chr” column indicates the chromosome number of the human genome where the gene is located.
We found that some of our findings were supported by prior research (Xiao et al., 2008; Klocke et al., 2016; Cen et al., 2019). For instance, our method detected a significant interaction between IL17 and TNFSF13B. Studies (Xiao et al., 2008) show that both B cells and T cells formed aggregates in the synovium of inflamed joints and mediated the pathogenesis of RA, and B-cell-activating factor (BAFF, also named TNFSF13B, BLys) played a vital role in B-cell survival and maturation. After activation and expansion, CD4+ T cells developed into different T helper cell subsets with different cytokine profiles and distinct effector functions. In addition to Th1 and Th2 cells, Th17 cells were a third T helper cell and produce IL-17. Th17 cells can recruit and activate inflammatory cells and they have been recognized as a primary cause of bone destruction and inflammation in autoimmune diseases. BAFF promoted Th17 cell proliferation and expansion preferentially (Lai Kwan Lam et al., 2008). IL-17 was a key cytokine for BAFF-mediated proinflammatory effects during collagen-induced arthritis pathogenesis. Only one pair of potential interactions between CD80 and CTSL was captured by both methods within the top 10 GGIs. However, there is not yet direct evidence to show the interaction between CD80 and CTSL.
4 Conclusion
The study of detecting GGIs is of great importance in understanding the pathogenesis of complex human diseases. In this paper, we proposed a gene-based GGI detection method called GBMNC based on a maximal neighborhood coefficient and a permutation strategy for case-control studies in GWAS. The method not only benefited from the ability of a maximal neighborhood coefficient, which considered the neighborhood structure of each sample and captured a wide range of associations, but also from the robustness of our permutation-based hypothesis testing scheme.
We designed a statistic to capture the different intensities of interaction between two genes in both cases and controls, then transformed the problem of GGI detection into a form of hypothesis testing; our null hypothesis was there was no significant difference in the relationship between the two genes in the disease data and the control data. This hypothesis did not limit the form of interaction between genes, and it enhanced the method’s ability to detect different types of interactions. We demonstrated the effectiveness of our method through a simulation study and retrospective analysis of rheumatoid arthritis. Under a large range of settings, GBMNC outperformed previous methods in the power to detect GGIs. The statistical power of our method increased monotonically with the increase in the heritability and the MAF. The method was also stable to sample size based on a test of false positive rates. MNC did not restrict the dimension of two random vectors. Therefore, it is possible to generalize the method for marker-based detection of gene pairs that are identified as interactive. Investigating the mechanism of gene-based interaction at the marker level might point the way for further research. In summary, GBMNC is a helpful addition to the current toolbox of statistical models to elucidate GGIs in case-control studies.
Data Availability Statement
Publicly available datasets were analyzed in this study. This data can be found here: https://www.wtccc.org.uk/info/access_to_data_samples.html.
Author Contributions
YG: Conceptualization, Methodology, Investigation, Funding acquisition, Writing-Original Draft. HC: Methodology, Formal analysis, Writing-Original Draft. ZY: Software, Formal analysis. ZL: Resources, Data Curation. YW: Formal analysis, Writing-Review and Editing. DD: Conceptualization, Project administration.
Funding
The work was supported by the National Natural Science Foundation of China (No. 62002243, No. 31900306), the Post-doctoral Foundation Project of Shenzhen Polytechnic China (6020330004K), the Post-doctoral Foundation Project of Shenzhen Polytechnic China (6020330004K). Scientific and Technological Innovation Programs of Higher Education Institutions in Shanxi (2021L286).
Conflict of Interest
The authors declare that the research was conducted in the absence of any commercial or financial relationships that could be construed as a potential conflict of interest.
Publisher’s Note
All claims expressed in this article are solely those of the authors and do not necessarily represent those of their affiliated organizations, or those of the publisher, the editors and the reviewers. Any product that may be evaluated in this article, or claim that may be made by its manufacturer, is not guaranteed or endorsed by the publisher.
References
Buniello, A., MacArthur, J. A. L., Cerezo, M., Harris, L. W., Hayhurst, J., Malangone, C., et al. (2019). The NHGRI-EBI GWAS Catalog of Published Genome-wide Association Studies, Targeted Arrays and Summary Statistics 2019. Nucleic Acids Res. 47 (D1), D1005–D1012. doi:10.1093/nar/gky1120
Cai, L., Wang, L., Fu, X., Xia, C., Zeng, X., and Zou, Q. (2020). ITP-pred: an Interpretable Method for Predicting, Therapeutic Peptides with Fused Features Low-Dimension Representation. Brief. Bioinform. 22 (4), bbaa367. doi:10.1093/bib/bbaa367
Cen, S., Wang, P., Xie, Z., Yang, R., Li, J., Liu, Z., et al. (2019). Autophagy Enhances Mesenchymal Stem Cell-Mediated CD4+ T Cell Migration and Differentiation through CXCL8 and TGF-Β1. Stem Cel Res Ther. 10 (1), 265. doi:10.1186/s13287-019-1380-0
Chang, Y.-C., Wu, J.-T., Hong, M.-Y., Tung, Y.-A., Hsieh, P.-H., Yee, S. W., et al. (2020). GenEpi: Gene-Based Epistasis Discovery Using Machine Learning. BMC Bioinformatics 21 (1), 68. doi:10.1186/s12859-020-3368-2
Chen, L., Li, J., and Chang, M. (2020). Cancer Diagnosis and Disease Gene Identification via Statistical Machine Learning. Curr. Bioinformatics 15 (9), 956–962. doi:10.2174/1574893615666200207094947
Cheng, H., Liang, J., Qian, Y., and Hu, Z. (2020). Association Mining Method Based on Neighborhood Perspective. Sci. Sin.-Inf. 50 (6), 824–844. doi:10.1360/ssi-2020-0009
Cordell, H. J. (2009). Detecting Gene-Gene Interactions that Underlie Human Diseases. Nat. Rev. Genet. 10 (6), 392–404. doi:10.1038/nrg2579
Dong, C., Chu, X., Wang, Y., Wang, Y., Jin, L., Shi, T., et al. (2008). Exploration of Gene-Gene Interaction Effects Using Entropy-Based Methods. Eur. J. Hum. Genet. 16 (2), 229–235. doi:10.1038/sj.ejhg.5201921
Emily, M. (2016). AGGrEGATOr: A Gene-Based GEne-Gene interActTiOn Test for Case-Control Association Studies. Stat. Appl. Genet. Mol. Biol. 15 (2), 151–171. doi:10.1515/sagmb-2015-0074
Emily, M. (2018). A Survey of Statistical Methods for Gene-Gene Interaction in Case-Control Genome-wide Association Studies. Journal de la société française de statistique. 159 (1), 27–67.
Emily, M. (2012). IndOR: a New Statistical Procedure to Test for SNP-SNP Epistasis in Genome-wide Association Studies. Statist. Med. 31 (21), 2359–2373. doi:10.1002/sim.5364
Emily, M., Sounac, N., Kroell, F., and Houée-Bigot, M. (2020). Gene-Based Methods to Detect Gene-Gene Interaction in R: The GeneGeneInteR Package. J. Stat. Softw. 95 (12), 1–32. doi:10.18637/jss.v095.i12
Fang, G., Wang, W., Paunic, V., Heydari, H., Costanzo, M., Liu, X., et al. (2019). Discovering Genetic Interactions Bridging Pathways in Genome-wide Association Studies. Nat. Commun. 10 (1), 4274. doi:10.1038/s41467-019-12131-7
Guo, F., Wang, D., and Wang, L. (2018). Progressive Approach for SNP Calling and Haplotype Assembly Using Single Molecular Sequencing Data. Bioinformatics 34 (12), 2012–2018. doi:10.1093/bioinformatics/bty059
Guo, Y., Yan, K., Lv, H., and Liu, B. (2021). PreTP-EL: Prediction of Therapeutic Peptides Based on Ensemble Learning. Brief. Bioinform. 22 (6), bbab358. doi:10.1093/bib/bbab358
Guo, Y., Zhong, Z., Yang, C., Hu, J., Jiang, Y., Liang, Z., et al. (2019). Epi-GTBN: an Approach of Epistasis Mining Based on Genetic Tabu Algorithm and Bayesian Network. BMC Bioinformatics 20 (1), 444. doi:10.1186/s12859-019-3022-z
Hindorff, L. A., Sethupathy, P., Junkins, H. A., Ramos, E. M., Mehta, J. P., Collins, F. S., et al. (2009). Potential Etiologic and Functional Implications of Genome-wide Association Loci for Human Diseases and Traits. Proc. Natl. Acad. Sci. 106 (23), 9362–9367. doi:10.1073/pnas.0903103106
Hu, Y., Qiu, S., and Cheng, L. (2021). Integration of Multiple-Omics Data to Analyze the Population-specific Differences for Coronary Artery Disease. Comput. Math. Methods Med. 2021, 7036592. doi:10.1155/2021/7036592
Hu, Y., Sun, J. Y., Zhang, Y., Zhang, H., Gao, S., Wang, T., et al. (2021). rs1990622 Variant Associates with Alzheimer's Disease and Regulates TMEM106B Expression in Human Brain Tissues. BMC Med. 19 (1), 11. doi:10.1186/s12916-020-01883-5
Hu, Y., Zhang, H., Liu, B., Gao, S., Wang, T., Han, Z., et al. (2020). rs34331204 Regulates TSPAN13 Expression and Contributes to Alzheimer's Disease with Sex Differences. Brain 143 (11), e95. doi:10.1093/brain/awaa302
Jiang, L., Xiao, Y., Ding, Y., Tang, J., and Guo, F. (2018). FKL-Spa-LapRLS: an Accurate Method for Identifying Human microRNA-Disease Association. Bmc Genomics 19, 911. doi:10.1186/s12864-018-5273-x
Jiang, Q., Jin, S., Jiang, Y., Liao, M., Feng, R., Zhang, L., et al. (2017). Alzheimer's Disease Variants with the Genome-wide Significance Are Significantly Enriched in Immune Pathways and Active in Immune Cells. Mol. Neurobiol. 54 (1), 594–600. doi:10.1007/s12035-015-9670-8
Képíró, L., Széll, M., Kovács, L., Keszthelyi, P., Kemény, L., and Gyulai, R. (2021). The Association of HLA-C and ERAP1 Polymorphisms in Early and Late Onset Psoriasis and Psoriatic Arthritis Patients of Hungary. Postepy Dermatol. Alergol. 38 (2), 43–51. doi:10.5114/ada.2021.104277
Klocke, K., Sakaguchi, S., Holmdahl, R., and Wing, K. (2016). Induction of Autoimmune Disease by Deletion of CTLA-4 in Mice in Adulthood. Proc. Natl. Acad. Sci. USA 113 (17), E2383–E2392. doi:10.1073/pnas.1603892113
Lai Kwan Lam, Q., King Hung Ko, O., Zheng, B.-J., and Lu, L. (2008). Local BAFF Gene Silencing Suppresses Th17-Cell Generation and Ameliorates Autoimmune Arthritis. Proc. Natl. Acad. Sci. 105 (39), 14993–14998. doi:10.1073/pnas.0806044105
Larson, N. B., Jenkins, G. D., Larson, M. C., Vierkant, R. A., Sellers, T. A., Phelan, C. M., et al. (2013). Kernel Canonical Correlation Analysis for Assessing Gene-Gene Interactions and Application to Ovarian Cancer. Eur. J. Hum. Genet. 22 (1), 126–131. doi:10.1038/ejhg.2013.69
Li, H.-L., Pang, Y.-H., and Liu, B. (2021). BioSeq-BLM: a Platform for Analyzing DNA, RNA and Protein Sequences Based on Biological Language Models. Nucleic Acids Res. gkab829. doi:10.1093/nar/gkab829
Li, J., Huang, D., Guo, M., Liu, X., Wang, C., Teng, Z., et al. (2015). A Gene-Based Information Gain Method for Detecting Gene-Gene Interactions in Case-Control Studies. Eur. J. Hum. Genet. 23 (11), 1566–1572. doi:10.1038/ejhg.2015.16
Li, M.-X., Gui, H.-S., Kwan, J. S. H., and Sham, P. C. (2011). GATES: a Rapid and Powerful Gene-Based Association Test Using Extended Simes Procedure. Am. J. Hum. Genet. 88 (3), 283–293. doi:10.1016/j.ajhg.2011.01.019
Li, P., Guo, M., Wang, C., Liu, X., and Zou, Q. (2015). An Overview of SNP Interactions in Genome-wide Association Studies. Brief. Funct. Genomics 14 (2), 143–155. doi:10.1093/bfgp/elu036
Liu, B., Gao, X., and Zhang, H. (2019). BioSeq-Analysis2.0: an Updated Platform for Analyzing DNA, RNA and Protein Sequences at Sequence Level and Residue Level Based on Machine Learning Approaches. Nucleic Acids Res. 47 (20), e127. doi:10.1093/nar/gkz740
Liu, G., Hu, Y., Han, Z., Jin, S., and Jiang, Q. (2019). Genetic Variant Rs17185536 Regulates SIM1 Gene Expression in Human Brain Hypothalamus. Proc. Natl. Acad. Sci. USA 116 (9), 3347–3348. doi:10.1073/pnas.1821550116
Liu, G., Jin, S., Hu, Y., and Jiang, Q. (2018). Disease Status Affects the Association between Rs4813620 and the Expression of Alzheimer's Disease Susceptibility geneTRIB3. Proc. Natl. Acad. Sci. USA 115 (45), E10519–E10520. doi:10.1073/pnas.1812975115
Liu, J., Su, R., Zhang, J., and Wei, L. (2021). Classification and Gene Selection of Triple-Negative Breast Cancer Subtype Embedding Gene Connectivity Matrix in Deep Neural Network. Brief. Bioinform. 22, 1477–4054. (Electronic). doi:10.1093/bib/bbaa395
Liu, J. Z., Mcrae, A. F., Nyholt, D. R., Medland, S. E., Wray, N. R., Brown, K. M., et al. (2010). A Versatile Gene-Based Test for Genome-wide Association Studies. Am. J. Hum. Genet. 87 (1), 139–145. doi:10.1016/j.ajhg.2010.06.009
Loos, R. J. F. (2020). 15 Years of Genome-wide Association Studies and No Signs of Slowing Down. Nat. Commun. 11 (1), 5900. doi:10.1038/s41467-020-19653-5
Luo, J., Meng, Y., Zhai, J., Zhu, Y., Li, Y., and Wu, Y. (2020). Screening of SLE-Susceptible SNPs in One Chinese Family with Systemic Lupus Erythematosus. Cbio 15 (7), 778–787. doi:10.2174/1574893615666200120105153
Lyu, P., Hou, J., Yu, H., and Shi, H. (2020). High-density Genetic Linkage Map Construction in Sunflower (Helianthus Annuus L.) Using SNP and SSR Markers. Curr. Bioinformatics 15 (8), 889–897. doi:10.2174/1574893615666200324134725
Ma, L., Clark, A. G., and Keinan, A. (2013). Gene-based Testing of Interactions in Association Studies of Quantitative Traits. Plos Genet. 9 (2), e1003321. doi:10.1371/journal.pgen.1003321
Manolio, T. A., Collins, F. S., Cox, N. J., Goldstein, D. B., Hindorff, L. A., Hunter, D. J., et al. (2009). Finding the Missing Heritability of Complex Diseases. Nature 461 (7265), 747–753. doi:10.1038/nature08494
Moore, J. H., Asselbergs, F. W., and Williams, S. M. (2010). Bioinformatics Challenges for Genome-wide Association Studies. Bioinformatics 26 (4), 445–455. doi:10.1093/bioinformatics/btp713
Nobre, R., Ilic, A., Santander-Jimenez, S., and Sousa, L. (2021). Retargeting Tensor Accelerators for Epistasis Detection. IEEE Trans. Parallel Distrib. Syst. 32 (9), 2160–2174. doi:10.1109/tpds.2021.3060322
Peng, Q., Zhao, J., and Xue, F. (2010). A Gene-Based Method for Detecting Gene-Gene Co-association in a Case-Control Association Study. Eur. J. Hum. Genet. 18 (5), 582–587. doi:10.1038/ejhg.2009.223
Ritchie, M. D., Hahn, L. W., and Moore, J. H. (2003). Power of Multifactor Dimensionality Reduction for Detecting Gene-Gene Interactions in the Presence of Genotyping Error, Missing Data, Phenocopy, and Genetic Heterogeneity. Genet. Epidemiol. 24 (2), 150–157. doi:10.1002/gepi.10218
Ritchie, M. D., and Van Steen, K. (2018). The Search for Gene-Gene Interactions in Genome-wide Association Studies: Challenges in Abundance of Methods, Practical Considerations, and Biological Interpretation. Ann. Transl. Med. 6 (8), 157. doi:10.21037/atm.2018.04.05
Shao, J., Yan, K., and Liu, B. (2021). FoldRec-C2C: Protein Fold Recognition by Combining Cluster-To-Cluster Model and Protein Similarity Network. Brief Bioinform 22 (3), bbaa144. doi:10.1093/bib/bbaa144
Song, B., Li, F., Liu, Y., and Zeng, X. (2021). Deep Learning Methods for Biomedical Named Entity Recognition: a Survey and Qualitative Comparison. Brief. Bioinform. 22 (6), bbab282. doi:10.1093/bib/bbab282
Su, R., Liu, X., Jin, Q., Liu, X., and Wei, L. (2021). Identification of Glioblastoma Molecular Subtype and Prognosis Based on Deep MRI Features. Knowledge-Based Syst. 232, 107490. doi:10.1016/j.knosys.2021.107490
Su, R., Liu, X., Wei, L., and Zou, Q. (2019). Deep-Resp-Forest: A Deep forest Model to Predict Anti-cancer Drug Response. Methods 166, 91–102. doi:10.1016/j.ymeth.2019.02.009
Tang, Y.-J., Pang, Y.-H., and Liu, B. (2020). IDP-Seq2Seq: Identification of Intrinsically Disordered Regions Based on Sequence to Sequence Learning. Bioinformaitcs 36 (21), 5177–5186. doi:10.1093/bioinformatics/btaa667
Urbanowicz, R. J., Kiralis, J., Sinnott-Armstrong, N. A., Heberling, T., Fisher, J. M., and Moore, J. H. (2012). GAMETES: a Fast, Direct Algorithm for Generating Pure, Strict, Epistatic Models with Random Architectures. BioData Mining 5 (1), 16. doi:10.1186/1756-0381-5-16
Wan, X., Yang, C., Yang, Q., Xue, H., Fan, X., Tang, N. L. S., et al. (2010). BOOST: A Fast Approach to Detecting Gene-Gene Interactions in Genome-wide Case-Control Studies. Am. J. Hum. Genet. 87 (3), 325–340. doi:10.1016/j.ajhg.2010.07.021
Wang, H. T., Tang, J., Ding, Y., and Guo, F. (2021). Exploring Associations of Non-Coding RNAs in Human Diseases via Three-Matrix Factorization with Hypergraph-Regular Terms on Center Kernel Alignment. Brief. Bioinform. 22 (5), bbaa409. doi:10.1093/bib/bbaa409
Wei, L., Chen, H., and Su, R. (2018). M6APred-EL: A Sequence-Based Predictor for Identifying N6-Methyladenosine Sites Using Ensemble Learning. Mol. Ther. - Nucleic Acids 12, 635–644. doi:10.1016/j.omtn.2018.07.004
Wei, L., Luan, S., Nagai, L. A. E., Su, R., and Zou, Q. (2019). Exploring Sequence-Based Features for the Improved Prediction of DNA N4-Methylcytosine Sites in Multiple Species. Bioinformatics 35 (8), 1326–1333. doi:10.1093/bioinformatics/bty824
Wei, L., Wan, S., Guo, J., and Wong, K. K. (2017). A Novel Hierarchical Selective Ensemble Classifier with Bioinformatics Application. Artif. Intelligence Med. 83, 82–90. doi:10.1016/j.artmed.2017.02.005
Wei, L., Xing, P., Zeng, J., Chen, J., Su, R., and Guo, F. (2017). Improved Prediction of Protein-Protein Interactions Using Novel Negative Samples, Features, and an Ensemble Classifier. Artif. Intelligence Med. 83, 67–74. doi:10.1016/j.artmed.2017.03.001
Xiao, Y., Motomura, S., and Podack, E. R. (2008). APRIL (TNFSF13) Regulates Collagen-Induced Arthritis, IL-17 Production and Th2 Response. Eur. J. Immunol. 38 (12), 3450–3458. doi:10.1002/eji.200838640
Young, A. I. (2019). Solving the Missing Heritability Problem. Plos Genet. 15 (6), e1008222. doi:10.1371/journal.pgen.1008222
Yuan, Z., Gao, Q., He, Y., Zhang, X., Li, F., Zhao, J., et al. (2012). Detection for Gene-Gene Co-association via Kernel Canonical Correlation Analysis. BMC Genet. 13, 83. doi:10.1186/1471-2156-13-83
Zeng, X., Liao, Y., Liu, Y., and Zou, Q. (2017). Prediction and Validation of Disease Genes Using HeteSim Scores. Ieee/acm Trans. Comput. Biol. Bioinf. 14 (3), 687–695. doi:10.1109/tcbb.2016.2520947
Zeng, X., Zhu, S., Liu, X., Zhou, Y., Nussinov, R., and Cheng, F. (2019). deepDR: a Network-Based Deep Learning Approach to In Silico Drug Repositioning. Bioinformatics 35 (24), 5191–5198. doi:10.1093/bioinformatics/btz418
Zhai, Y., Chen, Y., Teng, Z., and Zhao, Y. (2020). Identifying Antioxidant Proteins by Using Amino Acid Composition and Protein-Protein Interactions. Front. Cel Dev. Biol. 8, 591487. doi:10.3389/fcell.2020.591487
Zhang, T., Hu, Y., Wu, X., Ma, R., Jiang, Q., and Wang, Y. (2016). Identifying Liver Cancer-Related Enhancer SNPs by Integrating GWAS and Histone Modification ChIP-Seq Data. Biomed. Res. Int. 2016, 2395341. doi:10.1155/2016/2395341
Zhang, X., Zou, Q., Rodriguez-Paton, A., and Zeng, X. (2019). Meta-path Methods for Prioritizing Candidate Disease miRNAs. Ieee/acm Trans. Comput. Biol. Bioinf. 16 (1), 283–291. doi:10.1109/tcbb.2017.2776280
Zhang, Y., and Liu, J. S. (2007). Bayesian Inference of Epistatic Interactions in Case-Control Studies. Nat. Genet. 39 (9), 1167–1173. doi:10.1038/ng2110
Keywords: genome-wide association studies, qualitative traits, gene-gene interactions, maximal neighborhood coefficient, gene-based testing
Citation: Guo Y, Cheng H, Yuan Z, Liang Z, Wang Y and Du D (2021) Testing Gene-Gene Interactions Based on a Neighborhood Perspective in Genome-wide Association Studies. Front. Genet. 12:801261. doi: 10.3389/fgene.2021.801261
Received: 25 October 2021; Accepted: 15 November 2021;
Published: 08 December 2021.
Edited by:
Dariusz Mrozek, Silesian University of Technology, PolandReviewed by:
Yang Hu, Harbin Institute of Technology, ChinaLumeng Chao, Inner Mongolia Agricultural University, China
Copyright © 2021 Guo, Cheng, Yuan, Liang, Wang and Du. This is an open-access article distributed under the terms of the Creative Commons Attribution License (CC BY). The use, distribution or reproduction in other forums is permitted, provided the original author(s) and the copyright owner(s) are credited and that the original publication in this journal is cited, in accordance with accepted academic practice. No use, distribution or reproduction is permitted which does not comply with these terms.
*Correspondence: Yingjie Guo, eWpndW8wNjI1QGdtYWlsLmNvbQ==; Debing Du, ZHVkZWJpbmdfaHJiQDE2My5jb20=
 Yingjie Guo
 Honghong Cheng3
 Zhian Yuan
 Zhen Liang