
95% of researchers rate our articles as excellent or good
Learn more about the work of our research integrity team to safeguard the quality of each article we publish.
Find out more
ORIGINAL RESEARCH article
Front. Genet. , 03 January 2022
Sec. Computational Genomics
Volume 12 - 2021 | https://doi.org/10.3389/fgene.2021.798612
This article is part of the Research Topic Computational tools in inferring cancer tissue-of-origin and molecular classification towards personalized cancer therapy, Volume III View all 29 articles
 Donglin Lai1,2†
 Lin Tan3†
 Xiaojia Zuo1DingSheng Liu1Deyi Jiao4Guoqing Wan1
 Changlian Lu1
 Dongjie Shen5*
 Xuefeng Gu1,2,4*
Ferroptosis is associated with the prognosis and therapeutic responses of patients with various cancers. LncRNAs are reported to exhibit antitumor or oncogenic functions. Currently, few studies have assessed the combined effects of ferroptosis and lncRNAs on the prognosis and therapy of stomach cancer. In this study, transcriptomic and clinical data were downloaded from TCGA database, and ferroptosis-related genes were obtained from the FerrDb database. Through correlation analysis, Cox analysis, and the Lasso algorithm, 10 prognostic ferroptosis-related lncRNAs (AC009299.2, AC012020.1, AC092723.2, AC093642.1, AC243829.4, AL121748.1, FLNB-AS1, LINC01614, LINC02485, LINC02728) were screened to construct a prognostic model, which was verified in two test cohorts. Risk scores for patients with stomach cancer were calculated, and patients were divided into two risk groups. The low-risk group, based on the median value, had a longer overall survival time in the KM curve, and a lower proportion of dead patients in the survival distribution curve. Potential mechanisms and possible functions were revealed using GSEA and the ceRNA network. By integrating clinical information, the association between lncRNAs and clinical features was analyzed and several features affecting prognosis were identified. Then, a nomogram was developed to predict survival rates, and its good predictive performance was indicated by a relatively high C-index (0.67118161) and a good match in calibration curves. Next, the association between these lncRNAs and therapy was explored. Patients in the low-risk group had an immune-activating environment, higher immune scores, higher TMB, lower TIDE scores, and higher expression of immune checkpoints, suggesting they might receive a greater benefit from immune checkpoint inhibitor therapy. In addition, a significant difference in the sensitivity to mitomycin. C, cisplatin, and docetaxel, but not etoposide and paclitaxel, was observed. In summary, this model had guiding significance for prognosis and personalized therapy. It helped screen patients with stomach cancer who might benefit from immunotherapy and guided the selection of personalized chemotherapeutic drugs.
Stomach cancer is a malignant tumor worldwide. Research has shown that gastric cancer ranks fifth in global incidence and sixth in mortality, with over one million new cases and an estimated 769,000 deaths in 2020 (Sung et al., 2021). The AJCC/UICC TNM staging system has been used to predict prognosis for many years (Marano et al., 2015). However, due to the complexity and high heterogeneity of stomach cancer, patients with the same TNM stratification sometimes present distinct prognoses. Hence the development of novel and effective biological markers to predict prognosis is urgently needed. Treatment strategies for stomach cancer currently include endoscopic resection, surgery, perioperative or adjuvant chemotherapy, and targeted therapy (Smyth et al., 2020). The treatment efficacy in patients is affected by the chosen treatment strategy. Hence, biological markers of gastric cancer for personalized treatment, including selecting effective strategies and avoiding excessive treatment, are important.
Ferroptosis is a form of cell death that differs from apoptosis and autophagy in morphology, biochemistry, and genetics (Dixon et al., 2012). Ferroptosis-inducing factors result in the accumulation of reactive oxygen species by affecting glutathione peroxidase activities, which regulates cell death (Li et al., 2020). Recently, the involvement of ferroptosis in tumor suppression has received increasing attention (Lang et al., 2019; Liang et al., 2019; Lei et al., 2020; Tang et al., 2020). In addition, ferroptosis is associated with cancer therapy responses, such as immunotherapy, radiotherapy, and chemotherapy. CD8+ T cells activated by immunotherapy enhance the ferroptosis-specific lipid peroxidation of tumor cells to improve the antitumor efficacy of immunotherapy (Wang W. et al., 2019). Biomimetic magnetic nanoparticles, Fe3O4-SAS@PLT, sensitize cells to ferroptosis, improving the cancer immunotherapy response rate of noninflammatory tumors (Jiang et al., 2020). Ferroptosis agonists increase but ferroptosis antagonists limit radiotherapy efficacy in tumors (Lang et al., 2019). The ferroptosis inducer erastin increases the sensitivity of acute myeloid leukemia cells to chemotherapeutic agents in a RAS-independent manner (Yu et al., 2015). Therefore, biomarkers related to ferroptosis may have the potential to predict the prognosis and therapeutic response.
Long non-coding RNAs (lncRNAs) are a type of nonprotein-coding RNA with a length of >200 nucleotides (Alexander et al., 2010). A large number of lncRNAs are associated with various cancers, exhibiting antitumor or oncogenic functions. Alterations in lncRNA expression and their mutations are involved in tumorigenesis and metastasis (Bhan et al., 2017). Dysregulation of specific lncRNAs is closely related to the ferroptosis process in various malignant tumors (Wu Y et al., 2020). LINC00336 binds the RNA-binding protein ELAVL1, inhibiting ferroptosis in lung cancer (Wang M. et al., 2019). The lncRNA P53RRA promotes ferroptosis and apoptosis by affecting the transcription of several metabolic genes (Mao et al., 2018). However, relatively few studies have assessed the roles of lncRNAs in the ferroptosis process in stomach cancer.
In this study, the potential associations of ferroptosis-related lncRNAs with prognosis and treatment efficacy in patients with stomach cancer were explored. By integrating The Cancer Genome Atlas (TCGA) and the FerrDb databases, a prognostic model based on 10 prognostic ferroptosis-related lncRNAs (AC009299.2, AC012020.1, AC092723.2, AC093642.1, AC243829.4, AL121748.1, FLNB-AS1, LINC01614, LINC02485, LINC02728) was constructed, and patients were divided into different risk subgroups based on risk scores. The biological mechanism underlying different prognoses and the functions of these 10 lncRNAs were revealed. Then, the association between these lncRNAs and clinicopathological features was analyzed and several clinical factors related to prognosis were used to construct a nomogram that predicted the overall survival (OS) probability. Next, the association between this model and treatment efficacy was explored. Immune infiltration, immune checkpoint inhibition therapy, and sensitivity to chemotherapeutic drugs were analyzed. We aimed to provide effective biomarkers for predicting the prognosis and therapeutic response of patients with stomach cancer.
The transcriptional expression and corresponding clinical data of stomach cancer samples were downloaded from UCSC Xena1 (Goldman et al., 2020). The miRNA expression was obtained from TCGA2 (Hutter and Zenklusen, 2018). The known 259 ferroptosis-related genes were downloaded from the FerrDb database3 (Zhou and Bao, 2020). Samples without clinical information and OS times less than 30 days were deserted. LncRNAs and mRNAs were annotated according to annotated files downloaded from the GENCODE project4 (Frankish et al., 2019). Gene expression was transformed into Transcripts Per Kilobase of exon model per Million mapped reads (TPM) format to eliminate the effects of sequencing depth and gene length. Finally, 337 STAD samples were divided into a training cohort and a test cohort by 2:1 in the “caret” R package.
Spearman correlation analysis was conducted to screen lncRNAs related to ferroptosis with the condition of “p-value <0.01 and absolute values of correlation coefficients ≥0.5”. Firstly, univariate Cox proportional hazards regression (UniCox) analysis was used to screen lncRNAs associated with overall survival. All these lncRNAs were further enrolled into Least absolute shrinkage and selection operator (Lasso) analysis for dimension reduction in the “glmnet” R package. Then, prognostic lncRNAs, as risk signatures, were identified and used to construct a prognostic model in Multivariate Cox proportional hazards regression (MultiCox) analysis. Risk scores were calculated in a linear combination of expression values and regression coefficients of risk signatures. Based on the median value of risk scores in the training cohort, patients could be divided into the high- and low-risk groups. A Sankey plot was plotted to depict the relationship of ferroptosis-related genes, screened lncRNAs associated with prognosis and ferroptosis, and protect or risk roles to OS in the “ggalluvial” R package.
Considering the specialty of survival status, time-independent ROC curves, along with Area under these ROCs, were done to assess the sensitivity, and specificity of the prognostic model in the “timeROC” R package. Survival probability was compared between the high- and low-risk groups by Kaplan–Meier (KM) survival analysis. The risk score curve, the survival status distribution curve, and the expression heatmap were plotted. In addition, the expression of lncRNA signatures between the high- and low-risk groups was compared with the Mann-Whitney U test. Significance levels were annotated on the right side. All these analyses were conducted in two test cohorts to validate the results. In addition, survival rates of signatures with different expression levels were analyzed in the KM curves, which again indicated their roles to OS.
Overall risk scores and expression of these lncRNAs in different clinical subgroups were compared using the Mann-Whitney U test in the test2 cohort. Clinical factors included age, gender, neoplasm histological grade, pathological T, pathological M, pathological N, and tumor stage. p < 0.05 was thought to have a significant difference.
UniCox analysis was used to identify clinicopathological factors related to prognosis in the test2 cohort, with the screening condition of p < 0.05. A nomogram was constructed to predict OS probabilities at 1-, 3-, and 5-years by integrating these prognostic features. The concordance index (C-index) was calculated to assess the performance of this nomogram. And calibration curves at 1-, 3-, 5-years were plotted to assess agreement between the predicted and actual OS rates in the “rms” R package.
The Kyoto Encyclopedia of Genes and Genomes (KEGG) pathways analysis was used to elucidate underlying biological mechanisms resulting in differences in the prognoses of two risk subgroups, which was performed in GSEA V4.1.0 software. NOM p-value < 0.05, FDR q-value < 0.25, and |NES| > 1 were the cutoff criterion. A ceRNA network was constructed to reveal the functions of lncRNA signatures, which was displayed by Cytoscape V3.7.1 software. Firstly, 171 DEmiRNAs and 4,288 DEmRNAs between the high- and low-risk group in the test2 cohort were identified in the “edger” R package. Next, lncRNA signatures were enrolled into the miRCode database5 (Jeggari et al., 2012) to predict corresponding miRNAs, and then the lncRNA-miRNA axes were built by taking intersection with DEmiRNAs. Subsequently, target mRNAs were obtained by integrating DEmRNAs, and the predicted results from TargetScan6 (Agarwal et al., 2015), miRDB7 (Chen and Wang, 2020), and miRTarBase8 (Huang et al., 2020) database. Predicted mRNAs, found in at least 2 databases, were selected. Finally, the GO terms in biological process (BP) and the KEGG pathways were revealed via the “clusterProfiler” R package. p-value and q-value were both 0.05 as cutoff values.
Single-sample Gene Set Enrichment Analysis (ssGSEA) was performed to quantify immune infiltration between two risk groups in the “gsva” R package. The immune activity of 16 immune cells and 13 immune functions was quantified in the “gsva” R package. The higher the ssGSEA score, the stronger the immune activity. The immune difference between the two risk groups was depicted in the heatmap and violin plots. In addition, stromal scores and immune scores for patients with STAD were calculated in the“estimate” R package by applying the ESTIMATE algorithm (Yoshihara et al., 2013). The stromal and immune scores in risk subgroups were compared in violin plots.
Tumor mutation burden (TMB), defined as the number of somatic mutations per 1000,000 bases, was a biomarker that predicted the efficacy of immunotherapy. Tumor mutation data were downloaded from the TCGA database9 (Hutter and Zenklusen, 2018), and the TMB between the two risk groups was calculated and compared. Besides, gene mutations of patients with STAD were presented via the “maftools” R package. The top 20 genes with the most mutations were selected. Tumor Immune Dysfunction and Exclusion (TIDE) scores for patients, which also did help to predict immune checkpoint inhibitor (ICI) therapy response, were calculated in the TIDE database10 (Fu et al., 2020). The TIDE scores in risk subgroups were compared in violin plots. Finally, the expression of known immune checkpoints between the high- and low-risk groups was compared.
The half-maximal inhibitory concentration (IC50) values of chemotherapeutic drugs were predicted in the “pRRophetic” R package. By building statistical models from gene expression and drug sensitivity data in a very large panel of cancer cell lines, this package can predict the chemotherapeutic response from Tumor Gene Expression Levels (Geeleher et al., 2014). We explored 5 common chemotherapeutic drugs for stomach cancer, including mitomycin. C, cisplatin, docetaxel, etoposide, and paclitaxel.
All data were processed in the R 4.1.0 software. The difference in two distinct subgroups was compared with the Mann-Whitney U test. p-value <0.05 was a criterion of statistically significant differences.
A flow chart of data process and analysis in this study was depicted (Figure 1). After data preprocessing and partitioning, there were 225 STAD samples in the training cohort, 112 STAD samples in the test1 cohort, and 337 STAD samples in the test2 cohort. Their clinicopathological features were summarized (Table 1).
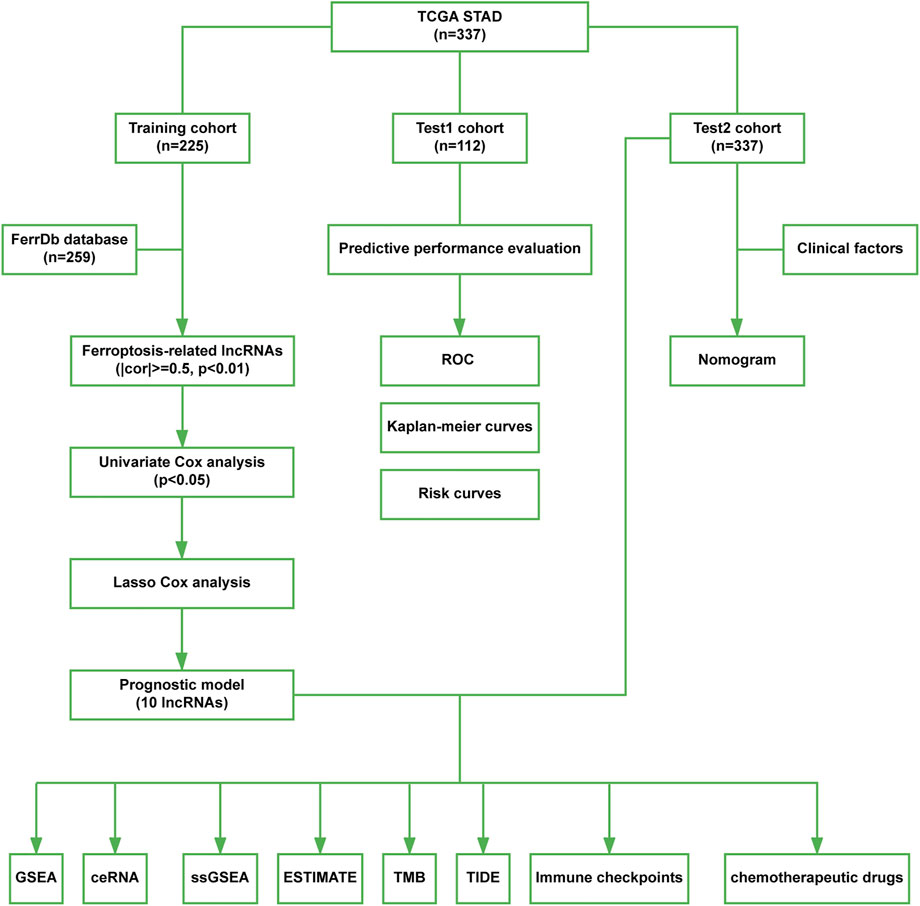
FIGURE 1. The flow chart in this study.
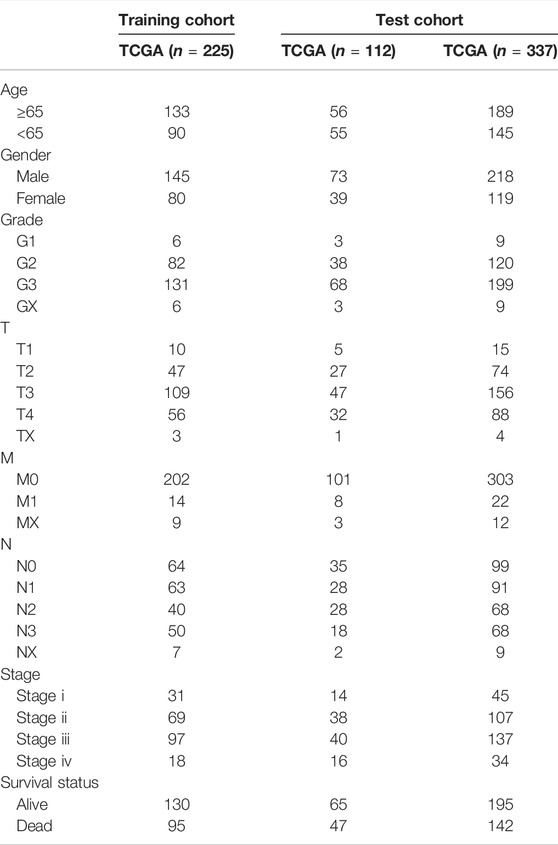
TABLE 1. Clinicopathologic characteristics of patients with STAD in the training cohort and two test cohorts.
To identify lncRNAs associated with prognosis and ferroptosis, spearman coefficient, and UniCox analysis were conducted and 109 lncRNAs were identified. Then Lasso analysis was applied to reduce redundancy and simplify models. When partial likelihood deviance was minimal, 32 candidate lncRNAs were obtained as candidates (Figures 2A,B). After MultiCox analysis, 10 ferroptosis-related lncRNAs were identified and used to construct a prognostic model (Figure 2C; Supplementary Table S2). A Sankey diagram was applied to display the relationship of ferroptosis-related genes, lncRNAs in the model, and their roles in OS. AC012020.1 and AC243829.4 were protective factors and the others were risk factors for OS (Figure 2D). The formula was shown below:
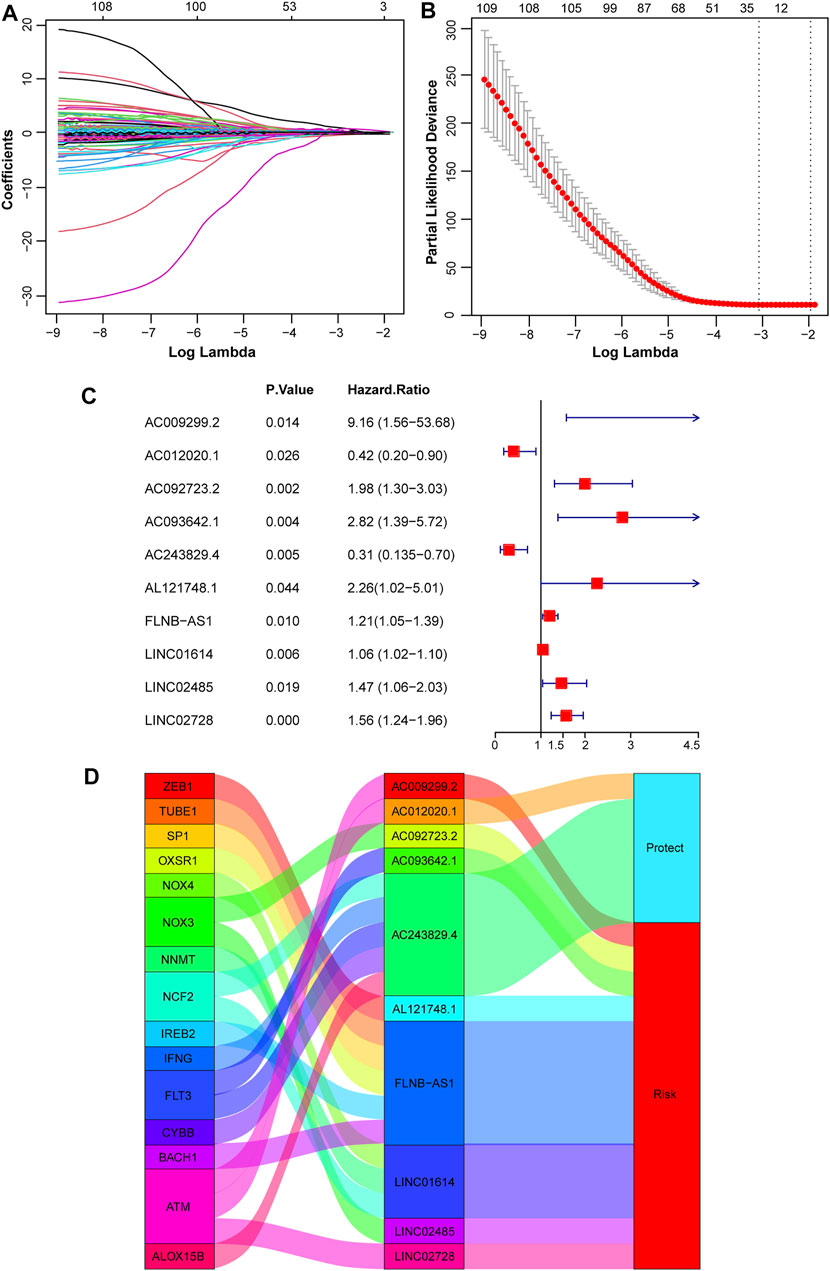
FIGURE 2. Construction of a prognostic model based on ferroptosis-related lncRNAs. (A, B) Variable coefficients and the partial likelihood deviance under different lambda in the Lasso analysis. (C) 10 independent prognostic lncRNAs were found via the MultiCox regression analysis. (D) A Sankey diagram showed the relationship of ferroptosis-related genes, screened 10 lncRNAs, and protect or risk roles in OS.
Risk Score = 2.214344584 * ExpAC009299.2 − 0.859698908 * ExpAC012020.1 + 0.68393393 * ExpAC092723.2 + 1.037748564 * ExpAC093642.1 − 1.181411845 * ExpAC243829.4 + 0.815962314 * ExpAL121748.1 + 0.188412024 * ExpFLNB-AS1 + 0.058077818 * ExpLINC01614 + 0.384845713 * ExpLINC02485 + 0.44150546 * ExpLINC02728.
Risk scores for all patients with STAD were calculated, and patients were divided into high- and low-risk groups, based on the median score of 0.815527251 in the training cohort. The predictive sensitivity and specificity of this prognostic model were assessed by constructing time-independent ROC curves. The AUCs of ROC curves at 1-, 3-, and 5-years were 0.683, 0.763, and 0.849, respectively, which indicated good performance (Figure 3A). The KM curve showed that the high-risk subgroup had a shorter overall survival time (Figure 3B). Risk scores for patients with STAD were presented in ascending order (Figure 3C). The survival distribution curve showed a higher proportion of dead patients in the high-risk group and a lower proportion of dead patients in the low-risk group (Figure 3D). Compared with the low-risk group, the expression levels of eight lncRNA signatures were significantly upregulated in the high-risk group, while AC243829.4 expression was reversed and AC012020.1 tended to be downregulated (Figure 3E). The same analyses were conducted to validate in the test1 cohort containing new external samples and the test2 cohort containing all STAD samples. Similar results were obtained, except that the differences in the expression of several lncRNAs were not significant in the test1 cohort, potentially due to its small sample size (Supplementary Figures S1, S2). The KM survival analysis of 10 lncRNAs showed that higher expression of AL121748.1, LINC01614, and AC009299.2 was associated with a shorter OS probability, which again indicated their risk roles (Supplementary Figure S3).
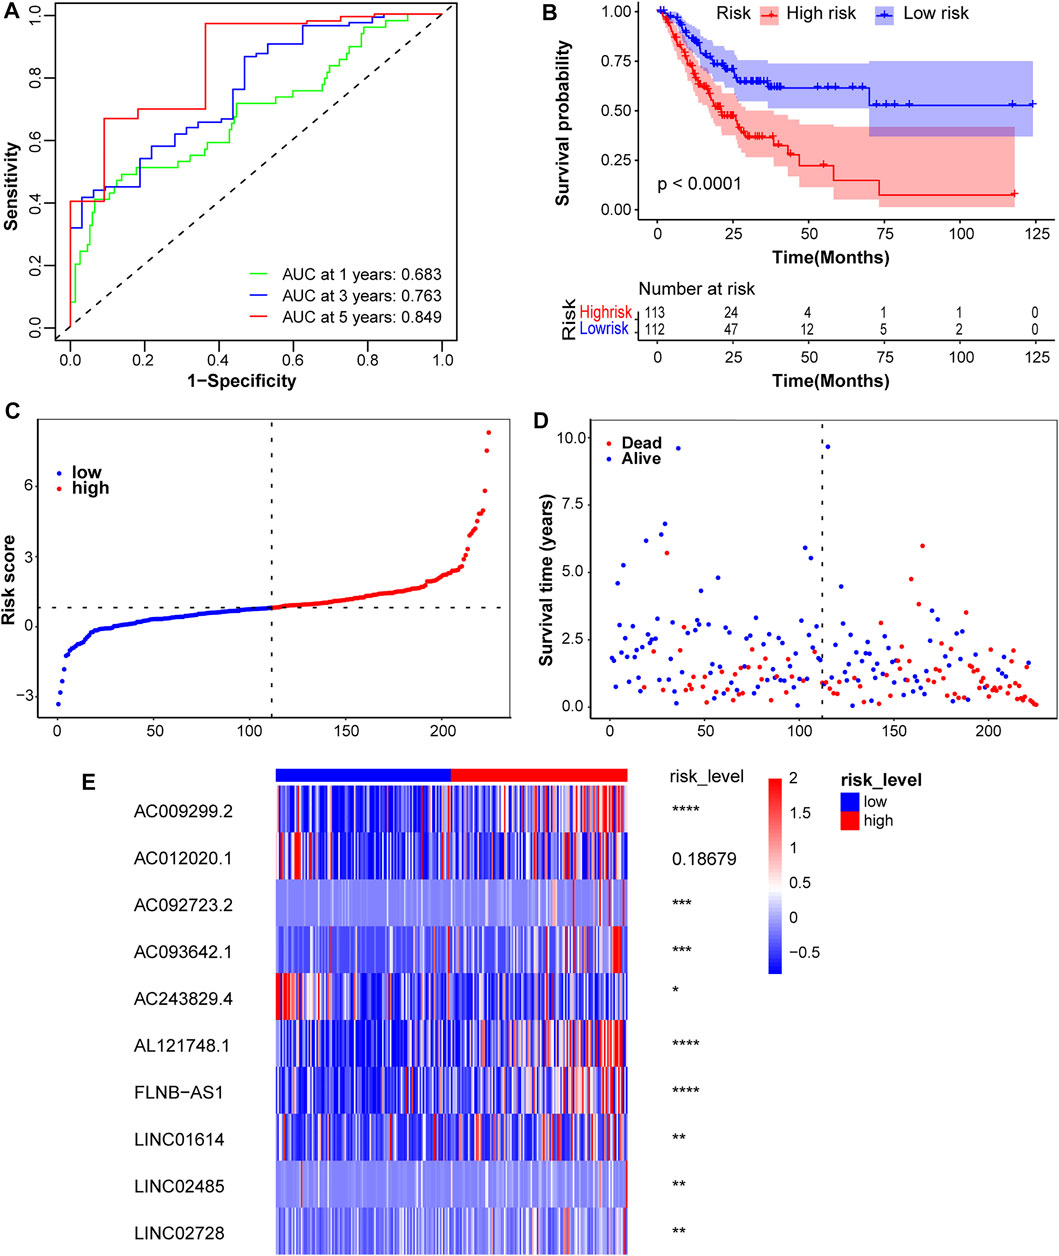
FIGURE 3. Assessment of the prognostic model in the training cohort. (A) Time-independent ROC curves along with their AUC were conducted to assess the sensitivity and specificity. (B) The KM survival curves showed a higher survival rate in the low-risk group. (C) Risk scores for patients with STAD were presented in ascending order. (D) The survival status distribution curve showed a higher proportion of dead patients in the high-risk group. (E) The expression heatmap of these 10 lncRNAs was plotted and significance levels were annotated on the right side. ****p < 0.0001, ***p < 0.001, **p < 0.01, *p < 0.05.
Risk scores for different clinical subgroups were compared in the test2 cohort to elucidate the association between the prognostic model and clinical factors. Patients with distant metastases had higher risk scores, and patients with pathological T3 or T4 tended to higher risk scores. However, no significant differences were observed in other clinical subgroups (Supplementary Figures S4, S5A). KM survival analyses of pathological M subgroups were conducted to determine whether clinical factors affected the prognostic performance of this model. Patients with higher risk scores in the pathological M0 subgroup still had shorter overall survival time (Supplementary Figure S5B). A statistically significant difference was not observed, but a trend toward a difference was identified in the pathological M1 group, potentially because of the limited number of 22 samples (Supplementary Figure S5C). These analyses indicated that risk scores predict OS independently. Gene expression levels in different clinical subgroups were analyzed to further explore the potential link between the signatures and clinicopathological features. The expression of four lncRNAs was associated with age (Supplementary Figure S6A), but not with gender (Supplementary Figure S6B). AC093642.1, AC243829.4, AL121748.1, LINC01614, and LINC02728 were expressed at higher levels in the higher neoplasm histological grade group (Supplementary Figure S6C). Only the expression of AC009299.2 and FLNB-AS1 in the tumor stage subgroups was significantly different (Supplementary Figure S6D). The expression of AC009299.2 and AL121748.1 in the pathological T subgroups was significantly different (Supplementary Figure S6E), but no differences in the pathological M subgroups (Supplementary Figure S6F). Compared with the pathological N0 or N1 group, the expression of AC009299.2, AC093642.1, AL121748.1, and FLNB-AS1 was significantly different in the pathological N2 or N3 group (Supplementary Figure S6G). The results from analyses between 10 signatures and clinical features again indicated roles for some lncRNAs as risk factors, especially AC009299.2.
Using the prognostic factors, a nomogram was built to predict the survival rates of patients with STAD. The UniCox analysis identified several factors affecting prognosis, including age, pathological N, tumor stage, and risk score (Figure 4A). This nomogram was used to predict the 1-, 3-, and 5-years overall survival rates of patients with STAD (Figure 4B). The C-index was 0.67118161, and the calibration curves at 1-, 3-, and 5-years showed a good match between the predicted and actual OS rates (Figures 4C–E).
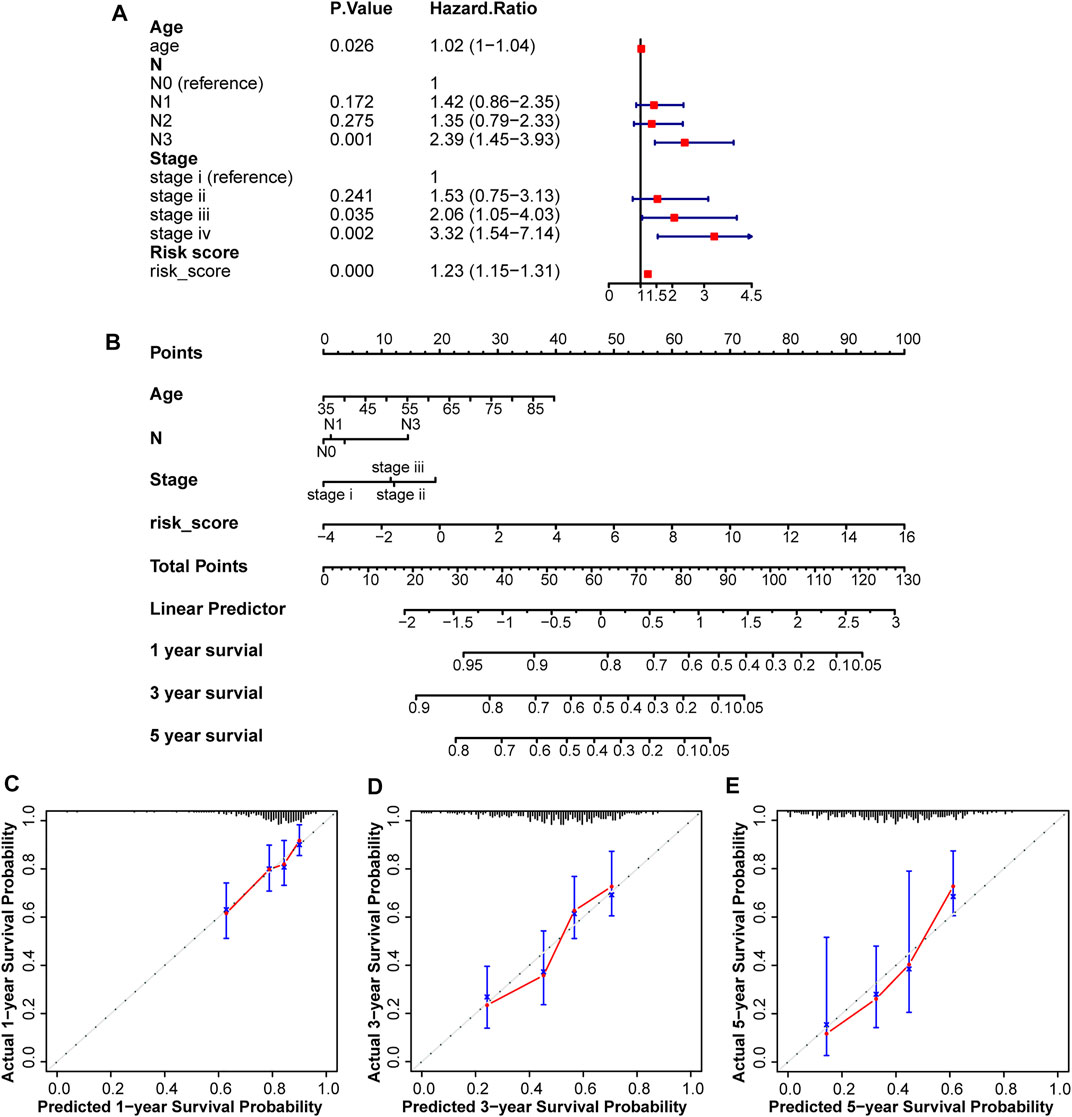
FIGURE 4. Construction and assessment of a nomogram in the test2 cohort. (A) Four factors including age, pathological N, tumor Stage, and risk score, were found to be related to prognosis. (B) A nomogram was constructed to predict overall survival rates at 1-, 3-, and 5-years. (C–E) Calibration curves were plotted to assess agreement between the predicted and actual OS rates.
The underlying biological mechanisms resulting in differences in the prognoses of the two risk subgroups were elucidated by conducting KEGG pathway analysis with GSEA software in the test2 cohort. Genes in the low-risk group were enriched in multiple pathways, including oxidative phosphorylation, glutathione metabolism, and glyoxylate and dicarboxylate metabolism. Genes in the high-risk group were significantly enriched in the TGF-beta signaling pathway, adherens junction, and MAPK signaling pathway, among others (Figure 5). A ceRNA network was constructed, and functional enrichment analysis based on target mRNAs was conducted to reveal the functions of these 10 lncRNAs. LncRNA-miRNA-mRNA axes were displayed (Figure 6; Supplementary Table S3). Five lncRNAs (AC093642.1, LINC02485, FLNB-AS1, LINC02728, and AC009299.2) regulated the expression of 73 mRNAs through the corresponding 10 miRNAs, thus participating in a variety of biological processes. Functional enrichment analysis identified GO terms in BP and KEGG pathways (Supplementary Table S4). The top 20 results were shown (Supplementary Figure S7).
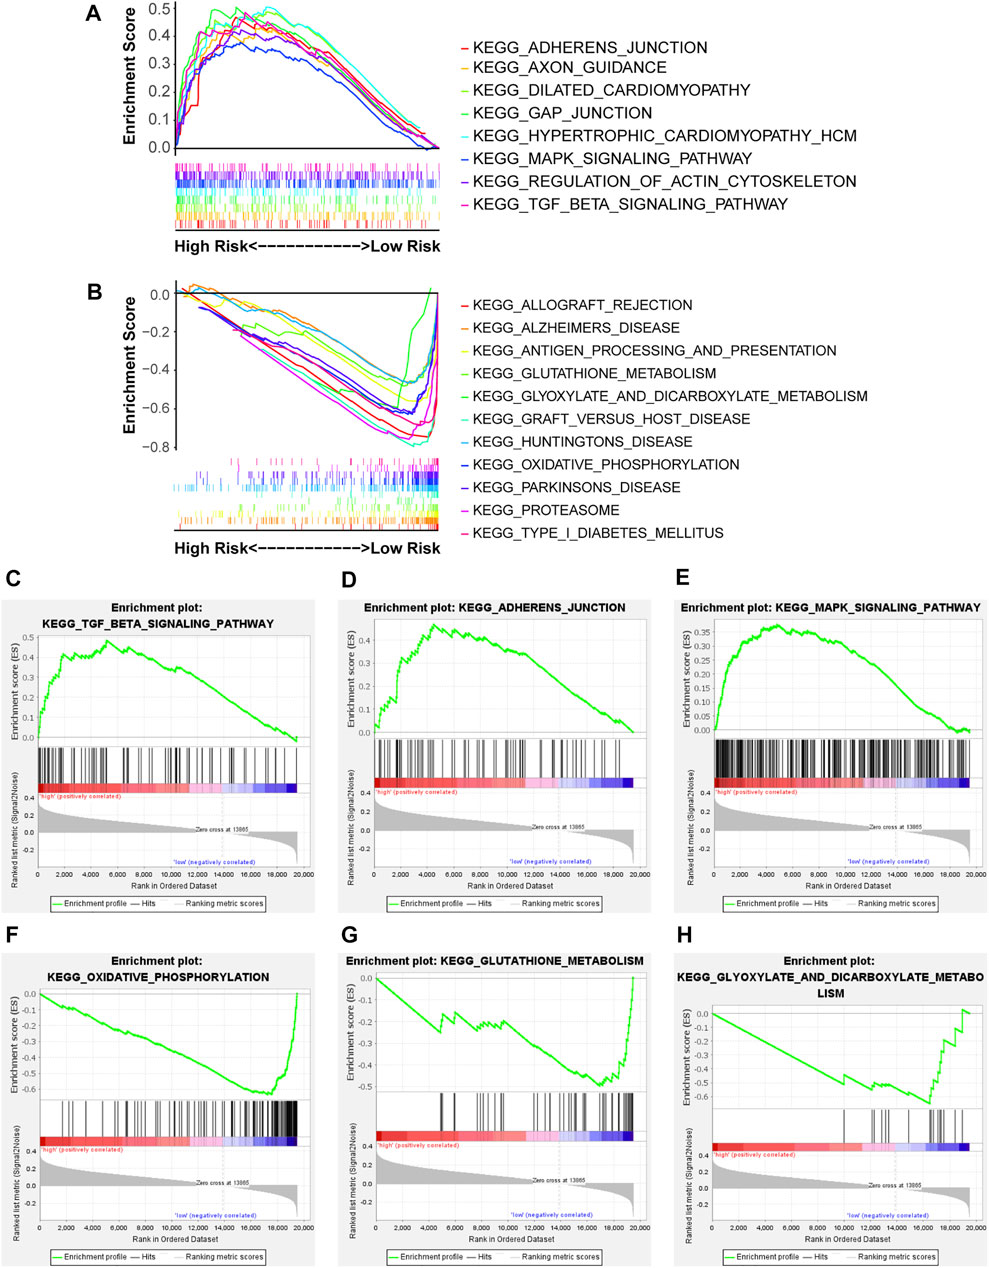
FIGURE 5. The enriched KEGG pathways were revealed in the two risk groups via GSEA software. NOM p-value < 0.05, FDR q-value < 0.25, and |NES| > 1 were the cutoff criterion. (A,B) Distinct pathways enriched in the high- and low-risk groups, (C) Enrichment plot: KEGG_TGF_BETA_SIGNALING_PATHWAY, (D) Enrichment plot: KEGG_ADHERENS_JUNCTION, (E) Enrichment plot: KEGG_MAPK_SIGNALING_PATHWAY, (F) Enrichment plot: KEGG_OXIDATIVE_PHOSPHORYLATION, (G) Enrichment plot: KEGG_GLUTATHIONE_METABOLISM, and (H) Enrichment plot: KEGG_GLYOXYLATE_AND_DICARBOXYLATE_METABOLISM.
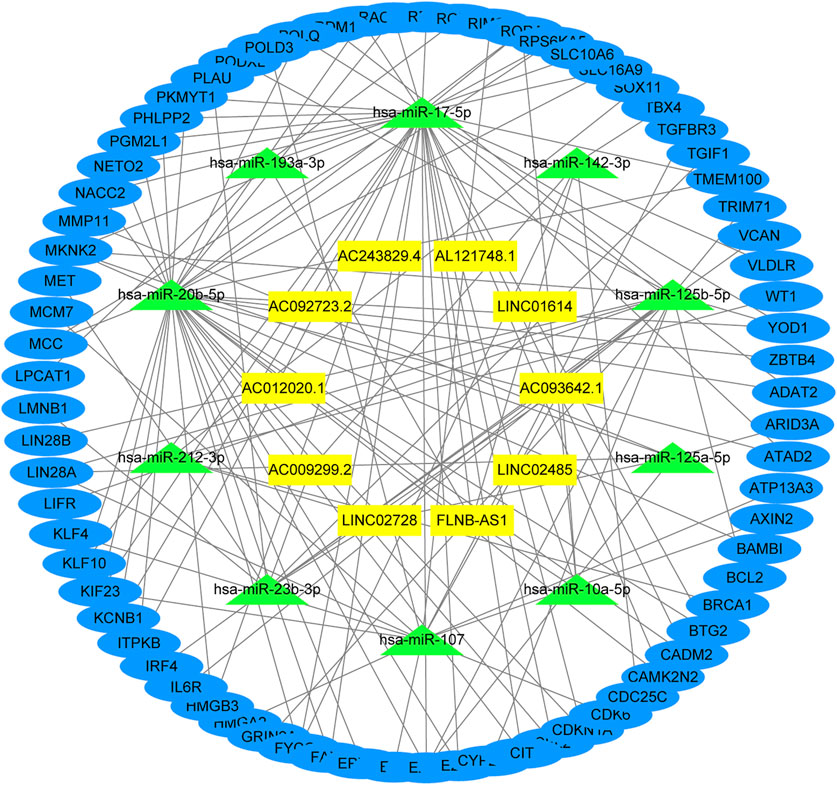
FIGURE 6. Function analysis of these 10 lncRNAs. The lncRNA-miRNA-mRNA network was constructed by integrating differential genes and predicted results from miRCode, TargetScan, miRDB, and miRTarBase database.
Immunotherapy is a new treatment for stomach cancer that may improve the antitumor ability in patients by activating their immune systems. However, not all patients with gastric cancer are suitable for immunotherapy, suggesting that identifying these patients is vital. Here, the association between the immune landscape and the prognostic model was explored to determine whether the risk score helps to identify patients who would possibly benefit from immunotherapy. Immune infiltration was compared between the two risk groups using ssGSEA and the ESTIMATE algorithm. A heatmap of ssGSEA scores for 16 immune cells and 13 immune functions was plotted (Figure 7A). The higher the ssGSEA score, the stronger the immune activity. Compared with the high-risk group, the immune activities of most innate immune cells (aDCs, DCs, macrophages, NK cells, and pDCs) and adaptive immune cells (CD8+ T, Thf, Th1, Th2, and Treg cells) were higher in the low-risk group (Figure 7B). Similar results were obtained for immune functions, such as checkpoint, cytolytic activity, and type II IFN response (Figure 7C). Immune scores and stromal scores of STAD samples were calculated using the ESTIMATE algorithm. Higher immune scores and lower stromal scores were observed in the low-risk group (Figure 8). Considering the immune-activating environment, particularly the higher immune activity of the “checkpoint”, and higher immune scores of the low-risk group, the response to immunotherapy would likely differ between the two risk groups. Hence, immune checkpoint inhibitor therapy was analyzed next.
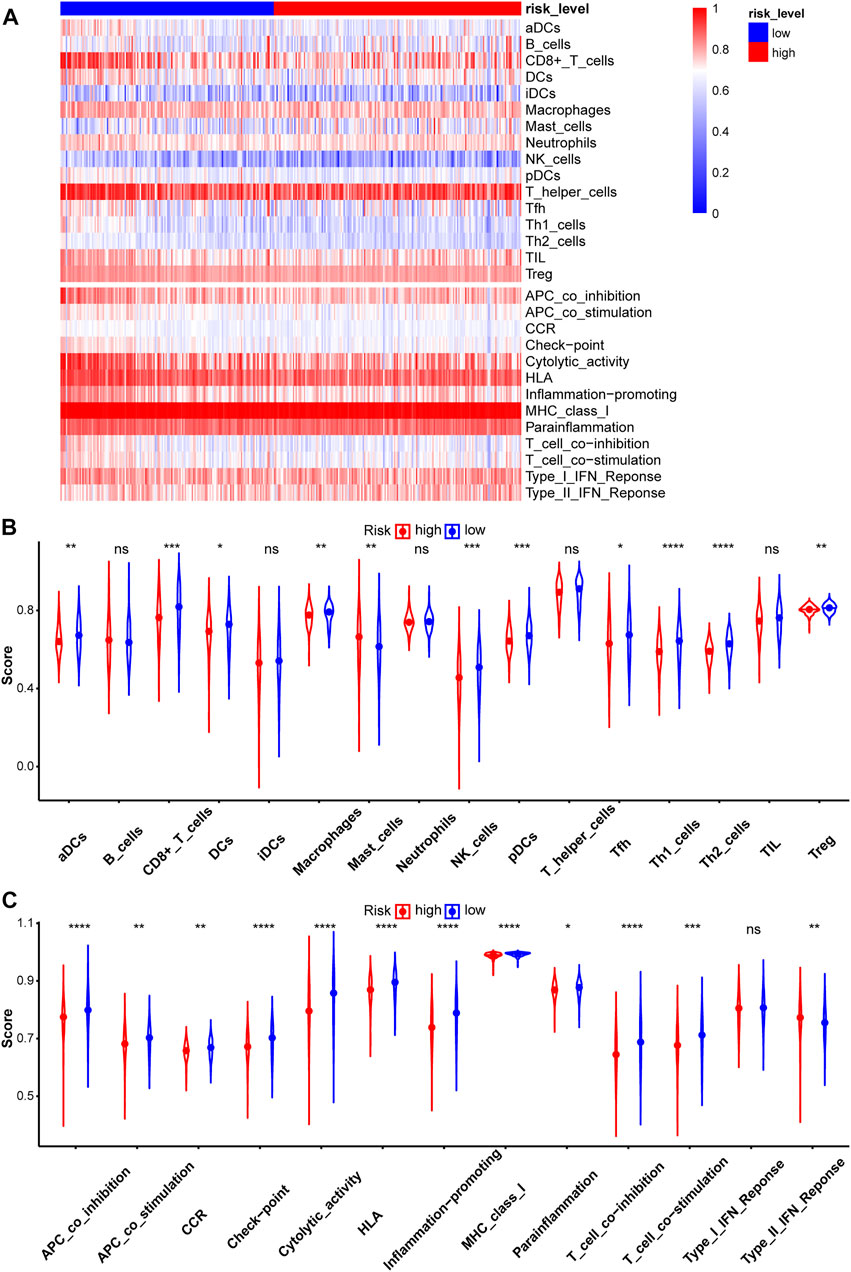
FIGURE 7. Evaluation of Immune infiltration between two risk groups in the test2 cohort. (A) The heatmap of ssGSEA scores in patients with STAD was plotted to quantify the immune activity of immune cells and immune functions. The ssGSEA scores of 16 immune cells (B) and 13 immune functions (C).
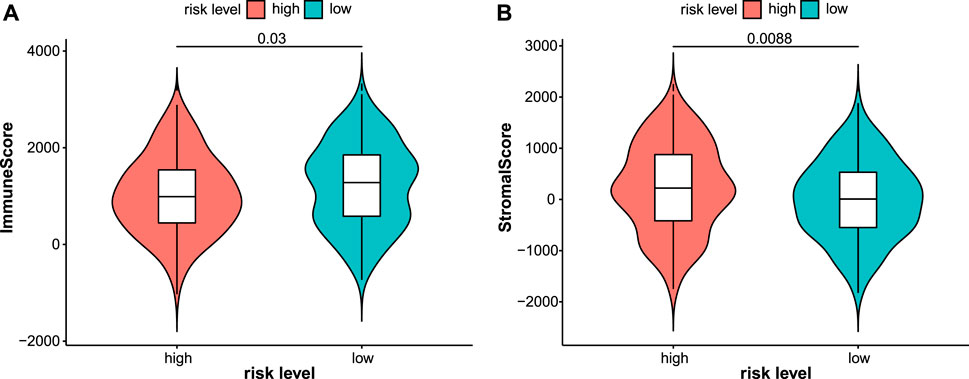
FIGURE 8. Immune and stromal scores were calculated by the ESTIMATE algorithm in the test2 cohort. Patients in the low-risk group had higher immune scores (A) while lower stromal scores (B).
The TMB is a potential biomarker for selecting patients who may respond to immune checkpoint inhibitor therapy (Chan et al., 2019). A greater benefit of anti-PD-L1 monoclonal antibody was observed for patients with a high TMB (Peters et al., 2017). The TMB was calculated and compared between the two risk groups (Figure 9B). Patients in the low-risk group had a higher TMB, indicating that they may benefit from ICI therapy. The association between the expression of 10 lncRNAs and the TMB was analyzed. Higher TMBs were observed in patients with lower expression of AC093642.1 and AL121748.1 (Figure 9A). In addition, gene mutations in STAD samples based on risk levels were presented in detail (Supplementary Figure S8). The top three genes were TTN, TP53, and MUC16. Genes exhibited different mutation ratios including KMT2D [16 of 176 (9.1%) vs. 34 of 153 (22.2%)], PIK3CA [15 of 176 (8.5%) vs. 32 of 153 (20.9%)], ARID1A [35 of 176 (19.9%) vs. 47 of 153 (30.7%)], HMCN1 [19 of 176 (10.8%) vs. 32 of 153 (20.9%)], and TTN [75 of 176 (42.6%) vs. 79 of 153 (51.6%)]. TIDE scores were calculated to predict the ICI response, which were used to simulate two mechanisms of tumor immune evasion: inducing T cell dysfunction and preventing T cell infiltration (Jiang et al., 2018; Fu et al., 2020). Patients with lower TIDE scores had a lower chance of immune evasion and received more benefits from ICI therapy. The violin plot showed that patients in the low-risk group had lower TIDE scores (Figure 9C). Patients with STAD who responded to immune checkpoint inhibitors had lower risk scores (Figure 9D). Next, we explored the relationship between risk scores and common immune checkpoints. Compared with the high-risk group, the expression of some immune checkpoints was significantly higher in the low-risk group (Figure 10).
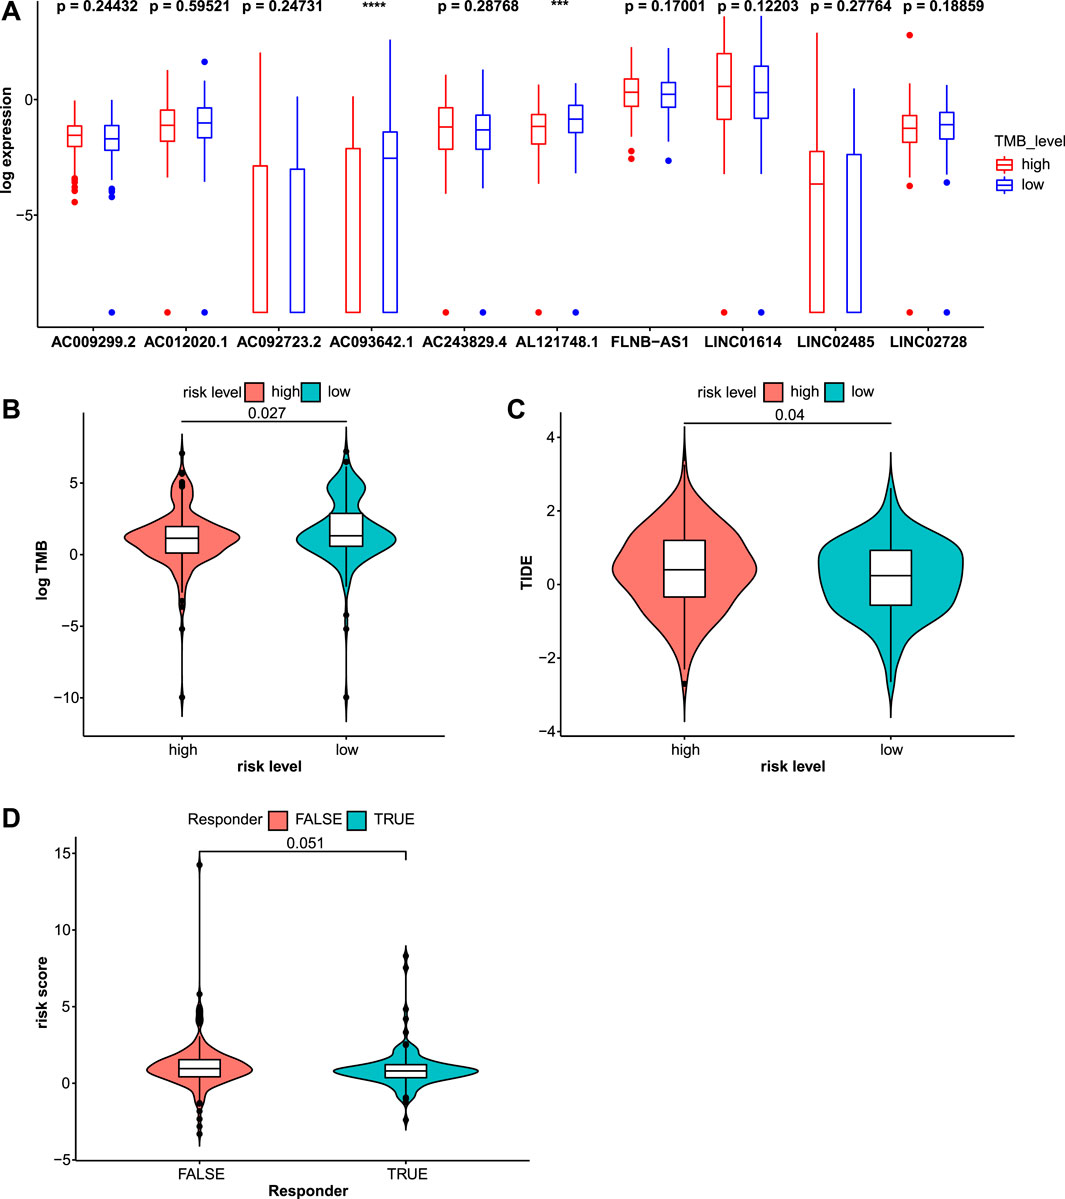
FIGURE 9. Immune checkpoint inhibitor (ICI) therapy response was assessed through the TMB and TIDE scores in the test2 cohort. (A) The expression values of these 10 lncRNAs were compared in different TMB levels. (B) The TMB was significantly distinct in the high- and low-risk groups. (C) Patients in the high-risk group had higher TIDE scores indicating a higher chance of immune evasion. (D) Risk scores for patients who responded to ICI therapy and those who did not were compared.
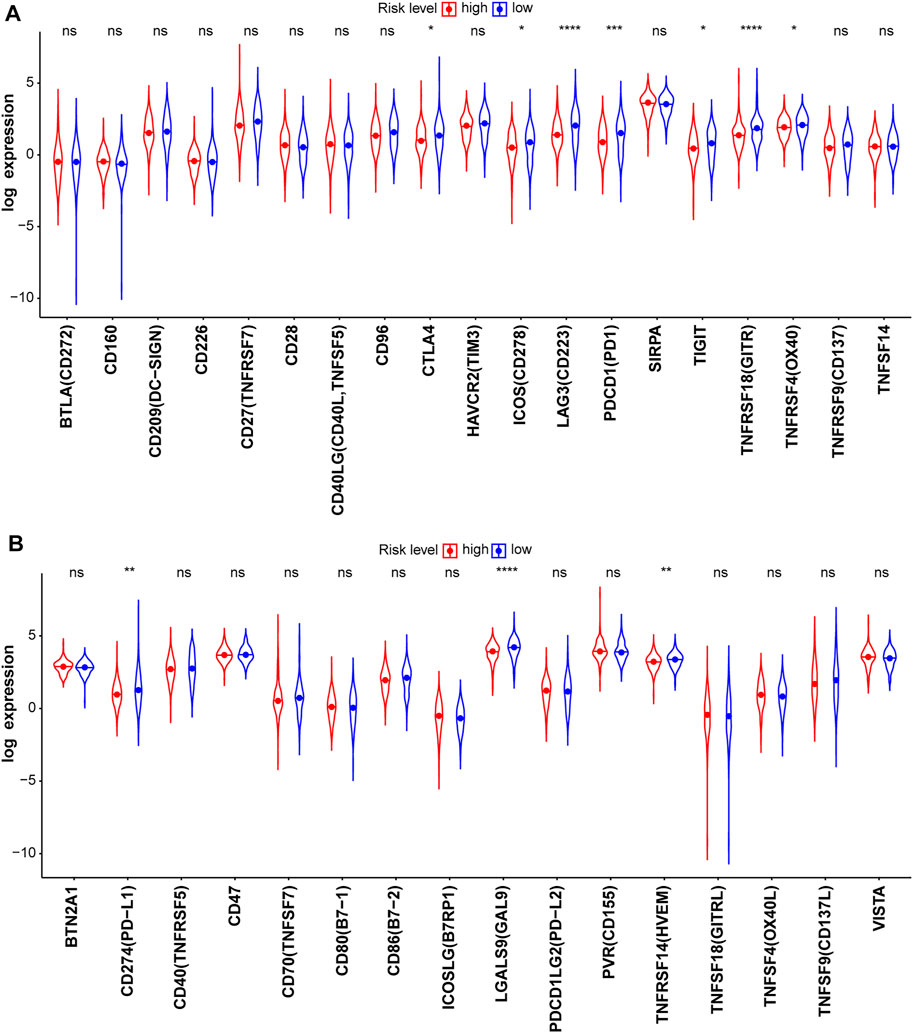
FIGURE 10. Known immune checkpoints (A) and their ligands (B) in the test2 cohort.
The association between this prognostic model and the efficacy of chemotherapeutic drugs was analyzed. The IC50 values of common chemotherapeutic drugs were predicted and compared between the high- and low-risk groups. Patients in the low-risk group had significantly lower IC50 values and were more sensitive to cisplatin, docetaxel, and mitomycin.C. However, no differences in sensitivity to etoposide and paclitaxel were observed (Figure 11).
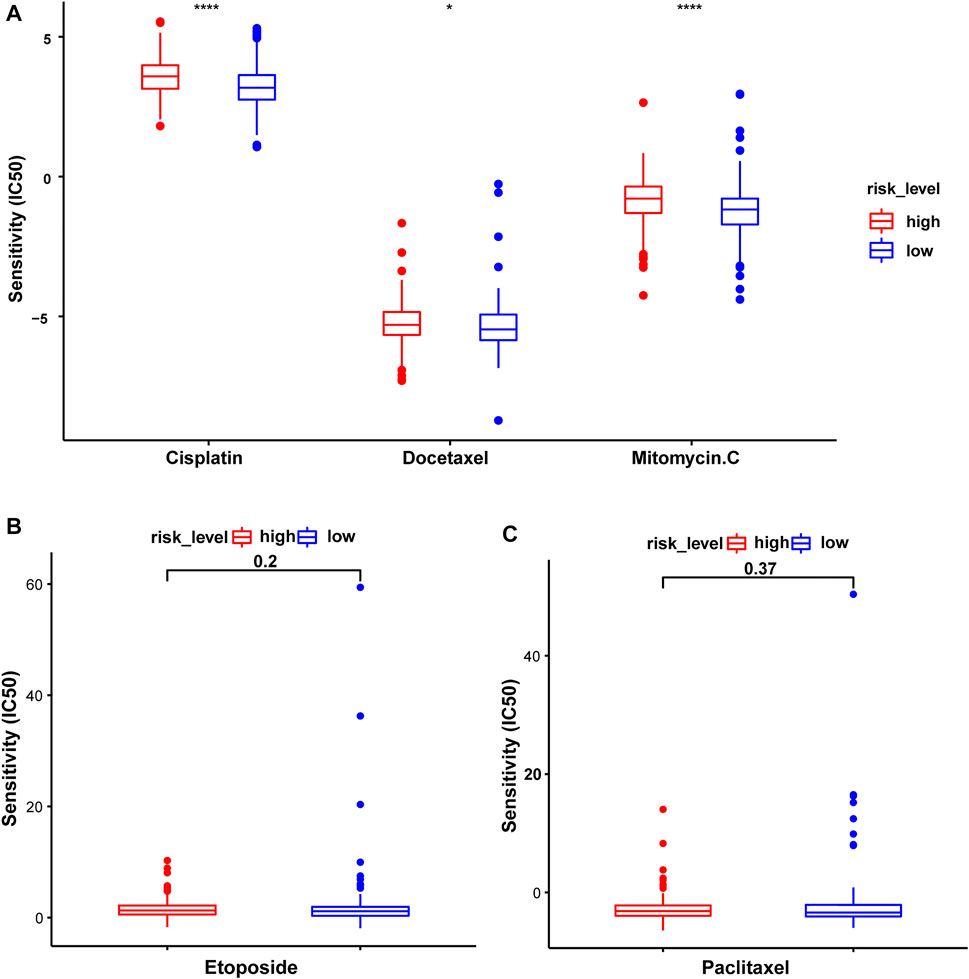
FIGURE 11. The sensitivity to common chemotherapeutic drugs of patients with STAD in the test2 cohort. (A) Cisplatin, Docetaxel, and Mitomycin.C. (B) Etoposide. (C) Paclitaxel.
Ferroptosis is involved in physical conditions or various diseases including cancers (Mou et al., 2019). In recent years, the use of ferroptosis in cancer treatment has attracted great attention. Ultrasmall silica nanoparticles induce ferroptosis and suppress tumor growth, suggesting their therapeutic potential (Kim et al., 2016). The imbalance between the transcription factors HIC1 and HNF4A, regulating ferroptosis up-regulated factors (FUF), and ferroptosis down-regulated factors (FDF), respectively, may help treat liver cancer (Zhang et al., 2019). In lung adenocarcinoma, STK11/KEAP1 commutation leads to resistance to pharmacologically induced ferroptosis and high expression of ferroptosis-protective genes, which is associated with early death and aggressive tumor development (Wohlhieter et al., 2020). These results indicate that the induction of ferroptosis in cancer cells can effectively improve the prognosis and enhance treatment efficacy. Hence, ferroptosis-related biomarkers, which are reliable predictors of the prognosis and treatment response, have been developed for a wide range of malignant tumors (Liu Y. et al., 2020; Wu G. et al., 2020; Zhuo et al., 2020; Jiang et al., 2021). A ferroptosis-related 15-gene signature of LUAD is built and can accurately predict the prognosis (Zhang et al., 2021). A novel ferroptosis-related gene signature for prognostic prediction in patients with glioma is built and the association between these genes and immune checkpoint molecules is revealed (Chen Z. et al., 2021). Considering the important role of lncRNAs in epigenetic regulation, transcriptional regulation, post-transcriptional regulation, and protein-coding gene regulation, we developed a reliable biomarker by integrating ferroptosis and lncRNAs. In our study, a prognostic model with good predictive performance based on 10 ferroptosis-related lncRNAs was constructed and patients with stomach cancer were divided into two risk groups based on risk scores. Patients in the low-risk group had a longer overall survival time than those in the high-risk group.
Underlying biological mechanisms, which resulted in prognostic differences, were revealed by GSEA. Metabolic pathways, including oxidative phosphorylation, glutathione metabolism, and glyoxylate and dicarboxylate metabolism, were enriched in the low-risk group. The Warburg effect shows that the energy needed for cellular processes is primarily generated through mitochondrial oxidative phosphorylation (OXPHOS) and aerobic glycolysis, in normal differentiated cells and most cancer cells, respectively (Vander Heiden et al., 2009). Compared with oxidative phosphorylation, aerobic glycolysis is less efficient at generating adenosine 5′-triphosphate (ATP). Intestinal gastric carcinomas, but not precancerous stages, are often characterized by loss of OXPHOS complex I, acting as tumor suppressors, and this pathological phenomenon occurs independently of Helicobacter pylori infection (Feichtinger et al., 2017). Glutathione metabolism and ferroptosis are closely related. The glutathione/GPX4-independent axis suppresses ferroptosis, and GPX4 protects cells from ferroptosis by decreasing phospholipid peroxides via glutathione (Stockwell et al., 2020). In addition, glutathione (GSH) metabolism plays a beneficial or pathogenic role in a variety of malignant tumors and excess GSH promotes tumor progression and metastasis (Bansal and Simon, 2018). Altered glyoxylate and dicarboxylate metabolism are associated with the chromosomal instability status in gastric cancer (Tsai et al., 2018). Genes in the high-risk group were significantly enriched in the TGF-beta signaling pathway, adherens junction, and MAPK signaling pathway, among others. The transforming growth factor (TGF)-β signaling pathway has a dual function and pleiotropic nature. This pathway has tumor suppressor functions in normal and early-stage cancer cells, including cell-cycle arrest and apoptosis, but has cancer-promoting functions in late-stage cancer cells, including metastasis and chemoresistance (Colak and Ten Dijke, 2017; Seoane and Gomis, 2017). Activation of transforming growth factor-beta 1 Signaling in fibroblasts increases the motility and invasiveness of gastric cancer cells (Ishimoto et al., 2017). The TGF-β receptor inhibitor, LY2109761, increases radiosensitivity in GC by regulating the TGF-β/SMAD4 signaling pathway (Yang et al., 2019). Mitogen-activated protein kinases (MAPKs) include three major subfamilies: extracellular-signal-regulated kinases (ERK MAPKs), c-Jun N-terminal kinases, stress-activated protein kinases (JNKs or SAPKs), and MAPK14 (Fang and Richardson, 2005).
Relatively little research has been conducted on these 10 lncRNAs at present. LINC01614 is identified as an oncogenic lncRNA that promotes proliferation and migration in gastric cancer (Chen Y. et al., 2021). LINC01614 promotes FOXP1 expression by inhibiting miR-217, which ultimately stimulates the development of LUAD (Liu et al., 2018). Upregulation of LINC01614, induced by SP1, promotes malignant glioma progression by modulating the miR-383/ADAM12 axis (Wang et al., 2020). These studies imply that LINC01614 is a factor contributing to an unfavorable prognosis of various cancers, consistent with our results. The expression levels of FLNB-AS1 are positively correlated with the survival probability of patients with breast cancer and FLNB-AS1 may be a potential diagnostic or prognostic marker of tamoxifen resistance (Zhang X. et al., 2020). AL121748.1 may be involved in multiple metabolic processes, such as amino acid, lipid, and glucose metabolism in cirrhotic HCC (Ma and Deng, 2019). By constructing a ceRNA network, the functions of some lncRNAs were explored. The GO analysis showed that these lncRNAs were involved in cell cycle regulation, especially the G1/S phase transition, which was related to the transition from RNA and ribosome synthesis to the reproduction of genetic material. The KEGG analysis showed that these lncRNAs were involved in several pathways, including microRNAs in cancer, the cell cycle, the PI3K−Akt signaling pathway, and various cancers. However, the functions mentioned above required further biological verification.
Using current standard therapies, the prognosis of patients with advanced-stage gastric cancer remains poor (Zhao et al., 2019). Immunotherapy, an innovative approach, is developed to improve the survival rate of patients with various cancers, such as lung cancer, gastric cancer, and breast cancer. In this study, immune infiltration was assessed using ssGSEA and the ESTIMATE algorithm. The abundance of several innate immune cells and adaptive immune cells, such as CD8+ T cells, DCs, pDCs, and Tregs, was lower in the high-risk subgroup. Patients with advanced non-small-cell lung cancer presenting with greater CD8+ T cell infiltration exhibit a superior treatment response to pembrolizumab, an anti-PD-1 drug (Garon et al., 2019). Dendritic cells (DCs), which are antigen-presenting cells, often eliminate tumors by stimulating naive T cell differentiation (Fu et al., 2021). HIF-1α inhibits plasmacytoid DC (pDC) differentiation, leading to tumor progression (Labiano et al., 2015). Treg cells are key subsets of effector T cells with strong immunosuppressive effects. The immune activity of most of the immune functions was higher in the low-risk subgroup, such as checkpoint, cytolytic activity, and type II IFN response. The immune cytolytic activity score reflects antitumor immunity and predicts clinical outcomes of patients with GC (Hu et al., 2021). Type II IFN (IFN-γ) is a critical driver of programmed death ligand-1 (PD-L1) expression in cancer and host cells (Ayers et al., 2017). These results showed that patients in the high-risk group were immunosuppressed compared to the other group.
Considering the immune-activating environment and higher immune scores in the low-risk group, we speculated a potentially significant difference in immunotherapy efficacy in the two subgroups. Thus, ICI therapy was studied in detail. The immune checkpoint inhibitor response was assessed by calculating the TMB and TIDE scores. The results showed higher TMB and lower TIDE scores for the low-risk group, indicating that these patients might receive a greater benefit from ICI therapy. Common immune checkpoints, such as PD1, PD-L1, and CTLA4, were expressed at high levels in the low-risk group, which validated this speculation. Pembrolizumab, an anti-PD-1 drug, has shown manageable safety and promising activity in patients with advanced gastric or gastroesophageal junction cancer who have received at least 2 lines of treatment (Fuchs et al., 2018; Smyth et al., 2020). Nivolumab, an antibody inhibitor of programmed death-1 (PD-1), is approved as an option for third- or later-line treatment of advanced gastric/gastroesophageal junction (G/GEJ) cancer (Kang et al., 2017; Janjigian et al., 2018; Boku et al., 2019). In addition, the genetic mutation waterfall diagram showed that KMT2D, PIK3CA, ARID1A, HMCN1, and TTN mutations were enriched in the low-risk group. KMT2D mutant cells show higher protein turnover and IFNγ-stimulated antigen presentation and both mice and human KMT2D mutant tumors show increased immune infiltration (Wang G.et al., 2020). The PIK3CA mutation may alter the levels of PD-1, PD-L1, and PD-L2 (Cho et al., 2019; Liu J. et al., 2020). The frequency of TTN mutations is significantly positively correlated with the objective response rate of patients receiving anti-PD1/PD-L1/CTLA-4 monotherapy (Jia et al., 2019). In summary, risk scores based on 10 ferroptosis-related lncRNAs could help screen patients with stomach cancer who might benefit from immunotherapy.
Accumulating studies have shown that ferroptosis and chemotherapy are inseparable. Erastin, an inducer of ferroptosis, enhances the sensitivity to chemotherapy, and radiotherapy, suggesting a promising future application in cancer therapy (Zhao et al., 2020). Cisplatin and paclitaxel promote miR-522 secretion which decreases the accumulation of lipid-ROS by suppressing ALOX15 expression and ultimately results in chemoresistance in gastric cancer (Zhang H. et al., 2020). In our study, risk stratification based on 10 ferroptosis-related lncRNAs was correlated with the response to several common chemotherapeutic drugs. Patients with stomach cancer in the low-risk group experienced greater survival benefit from chemotherapy with mitomycin. C, cisplatin, and docetaxel. These findings might be helpful to guide the selection of personalized chemotherapy drugs.
Undoubtedly, there were some limitations in this study. Firstly, the sample size was relatively limited. To verify the modeling results, the TCGA cohort was split, which destroyed the model efficiency to a certain extent. Secondly, clinical information was deficient, which resulted in limited analysis related to important clinical factors. Finally, all results were obtained by statistical analysis, biological tests were needed further to verify.
The original contributions presented in the study are included in the article/Supplementary Material, further inquiries can be directed to the corresponding authors.
XG, DS, and CL conceived and designed the study. DL and LT were responsible for the collection and assembly of data, data analysis, and interpretation. GW, DJ, and DSL provided help in revising the manuscript. GW and DSL provided help in revising the article. All authors read and approved the final article.
This work was supported by the National Natural Science Foundation of China (81772829 and 81830052), the Special Program for Collaborative Innovation, the Construction Project of Shanghai Key Laboratory of Molecular Imaging (18DZ2260400), and Hunan Province National Science Foundation of China (NO. 2018JJ3895), “Top-100 Talent Cultivation Plan” of Shanghai University of Medicine and Health Sciences, and Funding Scheme for Training Young Teachers in Shanghai Colleges.
The authors declare that the research was conducted in the absence of any commercial or financial relationships that could be construed as a potential conflict of interest.
All claims expressed in this article are solely those of the authors and do not necessarily represent those of their affiliated organizations, or those of the publisher, the editors and the reviewers. Any product that may be evaluated in this article, or claim that may be made by its manufacturer, is not guaranteed or endorsed by the publisher.
The Supplementary Material for this article can be found online at: https://www.frontiersin.org/articles/10.3389/fgene.2021.798612/full#supplementary-material
Supplementary Figure 1 | Validation of the prognostic model in the test1 cohort. (A) Time-independent ROC curves along with their AUC were conducted to assess the sensitivity and specificity. (B) The KM survival curves showed a higher survival rate in the low-risk group. (C) Risk scores for stomach patients with STAD were presented in ascending order. (D) The survival status distribution curve showed a higher proportion of dead patients in the high-risk group. (E) The expression heatmap of these 10 lncRNAs was plotted and significance levels were annotated on the right side. ****p < 0.0001, ***p < 0.001, **p < 0.01, *p < 0.05.
Supplementary Figure 2 | Validation of the prognostic model in the test2 cohort. (A) Time-independent ROC curves along with their AUC were conducted to assess the sensitivity and specificity. (B) The KM survival curves showed a higher survival rate in the low-risk group. (C) Risk scores for patients with STAD were presented in ascending order. (D) The survival status distribution curve showed a higher proportion of dead patients in the high-risk group. (E) The expression heatmap of these 10 lncRNAs was plotted and significance levels were annotated on the right side. ****p < 0.0001, ***p < 0.001, **p < 0.01, *p < 0.05.
Supplementary Figure 3 | The KM survival curves of these 10 lncRNAs with different expression levels were plotted. Based on their median values, lncRNAs were divided into high and low expression groups.
Supplementary Figure 4 | The association between risk scores and clinicopathological factors in the test2 cohort.
Supplementary Figure 5 | (A) Risk scores for patients with or without distant metastases were compared. The KM survival analyses in two pathological M subgroups were conducted, including (B) patients without distant metastases (M0) and (C) patients with distant metastases (M1).
Supplementary Figure 6 | The association between the expression of lncRNAs and clinicopathological factors in the test2 cohort. ****p < 0.0001, ***p < 0.001, **p < 0.01, *p < 0.05.
Supplementary Figure 7 | Functional analysis of these 10 lncRNAs. The top 20 results of GO terms in BP (A, B) and KEGG pathways (C, D) were shown. P-value and q-value were both 0.05 as cutoff values.
Supplementary Figure 8 | Gene mutations based on risk levels in the test2 cohort. The top 20 genes were presented.
2https://portal.gdc.cancer.gov/.
3http://www.zhounan.org/ferrdb/.
4https://www.gencodegenes.org/.
6http://www.targetscan.org/vert_72/.
8https://mirtarbase.cuhk.edu.cn/∼miRTarBase/miRTarBase_2019/php/index.php.
9https://portal.gdc.cancer.gov/.
10http://tide.dfci.harvard.edu/.
Agarwal, V., Bell, G. W., Nam, J.-W., and Bartel, D. P. (2015). Predicting Effective microRNA Target Sites in Mammalian mRNAs. eLife 4, e05005. doi:10.7554/eLife.05005
Alexander, R. P., Fang, G., Rozowsky, J., Snyder, M., and Gerstein, M. B. (2010). Annotating Non-coding Regions of the Genome. Nat. Rev. Genet. 11, 559–571. doi:10.1038/nrg2814
Ayers, M., Lunceford, J., Nebozhyn, M., Murphy, E., Loboda, A., Kaufman, D. R., et al. (2017). IFN-γ-related mRNA Profile Predicts Clinical Response to PD-1 Blockade. J. Clin. Invest. 127, 2930–2940. doi:10.1172/jci91190
Bansal, A., and Simon, M. C. (2018). Glutathione Metabolism in Cancer Progression and Treatment Resistance. J. Cel. Biol. 217, 2291–2298. doi:10.1083/jcb.201804161
Bhan, A., Soleimani, M., and Mandal, S. S. (2017). Long Noncoding RNA and Cancer: A New Paradigm. Cancer Res. 77, 3965–3981. doi:10.1158/0008-5472.Can-16-2634
Boku, N., Ryu, M.-H., Kato, K., Chung, H. C., Minashi, K., Lee, K.-W., et al. (2019). Safety and Efficacy of Nivolumab in Combination with S-1/capecitabine Plus Oxaliplatin in Patients with Previously Untreated, Unresectable, Advanced, or Recurrent Gastric/gastroesophageal junction Cancer: Interim Results of a Randomized, Phase II Trial (ATTRACTION-4). Ann. Oncol. 30, 250–258. doi:10.1093/annonc/mdy540
Chan, T. A., Yarchoan, M., Jaffee, E., Swanton, C., Quezada, S. A., Stenzinger, A., et al. (2019). Development of Tumor Mutation burden as an Immunotherapy Biomarker: Utility for the Oncology Clinic. Ann. Oncol. 30, 44–56. doi:10.1093/annonc/mdy495
Chen Y, Y., Cheng, W. Y., Shi, H., Huang, S., Chen, H., Liu, D., et al. (2021). Classifying Gastric Cancer Using FLORA Reveals Clinically Relevant Molecular Subtypes and Highlights LINC01614 as a Biomarker for Patient Prognosis. Oncogene 40, 2898–2909. doi:10.1038/s41388-021-01743-3
Chen, Y., and Wang, X. (2020). miRDB: an Online Database for Prediction of Functional microRNA Targets. Nucleic Acids Res. 48, D127–d131. doi:10.1093/nar/gkz757
Chen Z, Z., Wu, T., Yan, Z., and Zhang, M. (2021). Identification and Validation of an 11-Ferroptosis Related Gene Signature and its Correlation with Immune Checkpoint Molecules in Glioma. Front. Cel Dev. Biol. 9, 652599. doi:10.3389/fcell.2021.652599
Cho, J., Ahn, S., Son, D. S., Kim, N. K., Lee, K. W., Kim, S., et al. (2019). Bridging Genomics and Phenomics of Gastric Carcinoma. Int. J. Cancer 145, 2407–2417. doi:10.1002/ijc.32228
Colak, S., and Ten Dijke, P. (2017). Targeting TGF-β Signaling in Cancer. Trends Cancer 3, 56–71. doi:10.1016/j.trecan.2016.11.008
Dixon, S. J., Lemberg, K. M., Lamprecht, M. R., Skouta, R., Zaitsev, E. M., Gleason, C. E., et al. (2012). Ferroptosis: an Iron-dependent Form of Nonapoptotic Cell Death. Cell 149, 1060–1072. doi:10.1016/j.cell.2012.03.042
Fang, J. Y., and Richardson, B. C. (2005). The MAPK Signalling Pathways and Colorectal Cancer. Lancet Oncol. 6, 322–327. doi:10.1016/s1470-2045(05)70168-6
Feichtinger, R. G., Neureiter, D., Skaria, T., Wessler, S., Cover, T. L., Mayr, J. A., et al. (2017). Oxidative Phosphorylation System in Gastric Carcinomas and Gastritis. Oxidative Med. Cell. longevity 2017, 1–14. doi:10.1155/2017/1320241
Frankish, A., Diekhans, M., Ferreira, A.-M., Johnson, R., Jungreis, I., Loveland, J., et al. (2019). GENCODE Reference Annotation for the Human and Mouse Genomes. Nucleic Acids Res. 47, D766–d773. doi:10.1093/nar/gky955
Fu, J., Li, K., Zhang, W., Wan, C., Zhang, J., Jiang, P., et al. (2020). Large-scale Public Data Reuse to Model Immunotherapy Response and Resistance. Genome Med. 12, 21. doi:10.1186/s13073-020-0721-z
Fu, Y., Bao, Q., Liu, Z., He, G., Wen, J., Liu, Q., et al. (2021). Development and Validation of a Hypoxia-Associated Prognostic Signature Related to Osteosarcoma Metastasis and Immune Infiltration. Front. Cel Dev. Biol. 9, 633607. doi:10.3389/fcell.2021.633607
Fuchs, C. S., Doi, T., Jang, R. W., Muro, K., Satoh, T., Machado, M., et al. (2018). Safety and Efficacy of Pembrolizumab Monotherapy in Patients with Previously Treated Advanced Gastric and Gastroesophageal Junction Cancer. JAMA Oncol. 4, e180013. doi:10.1001/jamaoncol.2018.0013
Garon, E. B., Hellmann, M. D., Rizvi, N. A., Carcereny, E., Leighl, N. B., Ahn, M.-J., et al. (2019). Five-Year Overall Survival for Patients with Advanced Non‒Small-Cell Lung Cancer Treated with Pembrolizumab: Results from the Phase I KEYNOTE-001 Study. Jco 37, 2518–2527. doi:10.1200/jco.19.00934
Geeleher, P., Cox, N., and Huang, R. S. (2014). pRRophetic: an R Package for Prediction of Clinical Chemotherapeutic Response from Tumor Gene Expression Levels. PLoS One 9, e107468. doi:10.1371/journal.pone.0107468
Goldman, M. J., Craft, B., Hastie, M., Repečka, K., McDade, F., Kamath, A., et al. (2020). Visualizing and Interpreting Cancer Genomics Data via the Xena Platform. Nat. Biotechnol. 38, 675–678. doi:10.1038/s41587-020-0546-8
Hu, Q., Nonaka, K., Wakiyama, H., Miyashita, Y., Fujimoto, Y., Jogo, T., et al. (2021). Cytolytic Activity Score as a Biomarker for Antitumor Immunity and Clinical Outcome in Patients with Gastric Cancer. Cancer Med. 10, 3129–3138. doi:10.1002/cam4.3828
Huang, H.-Y., Lin, Y.-C. -D., Li, J., Huang, K.-Y., Shrestha, S., Hong, H.-C., et al. (2020). miRTarBase 2020: Updates to the Experimentally Validated microRNA-Target Interaction Database. Nucleic Acids Res. 48, D148–d154. doi:10.1093/nar/gkz896
Hutter, C., and Zenklusen, J. C. (2018). The Cancer Genome Atlas: Creating Lasting Value beyond its Data. Cell 173, 283–285. doi:10.1016/j.cell.2018.03.042
Ishimoto, T., Miyake, K., Nandi, T., Yashiro, M., Onishi, N., Huang, K. K., et al. (2017). Activation of Transforming Growth Factor Beta 1 Signaling in Gastric Cancer-Associated Fibroblasts Increases Their Motility, via Expression of Rhomboid 5 Homolog 2, and Ability to Induce Invasiveness of Gastric Cancer Cells. Gastroenterology 153, 191–204. doi:10.1053/j.gastro.2017.03.046
Janjigian, Y. Y., Bendell, J., Calvo, E., Kim, J. W., Ascierto, P. A., Sharma, P., et al. (2018). CheckMate-032 Study: Efficacy and Safety of Nivolumab and Nivolumab Plus Ipilimumab in Patients with Metastatic Esophagogastric Cancer. Jco 36, 2836–2844. doi:10.1200/jco.2017.76.6212
Jeggari, A., Marks, D. S., and Larsson, E. (2012). miRcode: a Map of Putative microRNA Target Sites in the Long Non-coding Transcriptome. Bioinformatics (Oxford, England) 28, 2062–2063. doi:10.1093/bioinformatics/bts344
Jia, Q., Wang, J., He, N., He, J., and Zhu, B. (2019). Titin Mutation Associated with Responsiveness to Checkpoint Blockades in Solid Tumors. JCI insight 4, e127901. doi:10.1172/jci.insight.127901
Jiang, P., Gu, S., Pan, D., Fu, J., Sahu, A., Hu, X., et al. (2018). Signatures of T Cell Dysfunction and Exclusion Predict Cancer Immunotherapy Response. Nat. Med. 24, 1550–1558. doi:10.1038/s41591-018-0136-1
Jiang, Q., Wang, K., Zhang, X., Ouyang, B., Liu, H., Pang, Z., et al. (2020). Platelet Membrane‐Camouflaged Magnetic Nanoparticles for Ferroptosis‐Enhanced Cancer Immunotherapy. Small 16, 2001704. doi:10.1002/smll.202001704
Jiang, X., Yan, Q., Xie, L., Xu, S., Jiang, K., Huang, J., et al. (2021). Construction and Validation of a Ferroptosis-Related Prognostic Model for Gastric Cancer. J. Oncol. 2021, 1–14. doi:10.1155/2021/6635526
Kang, Y.-K., Boku, N., Satoh, T., Ryu, M.-H., Chao, Y., Kato, K., et al. (2017). Nivolumab in Patients with Advanced Gastric or Gastro-Oesophageal junction Cancer Refractory to, or Intolerant of, at Least Two Previous Chemotherapy Regimens (ONO-4538-12, ATTRACTION-2): a Randomised, Double-Blind, Placebo-Controlled, Phase 3 Trial. The Lancet 390, 2461–2471. doi:10.1016/s0140-6736(17)31827-5
Kim, S. E., Zhang, L., Ma, K., Riegman, M., Chen, F., Ingold, I., et al. (2016). Ultrasmall Nanoparticles Induce Ferroptosis in Nutrient-Deprived Cancer Cells and Suppress Tumour Growth. Nat. Nanotech 11, 977–985. doi:10.1038/nnano.2016.164
Labiano, S., Palazon, A., and Melero, I. (2015). Immune Response Regulation in the Tumor Microenvironment by Hypoxia. Semin. Oncol. 42, 378–386. doi:10.1053/j.seminoncol.2015.02.009
Lang, X., Green, M. D., Wang, W., Yu, J., Choi, J. E., Jiang, L., et al. (2019). Radiotherapy and Immunotherapy Promote Tumoral Lipid Oxidation and Ferroptosis via Synergistic Repression of SLC7A11. Cancer Discov. 9, 1673–1685. doi:10.1158/2159-8290.Cd-19-0338
Lei, G., Zhang, Y., Koppula, P., Liu, X., Zhang, J., Lin, S. H., et al. (2020). The Role of Ferroptosis in Ionizing Radiation-Induced Cell Death and Tumor Suppression. Cell Res 30, 146–162. doi:10.1038/s41422-019-0263-3
Li, J., Cao, F., Yin, H.-l., Huang, Z.-j., Lin, Z.-t., Mao, N., et al. (2020). Ferroptosis: Past, Present and Future. Cell Death Dis 11, 88. doi:10.1038/s41419-020-2298-2
Liang, C., Zhang, X., Yang, M., and Dong, X. (2019). Recent Progress in Ferroptosis Inducers for Cancer Therapy. Adv. Mater 31, 1904197. (Deerfield Beach, Fla). doi:10.1002/adma.201904197
Liu, A. N., Qu, H. J., Yu, C. Y., and Sun, P. (2018). Knockdown of LINC01614 Inhibits Lung Adenocarcinoma Cell Progression by Up‐regulating miR‐217 and down‐regulatingFOXP1. J. Cel. Mol. Med. 22, 4034–4044. doi:10.1111/jcmm.13483
Liu, J., Li, H., Sun, L., Yuan, Y., and Xing, C. (2020). Profiles of PD-1, PD-L1, PD-L2 in Gastric Cancer and Their Relation with Mutation, Immune Infiltration, and Survival. Biomed. Research International 2020, 1–11. doi:10.1155/2020/2496582
Liu, Y., Zhang, X., Zhang, J., Tan, J., Li, J., and Song, Z. (2020). Development and Validation of a Combined Ferroptosis and Immune Prognostic Classifier for Hepatocellular Carcinoma. Front. Cel Dev. Biol. 8, 596679. doi:10.3389/fcell.2020.596679
Ma, L., and Deng, C. (2019). Identification of a Novel Four-lncRNA Signature as a Prognostic Indicator in Cirrhotic Hepatocellular Carcinoma. PeerJ 7, e7413. doi:10.7717/peerj.7413
Mao, C., Wang, X., Liu, Y., Wang, M., Yan, B., Jiang, Y., et al. (2018). A G3BP1-Interacting lncRNA Promotes Ferroptosis and Apoptosis in Cancer via Nuclear Sequestration of P53. Cancer Res. 78, 3484–3496. doi:10.1158/0008-5472.Can-17-3454
Marano, L., Boccardi, V., Braccio, B., Esposito, G., Grassia, M., Petrillo, M., et al. (2015). Comparison of the 6th and 7th Editions of the AJCC/UICC TNM Staging System for Gastric Cancer Focusing on the "N" Parameter-Related Survival: the Monoinstitutional NodUs Italian Study. World J. Surg. Onc 13, 215. doi:10.1186/s12957-015-0633-3
Mou, Y., Wang, J., Wu, J., He, D., Zhang, C., Duan, C., et al. (2019). Ferroptosis, a New Form of Cell Death: Opportunities and Challenges in Cancer. J. Hematol. Oncol. 12, 34. doi:10.1186/s13045-019-0720-y
Peters, S., Gettinger, S., Johnson, M. L., Jänne, P. A., Garassino, M. C., Christoph, D., et al. (2017). Phase II Trial of Atezolizumab as First-Line or Subsequent Therapy for Patients with Programmed Death-Ligand 1-Selected Advanced Non-small-cell Lung Cancer (BIRCH). Jco 35, 2781–2789. doi:10.1200/jco.2016.71.9476
Seoane, J., and Gomis, R. R. (2017). TGF-β Family Signaling in Tumor Suppression and Cancer Progression. Cold Spring Harb Perspect. Biol. 9, a022277. doi:10.1101/cshperspect.a022277
Smyth, E. C., Nilsson, M., Grabsch, H. I., van Grieken, N. C., and Lordick, F. (2020). Gastric Cancer. The Lancet 396, 635–648. doi:10.1016/s0140-6736(20)31288-5
Stockwell, B. R., Jiang, X., and Gu, W. (2020). Emerging Mechanisms and Disease Relevance of Ferroptosis. Trends Cell Biology 30, 478–490. doi:10.1016/j.tcb.2020.02.009
Sung, H., Ferlay, J., Siegel, R. L., Laversanne, M., Soerjomataram, I., Jemal, A., et al. (2021). Global Cancer Statistics 2020: GLOBOCAN Estimates of Incidence and Mortality Worldwide for 36 Cancers in 185 Countries. CA A. Cancer J. Clin. 71, 209–249. doi:10.3322/caac.21660
Tang, R., Xu, J., Zhang, B., Liu, J., Liang, C., Hua, J., et al. (2020). Ferroptosis, Necroptosis, and Pyroptosis in Anticancer Immunity. J. Hematol. Oncol. 13, 110. doi:10.1186/s13045-020-00946-7
Tsai, C.-K., Yeh, T.-S., Wu, R.-C., Lai, Y.-C., Chiang, M.-H., Lu, K.-Y., et al. (2018). Metabolomic Alterations and Chromosomal Instability Status in Gastric Cancer. Wjg 24, 3760–3769. doi:10.3748/wjg.v24.i33.3760
Vander Heiden, M. G., Cantley, L. C., and Thompson, C. B. (2009). Understanding the Warburg Effect: the Metabolic Requirements of Cell Proliferation. Science 324, 1029–1033. doi:10.1126/science.1160809
Wang G, G., Chow, R. D., Zhu, L., Bai, Z., Ye, L., Zhang, F., et al. (2020). CRISPR-GEMM Pooled Mutagenic Screening Identifies KMT2D as a Major Modulator of Immune Checkpoint Blockade. Cancer Discov. 10, 1912–1933. doi:10.1158/2159-8290.Cd-19-1448
Wang H, H., Wu, J., and Guo, W. (2020). SP1-Mediated Upregulation of lncRNA LINC01614 Functions a ceRNA for miR-383 to Facilitate Glioma Progression through Regulation of ADAM12. Ott 13, 4305–4318. doi:10.2147/ott.S242854
Wang, M., Mao, C., Ouyang, L., Liu, Y., Lai, W., Liu, N., et al. (2019). Long Noncoding RNA LINC00336 Inhibits Ferroptosis in Lung Cancer by Functioning as a Competing Endogenous RNA. Cell Death Differ 26, 2329–2343. doi:10.1038/s41418-019-0304-y
Wang, W., Green, M., Choi, J. E., Gijón, M., Kennedy, P. D., Johnson, J. K., et al. (2019). CD8+ T Cells Regulate Tumour Ferroptosis during Cancer Immunotherapy. Nature 569, 270–274. doi:10.1038/s41586-019-1170-y
Wohlhieter, C. A., Richards, A. L., Uddin, F., Hulton, C. H., Quintanal-Villalonga, À., Martin, A., et al. (2020). Concurrent Mutations in STK11 and KEAP1 Promote Ferroptosis Protection and SCD1 Dependence in Lung Cancer. Cel Rep. 33, 108444. doi:10.1016/j.celrep.2020.108444
Wu, G., Wang, Q., Xu, Y., Li, Q., and Cheng, L. (2020). A New Survival Model Based on Ferroptosis-Related Genes for Prognostic Prediction in clear Cell Renal Cell Carcinoma. Aging 12, 14933–14948. doi:10.18632/aging.103553
Wu, Y., Zhang, S., Gong, X., Tam, S., Xiao, D., Liu, S., et al. (2020). The Epigenetic Regulators and Metabolic Changes in Ferroptosis-Associated Cancer Progression. Mol. Cancer 19, 39. doi:10.1186/s12943-020-01157-x
Yang, T., Huang, T., Zhang, D., Wang, M., Wu, B., Shang, Y., et al. (2019). TGF-β Receptor Inhibitor LY2109761 Enhances the Radiosensitivity of Gastric Cancer by Inactivating the TGF-Β/smad4 Signaling Pathway. Aging 11, 8892–8910. doi:10.18632/aging.102329
Yoshihara, K., Shahmoradgoli, M., Martínez, E., Vegesna, R., Kim, H., Torres-Garcia, W., et al. (2013). Inferring Tumour Purity and Stromal and Immune Cell Admixture from Expression Data. Nat. Commun. 4, 2612. doi:10.1038/ncomms3612
Yu, Y., Xie, Y., Cao, L., Yang, L., Yang, M., Lotze, M. T., et al. (2015). The Ferroptosis Inducer Erastin Enhances Sensitivity of Acute Myeloid Leukemia Cells to Chemotherapeutic Agents. Mol. Cell Oncol. 2, e1054549. doi:10.1080/23723556.2015.1054549
Zhang, A., Yang, J., Ma, C., Li, F., and Luo, H. (2021). Development and Validation of a Robust Ferroptosis-Related Prognostic Signature in Lung Adenocarcinoma. Front. Cel Dev. Biol. 9, 616271. doi:10.3389/fcell.2021.616271
Zhang, H., Deng, T., Liu, R., Ning, T., Yang, H., Liu, D., et al. (2020). CAF Secreted miR-522 Suppresses Ferroptosis and Promotes Acquired Chemo-Resistance in Gastric Cancer. Mol. Cancer 19, 43. doi:10.1186/s12943-020-01168-8
Zhang, X., Du, L., Qiao, Y., Zhang, X., Zheng, W., Wu, Q., et al. (2019). Ferroptosis Is Governed by Differential Regulation of Transcription in Liver Cancer. Redox Biol. 24, 101211. doi:10.1016/j.redox.2019.101211
Zhang, X., Gao, S., Li, Z., Wang, W., and Liu, G. (2020). Identification and Analysis of Estrogen Receptor α Promoting Tamoxifen Resistance-Related lncRNAs. Biomed. Research International 2020, 1–10. doi:10.1155/2020/9031723
Zhao, Q., Cao, L., Guan, L., Bie, L., Wang, S., Xie, B., et al. (2019). Immunotherapy for Gastric Cancer: Dilemmas and prospect. Brief. Funct. Genomics 18, 107–112. doi:10.1093/bfgp/ely019
Zhao, Y., Li, Y., Zhang, R., Wang, F., Wang, T., and Jiao, Y. (2020). The Role of Erastin in Ferroptosis and its Prospects in Cancer Therapy. Ott 13, 5429–5441. doi:10.2147/ott.S254995
Zhou, N., and Bao, J. (2020). FerrDb: a Manually Curated Resource for Regulators and Markers of Ferroptosis and Ferroptosis-Disease Associations. Database : J. Biol. Databases Curation 2020, baaa021. doi:10.1093/database/baaa021
Keywords: stomach cancer, ferroptosis, prognostic, lncRNA, immunotherapy, chemotherapy
Citation: Lai D, Tan L, Zuo X, Liu D, Jiao D, Wan G, Lu C, Shen D and Gu X (2022) Prognostic Ferroptosis-Related lncRNA Signatures Associated With Immunotherapy and Chemotherapy Responses in Patients With Stomach Cancer. Front. Genet. 12:798612. doi: 10.3389/fgene.2021.798612
Received: 20 October 2021; Accepted: 06 December 2021;
Published: 03 January 2022.
Edited by:
Jialiang Yang, Geneis (Beijing) Co., Ltd., ChinaReviewed by:
Shuaiqun Wang, Shanghai Maritime University, ChinaCopyright © 2022 Lai, Tan, Zuo, Liu, Jiao, Wan, Lu, Shen and Gu. This is an open-access article distributed under the terms of the Creative Commons Attribution License (CC BY). The use, distribution or reproduction in other forums is permitted, provided the original author(s) and the copyright owner(s) are credited and that the original publication in this journal is cited, in accordance with accepted academic practice. No use, distribution or reproduction is permitted which does not comply with these terms.
*Correspondence: Xuefeng Gu, Z3V4ZkBzdW1ocy5lZHUuY24=; Dongjie Shen, ZWFzdGhlcm9zaGVuQDE2My5jb20=
†These authors have contributed equally to this work
Disclaimer: All claims expressed in this article are solely those of the authors and do not necessarily represent those of their affiliated organizations, or those of the publisher, the editors and the reviewers. Any product that may be evaluated in this article or claim that may be made by its manufacturer is not guaranteed or endorsed by the publisher.
Research integrity at Frontiers
Learn more about the work of our research integrity team to safeguard the quality of each article we publish.