 Jujuan Zhuang
 Danyang Liu1
 Wenjing Qiu
 Jinyang Liu
 Size Chen
95% of researchers rate our articles as excellent or good
Learn more about the work of our research integrity team to safeguard the quality of each article we publish.
Find out more
METHODS article
Front. Genet. , 18 November 2021
Sec. RNA
Volume 12 - 2021 | https://doi.org/10.3389/fgene.2021.773882
This article is part of the Research Topic Machine Learning-Based Methods for RNA Data Analysis, Volume II View all 15 articles
Background: Pseudouridine (Ψ) is a common ribonucleotide modification that plays a significant role in many biological processes. The identification of Ψ modification sites is of great significance for disease mechanism and biological processes research in which machine learning algorithms are desirable as the lab exploratory techniques are expensive and time-consuming.
Results: In this work, we propose a deep learning framework, called PseUdeep, to identify Ψ sites of three species: H. sapiens, S. cerevisiae, and M. musculus. In this method, three encoding methods are used to extract the features of RNA sequences, that is, one-hot encoding, K-tuple nucleotide frequency pattern, and position-specific nucleotide composition. The three feature matrices are convoluted twice and fed into the capsule neural network and bidirectional gated recurrent unit network with a self-attention mechanism for classification.
Conclusion: Compared with other state-of-the-art methods, our model gets the highest accuracy of the prediction on the independent testing data set S-200; the accuracy improves 12.38%, and on the independent testing data set H-200, the accuracy improves 0.68%. Moreover, the dimensions of the features we derive from the RNA sequences are only 109,109, and 119 in H. sapiens, M. musculus, and S. cerevisiae, which is much smaller than those used in the traditional algorithms. On evaluation via tenfold cross-validation and two independent testing data sets, PseUdeep outperforms the best traditional machine learning model available. PseUdeep source code and data sets are available at https://github.com/dan111262/PseUdeep.
Pseudouridine (Ψ) is one of the most prevalent RNA modifications that occurs at the uridinebase through an isomerization reaction catalyzed by pseudouridine synthases (see Figure 1) (Bousquet-Antonelli et al., 1997; Chan and Huang, 2009; Ge and Yu, 2013; Kiss et al., 2010; Wolin, 2016; Yu and Meier, 2014). It is confirmed that Ψ modification occurs in several kinds of RNAs, such as small nuclear RNA, rRNA, tRNA, mRNA, and small nucleolar RNA (Ge and Yu, 2013). Ψ plays a significant role in many biological processes, including regulating the stability of RNA structure in tRNA and rRNA (Kierzek et al., 2014). Deficiency of Ψ might cause various diseases; the dysregulation of Ψ in mitochondrial tRNA is one of the etiologies of erythrocytic anemia and mitochondrial myopathy (Bykhovskaya et al., 2004). Moreover, the mutations of Ψ are also associated with several types of cancers, such as gastric and lung cancer (Mei et al., 2012; Carlile et al., 2014; Carlile et al., 2015; Shaheen et al., 2016; Penzo et al., 2017; Zhang et al., 2021), and Ψ is also applied in biochemical research and pharmaceuticals (C. Liu et al., 2020; Penzo et al., 2017; J. Yang et al., 2020). Undoubtedly, the identification of Ψ modification sites would be of great benefit for disease mechanism and biological processes research.

FIGURE 1. Illustration of Ψ modification. The Ψ synthase catalyzes the uridine isomer Ψ by removing the uridine residue base from its sugar and then removing the uridine isomer, rotating it 180° along the N3–C6 axis, and finally turning the base the 5-carbon and 1′-carbons of the sugar.
Although accurate Ψ sites can be identified by some lab exploratory techniques, they are expensive and time-consuming (Carlile et al., 2014). As an increasing number of genomic and proteomic samples are produced (J. Yang et al., 2020), it is necessary to develop some effective and robust computational models to detect Ψ sites in RNA sequences.
Many machine learning algorithms have been introduced as fast, low-cost, and efficient alternative methods to identify Ψ sites. In 2015, Li et al. established the first computational model named PPUS to identify PUS-specific Ψ sites in Saccharomyces cerevisiae and Homo sapiens. The method used the nucleotides around Ψ as features for training a support vector machine (SVM) (Y. H. Li et al., 2015). Similarly, in 2016, Chen et al. developed an SVM classifier named iRNA-PseU using the occurrence frequencies and the chemical properties of the nucleotides as well as pseudo k-tuple nucleotide composition (PseKNC) as features in Mus musculus, S. cerevisiae, and H. sapiens (Chen et al., 2016). He et al., in 2018, proposed PseUI, in which five types of features, nucleotide composition (NC), dinucleotide composition (DC), pseudo dinucleotide composition (PseDNC), position-specific nucleotide composition (PSNP), and position-specific dinucleotide propensity (PSDP), were combined and a sequential forward selection method was applied to select the optimal feature subset for training SVM to predict Ψ sites in M. musculus, S. cerevisiae, and H. sapiens (J. He et al., 2018). In 2019, Liu et al. proposed an ensemble model, XG-PseU, based on eXtreme gradient boosting (XGBoost) using six types of features, including NC, dinucleotide composition (DNC), trinucleotide composition (TNC), nucleotide chemical property (NCP), nucleotide density (ND), and one-hot encoding (Liu et al., 2020). In 2020, Bi et al. proposed an integrated model based on a majority voting strategy, called EnsemPseU, which contained five machine learning methods SVM, XGBoost, Naive Bays (NB), k-nearest neighbor (KNN), and random forest (RF) (Bi et al., 2020). In short, the above machine learning methods in H. sapiens, S. cerevisiae, and M. musculus have the highest accuracy rates of 65.44%, 68.15%, and 72.03%, respectively. Although the performance of the above machine learning methods is reasonable, there is still a lot of room for improvement. With the emergence of deep learning methods, many prediction methods based on deep learning have been applied to the field of RNA and protein modification predictions (Huang et al., 2018; Long et al., 2018; Mostavi et al., 2018; Zhang and Hamada, 2018). The above predictors do not consider deep learning methods, which can extract deeper features to improve prediction performance (B. He et al., 2020; Liang et al., 2020).
In this work, we propose a deep learning framework, PseUdeep, to identify Ψ sites of the three species H. sapiens, S. cerevisiae, and M. musculus. Compared with previous machine learning methods, our model applies three encoding methods, one-hot encoding, K-tuple nucleotide frequency pattern (KNFP) (Y. Yang et al., 2021), and PSNP (Dou et al., 2020) to extract RNA sequence features. Our model consists of a convolutional neural network (CNN), a capsule neural network, and a bidirectional gated recurrent unit (BiGRU) network with a self-attention mechanism (see Figure 2). Finally, we conduct a tenfold cross-validation test on the benchmark data set and an independent verification test on two independent data sets and compare the prediction results of our model with the results of the previous machine learning model; the accuracy of our model for H. sapiens increased by 1.55%, for S. cerevisiae by 4.58%, and for M. musculus by 0.42%.
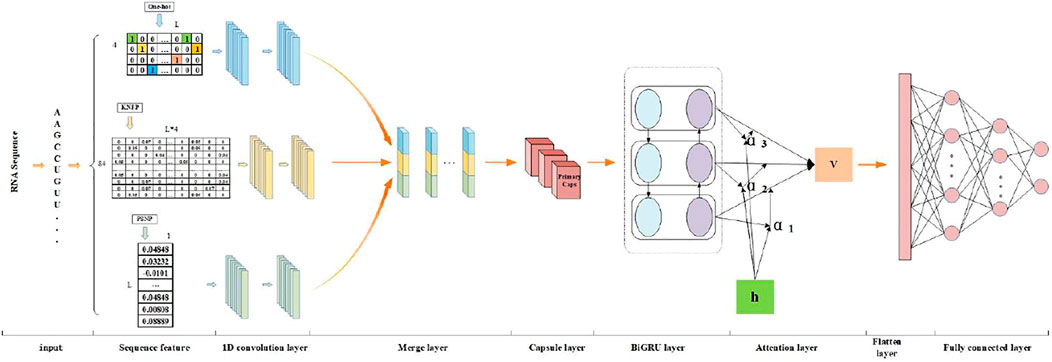
FIGURE 2. The flowchart of PseUdeep: We use the collected RNA sequences as the input of the model and the first use three encoding methods, one-hot encoding, KNFP, and PSNP, to extract RNA sequence features. Then, the three feature matrices are convoluted twice, and the results are stitched together. Finally, it is input into the capsule neural network and the BiGRU network with a self-attention mechanism and two fully connected layers for classification.
Chen et al. (2016) established data sets for computationally identifying Ψ sites in H. sapiens, M. musculus, and S. cerevisiae based on RMBase (Sun et al., 2016). With the update of RMBase, we use three training new data sets base on RMBase2.0 (Chen et al., 2015), which include NH_990 (H. sapiens), NM_944 (M. musculus), and NS_627 (S. cerevisiae), and the data sets built by Liu K. et al. (2020). In H. sapiens and S. cerevisiae, we also use the independent data sets H_200 and S_200, which are built by Chen et al. (2016) to evaluate the performance of the method.
In the NH_990 and NM_944 data sets, the length of the sequence is 21 nt. However, in the NS_627 data set, the length is31 nt. In the H_200 and S_200 data sets, the RNA sequence length is 21 and 31 nt, respectively. Table 1 shows the details of all data sets.
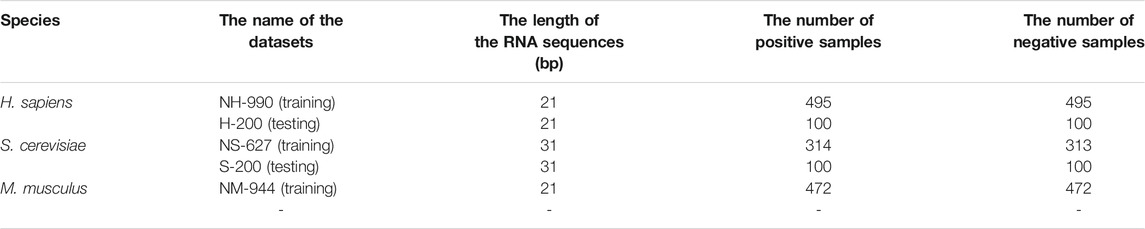
TABLE 1. The information on training data sets and independent testing data sets.
Feature extraction is the basis of the algorithm. In our work, we consider three kinds of features: one-hot encoding, KNFP (Y. Yang et al., 2021), and PSNP (Dou et al., 2020).
Given an RNA sequence R,
where
The KNFP (Y. Yang et al., 2021) pattern represents the local contextual features at different levels. KNFP integrates various short-distance sequence order information and retains a large number of original sequence modes (Chen et al., 2015). We apply KNFP to extract local context features from RNA sequences. KNFP includes mononucleotide, dinucleotide, and trinucleotide composition. For an RNA sequence
where
PSNP (Dou et al., 2020) is an effective nucleotide encoding method, which has been successfully applied to the identification of many functional sites in biological sequences (W. He et al., 2018; W. He et al., 2018; G. Q. Li et al., 2016; Zhu et al., 2019). In this method, location-specific information can be represented by calculating the differences in nucleotide frequency at a specific location between positive and negative RNA samples. Considering an RNA sequence
First, we calculate the frequency of occurrence for four nucleotides, respectively, from bath positive and negative samples at the jth position. In this way, we obtain two
where
For each input sequence, we use three feature extraction (one-hot encoding, KNFP, and PSNP) methods to form three feature matrices. For each feature matrix, a pair of 1-D CNNs are used. The first layer of each feature matrix has a filter size of 11 and a kernel size of 7. Similarly, the second 1[D CNN layer for each feature matrix has a filter size of 11 and a kernel size of 3. Two convolution layers are used to capture features from three feature matrices; all layers had a “Relu” activation function. The three convolution results are spliced together and fed into the capsule network with 14 capsules for vector convolution, and the output of the capsule network is put into the BiGRU neural network with an attention mechanism; the final feature is concatenated and fed into two dense layers to obtain the prediction results. Bayesian optimization is used to select the best performance of the hyperparameters. The adjusted parameters are the number of filters, the filter size, and epoch. To prevent the model from overfitting, the dropout algorithm with a probability of 0.5 is also used. A binary cross-entropy is used as a loss function with an early stop patience of 20. The batch size is 32, and the number of epochs is set to 200. For the stochastic gradient descent method, the Adam optimization algorithm is selected here. The total number of trainable parameters in the network is 165,365. The entire program is done in Python 3.6.
CNNs are widely used in the fields of artificial intelligence, such as machine learning, speech recognition, document analysis, language detection, and image recognition.
Capsule neural networks, first proposed by Hinton et al., provide a unique and powerful deep learning component to better simulate the various relationships represented inside the neural network. Because capsule neural networks can collect location information, they can learn a small amount of data to get good predicted results. In the data sets we collected, the amount of RNA data is small, and the length of RNA sequences is small, so to study the hierarchical relationship of local features, capsule neural networks are used in this paper.
BiGRU networks are used to extract the deep features of the sequences because BiGRU networks can be regarded as two unidirectional GRUs. An attention mechanism in a deep neural network is also an important part. The attention mechanism is remarkable in serialized data, such as speech recognition, machine translation, and part of speech taming, which has also been widely used in much bioinformatics research and achieved excellent performance.
Because the
To measure the performance of our model, we use four statistical parameters, sensitivity (Sn), specificity (Sp), accuracy (Acc), and Matthew’s correlation coefficient (MCC), which are used in a series of studies to evaluate the effectiveness of predictors. These parameters are defined as follows:
where
To select a more effective model, in each data set, we first compare four models’ performances based on two feature extraction methods, one-hot encoding and KNFP (results are shown in Supplementary Tables S1, S2). These models are constructed by gradually adding different types of layers based on two 1-D convolution layers, a BIGRU network, and a two fully connected layers network. The four models are shown below:
1) CNN: The network consists of two layers of 1-D convolution, a BIGRU network, and a two fully connected layers network as described above. The input matrices are the one-hot encoding and KNFP features extracted from the RNA sequences.
2) CNN + Capsule: The model adds a capsule layer after the BiGRU layer on the basis of the CNN model.
3) CNN + Attention: The model adds a self-attention mechanism layer before the BiGRU layer based on the CNN model.
4) CNN + Capsule + Attention: The model adds a capsule layer based on the CNN + Attention model; on the basis of the above four models, we add PSNP features and compare the performance of the four new models (see Tables 2, 3). In summary, our PseUdeep model (CNN + Capsule + Attention model on three feature extraction methods) is superior to the others.
TABLE 2. Tenfold cross-validation performance comparison of four models based on three feature extraction methods on three benchmark data sets.
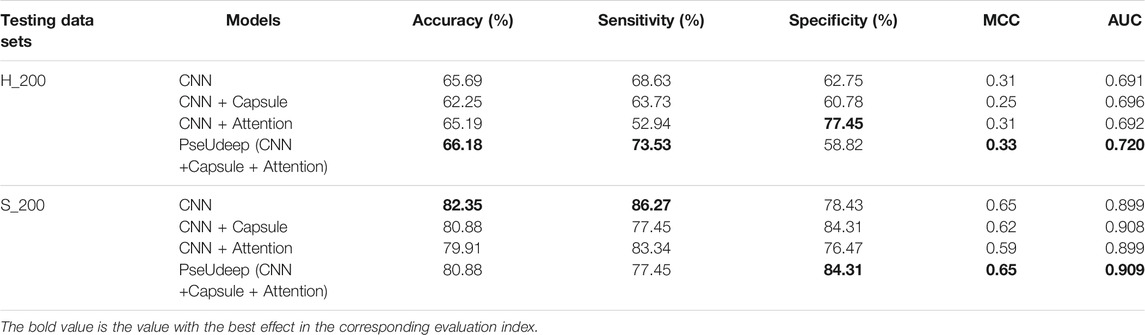
TABLE 3. Performance comparison of four models based on three feature extraction methods on independent testing data sets.
We also evaluate our model (CNN + Capsule + Attention) with only one kind of feature. Table 4 shows the comparison of performance in the tenfold cross-validation on benchmark data sets. It follows that the ACC values and AUC values of PSNP in three species, H. sapiens, M. muscles, and S. cerevisiae, are much higher than those of the other two characteristics. The ACC value of PSNP is increased by 11.11%, 15.6%, and 16.68%, respectively, compared with other characteristics, the AUC value increased by 0.074, 0.199, and 0.115, respectively. PSNP provides a great possibility to improve the model performance in identifying Ψ sites.
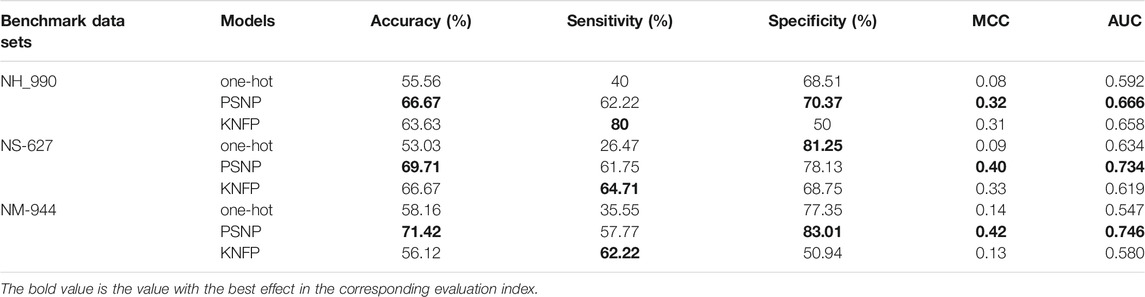
TABLE 4. The model performance with a single type of feature.
We compare our model PseUdeep with other state-of-the-art machine learning predictors published recently to evaluate the identification ability of Ψ sites. In benchmark data sets with tenfold cross-validation and independent testing, the results obtained by PseUdeep and other predictors are listed in Tables 5, 6 and Figures 3, 4; the ROC curves of PseUdeep are shown in Figure 5. The accuracy of the PseUdeep model in NH_990, NS_627, and NM_944 is increased by 1.55%, 4.58%, and 0.32%. In addition, the performance of PseUdeep on independent data sets compared with iRNA-Pse and PseUI is shown in Table 6 and Figure 4. It can be observed that the accuracy of the PseUdeep model in H_200 and S_200 is increased by 0.68% and 12.38%, respectively.
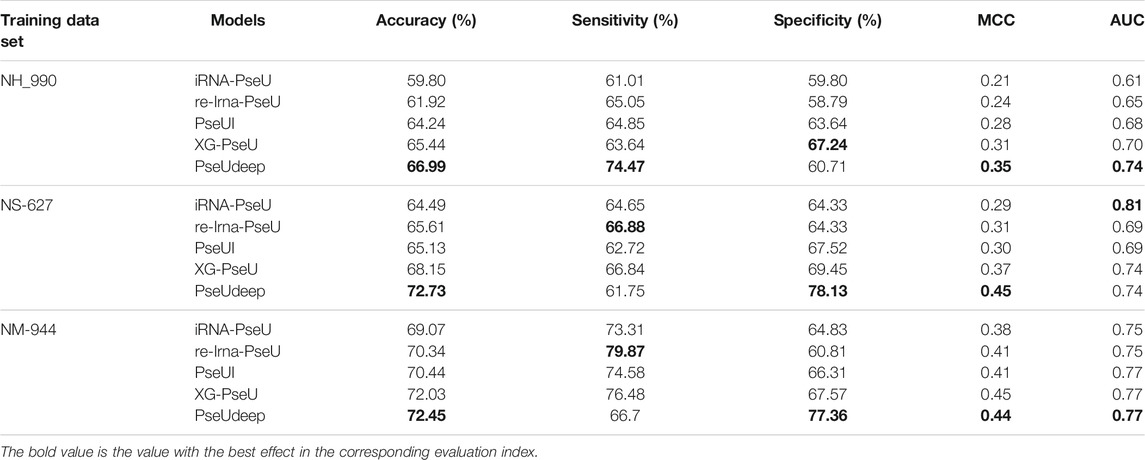
TABLE 5. A comparison of PseUdeep with other models on three benchmark data sets.
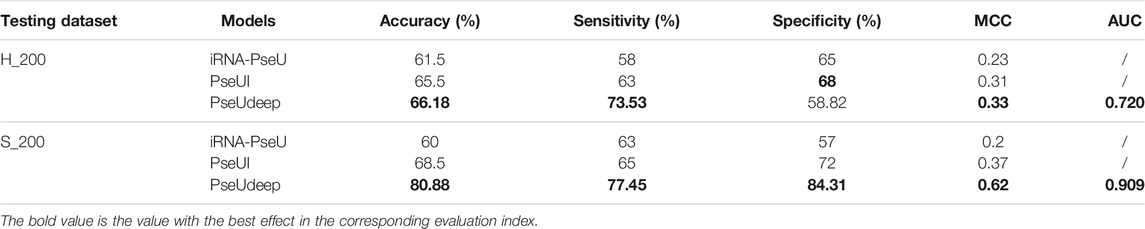
TABLE 6. A comparison of PseUdeep with other models on independent data sets.
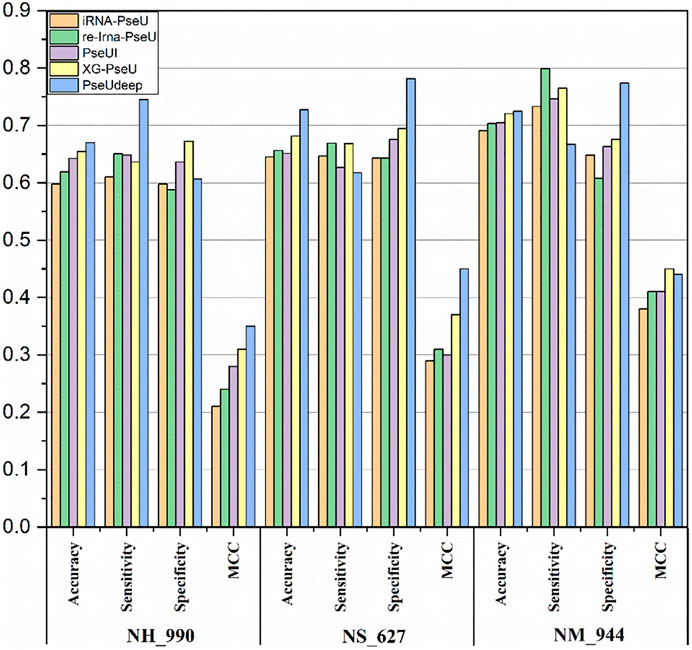
FIGURE 3. The success rates of the PseUdeep and baseline methods on three training data sets.

FIGURE 4. The success rates of the PseUdeep and baseline methods on independent data sets.
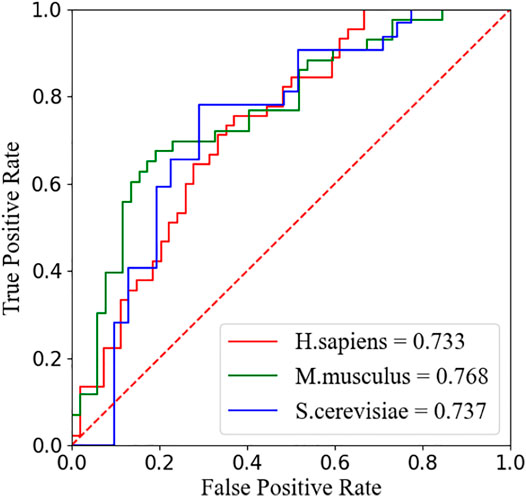
FIGURE 5. The ROC curves of PseUdeep for H. sapiens, S. cerevisiae, and M. musculus, respectively.
We summarize and compare our model with other state-of-the-art models in terms of feature extraction, number of features, and classifiers as shown in Table 7. Among them, our model PseUdeep does not further feature selection, and the feature dimension is only 109, 109, and 119 in H. sapiens, M. musculus, and S. cerevisiae, respectively, and our model gets the highest accuracy of the prediction.
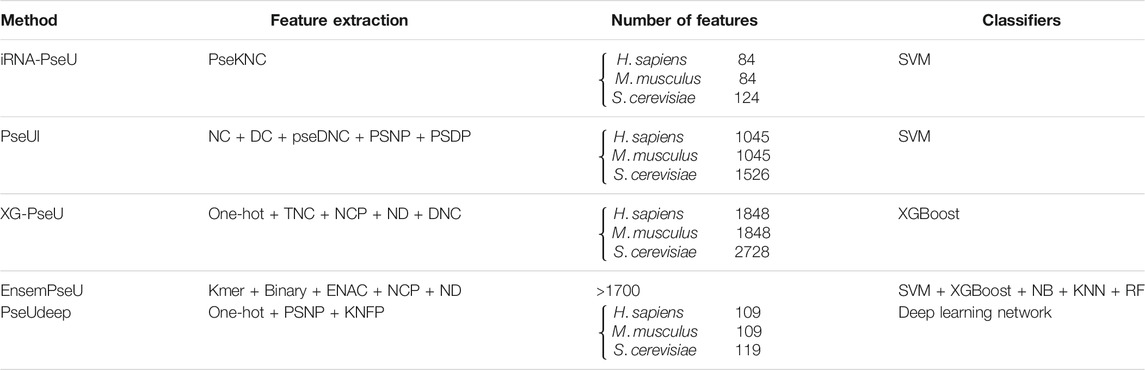
TABLE 7. Five methods to identify Ψ sites are summarized in all aspects.
In this study, we propose a model, PseUdeep, which can effectively identify Ψ sites in RNA sequences. To get better prediction performance, we also train a combination of three features in a simple model and then gradually add different types of layers to obtain better performance. In addition, we compare our model with other models through tenfold cross-validation and independent testing, and the results show that PseUdeep is more accurate and stable. Finally, we evaluate and compare the performance of the three features used in this study and find that PSNP shows the best effect.
The original contributions presented in the study are included in the article/Supplementary Material, further inquiries can be directed to the corresponding author.
JZ and DL conceived, designed, and managed the study. ML and WQ performed the experiments. ML, SC, and JL provided computational support and technical assistance. All authors approved the final manuscript.
This study is supported by the National Natural Science Foundation of China (Grant numbers: 61803065, 11971347, 62071079), the Fundamental Research Funds for the Central Universities of China, the Science and Technology Program of Guangzhou, China (Grant numbers: 2018059), the Science and Technology Planning Project of Guangdong Province of China (Grant numbers: 2020A0505100058), the Guangdong Educational Committee (Key Project of Regular institutions of higher learning of Guangdong Province) (Grant numbers: 2019KZDXM024).
Authors WQ and JL were employed by the company Geneis (Beijing) Co., Ltd.
The remaining authors declare that the research was conducted in the absence of any commercial or financial relationships that could be construed as a potential conflict of interest.
All claims expressed in this article are solely those of the authors and do not necessarily represent those of their affiliated organizations, or those of the publisher, the editors ,and the reviewers. Any product that may be evaluated in this article or claim that may be made by its manufacturer is not guaranteed or endorsed by the publisher.
The authors thank those who contributed to this paper, as well as the reviewers for their careful reading and valuable suggestions.
The Supplementary Material for this article can be found online at: https://www.frontiersin.org/articles/10.3389/fgene.2021.773882/full#supplementary-material
Bi, Y., Jin, D., and Jia, C. (2020). EnsemPseU: Identifying Pseudouridine Sites with an Ensemble Approach. New Jersey: IEEE Access, 1., PP(99)
Bousquet-Antonelli, C., Henry, Y., G'Elugne J, P., Caizergues-Ferrer, M., and Kiss, T. (1997). A small nucleolar RNP protein is required for pseudouridylation of eukaryotic ribosomal RNAs. Embo j 16 (15), 4770–4776. doi:10.1093/emboj/16.15.4770
Bykhovskaya, Y., Casas, K., Mengesha, E., Inbal, A., and Fischel-Ghodsian, N. (2004). Missense mutation in pseudouridine synthase 1 (PUS1) causes mitochondrial myopathy and sideroblastic anemia (MLASA). Am. J. Hum. Genet. 74 (6), 1303–1308. doi:10.1086/421530
Carlile, T. M., Rojas-Duran, M. F., and Gilbert, W. V. (2015). Pseudo-Seq. Methods Enzymol. 560, 219–245. doi:10.1016/bs.mie.2015.03.011
Carlile, T. M., Rojas-Duran, M. F., Zinshteyn, B., Shin, H., Bartoli, K. M., and Gilbert, W. V. (2014). Pseudouridine profiling reveals regulated mRNA pseudouridylation in yeast and human cells. Nature 515 (7525), 143–146. doi:10.1038/nature13802
Chan, C. M., and Huang, R. H. (2009). Enzymatic characterization and mutational studies of TruD - the fifth family of pseudouridine synthases. Arch. Biochem. Biophys. 489 (1-2), 15–19. doi:10.1016/j.abb.2009.07.023
Chen, W., Tang, H., Ye, J., Lin, H., and Chou, K. C. (2016). iRNA-PseU: Identifying RNA pseudouridine sites. Mol. Ther. Nucleic Acids 5 (7), e332. doi:10.1038/mtna.2016.37
Chen, W., Lin, H., and Chou, K.-C. (2015). Pseudo nucleotide composition or PseKNC: an effective formulation for analyzing genomic sequences. Mol. Biosyst. 11 (10), 2620–2634. doi:10.1039/c5mb00155b
Dezman, Z. D. W., Gao, C., Yang, S., Hu, P., Yao, L., Li, H.-C., et al. (2017). Anomaly Detection Outperforms Logistic Regression in Predicting Outcomes in Trauma Patients. Prehosp. Emerg. Care 21 (2), 174–179. doi:10.1080/10903127.2016.1241327
Dou, L., Li, X., Ding, H., Xu, L., and Xiang, H. (2020). Prediction of m5C Modifications in RNA Sequences by Combining Multiple Sequence Features. Mol. Ther. - Nucleic Acids 21, 332–342. doi:10.1016/j.omtn.2020.06.004
Fawcett, T. (2006). An introduction to ROC analysis. Pattern Recognition Lett. 27 (8), 861–874. Retrieved from. doi:10.1016/j.patrec.2005.10.010https://www.sciencedirect.com/science/article/pii/S016786550500303X
Ge, J., and Yu, Y.-T. (2013). RNA pseudouridylation: new insights into an old modification. Trends Biochem. Sci. 38 (4), 210–218. doi:10.1016/j.tibs.2013.01.002
He, B., Dai, C., Lang, J., Bing, P., Tian, G., Wang, B., et al. (2020). A machine learning framework to trace tumor tissue-of-origin of 13 types of cancer based on DNA somatic mutation. Biochim. Biophys. Acta (Bba) - Mol. Basis Dis. 1866 (11), 165916. doi:10.1016/j.bbadis.2020.165916
He, J., Fang, T., Zhang, Z., Huang, B., Zhu, X., and Xiong, Y. (2018). PseUI: Pseudouridine sites identification based on RNA sequence information. BMC Bioinformatics 19 (1), 306. doi:10.1186/s12859-018-2321-0
He, W., Jia, C., Duan, Y., and Zou, Q. (2018). 70ProPred: a predictor for discovering sigma70 promoters based on combining multiple features. BMC Syst. Biol. 12 (Suppl. 4), 44. doi:10.1186/s12918-018-0570-1
He, W., Jia, C., and Zou, Q. (2018). 4mCPred: Machine Learning Methods for DNA N4-methylcytosine sites Prediction. Bioinformatics 4, 4. doi:10.1093/bioinformatics/bty668
Huang, Y., He, N., Chen, Y., Chen, Z., and Li, L. (2018). BERMP: a cross-species classifier for predicting m6A sites by integrating a deep learning algorithm and a random forest approach. Int. J. Biol. Sci. 14 (12), 1669–1677. doi:10.7150/ijbs.27819
Kierzek, E., Malgowska, M., Lisowiec, J., Turner, D. H., Gdaniec, Z., and Kierzek, R. (2014). The contribution of pseudouridine to stabilities and structure of RNAs. Nucleic Acids Res. 42 (5), 3492–3501. doi:10.1093/nar/gkt1330
Kiss, T., Fayet-Lebaron, E., and Jády, B. E. (2010). Box H/ACA small ribonucleoproteins. Mol. Cel 37 (5), 597–606. doi:10.1016/j.molcel.2010.01.032
Li, G.-Q., Liu, Z., Shen, H.-B., and Yu, D.-J. (2016). TargetM6A: Identifying N6-Methyladenosine Sites From RNA Sequences via Position-specific Nucleotide Propensities and a Support Vector Machine. IEEE Trans.on Nanobioscience 15 (7), 674–682. doi:10.1109/tnb.2016.2599115
Li, Y.-H., Zhang, G., and Cui, Q. (2015). PPUS: a web server to predict PUS-specific pseudouridine sites: Table 1. Bioinformatics 31 (20), 3362–3364. doi:10.1093/bioinformatics/btv366
Liang, Y., Wang, H., Yang, J., Li, X., Dai, C., Shao, P., et al. (2020). A Deep Learning Framework to Predict Tumor Tissue-of-Origin Based on Copy Number Alteration. Front. Bioeng. Biotechnol. 8, 701. doi:10.3389/fbioe.2020.00701
Liu, C., Wei, D., Xiang, J., Ren, F., Huang, L., Lang, J., et al. (2020). An Improved Anticancer Drug-Response Prediction Based on an Ensemble Method Integrating Matrix Completion and Ridge Regression. Mol. Ther. - Nucleic Acids 21, 676–686. doi:10.1016/j.omtn.2020.07.003
Liu, K., Chen, W., and Lin, H. (2020). XG-PseU: an eXtreme Gradient Boosting based method for identifying pseudouridine sites. Mol. Genet. Genomics 295 (1), 13–21. doi:10.1007/s00438-019-01600-9
Long, H., Liao, B., Xu, X., and Yang, J. (2018). A Hybrid Deep Learning Model for Predicting Protein Hydroxylation Sites. Ijms 19 (9), 2817. doi:10.3390/ijms19092817
Mei, Y.-P., Liao, J.-P., Shen, J., Yu, L., Liu, B.-L., Liu, L., et al. (2012). Small nucleolar RNA 42 acts as an oncogene in lung tumorigenesis. Oncogene 31 (22), 2794–2804. doi:10.1038/onc.2011.449
Mostavi, M., Salekin, S., and Huang, Y. (20182018). Deep-2'-O-Me: Predicting 2'-O-methylation sites by Convolutional Neural Networks. Annu. Int. Conf. IEEE Eng. Med. Biol. Soc., 2394–2397. doi:10.1109/embc.2018.8512780
Penzo, M., Guerrieri, A., Zacchini, F., Treré, D., and Montanaro, L. (2017). RNA Pseudouridylation in Physiology and Medicine: For Better and for Worse. Genes 8 (11), 301. doi:10.3390/genes8110301
Shaheen, R., Han, L., Faqeih, E., Ewida, N., Alobeid, E., Phizicky, E. M., et al. (2016). A homozygous truncating mutation in PUS3 expands the role of tRNA modification in normal cognition. Hum. Genet. 135 (7), 707–713. doi:10.1007/s00439-016-1665-7
Sun, W.-J., Li, J.-H., Liu, S., Wu, J., Zhou, H., Qu, L.-H., et al. (2016). RMBase: a resource for decoding the landscape of RNA modifications from high-throughput sequencing data. Nucleic Acids Res. 44 (D1), D259–D265. doi:10.1093/nar/gkv1036
Vučković, F., Theodoratou, E., Thaçi, K., Timofeeva, M., Vojta, A., Štambuk, J., et al. (2016). IgG Glycome in Colorectal Cancer. Clin. Cancer Res. 22 (12), 3078–3086. doi:10.1158/1078-0432.Ccr-15-1867
Wolin, S. L. (2016). Two for the price of one: RNA modification enzymes as chaperones. Proc. Natl. Acad. Sci. USA 113 (50), 14176–14178. doi:10.1073/pnas.1617402113
Yang, J., Peng, S., Zhang, B., Houten, S., Schadt, E., Zhu, J., et al. (2020). Human geroprotector discovery by targeting the converging subnetworks of aging and age-related diseases. Geroscience 42 (1), 353–372. doi:10.1007/s11357-019-00106-x
Yang, Y., Hou, Z., Ma, Z., Li, X., and Wong, K.-C. (2021). iCircRBP-DHN: identification of circRNA-RBP interaction sites using deep hierarchical network. Brief Bioinform 22 (4). doi:10.1093/bib/bbaa274
Yu, Y.-T., and Meier, U. T. (2014). RNA-guided isomerization of uridine to pseudouridine-pseudouridylation. RNA Biol. 11 (12), 1483–1494. doi:10.4161/15476286.2014.972855
Zhang, Y., and Hamada, M. (2018). DeepM6ASeq: prediction and characterization of m6A-containing sequences using deep learning. BMC Bioinformatics 19 (Suppl. 19), 524. doi:10.1186/s12859-018-2516-4
Zhang, Y., Xiang, J., Li, J., Lu, Q., Tian, G., and Yang, J. (2021). Identifying breast cancer-related genes based on a novel computational framework involving KEGG pathways and PPI network modularity. Front. Genet. 12, 876. doi:10.3389/fgene.2021.596794
Keywords: RNA modification, pseudouridine site prediction, feature extraction, deep learning, capsule network
Citation: Zhuang J, Liu D, Lin M, Qiu W, Liu J and Chen S (2021) PseUdeep: RNA Pseudouridine Site Identification with Deep Learning Algorithm. Front. Genet. 12:773882. doi: 10.3389/fgene.2021.773882
Received: 10 September 2021; Accepted: 04 October 2021;
Published: 18 November 2021.
Edited by:
Lihong Peng, Hunan University of Technology, ChinaReviewed by:
Xiangzheng Fu, Hunan University, ChinaCopyright © 2021 Zhuang, Liu, Lin, Qiu, Liu and Chen. This is an open-access article distributed under the terms of the Creative Commons Attribution License (CC BY). The use, distribution or reproduction in other forums is permitted, provided the original author(s) and the copyright owner(s) are credited and that the original publication in this journal is cited, in accordance with accepted academic practice. No use, distribution or reproduction is permitted which does not comply with these terms.
*Correspondence: Size Chen, Y2hlbnNpemVAZ2RwdS5lZHUuY24=
Disclaimer: All claims expressed in this article are solely those of the authors and do not necessarily represent those of their affiliated organizations, or those of the publisher, the editors and the reviewers. Any product that may be evaluated in this article or claim that may be made by its manufacturer is not guaranteed or endorsed by the publisher.
Research integrity at Frontiers
Learn more about the work of our research integrity team to safeguard the quality of each article we publish.