- 1School of Information Science and Engineering, Zaozhuang University, Zaozhuang, China
- 2School of Information and Electrical Engineering, Xuzhou University of Technology, Xuzhou, China
- 3College of Food Science and Pharmaceutical Engineering, Zaozhuang University, Zaozhuang, China
Hypertension is a chronic disease and major risk factor for cardiovascular and cerebrovascular diseases that often leads to damage to target organs. The prevention and treatment of hypertension is crucially important for human health. In this paper, a novel ensemble method based on a flexible neural tree (FNT) is proposed to identify hypertension-related active compounds. In the ensemble method, the base classifiers are Multi-Grained Cascade Forest (gcForest), support vector machines (SVM), random forest (RF), AdaBoost, decision tree (DT), Gradient Boosting Decision Tree (GBDT), KNN, logical regression, and naïve Bayes (NB). The classification results of nine classifiers are utilized as the input vector of FNT, which is utilized as a nonlinear ensemble method to identify hypertension-related drug compounds. The experiment data are extracted from hypertension-unrelated and hypertension-related compounds collected from the up-to-date literature. The results reveal that our proposed ensemble method performs better than other single classifiers in terms of ROC curve, AUC, TPR, FRP, Precision, Specificity, and F1. Our proposed method is also compared with the averaged and voting ensemble methods. The results reveal that our method could identify hypertension-related compounds more accurately than two classical ensemble methods.
Introduction
Hypertensive disease is a frequent cardiovascular disease characterized by elevated arterial blood pressure and accompanied by the target organ injury or clinical diseases (Essiarab et al., 2011; Owlia and Bangalore, 2016). It is a risk factor leading to many serious complications such as stroke, hypertensive heart disease, renal failure, atherosclerosis, and so on (Sakai and Sigmund, 2005; Brinks and Eckhart, 2010). Due to the increasing pressure of work and life, many people do not develop good eating and living habits, and often stay up late. The age of hypertensive patients tends to be younger. Therefore, the prevention and treatment of hypertension has become very important for human health.
Network pharmacology (NP) could construct a multi-dimensional network based on “traditional Chinese medicine prescription-chemical component-targets-disease targets” to analyze the relationships between traditional Chinese medicine multi-components and activity, which could provide a theoretical basis for further experimental research on a pharmacodynamic material basis and action mechanism (Wang et al., 2018; Xu et al., 2018). In recent years, network pharmacology has revealed therapeutic targets for hypertension and become a research hotspot, as it has been clinically verified to be an effective method of drug screening (Chen et al., 2020). Chen et al. screened out the key compounds and targets of JiaWeiSiWu granule to reveal the mechanism of JiaWeiSiWu granule in treating hypertension by NP method (Chen et al., 2021a). By NP and molecular docking (MD) methods, Zhai et al. investigated the mechanism of Pinellia ternate in treating hypertension (Zhai et al., 2021). Chen et al. analyzed the network based on Guizhi decoction, active compounds, and targets, and found hypertension-related targets and key pathways (Chen et al., 2021b). Chen et al. utilized NP and MD to analyzed the genistein for treating pulmonary hypertension (PH) and provided new guidance for further PH-related research (Chen et al., 2019). Liu et al. explained the pharmacological mechanism of TaohongSiwu decoction in the treatment of essential hypertension (EH) by the NP method (Liu et al., 2020). Wang et al. utilized NP to analyze the mechanism of Yeju Jiangya decoction against hypertension (Wang et al., 2021).
In recent decades, many data mining methods have been applied to reveal the disease mechanism and medication law of many complex diseases, especially hypertension (Ji and Wang, 2014; Ji et al., 2015; Hwang et al., 2016; Hu et al., 2018; Liang et al., 2018; Amaratunga et al., 2020; Liu et al., 2021; Zhao et al., 2021). Zhang et al. utilized SPSS21.0 and Apriori algorithm to analyze the symptom/sign information of EH patients collected and gave their distribution law and correlation (Zhang et al., 2019a). Yuan and Chen proposed niche technology and an artificial bee colony algorithm to mine association rules from Traditional Chinese Medicine (TCM) cases for treating hypertension (Yuan and Chen, 2011). Ma et al. collected the new literature about hypertension and constructed the gene network by analysis (Ma et al., 2018). Ramezankhani et al. utilized a decision tree to predict the risk factors of hypertension incidence in data collected from Iranian adults (Ramezankhani et al., 2016). Aljumah et al. utilized a data mining method to predict the treatment of hypertension patients with different age groups (Aljumah et al., 2011). Fang et al. proposed a new model-based KNN and LightGBM to predict the risk of hypertension (Fang et al., 2021).
Few studies have involved the use of data mining methods to improve network pharmacology. In this paper, a novel ensemble method based on a flexible neural tree (FNT) is proposed to identify hypertension-related active compounds. In the ensemble method, the used base classifiers are Multi-Grained Cascade Forest, support vector machines, random forest, AdaBoost, decision tree, Gradient Boosting Decision Tree, KNN, logical regression, and naïve Bayes. The classification results of nine classifiers are input to the FNT model, which is trained to predict hypertension-related compounds. The data used in the experiment are from up-to-date literature collected about hypertension and network pharmacology. By analysis of the literature, hypertension-related compounds were collected as positive samples and the generated decoys were utilized as negative samples. The molecular descriptor of each compound is extracted as the feature vector.
Methods
Classifiers
Assume that the training data is
Multi-Grained Cascade Forest
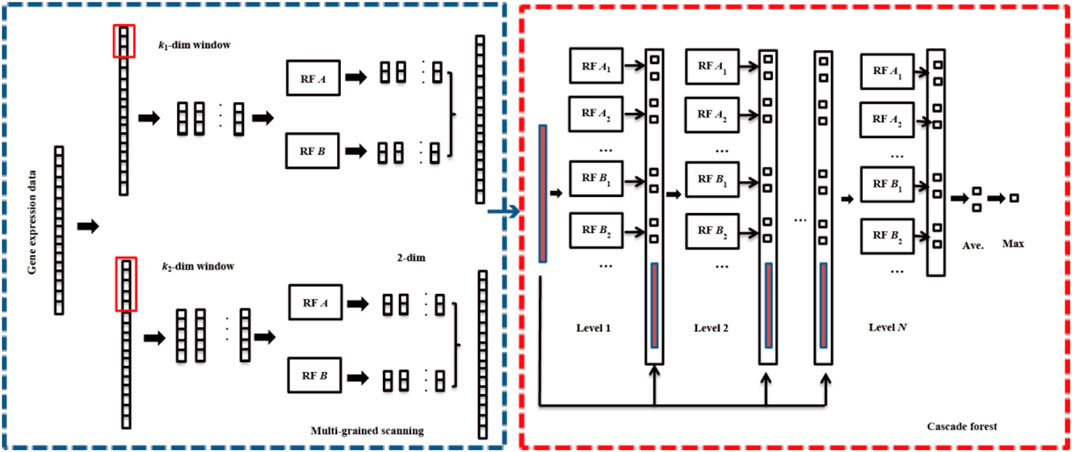
Multi-Grained Cascade Forest (gcForest) is a novel ensemble machine learning method, which utilizes the cascade forest (ensemble of decision trees) to learn and generate models (Zhou and Feng, 2017). The core of gcForest mainly includes two modules: multi-grained scanning and cascade forest. The flowchart of gcForest is depicted in Figure 1.
1) Multi-grained scanning
Multi granularity scanning is a technical means to enhance cascade forest and do more processing on features. Firstly, a complete
2) Cascade forest
Cascade forest includes several layers, each layer is composed of many forests, and each forest is composed of many decision trees. Completely random forest (
Support Vector Machines
Support vector machines (SVM) is a supervised learning algorithm based on statistical learning theory (Suykens and Vandewalle, 1999; Furey et al., 2000). With the sample set containing positive and negative samples, SVM could search a hyperplane that could segment the samples according to positive and negative classes. The classification hyperplane can be given as follows.
Where
Linear separated data can be distinguished by the optimal classification hyperplane. For non-linear separated data, SVM can be transformed into solving the following optimization problem by the soft interval optimization and kernel techniques.
Where
Random Forest
Random forest (RF) is a machine learning method based on an ensemble of decision trees for classification and regression (Breiman, 2001; Díaz-Uriarte and Alvarez de Andrés, 2006). Random forest is a combined classification model composed of many decision tree classification models. Each decision tree has the right to vote to determine the best classification result. In random forest, firstly,
AdaBoost
AdaBoost is a dynamic ensemble classification algorithm, which is to reasonably combine multiple weak classifiers (single-layer decision tree) to make it a strong classifier (Morra et al., 2009; Cao et al., 2013). The detailed algorithm is given as follows.
1) Initialize the weight of each sample. Assuming that the dataset contains
2) Train weak classifiers. According to the samples, the weak classifiers are trained. If a sample has been accurately classified, its weight will be reduced in constructing the next training set. On the contrary, if a sample point is not accurately classified, its weight is increased. At the same time, according to the classification error of the weak classifier, its weight is calculated. Then, the sample set with updated weights is used to train the next classifier, and the whole training process goes on iteratively.
3) The trained weak classifiers are combined into strong classifiers. Each weak classifier connects its respective weights through the classification function to form a strong classifier. After the training process of each weak classifier, the weight of the weak classifier with a smaller classification error rate is larger, which plays a greater decisive role in the final classification function, while the weight of the weak classifier with a larger classification error rate is smaller, which plays a smaller decisive role in the final classification function.
Decision Tree
A Decision Tree (DT) learning algorithm is usually a process of recursively selecting the optimal features and segmenting the training data according to the features so that each sub dataset has the best classification. The CART algorithm is one of the most common decision tree algorithms, which is mainly used for classification and regression (Breiman et al., 1984; Temkin et al., 1995). CART introduces the knowledge of probability theory and statistics into the research of decision tree. Different from the C4.5 algorithm, the CART algorithm could make a binary partition of the feature space and can split scalar attributes and continuous attributes. The specific algorithm is as follows:
1) Calculate the Gini index of the existing features. The feature with the smallest Gini index is selected as the splitting attribute of the root node. According to the optimal feature and cut point, two sub-nodes are generated from the current node, and the training dataset is allocated to the two sub-nodes according to the feature. According to an attribute value, a node is segmented to make the data in each descendant subset more “pure” than the data in its parent subset. Gini coefficient measures the impurity of sample division, and the smaller the impurity is, the higher the “purity” of the samples is.
For 2-class problems, the training set
Where
Where
2) Step (1) is called recursively for two child nodes, and the iteration continues until the samples in all child nodes belong to the same category or no attributes can be selected as splitting attributes.
4) Prune the CART decision tree generated.
Gradient Boosting Decision Tree
Gradient Boosting Decision Tree (GBDT) is an integrated learning algorithm (Hu and Min, 2018; Zhang et al., 2019b). By boosting method,
1) Initialize the weak learner.
Where
2) For
a) For
Where
Where
b) The calculated residues are used as new sample data,
c) Calculate the optimal coefficient for the leaf area, which is given as follows.
d) The strong learner is updated with Eq. 8.
When
3) The final strong learner
K-Nearest Neighbor
K-Nearest Neighbor (KNN) is a classification algorithm based on supervised learning, which is to classify the data points according to the sample set with the known categories (Liao and Vemuri, 2002). Select the
In the KNN method, the most commonly used measurement of distance is the Euclidean distance. The Euclidean distance of two variables (
Logistic Regression
Logistic regression (LR) is utilized to deal with the regression problem, which obtains the minimum result of cost function by gradient descent method to obtain the better classification boundary (Maalouf, 2011; Munshi et al., 2014). LR maps the values of linear regression to the interval [0, 1] by Sigmoid function, which is defined as follows.
Where
In order to solve the logistic regression model, the gradient descent algorithm is generally used to iteratively calculate the optimal parameters of the model.
Naïve Bayes
Naïve Bayes (NB) is one of the most widely utilized models in Bayesian classifiers, which is based on the assumption that the influence of an attribute value on the given class is independent of the values of other attributes (class conditional independence) (Rish, 2001; Li and Guo, 2005). The specific algorithm idea is as follows.
According to the joint probability and the prediction data
According to the Bayesian theorem,
Since the denominator is constant for all categories, just maximize the numerator, and Eq. 12 could be defined as follows.
Because each feature attribute is conditionally independent,
According to Eq. 15, Eq. 14 can be calculated as follows.
Select the category with the largest posteriori probability as the prediction category.
Ensemble Methods
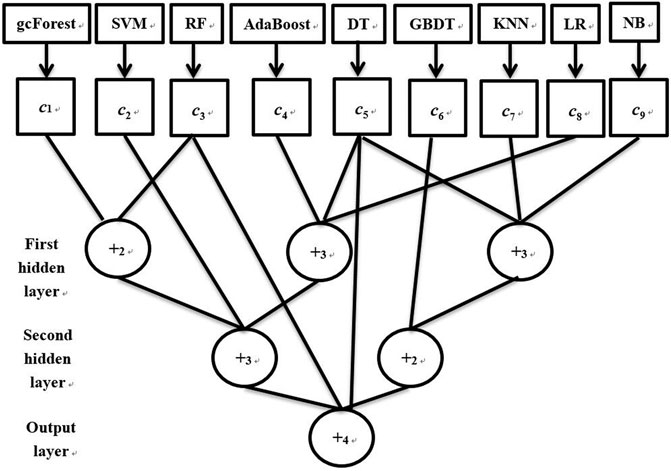
To improve the classification performance of a single classifier, a novel ensemble method based on a flexible neural tree (FNT) is proposed. An example of our proposed ensemble method is depicted in Figure 2. From Figure 2, it could be seen that the used base classifiers are gcForest, SVM, RF, AdaBoost, decision tree, GBDT, KNN, logical regression, and naïve Baye, which are introduced in detail in Classifiers. Firstly according to the training data, these nine classifiers can output their corresponding confidence level set (
Where
FNT is a kind of cross-layer neural network, so each hidden layer can contain both operator and variable nodes. Because the structure of the FNT model is not fixed and this model contains many parameters such as
Hypertension-Related Activity Drug Identification
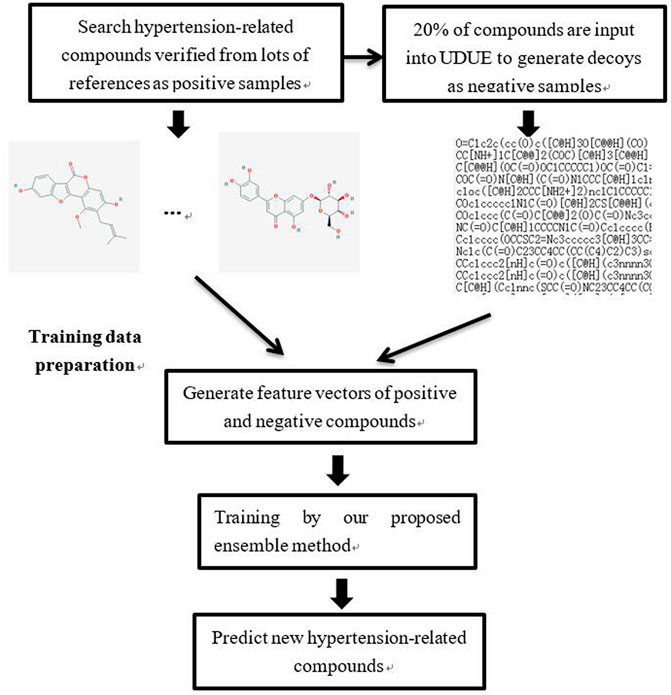
In order to identify hypertension-related active compounds accurately, an ensemble method based on nine classifiers and a flexible neural tree is proposed. The process of hypertension-related active compounds identification is depicted in Figure 3. A total of 44 important studies were collected by querying the literature database according to two keywords: hypertension and network pharmacology. Through analyzing this literature, many important medicines such as Banxia Baizhu Tianma Tang, Chaihu Longgu Muli Decoction, compound reserpine and triamterene tablets, and Huanglian Jiedu Decoction, were collected and 88 hypertension-related compounds were searched. These important compounds were verified by biology experiments or molecular docking, which were used as positive samples in this paper. To obtain the negative samples, 20% of these compounds were randomly selected and input into the DUD•E website to generate decoys (Mysinger et al., 2012). In total, 264 decoys are selected randomly as negative samples.
The molecular descriptions of positive and negative compounds were extracted to constitute the hypertension-related dataset. With the collected dataset, our proposed ensemble method was fitted to predict other hypertension-related compounds.
Experiment Results
In this part, the hypertension-related dataset collected is utilized, which contains 88 related compounds and 264 unrelated compounds. AUC, ROC curve, TPR, FRP, Precision, Specificity, and F1 were used to test the performance of our proposed method. In our method, the parameters of nine classifiers were set by default. In FNT, the variable set is defined as
Six cross-validation methods were utilized to validate our proposed method. Nine classifiers were also utilized to identify hypertension-related compounds with the same dataset. The ROC curves and AUC performances with the different cross-validation methods are depicted in Figures 4–9, respectively. From these results, it can be seen that gcForest has the best ROC curves and AUC values among the nine single classifiers. Our proposed ensemble method could perform better than gcForest in terms of ROC and AUC. With 2-cross, 4-cross, 6-cross, 8-cross, 10-cross, and 15-cross validation methods, in terms of AUC, our method is 0.1, 0.3, 0.3, 0.7, 0.3, and 0.4% higher than gcForest, which reveals that our proposed method performs better than nine single classifiers for hypertension-related compound identification.
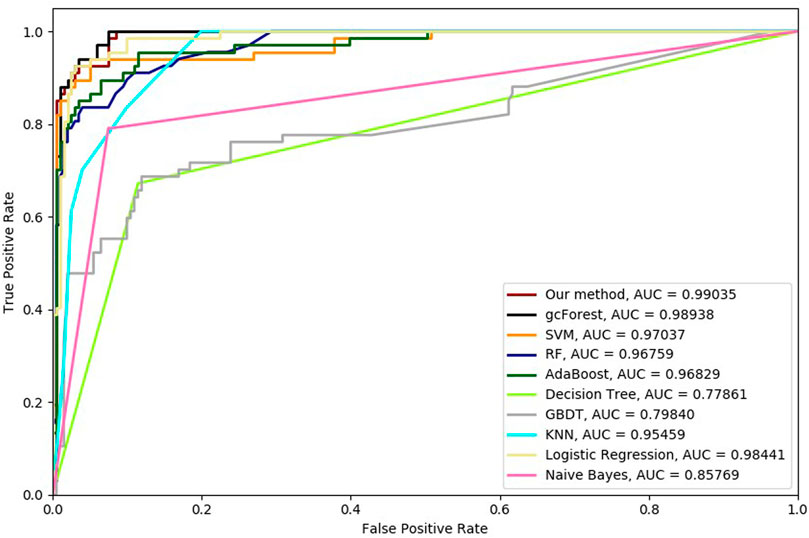
FIGURE 4. Hypertension-related compound identification performances of ten methods with 2-cross validation methods.
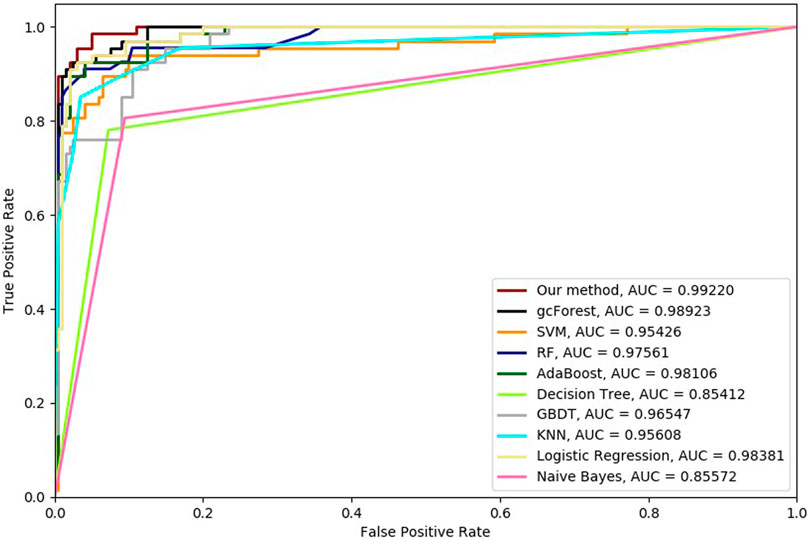
FIGURE 5. Hypertension-related compound identification performances of ten methods with 4-cross validation methods.
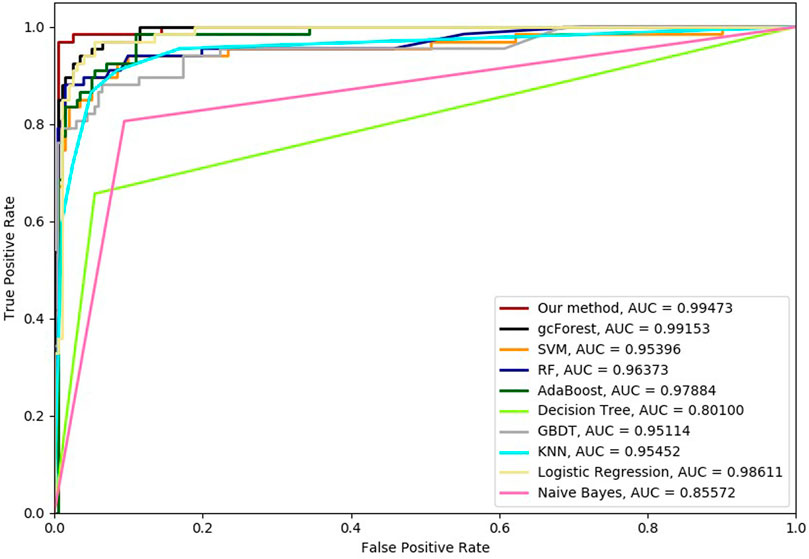
FIGURE 6. Hypertension-related compound identification performances of ten methods with 6-cross validation methods.
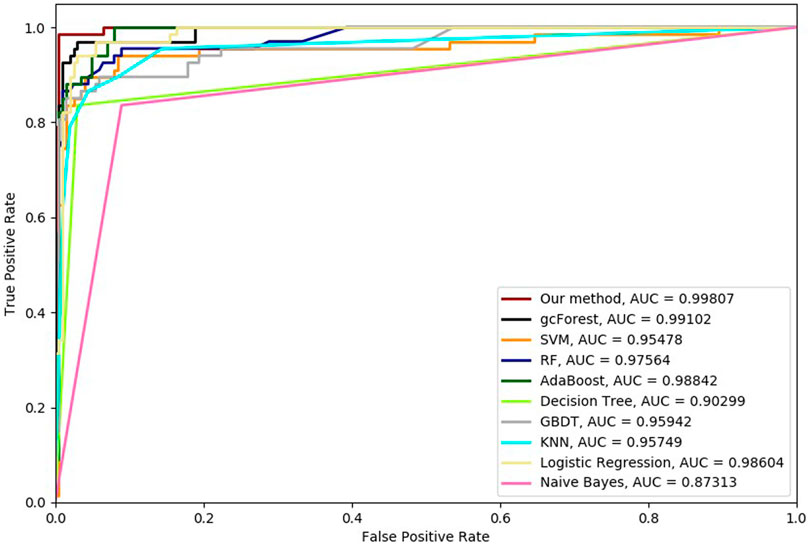
FIGURE 7. Hypertension-related compound identification performances of ten methods with 8-cross validation methods.
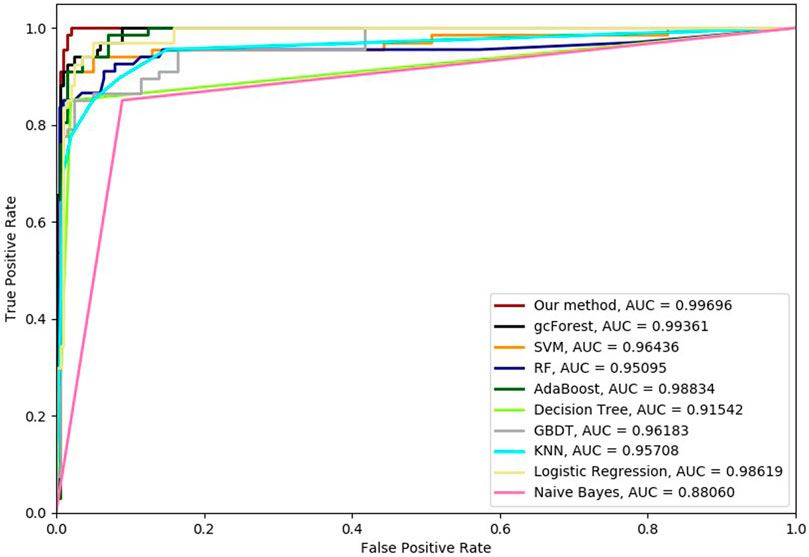
FIGURE 8. Hypertension-related compound identification performances of ten methods with 10-cross validation methods.
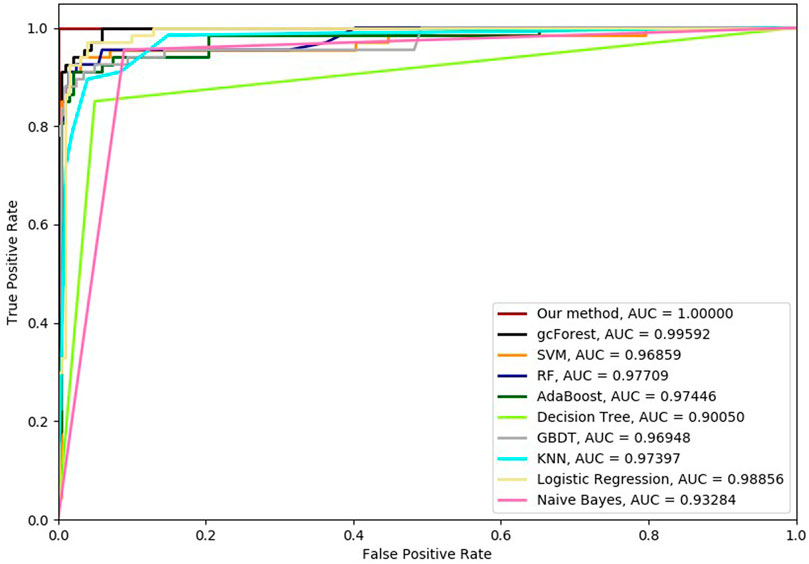
FIGURE 9. Hypertension-related compound identification performances of ten methods with 15-cross validation methods.
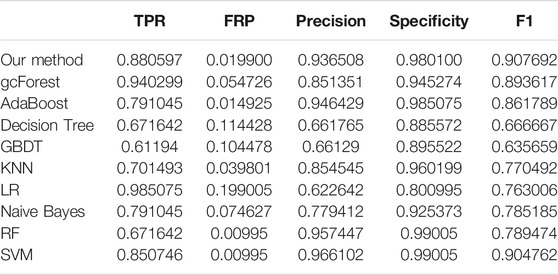
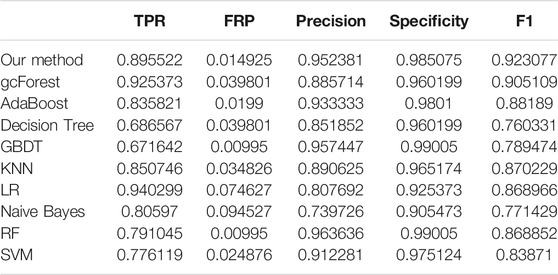
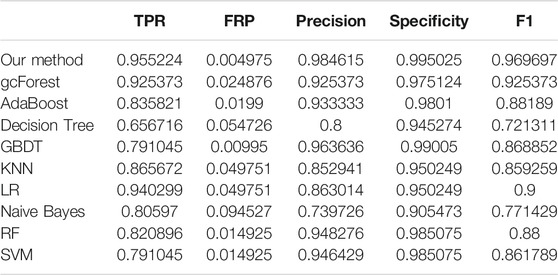
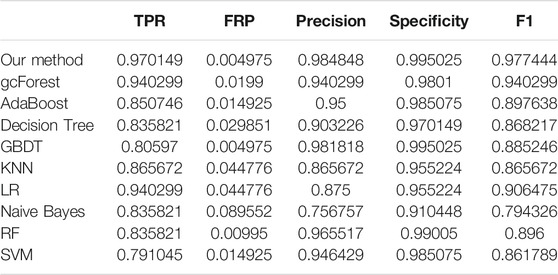
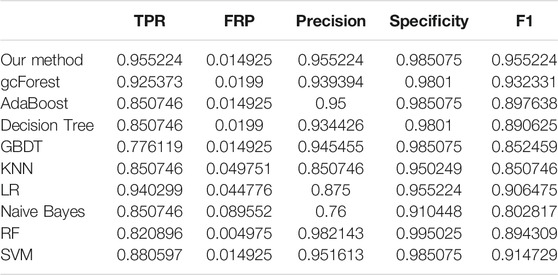
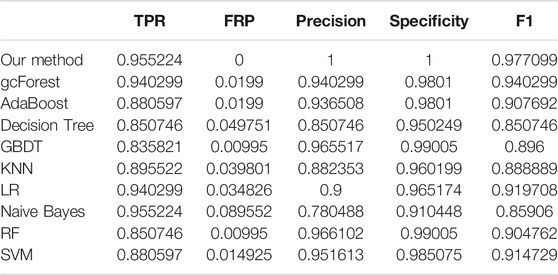
The TPR, FRP, Precision, Specificity, and F1 performances of the ten methods with the different cross-validation methods are listed in Tables 1–6, respectively. With 2-cross validation and 4-cross validation methods, LR could obtain the highest TPR performances, which shows that LR could identify more true hypertension-related compounds. For Table 1, RF and SVM have the best FPR performance, which shows that these two methods could identify less non-related compounds as related ones. SVM also has the highest Precision and Specificity performances among the ten methods. For Table 2, RF has the best FPR, Precision, and Specificity performances. Our method performed best in terms of F1, which reveals that it could identify hypertension-related compounds more accurately overall. With 6-cross validation, 8-cross validation, 10-cross validation, and 15-cross validation methods, our methods perform best among ten methods in terms of TPR, FRP, Precision, Specificity, and F1, except that RF has the lowest performance with 4-cross validation methods. The results show that our proposed ensemble method could identify more true hypertension-related and hypertension-unrelated compounds than the other nine single classifiers.
Discussion
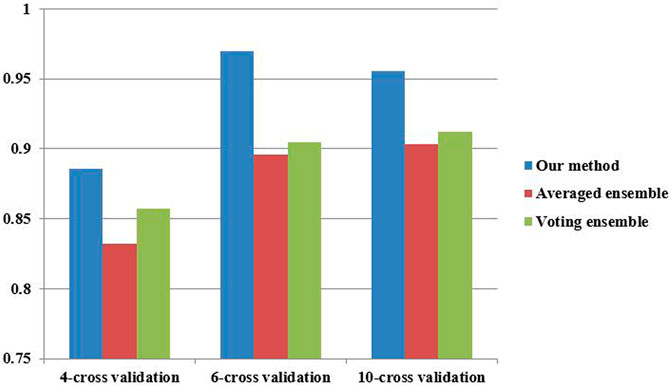
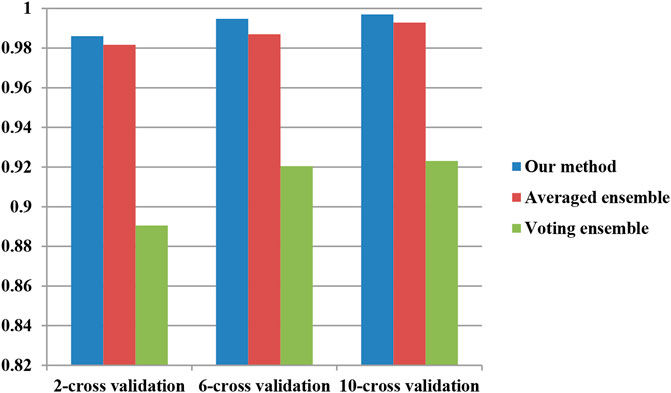
To investigate the performance of our proposed ensemble further, two classical ensemble methods (averaged ensemble and voting ensemble) were also utilized to infer hypertension-related compounds. The F1 and AUC performances of the hypertension-related compounds by three ensemble methods are depicted in Figure 10 and Figure 11, respectively. From Figures 10, 11, it can be seen that our proposed ensemble method obtained better F1 and AUC performances than averaged and voting ensemble methods, which also shows that our method could identify hypertension-related compounds more accurately than the other two classical ensemble methods.
Conclusion
To identify hypertension-related closely active compounds, this paper proposed a novel ensemble method based on a flexible neural tree and nine classifiers. In our method, the classification results of nine single classifiers was utilized as the input vector of the flexible neural tree. An FNT model was utilized as a nonlinear ensemble method to identify hypertension-related drug activity. A hybrid evolutionary method based on genetic programming like structure optimization algorithm and simulated annealing is proposed to evolve the FNT model. In order to test the performance of our proposed ensemble method, data were extracted from hypertension-unrelated and hypertension-related compounds collected from up-to-date literature. By the different cross-validation methods, our proposed method obtained better ROC curves and AUC values than nine other single classifiers. Our proposed method also performs better than other single classifiers in terms of TPR, FRP, Precision, Specificity, and F1 in most cases. We also compare our proposed ensemble method with the averaged and voting ensemble methods. The results reveal that our method could identify hypertension-related compounds more accurately than the two classical ensemble methods.
Data Availability statement
The original contributions presented in the study are included in the article/Supplementary Material, further inquiries can be directed to the corresponding author.
Author Contributions
WB collected and analyes the data of this work. BY and JW designed the model of this work.
Funding
This work was supported by the talent project of “Qingtan scholar” of Zaozhuang University, Jiangsu Provincial Natural Science Foundation, China (No. SBK2019040953), the Youth Innovation Team of Scientific Research Foundation of the Higher Education Institutions of Shandong Province, China (No. 2019KJM006), the Key Research Program of the Science Foundation of Shandong Province (ZR2020KE001), the Ph.D. research startup foundation of Zaozhuang University (No.2014BS13), and Zaozhuang University Foundation (No. 2015YY02).
Conflict of Interest
The authors declare that the research was conducted in the absence of any commercial or financial relationships that could be construed as a potential conflict of interest.
Publisher’s Note
All claims expressed in this article are solely those of the authors and do not necessarily represent those of their affiliated organizations, or those of the publisher, the editors and the reviewers. Any product that may be evaluated in this article, or claim that may be made by its manufacturer, is not guaranteed or endorsed by the publisher.
References
Aljumah, A., Ahamad, M., and Siddiqui, M. (2011). Predictive Analysis on Hypertension Treatment Using Data Mining Approach in Saudi Arabia. Intell. Inf. Manag. 3 (6), 252–261. doi:10.4236/iim.2011.36031
Amaratunga, D., Cabrera, J., Sargsyan, D., Kostis, J. B., Zinonos, S., and Kostis, W. J. (2020). Uses and Opportunities for Machine Learning in Hypertension Research. Int. J. Cardiol. Hypertens. 5, 100027. doi:10.1016/j.ijchy.2020.100027
Breiman, L., Friedman, J. H., Olshen, R. A., and Stone, C. J. (1984). Classification and Regression Trees (CART). Biometrics. Monterey, CA: Wadsworth.
Brinks, H. L., and Eckhart, A. D. (2010). Regulation of GPCR Signaling in Hypertension. Biochim. Biophys. Acta (Bba) - Mol. Basis Dis. 1802 (12), 1268–1275. doi:10.1016/j.bbadis.2010.01.005
Cao, Y., Miao, Q.-G., Liu, J.-C., and Gao, L. (2013). Advance and Prospects of AdaBoost Algorithm. Acta Automatica Sinica 39 (6), 745–758. doi:10.1016/s1874-1029(13)60052-x
Chen, J., Zhang, Y., Wang, Y., Jiang, P., Zhou, G., Li, Z., et al. (2021b). Potential Mechanisms of Guizhi Decoction against Hypertension Based on Network Pharmacology and Dahl Salt-Sensitive Rat Model. Chin. Med. 16 (1), 34. doi:10.1186/s13020-021-00446-x
Chen, L., Zhu, T., Qi, J., Zhang, Y., Zhang, Z., and Liu, H. (2021a). Pharmacological Mechanism of JiaWeiSiWu Granule in the Treatment of Hypertension Based on Network Pharmacology. Ann. Palliat. Med. 10 (7), 7486–7513. doi:10.21037/apm-21-1140
Chen, Y., Abraham, A., and Bo, Y. (2006). Feature Selection and Classification Using Flexible Neural Tree. Neurocomputing 70 (1/3), 305–313. doi:10.1016/j.neucom.2006.01.022
Chen, Y., Chen, D., Liu, S., Yuan, F., Guo, F., Fang, F., et al. (2019). Systematic Elucidation of the Mechanism of Genistein against Pulmonary Hypertension via Network Pharmacology Approach. Int. J. Mol. Sci. 20 (22), 5569. doi:10.3390/ijms20225569
Chen, Y., Yuan, T., Chen, D., Liu, S., Guo, J., Fang, L., et al. (2020). Systematic Analysis of Molecular Mechanism of Resveratrol for Treating Pulmonary Hypertension Based on Network Pharmacology Technology. Eur. J. Pharmacol. 888, 173466. doi:10.1016/j.ejphar.2020.173466
Díaz-Uriarte, R., and Alvarez de Andrés, S. (2006). Gene Selection and Classification of Microarray Data Using Random forest. BMC Bioinformatics 7, 3. doi:10.1186/1471-2105-7-3
Essiarab, F., Taki, H., Malki, E. A., Hassar, M., Ghalim, N., Saile, R., et al. (2011). Cardiovascular Risk Factors Prevalence in a Moroccan Population. Eur. J. Scientific Res. 49 (4), 581–589.
Fang, M., Chen, Y., Xue, R., Wang, H., Chakraborty, N., Su, T., et al. (2021). A Hybrid Machine Learning Approach for Hypertension Risk Prediction. Neural Comput. Applic. doi:10.1007/s00521-021-06060-0
Furey, T. S., Cristianini, N., Duffy, N., Bednarski, D. W., Schummer, M., and Haussler, D. (2000). Support Vector Machine Classification and Validation of Cancer Tissue Samples Using Microarray Expression Data. Bioinformatics 16 (10), 906–914. doi:10.1093/bioinformatics/16.10.906
Hu, J., and Min, J. (2018). Automated Detection of Driver Fatigue Based on EEG Signals Using Gradient Boosting Decision Tree Model. Cogn. Neurodyn 12 (4), 431–440. doi:10.1007/s11571-018-9485-1
Hu, Z., Tang, J., Wang, Z., Zhang, K., Zhang, L., and Sun, Q. (2018). Deep Learning for Image-Based Cancer Detection and Diagnosis − A Survey. Pattern Recognition 83, 134–149. doi:10.1016/j.patcog.2018.05.014
Hwang, K.-Y., Lee, E.-S., Kim, G.-W., Hong, S.-O., Park, J.-S., Kwak, M.-S., et al. (2016). Developing Data Quality Management Algorithm for Hypertension Patients Accompanied with Diabetes Mellitus by Data Mining. J. Digital Convergence 14 (7), 309–319. doi:10.14400/jdc.2016.14.7.309
Ji, Z., and Wang, B. (2014). Identifying Potential Clinical Syndromes of Hepatocellular Carcinoma Using PSO-Based Hierarchical Feature Selection Algorithm. Biomed. Res. Int. 2014, 127572. doi:10.1155/2014/127572
Ji, Z., Wu, D., Zhao, W., Peng, H., Zhao, S., Huang, D., et al. (2015). Systemic Modeling Myeloma-Osteoclast Interactions under Normoxic/hypoxic Condition Using a Novel Computational Approach. Sci. Rep. 5, 13291. doi:10.1038/srep13291
Li, X., and Guo, Y. (2005). Naive Bayesian Classifier Based on Multiple Discriminant Analysis. Inf. Control 34 (5), 580–584.
Liang, Y., Chen, Z., Ward, R., and Elgendi, M. (2018). Photoplethysmography and Deep Learning: Enhancing Hypertension Risk Stratification. Biosensors 8 (4), 101. doi:10.3390/bios8040101
Liao, Y., and Vemuri, V. R. (2002). Use of K-Nearest Neighbor Classifier for Intrusion Detection. Comput. Security 21 (5), 439–448. doi:10.1016/s0167-4048(02)00514-x
Liu, T. H., Chen, W. H., Chen, X. D., Liang, Q. E., Tao, W. C., Jin, Z., et al. (2020). Network Pharmacology Identifies the Mechanisms of Action of TaohongSiwu Decoction Against Essential Hypertension. Med. Sci. Monit. 26, e920682. doi:10.12659/MSM.920682
Liu, X., Zhang, Y., Fu, C., Zhang, R., and Zhou, F. (2021). EnRank: An Ensemble Method to Detect Pulmonary Hypertension Biomarkers Based on Feature Selection and Machine Learning Models. Front. Genet. 12, 636429. doi:10.3389/fgene.2021.636429
Ma, X. L., Zhai, X., Liu, J. W., Xue, X. X., Guo, S. Z., Xie, H., et al. (2018). Study on the Biological Basis of Hypertension and Syndrome with Liver-Fire Hyperactivity Based on Data Mining Technology. World J. Traditional Chin. Med. 4 (4), 176–180. doi:10.4103/wjtcm.wjtcm_23_18
Maalouf, M. (2011). Logistic Regression in Data Analysis: an Overview. Ijdats 3 (3), 281–299. doi:10.1504/ijdats.2011.041335
Morra, J. H., Tu, Z., Apostolova, L. G., Green, A. E., Toga, A. W., and Thompson, P. M. (2009). Comparison of AdaBoost and Support Vector Machines for Detecting Alzheimer's Disease Through Automated Hippocampal Segmentation. IEEE Trans. Med. Imaging 29 (1), 30–43. doi:10.1109/TMI.2009.2021941
Munshi, T., Zuidgeet, M., Brussel, M., and Maarseveen, M. V. (2014). Logistic Regression and Cellular Automata-Based Modeling of Retail, Commercial and Residential Development in the City of Ahmedabad India. Cities 38 (2), 88–101. doi:10.1016/j.cities.2014.02.007
Mysinger, M. M., Carchia, M., Irwin, J. J., and Shoichet, B. K. (2012). Directory of Useful Decoys, Enhanced (DUD-E): Better Ligands and Decoys for Better Benchmarking. J. Med. Chem. 55 (14), 6582–6594. doi:10.1021/jm300687e
Owlia, M., and Bangalore, S. (2016). In Hypertensive Patients with Elevated Risk of Cardiovascular Disease, Targeting Systolic Blood Pressure to Less Than 120 Mm Hg Significantly Reduces the Rate of Fatal and Non-fatal Cardiovascular Events as Well as Death from Any Cause. Evid. Based Med. 21 (3), 101. doi:10.1136/ebmed-2016-110397
Ramezankhani, A., Kabir, A., Pournik, O., Azizi, F., and Hadaegh, F. (2016). Classification-based Data Mining for Identification of Risk Patterns Associated with Hypertension in Middle Eastern Population. Medicine 95 (35), e4143. doi:10.1097/md.0000000000004143
Rish, I. (2001). “An Empirical Study of the Naive Bayes Classifier”, in IJCAI 2001 Workshop on Empirical Methods in Artificial Intelligence, Seattle, WA, August 4, 2001 3, 41–46.
Sakai, K., and Sigmund, C. D. (2005). Molecular Evidence of Tissue Renin-Angiotensin Systems: A Focus on the Brain. Curr. Sci. Inc 7 (2), 135–140. doi:10.1007/s11906-005-0088-y
Suykens, J. A. K., and Vandewalle, J. (1999). Least Squares Support Vector Machine Classifiers. Neural Process. Lett. 9 (3), 293–300. doi:10.1023/a:1018628609742
Temkin, N. R., Holubkov, R., Machamer, J. E., Winn, H. R., and Dikmen, S. S. (1995). Classification and Regression Trees (CART) for Prediction of Function at 1 Year Following Head Trauma. J. Neurosurg. 82 (5), 764–771. doi:10.3171/jns.1995.82.5.0764
Wang, T., He, M., Du, Y., Chen, S., and Lv, G. (2021). Network Pharmacology Prediction and Pharmacological Verification Mechanism of Yeju Jiangya Decoction on Hypertension. Evid. Based Complement. Alternat Med. 2021, 5579129. doi:10.1155/2021/5579129
Wang, T., Zhang, Y., Lu, J., Chai, R., Chen, X., et al. (2018). Research on the Functional Mechanism of Shengmai Injection Based on Network Pharmacology. J. Pharm. Res. 37 (11), 621–624. doi:10.13506/j.cnki.jpr.2018.11.001
Xu, S. N., Li, Z., Zhai, Y. Y., Yao, W. F., Xu, J., Liu, Q., et al. (2018). Material Basis and Mechanism of Erzhi Pill for Preventing Osteoporosis Based on Network Pharmacology. Chin. Pharm. J. 53 (22), 1913–1920. doi:10.11669/cpj.2018.22.007
Yang, B., Chen, Y., and Jiang, M. (2013). Reverse Engineering of Gene Regulatory Networks Using Flexible Neural Tree Models. Neurocomputing 99, 458–466. doi:10.1016/j.neucom.2012.07.015
Yuan, F., and Chen, S. (2011). Model Construction on Efficient Mining Association Rules in Clinical Data of Hypertension. Comput. Eng. Appl. 47 (36), 226–229+233. doi:10.3778/j.issn.1002-8331.2011.36.062
Zhai, Z., Tao, X., Alami, M. M., Shu, S., and Wang, X. (2021). Network Pharmacology and Molecular Docking Combined to Analyze the Molecular and Pharmacological Mechanism of Pinellia Ternata in the Treatment of Hypertension. Cimb 43 (1), 65–78. doi:10.3390/cimb43010006
Zhang, B., Ren, J., Cheng, Y., Wang, B., and Wei, Z. (2019b). Health Data Driven on Continuous Blood Pressure Prediction Based on Gradient Boosting Decision Tree Algorithm. IEEE Access 7, 32423–32433. doi:10.1109/access.2019.2902217
Zhang, Y., Lei, L., and He, J. (2019a). Study on Distribution Rules of TCM Signs and Symptoms and Syndrome Elements in Essential Hypertension Based on Data Mining. Chin. J. Inf. Traditional Chin. Med. 26 (1), 99–104. doi:10.3969/j.issn.1005-5304.2019.01.023
Zhao, L., Wu, Y. J., and Zhang, M. Q. (2021). Research Progress of Data Mining in the Treatment of Hypertension by Traditional Chinese Medicine. Food Ther. Health Care 3 (2), 36–46. doi:10.12032/FTHC20210503
Keywords: hypertension, flexible neural tree, ensemble, network pharmacology, machine learning
Citation: Yang B, Bao W and Wang J (2021) Hypertension-Related Drug Activity Identification Based on Novel Ensemble Method. Front. Genet. 12:768747. doi: 10.3389/fgene.2021.768747
Received: 01 September 2021; Accepted: 27 September 2021;
Published: 15 October 2021.
Edited by:
Quan Zou, University of Electronic Science and Technology of China, ChinaReviewed by:
Zhiwei Ji, Nanjing Agricultural University, ChinaChunhou Zheng, Anhui University, China
Copyright © 2021 Yang, Bao and Wang. This is an open-access article distributed under the terms of the Creative Commons Attribution License (CC BY). The use, distribution or reproduction in other forums is permitted, provided the original author(s) and the copyright owner(s) are credited and that the original publication in this journal is cited, in accordance with accepted academic practice. No use, distribution or reproduction is permitted which does not comply with these terms.
*Correspondence: Wenzheng Bao, YmFvd3o1NTU1NUAxMjYuY29t
 Bin Yang
 Wenzheng Bao
 Jinglong Wang