
94% of researchers rate our articles as excellent or good
Learn more about the work of our research integrity team to safeguard the quality of each article we publish.
Find out more
ORIGINAL RESEARCH article
Front. Genet. , 25 October 2021
Sec. Statistical Genetics and Methodology
Volume 12 - 2021 | https://doi.org/10.3389/fgene.2021.765400
This article is part of the Research Topic System Biology Methods and Tools for Integrating Omics Data, Volume II View all 15 articles
 Bin Li1,2,3†
 Wen-Xuan Sun1†
 Wan-Ying Zhang1,3
 Ye Zheng1
 Lu Qiao1
 Yue-Ming Hu1
 Wei-Qiang Li1
 Di Liu1
 Bing Leng1
 Jia-Ren Liu1,3
 Xiao-Feng Jiang1*
 Yan Zhang2*
Rationale: Severe asthma is a heterogeneous disease with multiple molecular mechanisms. Gene expression studies of asthmatic bronchial epithelial cells have provided biological insights and underscored possible pathological mechanisms; however, the molecular basis in severe asthma is still poorly understood.
Objective: The objective of this study was to identify the features of asthma and uncover the molecular basis of severe asthma in distinct molecular phenotype.
Methods: The k-means clustering and differentially expressed genes (DEGs) were performed in 129 asthma individuals in the Severe Asthma Research Program. The DEG profiles were analyzed by weighted gene co-expression network analysis (WGCNA), and the expression value of each gene module in each individual was annotated by gene set variation analysis (GSVA).
Results: Expression analysis defined five stable asthma subtype (AS): 1) Phagocytosis-Th2, 2) Normal-like, 3) Neutrophils, 4) Mucin-Th2, and 5) Interferon-Th1 and 15 co-expressed gene modules. “Phagocytosis-Th2” enriched for receptor-mediated endocytosis, upregulation of Toll-like receptor signal, and myeloid leukocyte activation. “Normal-like” is most similar to normal samples. “Mucin-Th2” preferentially expressed genes involved in O-glycan biosynthesis and unfolded protein response. “Interferon-Th1” displayed upregulation of genes that regulate networks involved in cell cycle, IFN gamma response, and CD8 TCR. The dysregulation of neural signal, REDOX, apoptosis, and O-glycan process were related to the severity of asthma. In non-TH2 subtype (Neutrophils and Interferon-Th1) with severe asthma individuals, the neural signals and IL26-related co-expression module were dysregulated more significantly compared to that in non-severe asthma. These data infer differences in the molecular evolution of asthma subtypes and identify opportunities for therapeutic development.
Conclusions: Asthma is a heterogeneous disease. The co-expression analysis provides new insights into the biological mechanisms related to its phenotypes and the severity.
Asthma is a chronic disorder, characterized by airway hyper-responsiveness (AHR) and remodeling with variable degrees of eosinophilic and neutrophilic inflammation resulting in significant morbidity and mortality (Wilson et al., 2006; Kim et al., 2010). It affects about 5% of the population (Global et al., 2017). According to the clinical characteristics, it is mainly divided into the acute and the non-acute asthma, which is further divided into mild, moderate, and severe asthma individual. About 5–10% of the patients do not respond well to standard treatment and have a poor prognosis (Higgins, 2003). The bronchial epithelial cells act as a physical barrier in airway immunity and as central modulators of inflammatory response (Hamilton et al., 2001). Environmental stimuli promote epithelial cell synthesis and secretion by a variety of mediators, such as cytokines, chemokines, reactive oxygen species, lipid, and peptide mediators and eventually involved in recruiting leukocytes, mucus secretion, vascular permeability, bronchoconstriction, and airway hyper-responsiveness (Whitsett, 2018).
Gene expression and genetic variation studies both indicate that asthma is a polygenic and heterogeneous disease with multiple molecular roots (Langfelder and Horvath, 2008; Belsky et al., 2013). Based on the gene profiles in bronchial epithelial cells associated with fractional exhaled nitric oxide (FeNO), Modena et al. identified five phenotypes of asthma. The results showed that a large number of individuals were severe asthma in each subtype (Modena et al., 2014). However, the typical characteristics of phenotype and the features related to severe asthma in phenotype were also unclear. Therefore, revealing these characteristics in each molecular subtype could be valuable for individualized treatment of severe asthma.
In recent years, the WGCNA (Langfelder and Horvath, 2008) (weighted gene co-expression network analysis) is a new system biology approach that can be used to identify co-expression gene sets that largely represent the typical biological characteristics in complex disease. Therefore, in this study, we used the co-expressed gene modules (GMs) that were used to uncover the typical features in subtype and severe asthma.
As part of SARP (Severe Asthma Research Program), bronchial brushing samples and matching demographic data were obtained from 155 participants (129 asthmatics and 26 healthy subjects) from 2009 to 2011. Gene expression of the SARP and external cohorts are available online (GEO database; http://www.ncbi.\.
According to the transcription of bronchial epithelial cells, the k-means method integrated in the ConsensusClusterPlus (Wilkerson and Hayes, 2010) package was adopted to identify stable subtypes, and the stability was evaluated by iterating for 1,000 times at a sub-sampling rate of 0.95. A total of 4,650 (MAD: median absolute deviation >0.5) genes were used as input. Starting from k = 4-5, a significant improvement in clustering stability can be observed, but it has no effect on k > 5 (Figure 1C). They were termed by asthma subtype. After the establishment of these ASs, the Bayesian method in Limma package was used to select the differentially expressed genes (DEGs) between each ASs and the normal. The cutoff setting: FC ≥ log (1.5), FDR ≤ 0.05.
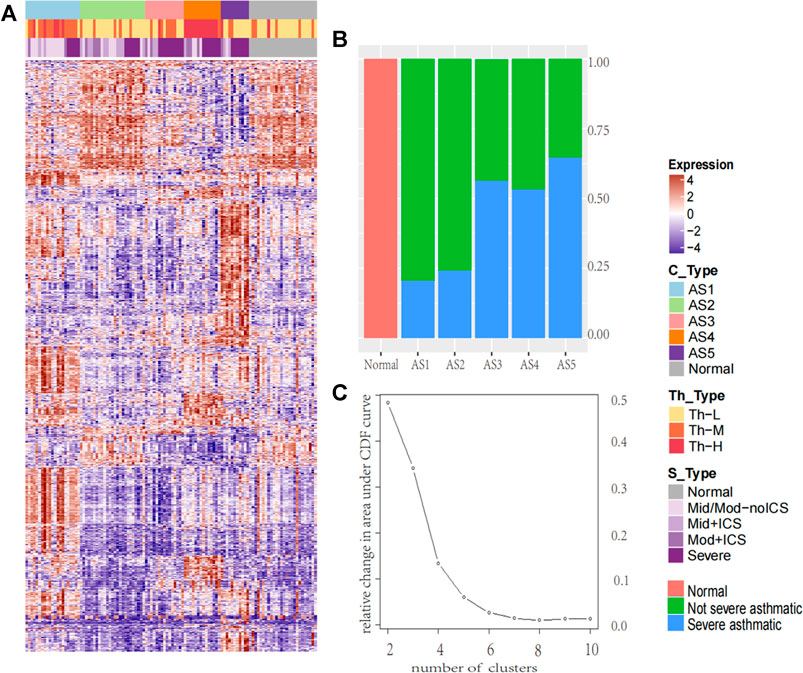
FIGURE 1. The heatmap of molecular subtype in asthma and the percentage of severe asthma in each cluster. The heatmap of molecular subtype in asthma and the percentage of severe asthma in each cluster (A) The k-means identified five stable asthma subtypes (AS1–5), the heatmap was derived by 2,664 DEGs selected in each subtype. To define the Th2 subtype, the unsupervised hierarchical clustering was performed based on the microarray expression levels of periostin (POSTN), channel regulator 1 (CLCA1), and serpin peptidase inhibitor, clade B, member 2 (SERPINB2). We named these subtypes: (1) Th-H, High; (2) Th-M, Moderate; (3) Th-L, Low. According to the severity of the disease, the samples were divided into five groups: Normal for normal group; Mid/Mod-noICS for mild and moderate without ICS treatment; Mid + ICS for mild and ICS treatment group; Mod + ICS for moderate and ICS treatment group; and Severe for severe asthma group (B) The percentage of severe asthma in each cluster (red, normal samples, green: non-severe asthma individuals; blue: severe asthma individuals).
To determine the inflammatory Th2 group, K-means on 155 subjects was performed based on microarray expression profiles of three Th2 marker genes (Woodruff et al., 2007) (periostin: POSTN, channel regulator 1: CLCA1, and serpin peptidase inhibitor clade B member 2: SERPINB2). and three main clusters were identified. They were named Th-H (Th2-high), Th-M (Th2-moderate), and Th-L (Th2-low).
Using the default parameter setting and the 2,664 DEGs selected in ASs, the WGCNA was performed. This method clusters genes into modules using a topological overlap measure (TOM) (Langfelder et al., 2008). The TOM was a highly robust interconnection measurement method that essentially provided a measure of the connection strength between two adjacent genes and all other genes in a network. Genes were clustered using 1-TOM as the distance measure and GMs were defined as branches of the resulting cluster tree using a dynamic branch-cutting algorithm. Based on the dysregulated direction of each gene in asthma, the genes in each co-expressed module were split into 2 GMs.
Gene Set Variation Analysis (GSVA) was performed using the R package “GSVA” (Hänzelmann et al., 2013) (function gsva - arguments: method = “gsva”, mx. diff = TRUE). GSVA implements a non-parametric unsupervised method of gene set enrichment that allowed an assessment of the relative enrichment of a selected pathway across the sample space. The output of GSVA was a gene set by sample matrix of GSVA enrichment scores that were approximately normally distributed. GSVA enrichment scores were generated for each gene set using the normalized gene expression data.
Using the clusterProfiler (Yu et al., 2012) package, the functional enrichment analysis was performed for the up- and downregulated GMs. Significance cutoff was defined as FDR <0.05 for multiple testing.
The correlation analysis was performed by Pearson. The GSVA score in each gene set represented its overall expression in individual. The C2 (curated gene sets) dataset was downloaded from Molecular Signatures Database (MSigDB), which is a collection of annotated gene sets for pathway analysis (http://software.broadinstitute.org/gsea/msigdb).
The k-means was performed, and five stable asthma subtypes were obtained (Figure 1A). These subtypes were named as follows: 1) Phagocytosis-Th2, 2) Normal-like, 3) Neutrophils-Type, 4) Mucin-Th2, and 5) Interferon-Th1 based on the differential expression modules and their related biological clinical characteristics. These five subtypes were associated with specific clinical characteristics (Table 1). “Interleukin-Th2” is the youngest group (mean age = 29) with an elevated FeNO (43 ppb). “Normal-like” has the highest Juniper AQLQ (mean 5, p = 4.2E-12). “Neutrophils-Type” has the highest levels of neutrophils in blood (mean, 60, p = 0.02) and BAL (mean, 4, p = 0.02) and the lowest total cells count in BAL (mean, 2.3, p = 3.9E-05). “Mucin-Th2” has the highest FeNO overall (mean, 46, p = 2.5E-05) and the greatest reversibility (mean, 21, p = 2.5E-05). The “Interferon-Th1” has the highest lymphocytes (mean, 14, p = 0.01) in BAL. In addition, three subtypes (“Neutrophils-Type”, “Mucin-Th2”, and “Interferon-Th1”) had more percentage of severe asthma individuals (chi-square, p < 0.001) (Figure 1B).
A total of 2,664 DEGs were detected among these five ASs compared to the normal samples. Using 2,664 DEG as input, a total of 15 coordinately expressed GMs representing distinct biological processes were obtained. In these 15 GMs with only upregulated genes, 10 discriminated these five asthma clusters (Figure 2). In the validation dataset, compared to the normal group, the overall expression level of these modules was consistent with the trend in this study.
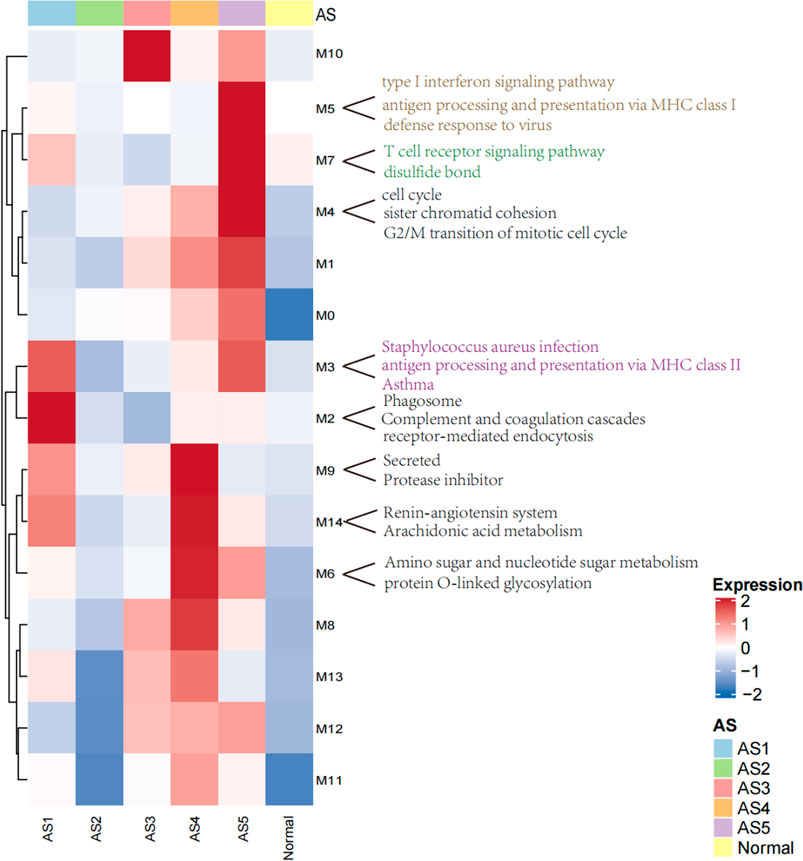
FIGURE 2. The heatmap of modules with upregulated genes in ASs. The overall expression is represented by red and blue; the red indicates high expressed in cluster, and the blue indicates low expressed in cluster. M0–M14 represents 15 co-expressed modules with upregulated genes.
Two core gene programs (GM2 and GM3) characterized “Phagocytosis-Th2”, which included gene networks involved in leukocyte migration (5.3%, FDR = 9.15E-05), osteoclast differentiation (4.5%, FDR = 0.006), receptor-mediated endocytosis (5.7%, FDR = 7.03E-04, COLEC12, MSR1, CD163), and antigen processing and presentation via MHC class II (6%, p = 1.42E-13, HLA-DMA (Gao et al., 2020), HLA-DRB5, HLA-DMB, HLA-DRB4, HLA-DPB1, HLA-DRA, HLA-DRB3, HLA-DOA, HLA-DQA2 (Lasky-Su et al., 2012), HLA-DRB1, HLA-DPA1). The clinical characteristics showed that the eosinophils (mean: 4, p = 0.0009) were abnormally increased in blood. FeNo (mean: 43, p = 2.5E-05) levels were higher, while the lymphocyte counts (mean, 5.8, p = 0.01) in BAL were lower compared to normal samples. The overall expression of GM2 in this cluster was significantly related to phagocytosis category, which was the reason why it was termed as “Phagocytosis-Th2”.
The Normal-like subtype was the most similar to the normal group, with the mildest clinical symptoms and the fewest differential expressed genes. The top three upregulated genes were PHACTR3 (Itoh et al., 2014), SLCO1B3, and GNMT, which were related to the response of glucocorticoids.
The GM10 was a typical feature of Neutrophils-Type. This module only contained eight upregulated genes, including SLCO1B3, PHACTR3, TPO, and FKBP5 (Binder, 2009), which were also related to the glucocorticoids and severity. The TPO was a marker that related to the severity of asthma (Voraphani et al., 2014).
Three core gene programs (GM6, GM9, and GM14) characterized “Mucin-Th2”, which included gene networks involved in O-linked glycosylation (2%, p = 0.01, i.e., GALNT7, PGM3 (Zhang et al., 2019), and GALNT10), amino acid biosynthetic process (3%, p = 0.08, i.e., FOLH1, FOLH1B, and PYCR1), and negative regulation of endopeptidase activity (5.7%, i.e., SERPINA11, SERPINB10, SERPINB2 (Sánchez-Ovando et al., 2020), AHSG, WFIKKN2, and FETUB (Diao et al., 2016)). Individualized functional analysis showed that about 90% of individuals in “Mucin-Th2” significantly enriched Mucin type O-Glycan biosynthesis pathway. This cluster has the highest expression of Th2 marker genes (CLCA1, POSTN, and SERPINB2) and has the highest FeNo overall (median = 46 ppb, p = 2.5E-05) and eosinophils in blood, BAL, and sputum (Table 1). Although Mucin-Th2 was the typical Th2, no inflammation and immune-related modules (GM2, GM3, GM5, and GM7) were found overexpressed in this cluster.
Three core gene programs (GM4, GM5, and GM7) characterized Interferon-Th1, which included gene networks involved in cell division (23%, p = 2.39E-29, i.e., ERCC6L, CDCA2, and CDCA3), type I interferon response (15%, p = 5.84E-30, i.e., IFITM3, IFITM1, and IFITM2), antigen processing and presentation via MHC class I (6%, p = 6.53E-09, i.e., HLA-H, HLA-B, HLA-C, HLA-A, HLA-F, B2M, HLA-G, and HLA-E), and T-cell activation (8.9%, p = 7.17E-12, i.e., ITK, ZAP70, TNFSF14, CD8B, CD8A, and CD48). The overall expression of GM5 was significantly related to interferon response, which was the reason we termed this type “Interferon-Th1”. This subtype was a typical non-Th2 subtype with normal FeNo (mean:22) and eosinophils in peripheral blood, BAL, and sputum.
In GMs with upregulated genes, 9 GMs (0, 1, 3, 4, 6, 8, 10, 12, and 14) were positively correlated to the severity and positive association with the use of ICS and OCS. They were also the most negatively correlated with FEV1% predicted and AQLQ (Figure 3). These genes encode proteins related to calcium ion transmembrane transport (6.34%, p = 0.003, i.e., P2RY12, LOXHD1, CACNB4, and PKDREJ), apoptotic process (7.26%, p = 0.006, i.e., MTFP1, C8ORF4, PTPRH, and LGALS7B), O-glycan processing (4.46%, p = 1.33E-06, i.e., GALNT14, MUC1, and MUC2), and amino acid biosynthetic process (3%, p = 0.003, i.e., FOLH1, FOLH1B, and PYCR1). In 3 GMs (0, 1, 8), this expression increased with each step of disease severity: healthy control (Normal) < mild-to-moderate asthma not treated with ICS (mild-mod-noICS) < mild-to-moderate asthma treated with ICS (mild-mod-ICS) < severe asthma (severe) (Figure 5).
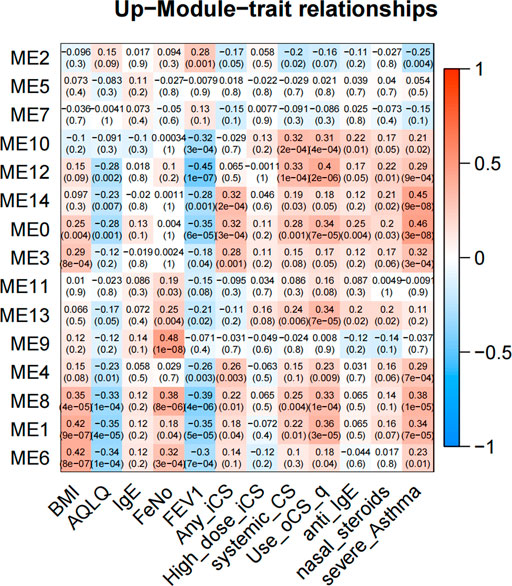
FIGURE 3. The heatmap of correlation between co-expressed modules with upregulated genes and clinical characteristics. The clinical characteristics include BMI, AQLQ, IgE, fractional exhaled nitric oxide (FeNO), FEV1% predicted, use of inhaled (ICS) and oral corticosteroids (OCS), high dose use of ICS, systemic use CS, anti_IgE treatment, nasal steroids, and the severity of asthma. Positive correlations are red, and negative correlations are blue.
In GMs with downregulated genes, 8 GMs (1, 2, 4, 6, 7, 8, 12, and 14) were negatively correlated to the severity and negative association with use of ICS and OCS. They were also the most positively correlated with FEV1% predicted and AQLQ (Figure 4). These genes encode proteins related to cell adhesion (5.24%, p = 0.002, i.e., CD164, COL16A1, PRKCE, and KIAA1462), innate immune response (10%, p = 4.94E-04, i.e., C1QA, MARCO, and SAA1), potassium and sodium ion transmembrane transport (3.7%, p = 5.20E-4, i.e., KCNB1, KCNA1, SLC20A2, and SCN11A), lipoprotein metabolic process (5.62%, p = 2.05E-5, i.e., LRP1, APOC2, APOC1, LPL, and APOE), cellular oxidant detoxification (5.8%, p = 0.01, i.e., GSTM2, GPX3, and CYGB), and neuron signal (10%, p = 1.77E-4, i.e., TUBB2B, SPOCK1, and NRCA). In 4 GMs (2, 4, 7, and 8), this expression decreased with each step of disease severity: healthy control (Normal) < mild-to-moderate asthma not treated with ICS (mild-mod-noICS) < mild-to-moderate asthma treated with ICS (mild-mod-ICS) < severe asthma (SA) (Figure 5).
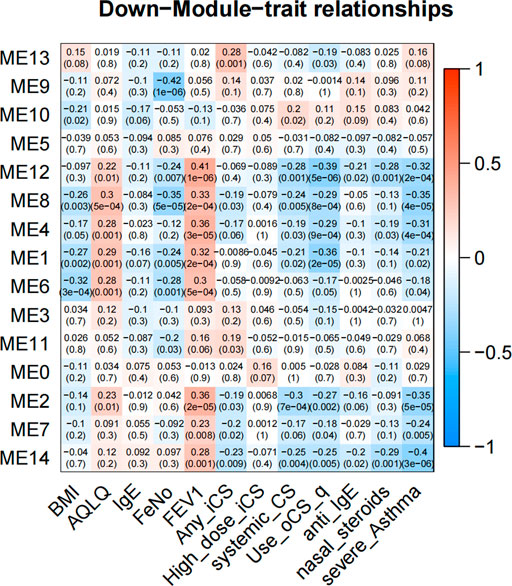
FIGURE 4. The heatmap of correlation between co-expressed modules with downregulated genes and clinical characteristics. The clinical characteristics include BMI, AQLQ, IgE, fractional exhaled nitric oxide (FeNO), FEV1% predicted, use of inhaled (ICS) and oral corticosteroids (OCS), high dose use of ICS, systemic use CS, anti-IgE treatment, nasal steroids, and the severity of asthma. Positive correlations are red, and negative correlations are blue.
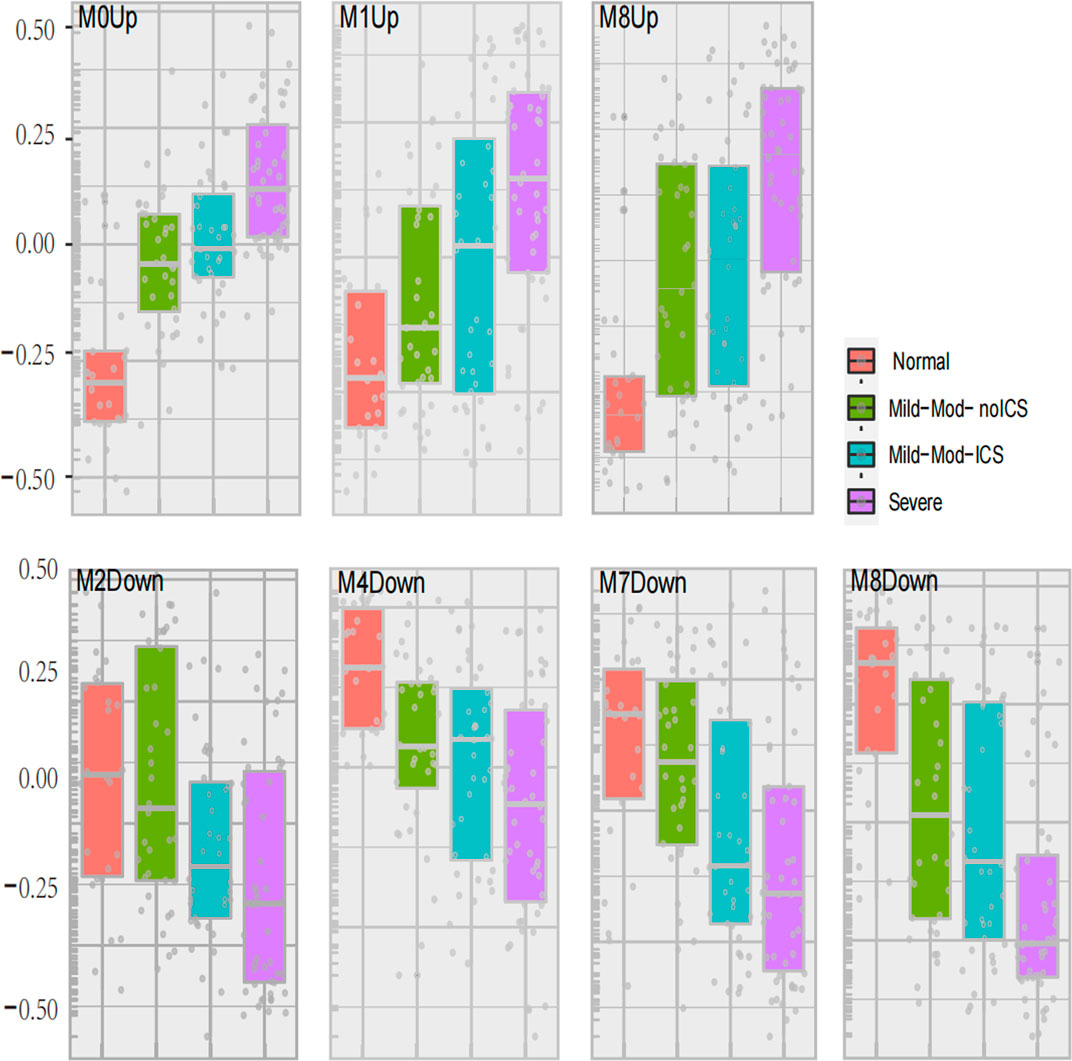
FIGURE 5. Seven modules expression related to asthma severity. The geometric means were measured according to asthma severity. These classes included healthy controls (Normal), mild-to-moderate asthma not on inhaled corticosteroids (Mild-Mod-noICS), mild-to-moderate asthma on inhaled corticosteroids (Mild-Mod-ICS), and severe asthma (SA).
The comparison between mild-mod-ICS and mild-mod-noICS showed that ICS/OCS significantly reduced the expression of 3 GMs (2, 7, and 13) with upregulated genes, while increasing the expression of GM4 with upregulated modules.
A total of 8 GMs (0-up, 1-up, 8-up, 11-up, 13-up, 8-down, 10-down, 12-down) were significantly different between the severe and non-severe group in specific phenotypes (Table 2), and 6 of them were shown in Figure 6. Compared to that in normal and non-severe samples, the GM0-up related to calcium ion trans-membrane transport (6.3%, p = 0.004, i.e., P2RY12, LOXHD1 and CACNB4) and negative regulation of endopeptidase activity (4.7%, p = 0.04, i.e., SERPINB3 and SERPINB4) was abnormally high expressed in severe asthma across all subtypes.
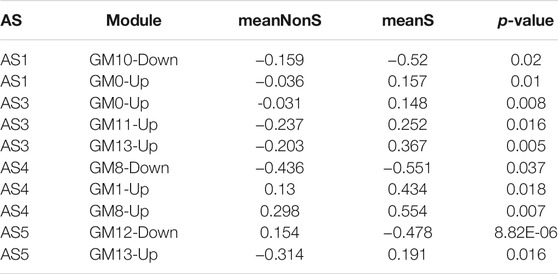
TABLE 2. The differential expression of nine co-expression modules between severe and non-severe individuals in specific subtypes.
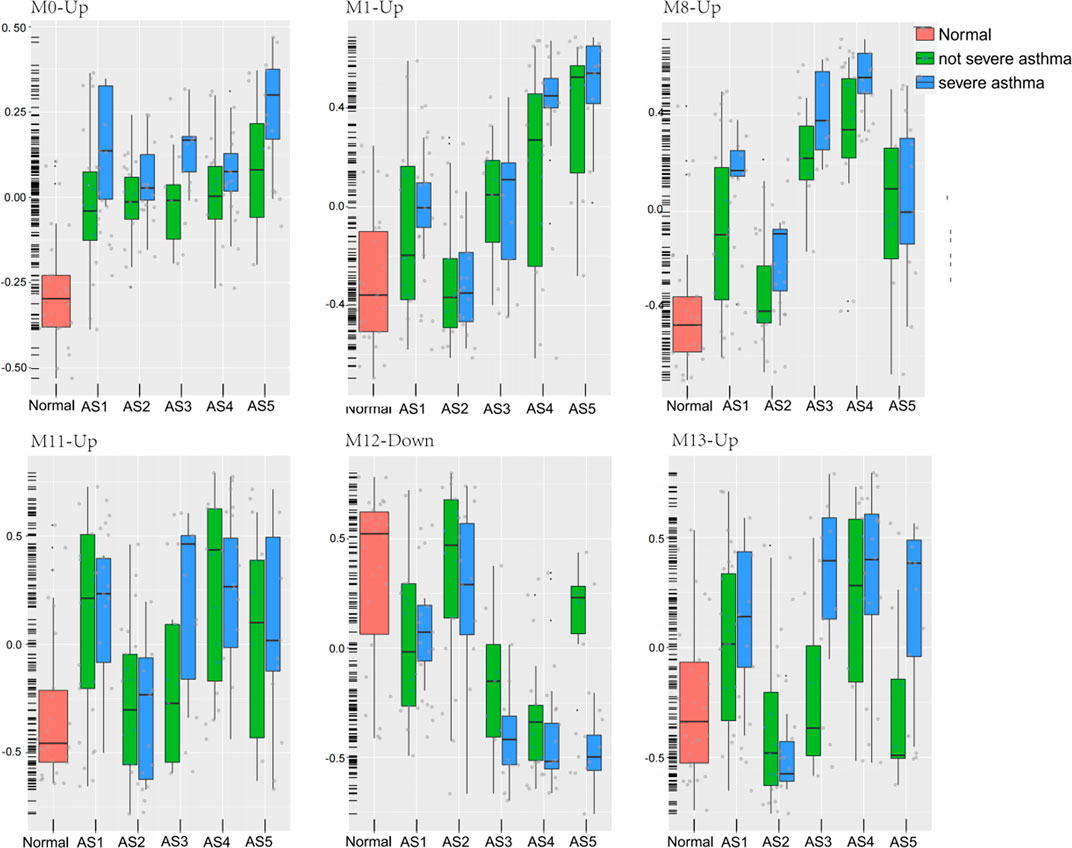
FIGURE 6. Six modules expression in each phenotype between severe and non-severe groups. The geometric means were measured according to each cluster. These classes included healthy controls (Normal), five asthma phenotypes (AS1–5), non-severe asthma, and severe asthma (SA).
In “Phagocytosis-Th2”, the GM10-down related to nitrogen compound metabolic process (2.06%, p = 0.02, i.e., VNN1 and VNN3) was differentially expressed between severe and non-severe groups. In “Mucin-Th2”, the GM1-up related to O-glycan processing (4.7%, p = 1.33E-06, i.e., GALNT14, MUC1, and MUC2), GM8-up related to apoptotic process (17%, p = 0.01, i.e., LGALS7B, MAL, and SGK1), and GM8-down related to immune response (7.1%, p = 0.01, i.e., C3, CXCL6, IL6, and SUSD2) were significantly different between severe and non-severe groups. The GM1-up and GM8-up were much higher expressed while the GM8-down was lower expressed in severe asthma in the “Mucin-Th2” phenotype.
In “Neutrophils-Type” and “Interferon-Th1” (non-Th2) phenotypes, two specific modules (GM13-up and GM12-down) show different expression between severe asthma and non-severe asthma. The GM13-up related to interleukin-26 (IL26, PIK3R5, and LRRC2) was much higher expressed in severe individuals while the GM12-down module related to the nervous system (10%, p = 1.77E-04, i.e., TUBB2B, SPOCK1, and ASCL1) was much lower expressed in severe asthma individuals. The similar results were shown in the validation data (Figure 7).
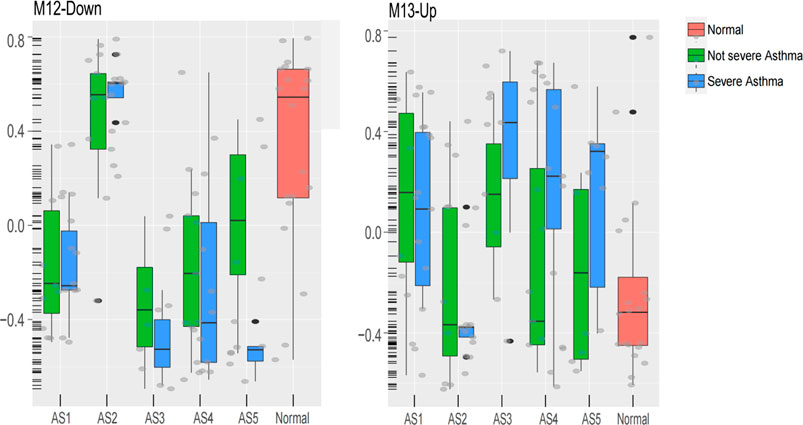
FIGURE 7. The expression of M13-Up and M12-Down modules in clusters between severe and non-severe groups.
Asthma is a heterogeneous disease with multiple immune and non-immune mechanisms (Ito et al., 2004; McKinley et al., 2008). This study shows that the transcriptome of bronchial epithelial cells was related to ASs and the severity.
Using cluster analysis, five stable ASs were obtained. Multiple clinical features had significant differences among these ASs. These results were similar to that of previous studies (Langfelder and Horvath, 2008). Using the expression of 2,664 DEG profiles as input, the WGCNA co-expression analysis was performed and the module was split based on the dysregulated direction of each gene; 30 GMs were obtained, 15 of which contain only upregulated genes and the other 15 contain downregulated genes (Table 3). These split modules were essential for the description of the typical characteristics in ASs. In each co-expressed module, there was a negative correlation between the two gene sets with up- and downregulated genes, respectively. For example, in GM9 with upregulated genes, multiple Th2-related marker genes (CLCA1, POSTN, etc.) were included, while in GM9 with downregulated genes, the MUC5B (Zhang et al., 2019), SLC28A3, and CSGALNACT1 genes were included and closely related to the reduction of airway defense response (Ridley and Thornton, 2018; Rojas et al., 2019). The MUC5B plays a key role in airway defense. The lack of MUC5B leads to lung inflammation, impaired immune balance, and chronic infection mediated by a variety of bacteria (Roy et al., 2014). These two aspects (up and down features) might be two effective strategies for individualized treatment in asthma.
Among these 15 modules containing upregulated genes, 4 GMs (2, 3, 5, and 7) were typical immune-related modules and had obvious subtype distribution characteristics. The GM2 and GM3 were typical characteristics of “Phagocytosis-Th2” while the GM5 and GM7 were the typical features of “Interferon-Th1”. The function enrichment analysis showed that the GM2 and GM3 were mainly related to the receptor-mediated endocytosis and antigen presentation via MHC-II. The GM5 and GM7 were highly expressed in “Interferon-Th1” and mainly related to type I interferon response and T-cell toxicity. Although the “Mucin-Th2” was a typical Th2 phenotype, the four immune-related modules mentioned above were not significantly increased in this cluster, while the increased glycosylation of O-type glycans, amino sugar and nucleoside sugar metabolism, proteolysis, and unfolded protein reaction were highly expressed in this cluster and positively correlated to the expression of Th2 markers. It suggested that these biological functions could be coordinated with the Th2 signals and related to the physio-pathological mechanisms in “Mucin-Th2”. The increased mucus in airway was a typical clinical feature of Th2 asthma (Dunican et al., 2018; Lambrecht et al., 2019). Studies had shown that the galectin-10 (Galectin-10 and Gal10) crystal structure in airway mucus stimulates the immune system and induces the changes in airway inflammation and mucus secretion (Nyenhuis et al., 2019; Persson et al., 2019). Clearing the crystal structure can effectively relieve airway inflammation and asthma symptoms.
Correlation analysis showed that the apoptotic process and O-glycan processing were positively correlated to asthma severity, while the cell adhesion, innate immune response, potassium and sodium ion transmembrane transport, cellular oxidant detoxification, and neuron signal were negatively correlated to asthma severity. Correcting the imbalance of oxidation and anti-oxidation in the lung may be an important method to relieve asthma symptoms in clinic. GSH is the most important antioxidant in lung tissues (Brigelius-Flohé and Maiorino, 2013). GSH can inhibit a variety of pathogen replication and survival, and increasing the GSH can effectively improve the body’s ability to resist foreign microorganisms (Fitzpatrick et al., 2012). The inhibition of the activity of the CYP450 pathway could destroy the phagocytosis of macrophage and reduces the clearance efficiency of inflammatory stimuli (Bystrom et al., 2013).
In “Phagocytosis-Th2”, the GM10-down was differentially expressed between severe and non-severe groups. In “Mucin-Th2”, the O-glycan processing (GM1-Up), apoptotic process (GM8-Up), and oxidation–reduction process (GM8-down) were significantly different between severe and non-severe groups. The oxygen free radical increase in bronchoalveolar lavage fluid and peripheral blood associated with the severity of disease (Mossberg et al., 2009; Sangiuolo et al., 2015), especially in a typical Th2 phenotype (Huang et al., 2019).
In “Neutrophils-Type” and “Interferon-Th1” (non-Th2) phenotype, interleukin-26 (IL26)-related function was upregulated and related to the severity of asthma. IL-26 is a member of IL-10 cytokine family, is abundant in human airways, and induces the production of pro-inflammatory cytokines (Louhaichi et al., 2020). Stimulation of cultured CD4+ T cells with monocyte by recombining IL-26 promoted the generation of RORγ Th17+ cells, inducing the production of IL-17A, IL-1β, IL-6, and TNF-α (Louhaichi et al., 2020). Therefore, IL-26 could appear as a novel pro-inflammatory cytokine, produced in airways, and may be a promising target to treat inflammatory asthma.
Although we clustered the transcriptome of bronchial epithelial cells and revealed the typical features in five stable subtypes, the heterogeneity in asthma is much higher than that in subtypes. The characteristics in individuals were more likely a mixture of typical features in multiple subtypes. For asthma, distinguishing subtypes was only a powerful method for uncovering the heterogeneity of complex diseases. Therefore, the individualized analysis based on phenotypes in asthma was a powerful tool for individualized diagnosis and treatment.
The datasets presented in this study can be found in online repositories. The names of the repository/repositories and accession number(s) can be found in the article.
Acquisition of data: BL accessed to the transcriptom data online; Conception and design: YZ, X-FJ, BL; Analysis and interpretation: BL, W-YZ, W-XS, YZ, LQ, Y-MH, W-QL, DL; Wrote the article: BL, W-XS; Approved and edited the article: All authors approved the article.
This study is funded by the National Natureal science foundation number 81171657, No,30371364.
The authors declare that the research was conducted in the absence of any commercial or financial relationships that could be construed as a potential conflict of interest.
All claims expressed in this article are solely those of the authors and do not necessarily represent those of their affiliated organizations, or those of the publisher, the editors and the reviewers. Any product that may be evaluated in this article, or claim that may be made by its manufacturer, is not guaranteed or endorsed by the publisher.
Thanks to Sally E. Wenzel in the Department of Environmental and Occupational Health, the Director of the University of Pittsburgh Asthma Institute, and the SARP investigators and patients for providing the clinical data. Thanks to Professor Jiang Meng from school of Computer Science of Harbin Institute of Technology for his selfless help in article analysis and writing.
Normal: Healthy controls, AS: asthma subtype, BAl: bronchoalveolar lavage, FeNO: fractional exhaled nitric oxide, ppb: parts-per-billion, Up: the number of upregulated genes in the module, Down: the number of downregulated genes in the module, NonS: the mean value of module in non-severe asthma samples. meanS: the mean value of module in severe asthma samples.
Belsky, D. W., Sears, M. R., Hancox, R. J., Harrington, H., Houts, R., Moffitt, T. E., et al. (2013). Polygenic Risk and the Development and Course of Asthma: an Analysis of Data from a Four-Decade Longitudinal Study. Lancet Respir. Med. 1 (6), 453–461. doi:10.1016/s2213-2600(13)70101-2
Binder, E. B. (2009). The Role of FKBP5, a Co-chaperone of the Glucocorticoid Receptor in the Pathogenesis and Therapy of Affective and Anxiety Disorders. Psychoneuroendocrinology 34 (Suppl. 1), S186–S195. doi:10.1016/j.psyneuen.2009.05.021
Brigelius-Flohé, R., and Maiorino, M. (2013). Glutathione Peroxidases. Biochim. Biophys. Acta (Bba) - Gen. Subjects 1830 (5), 3289–3303. doi:10.1016/j.bbagen.2012.11.020
Bystrom, J., Thomson, S. J., Johansson, J., Edin, M. L., Zeldin, D. C., Gilroy, D. W., et al. (2013). Inducible CYP2J2 and its Product 11,12-EET Promotes Bacterial Phagocytosis: a Role for CYP2J2 Deficiency in the Pathogenesis of Crohn's Disease? PLoS One 8 (9), e75107. doi:10.1371/journal.pone.0075107
Diao, W.-q., Shen, N., Du, Y.-p., Liu, B.-b., Sun, X.-y., Xu, M., et al. (2016). Fetuin-B (FETUB): a Plasma Biomarker Candidate Related to the Severity of Lung Function in COPD. Sci. Rep. 6, 30045. doi:10.1038/srep30045
Dunican, E. M., Elicker, B. M., Gierada, D. S., Nagle, S. K., Schiebler, M. L., Newell, J. D., et al. (2018). Mucus Plugs in Patients with Asthma Linked to Eosinophilia and Airflow Obstruction. J. Clin. Invest. 128 (3), 997–1009. doi:10.1172/jci95693
Fitzpatrick, A. M., Jones, D. P., and Brown, L. A. S. (2012). Glutathione Redox Control of Asthma: from Molecular Mechanisms to Therapeutic Opportunities. Antioxid. Redox Signaling 17 (2), 375–408. doi:10.1089/ars.2011.4198
Gao, J., Wu, M., Wang, F., Jiang, L., Tian, R., Zhu, X., et al. (2020). CD74, a Novel Predictor for Bronchopulmonary Dysplasia in Preterm Infants. Medicine (Baltimore) 99 (48), e23477. doi:10.1097/md.0000000000023477
Global, Regional, and National Deaths, Prevalence, Disability-Adjusted Life Years, and Years Lived with Disability for Chronic Obstructive Pulmonary Disease and Asthma, 1990-2015: a Systematic Analysis for the Global Burden of Disease Study 2015. Lancet Respir. Med. 2017;5(9):691–706.doi:10.1016/S2213-2600(17)30293-X
Hamilton, L. M., Davies, D. E., Wilson, S. J., Kimber, I., Dearman, R. J., and Holgate, S. T. (2001). The Bronchial Epithelium in Asthma-Mmuch More Than a Passive Barrier. Monaldi Arch. Chest Dis. 56 (1), 48–54.
Hänzelmann, S., Castelo, R., and Guinney, J. (2013). GSVA: Gene Set Variation Analysis for Microarray and RNA-Seq Data. BMC Bioinformatics 14, 7. doi:10.1186/1471-2105-14-7
Higgins, J. C. (2003). The 'crashing asthmatic.'. Am. Fam. Physician 67 (5), 997–1004. doi:10.1080/02724634.2003.10010569
Huang, W.-C., Liu, C.-Y., Shen, S.-C., Chen, L.-C., Yeh, K.-W., Liu, S.-H., et al. (2019). Protective Effects of Licochalcone A Improve Airway Hyper-Responsiveness and Oxidative Stress in a Mouse Model of Asthma. Cells 8 (6), 617. doi:10.3390/cells8060617
Ito, K., Hanazawa, T., Tomita, K., Barnes, P. J., and Adcock, I. M. (2004). Oxidative Stress Reduces Histone Deacetylase 2 Activity and Enhances IL-8 Gene Expression: Role of Tyrosine Nitration. Biochem. Biophysical Res. Commun. 315 (1), 240–245. doi:10.1016/j.bbrc.2004.01.046
Itoh, A., Uchiyama, A., Taniguchi, S., and Sagara, J. (2014). Phactr3/scapinin, a Member of Protein Phosphatase 1 and Actin Regulator (Phactr) Family, Interacts with the Plasma Membrane via Basic and Hydrophobic Residues in the N-Terminus. PLoS One 9 (11), e113289. doi:10.1371/journal.pone.0113289
Kim, H. Y., DeKruyff, R. H., and Umetsu, D. T. (2010). The many Paths to Asthma: Phenotype Shaped by Innate and Adaptive Immunity. Nat. Immunol. 11 (7), 577–584. doi:10.1038/ni.1892
Lambrecht, B. N., Hammad, H., and Fahy, J. V. (2019). The Cytokines of Asthma. Immunity 50 (4), 975–991. doi:10.1016/j.immuni.2019.03.018
Langfelder, P., and Horvath, S. (2008). WGCNA: an R Package for Weighted Correlation Network Analysis. BMC Bioinformatics 9, 559. doi:10.1186/1471-2105-9-559
Langfelder, P., Zhang, B., and Horvath, S. (2008). Defining Clusters from a Hierarchical Cluster Tree: the Dynamic Tree Cut Package for R. Bioinformatics 24 (5), 719–720. doi:10.1093/bioinformatics/btm563
Lasky-Su, J., Himes, B. E., Raby, B. A., Klanderman, B. J., Sylvia, J. S., Lange, C., et al. (2012). HLA-DQ Strikes Again: Genome-wide Association Study Further confirmsHLA-DQin the Diagnosis of Asthma Among Adults. Clin. Exp. Allergy 42 (12), 1724–1733. doi:10.1111/cea.12000
Leek, J. T., Johnson, W. E., Parker, H. S., Jaffe, A. E., and Storey, J. D. (2012). The Sva Package for Removing Batch Effects and Other Unwanted Variation in High-Throughput Experiments. Bioinformatics 28 (6), 882–883. doi:10.1093/bioinformatics/bts034
Louhaichi, S., Mlika, M., Hamdi, B., Hamzaoui, K., and Hamzaoui, A. (2020). Sputum IL-26 Is Overexpressed in Severe Asthma and Induces Proinflammatory Cytokine Production and Th17 Cell Generation: A Case-Control Study of Women. Jaa Vol. 13, 95–107. doi:10.2147/jaa.s229522
McKinley, L., Alcorn, J. F., Peterson, A., DuPont, R. B., Kapadia, S., Logar, A., et al. (2008). TH17 Cells Mediate Steroid-Resistant Airway Inflammation and Airway Hyperresponsiveness in Mice. J. Immunol. 181 (6), 4089–4097. doi:10.4049/jimmunol.181.6.4089
Modena, B. D., Tedrow, J. R., Milosevic, J., Bleecker, E. R., Meyers, D. A., Wu, W., et al. (2014). Gene Expression in Relation to Exhaled Nitric Oxide Identifies Novel Asthma Phenotypes with Unique Biomolecular Pathways. Am. J. Respir. Crit. Care Med. 190 (12), 1363–1372. doi:10.1164/rccm.201406-1099oc
Mossberg, N., Movitz, C., Hellstrand, K., Bergström, T., Nilsson, S., and Andersen, O. (2009). Oxygen Radical Production in Leukocytes and Disease Severity in Multiple Sclerosis. J. Neuroimmunol 213 (1-2), 131–134. doi:10.1016/j.jneuroim.2009.05.013
Nyenhuis, S. M., Alumkal, P., Du, J., Maybruck, B. T., Vinicky, M., and Ackerman, S. J. (2019). Charcot-Leyden crystal Protein/galectin-10 Is a Surrogate Biomarker of Eosinophilic Airway Inflammation in Asthma. Biomarkers Med. 13 (9), 715–724. doi:10.2217/bmm-2018-0280
Persson, E. K., Verstraete, K., Heyndrickx, I., Gevaert, E., Aegerter, H., Percier, J.-M., et al. (2019). Protein Crystallization Promotes Type 2 Immunity and Is Reversible by Antibody Treatment. Science 364 (6442), eaaw4295. doi:10.1126/science.aaw4295
Ridley, C., and Thornton, D. J. (2018). Mucins: the Frontline Defence of the Lung. Biochem. Soc. Trans. 46 (5), 1099–1106. doi:10.1042/bst20170402
Rojas, D. A., Iturra, P. A., Méndez, A., Ponce, C. A., Bustamante, R., Gallo, M., et al. (2019). Increase in Secreted Airway Mucins and Partial Muc5b STAT6/FoxA2 Regulation during Pneumocystis Primary Infection. Sci. Rep. 9 (1), 2078. doi:10.1038/s41598-019-39079-4
Roy, M. G., Livraghi-Butrico, A., Fletcher, A. A., McElwee, M. M., Evans, S. E., Boerner, R. M., et al. (2014). Muc5b Is Required for Airway Defence. Nature 505 (7483), 412–416. doi:10.1038/nature12807
Sánchez-Ovando, S., Baines, K. J., Barker, D., Wark, P. A., and Simpson, J. L. (2020). Six Gene and TH2 Signature Expression in Endobronchial Biopsies of Participants with Asthma. Immun. Inflamm. Dis. 8 (1), 40–49. doi:10.1002/iid3.282
Sangiuolo, F., Puxeddu, E., Pezzuto, G., Cavalli, F., Longo, G., Comandini, A., et al. (2015). HFE Gene Variants and Iron-Induced Oxygen Radical Generation in Idiopathic Pulmonary Fibrosis. Eur. Respir. J. 45 (2), 483–490. doi:10.1183/09031936.00104814
Voraphani, N., Gladwin, M. T., Contreras, A. U., Kaminski, N., Tedrow, J. R., Milosevic, J., et al. (2014). An Airway Epithelial iNOS-DUOX2-Thyroid Peroxidase Metabolome Drives Th1/Th2 Nitrative Stress in Human Severe Asthma. Mucosal Immunol. 7 (5), 1175–1185. doi:10.1038/mi.2014.6
Whitsett, J. A. (2018). Airway Epithelial Differentiation and Mucociliary Clearance. Ann. Am. Thorac. Soc. 15 (Suppl. 3), S143–S148. doi:10.1513/AnnalsATS.201802-128AW
Wilkerson, M. D., and Hayes, D. N. (2010). ConsensusClusterPlus: a Class Discovery Tool with Confidence Assessments and Item Tracking. Bioinformatics 26 (12), 1572–1573. doi:10.1093/bioinformatics/btq170
Wilson, D. H., Adams, R. J., Ruffin, R. E., Tucker, G., Taylor, A. W., and Appleton, S. (2006). Trends in Asthma Prevalence and Population Changes in South Australia, 1990-2003. Med. J. Aust. 184 (5), 226–229. doi:10.5694/j.1326-5377.2006.tb00207.x
Woodruff, P. G., Boushey, H. A., Dolganov, G. M., Barker, C. S., Yang, Y. H., Donnelly, S., et al. (2007). Genome-wide Profiling Identifies Epithelial Cell Genes Associated with Asthma and with Treatment Response to Corticosteroids. Proc. Natl. Acad. Sci. 104 (40), 15858–15863. doi:10.1073/pnas.0707413104
Yu, G., Wang, L.-G., Han, Y., and He, Q.-Y. (2012). clusterProfiler: an R Package for Comparing Biological Themes Among Gene Clusters. OMICS: A J. Integr. Biol. 16 (5), 284–287. doi:10.1089/omi.2011.0118
Keywords: Phagocytosis-Th2, normal-like, neutrophils, mucin-Th2, Interferon-Th1
Citation: Li B, Sun W-X, Zhang W-Y, Zheng Y, Qiao L, Hu Y-M, Li W-Q, Liu D, Leng B, Liu J-R, Jiang X-F and Zhang Y (2021) The Transcriptome Characteristics of Severe Asthma From the Prospect of Co-Expressed Gene Modules. Front. Genet. 12:765400. doi: 10.3389/fgene.2021.765400
Received: 27 August 2021; Accepted: 29 September 2021;
Published: 25 October 2021.
Edited by:
Lei Deng, Central South University, ChinaReviewed by:
Chuan-Le Xiao, Sun Yat-sen University, ChinaCopyright © 2021 Li, Sun, Zhang, Zheng, Qiao, Hu, Li, Liu, Leng, Liu, Jiang and Zhang. This is an open-access article distributed under the terms of the Creative Commons Attribution License (CC BY). The use, distribution or reproduction in other forums is permitted, provided the original author(s) and the copyright owner(s) are credited and that the original publication in this journal is cited, in accordance with accepted academic practice. No use, distribution or reproduction is permitted which does not comply with these terms.
*Correspondence: Xiao-Feng Jiang, amlhbmd4aWFvZmVuZ0BocmJtdS5lZHUuY24=; Yan Zhang, emhhbmd0eW9AaGl0LmVkdS5jbg==
†These authors share Co-first authorship
Disclaimer: All claims expressed in this article are solely those of the authors and do not necessarily represent those of their affiliated organizations, or those of the publisher, the editors and the reviewers. Any product that may be evaluated in this article or claim that may be made by its manufacturer is not guaranteed or endorsed by the publisher.
Research integrity at Frontiers

Learn more about the work of our research integrity team to safeguard the quality of each article we publish.