- 1College of Computer Science and Technology, Hengyang Normal University, Hengyang, China
- 2Hunan Provincial Key Laboratory of Intelligent Information Processing and Application, Hengyang, China
- 3College of Computer, Xiangtan University, Xiangtan, China
- 4College of Computer Engineering and Applied Mathematics, Changsha University, Changsha, China
- 5The Social Sciences and Management University of Bamako, Bamako, Mali
Considering that traditional biological experiments are expensive and time consuming, it is important to develop effective computational models to infer potential essential proteins. In this manuscript, a novel collaborative filtering model-based method called CFMM was proposed, in which, an updated protein–domain interaction (PDI) network was constructed first by applying collaborative filtering algorithm on the original PDI network, and then, through integrating topological features of PDI networks with biological features of proteins, a calculative method was designed to infer potential essential proteins based on an improved PageRank algorithm. The novelties of CFMM lie in construction of an updated PDI network, application of the commodity-customer-based collaborative filtering algorithm, and introduction of the calculation method based on an improved PageRank algorithm, which ensured that CFMM can be applied to predict essential proteins without relying entirely on known protein–domain associations. Simulation results showed that CFMM can achieve reliable prediction accuracies of 92.16, 83.14, 71.37, 63.87, 55.84, and 52.43% in the top 1, 5, 10, 15, 20, and 25% predicted candidate key proteins based on the DIP database, which are remarkably higher than 14 competitive state-of-the-art predictive models as a whole, and in addition, CFMM can achieve satisfactory predictive performances based on different databases with various evaluation measurements, which further indicated that CFMM may be a useful tool for the identification of essential proteins in the future.
Introduction
Researches show that essential proteins are not only important for survival of organisms but also play critical roles in the development of life processes. Hence, it is of practical significance to identify potential essential proteins (Meng et al., 2021). With the development of biotechnologies, some essential proteins have been identified successively by traditional biological experiments such as single gene knockouts (Giaever et al., 2002), RNA interference (Cullen and Arndt, 2005), and so on. However, since these traditional biological experiments are quite time consuming and expensive, it has become a hot topic to predict essential proteins by developing computational models (Wang et al., 2013). Up to now, a large number of computational models have been developed to detect essential proteins based on protein–protein interaction (PPI) networks, which can be roughly classified into two major categories. Among them, the first category of models focuses on adopting only topological features of PPI networks to predict essential proteins. For instance, based on the rule of centrality–lethality proposed (Jeong et al., 2001), a series of models, such as DC (Degree Centrality) (Hahn and Kern, 2005), SC (Subgraph Centrality) (Estrada and Rodríguez-Velázquez, 2005), BC (Betweenness Centrality) (Joy et al., 2005), EC (Eigenvector Centrality) (Bonacich, 1987), IC (Information Centrality) (Stephenson and Zelen, 1989), CC (Closeness Centrality) (Wuchty and Stadler, 2003), and NC (Neighbor Centrality) (J. Wang et al., 2012), have been designed in succession for inferring essential proteins based on topological features of PPI networks. Except for these models, Li et al., 2011) proposed a novel model called LAC to predict potential essential proteins based on neighborhoods of protein nodes in PPI networks. B. Xu et al. (2019) developed a model to detect essential proteins by applying random walks on PPI networks. Wang et al. (2011) presented a model called SoECC based on edge clustering coefficients to infer essential proteins. Qin et al. (2016) designed a method called LBCC based on characteristics of PPI networks to predict essential proteins. However, due to the incompleteness of PPI networks, all these first category of models cannot achieve satisfactory prediction accuracies of potential essential proteins.
In order to overcome the incompleteness of PPI networks, in recent years, another category of models have been proposed by integrating topological features of PPI networks and some biological information of proteins to infer essential proteins. For example, Chen et al. (2017) developed a computational model to infer essential proteins by combining PPI networks with gene ontology and KEGG pathway. Zhang X. et al. (2018) presented a prediction model by combing gene expression data with PPI networks to predict essential proteins. W. Peng et al. (2015a) proposed a prediction model called UDoNC by integrating protein domains with PPI networks to infer essential proteins. Jiang et al. (2015) developed a method called IEW to detect key essentials by combining domain interactions and topological features of PPI networks. Zhao et al. (2019) put forward a prediction model called RWHN to infer key proteins by integrating PPI networks with protein domains and some other biological information. Lei et al. (2018) put forward a prediction model named RSG by integrating subcellular localization and GO data of proteins with PPI networks to infer key proteins. Y. Fan et al. (2016) proposed a novel prediction model by adopting Pearson correlation coefficients and subcellular localization to update the PPI network Qin et al. (2017) put forward a method for recognizing essential proteins based on the topological information of PPI networks and orthologous information of proteins. Peng et al. (2012) proposed an advanced iterative algorithm named ION for identifying key proteins based on the topological information of PPI networks and homologous information of proteins. Li et al. (2012) put forward a novel prediction method called Pec through integrating the PPI network with the gene expression of proteins to improve the accuracy of the prediction model. Zhang et al. (2013) presented a novel calculation model named CoEWC by combining PPI networks with the gene expression profiles of proteins to recognize potential key proteins. Liu et al. (2020) proposed a novel prediction model named DEP-MSB by integrating biological features of proteins and topological features of PPI networks. Zhao et al. (2014) put forward an advanced iterative algorithm named POEM for detecting key proteins through combining gene expression data of proteins and topological properties of PPI networks to infer key proteins. Fang et al. (2018) proposed a novel feature selection model named ESFPA by adopting improved swarm intelligence to identify key proteins. Liu et al. (2018) developed an advanced model named EPPSO to recognize key proteins through utilizing improved particle swarm optimization. Zhang W. et al. (2018) presented a computational model called TEGS to recognize key proteins by combining biological information of proteins and topological features of PPI networks. S. Li et al. (2020) developed a novel prediction model called CVIM by combining PPI networks and orthologous information of proteins for inferring essential proteins. Z. Chen et al. (2020) presented a novel strategy named NPRI by combining various biological data of proteins and the topological features of PPI networks to infer key proteins. Although the second category of methods can greatly improve the predictive accuracy of potential essential proteins, it remains to be a challenging work to scientifically integrate topological features of PPI networks and biological features of proteins to effectively improve the accuracy of essential protein prediction.
Inspired by the above methods, in this paper, a novel Collaborative Filtering Model-based Method (CFMM) was proposed to predict potential essential proteins, in which, an original protein–domain interaction (PDI) network was constructed first, and then, considering that the number of known interactions between domains and proteins was quite limited, an updated PDI network was built by applying the collaborative filtering algorithm on the original PDI network. Next, based on the updated PDI network, some key topological features and biological features of proteins were extracted, which would be further integrated together to infer potential essential proteins based on an improved PageRank algorithm. Finally, in order to estimate the performance of CFMM, it was compared with 14 competitive prediction models such as DC (Hahn and Kern, 2005), SC (Estrada and Rodríguez-Velázquez, 2005), BC (Joy et al., 2005), EC (Bonacich, 1987), IC (Stephenson and Zelen, 1989), CC (Wuchty and Stadler, 2003), NC (J. Wang et al., 2012), ION (Peng et al., 2012), Pec (Li et al., 2012), CoEWC (Zhang et al., 2013), POEM ((Zhao et al., 2014), TEGS (Zhang W. et al., 2018), CVIM (S. Li et al., 2020), and NPRI (Z. Chen et al., 2020) based on three kinds of well-known public databases. And as a result, CFMM can achieve better prediction accuracies than all these competing methods.
Materials
In this section, in order to construct the original PPI network, we first downloaded known PPI data from the DIP database (Xenarios et al., 2002), the Krogan database (Krogan et al., 2006) and the Gavin database (Gavin et al., 2006) separately. After removing self-interactions and repeated interactions, we finally obtained 1,167 essential proteins, 3,926 nonessential proteins, and 24,743 known interactions between 5,093 proteins from the DIP database, 14,317 known interactions between 3,672 proteins from the Krogan database, and 7,669 known interactions between 1855 proteins from the Gavin database, respectively. Moreover, we downloaded the dataset of 1,107 different domains from the Pfam database (Bateman et al., 2004). The subcellular localization data from the COMPARTMENTS databases (X. Peng et al., 2015b), (Binder et al., 2014), which consists of 4,865 proteins involved in 11 kinds of subcellular localizations, including the cytoskeleton, mitochondrion, nucleus, peroxisome, plasma, extracellular, endosome, vacuole, endoplasmic, cytosol, and Golgi. Additionally, The gene expression data were provided by Tu et al. (2005), which include 6,777 gene expressions products and 36 samples. The dataset of orthologous information of proteins are from the InParanoid database (Östlund et al., 2010), which includes a collection of pairwise comparisons between 100 whole genomes. Finally, in order to verify the accuracy of CFMM, we further downloaded a set of 1,293 essential genes from four diverse databases such as MIPS (Mewes et al., 2004), DEG (Zhang and Lin, 2009), SGD (Cherry et al., 1998), and SGDP (Saccharomyces Genome Deletion Project, 2012) separately. The detailed information of datasets downloaded from the DIP, Krogan, and Gavin databases are shown in the following Table 1.
3 Method
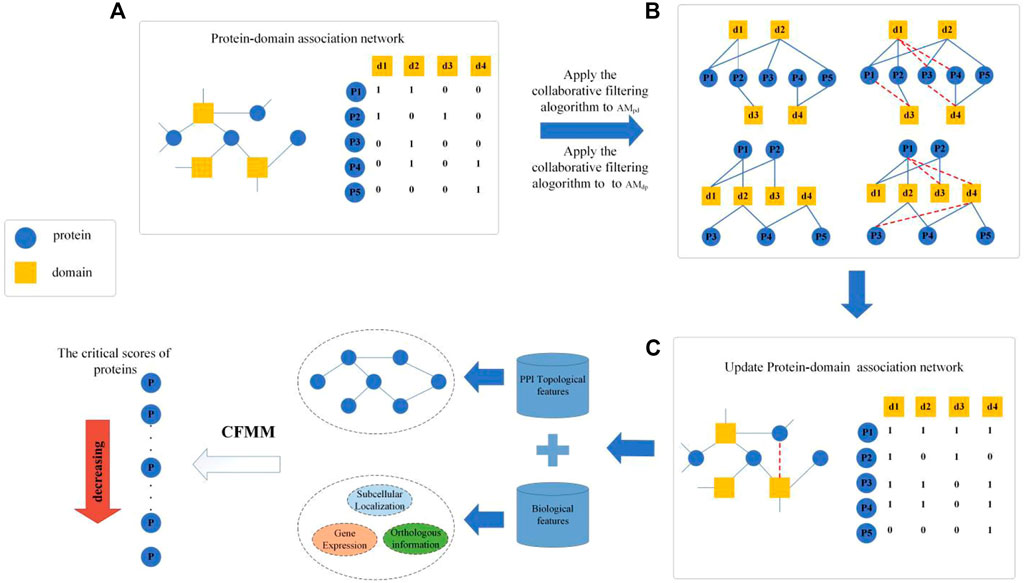
As illustrated in Figure 1, CFMM consists of the following three major steps:
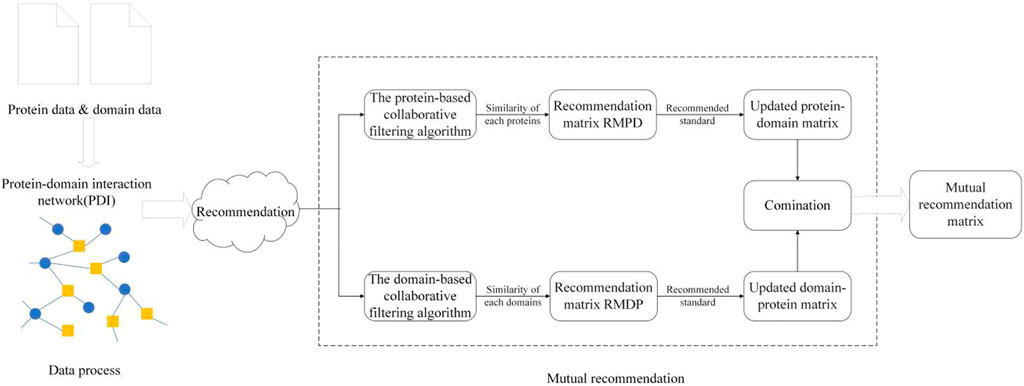
Step 1: First, an original PDI network will be constructed based on known protein–domain interactions downloaded from given public databases, and then, a recommendation matrix will be obtained by applying the collaborative filtering algorithm on the original PDI network.
Step 2: Next, based on known PPI data and biological information of proteins downloaded from public databases, key topological features and biological features of proteins will be extracted separately, and then, an improved entropy weight method will be applied to effectively integrate all these features.
Step 3: Finally, based on a newly designed distribution rate matrix, an iterative algorithm will be proposed to infer potential essential proteins based on an improved PageRank algorithm.
Construction of Protein–Domain Interaction
Based on known protein–domain interactions downloaded above, we can first construct an original network
Step 1: Applying the protein-based collaborative filtering algorithm on PDI as follows:
First, based on
Here,
Based on matrices
Next, for any given protein node
Here,
Step 2: Applying the domain-based collaborative filtering algorithm
Similarly, we can also obtain an original adjacency matrix
where
We can as well define the recommended standard and recommendation matrix as follows:
Here,
Step 3: Mutual recommendation between proteins and domains
Based on the updated matrix
For instance, according to Figure 1 and the given matrix
To be specific, as illustrated in Figure 1, if tanking the domain node
Construction of the Weighted Protein–Protein Interaction Network
For any two given protein
where
Here,
Calculate the Score of Multiple Features of Protein
Previous research has indicated that with similar functions, co-expressed and complex topologies are more likely to be essential proteins. Inspired by them, in this paper, we combine biological and topological features to detect potential proteins by subcellular localizations, gene expression data, and orthologous information and PPI networks.
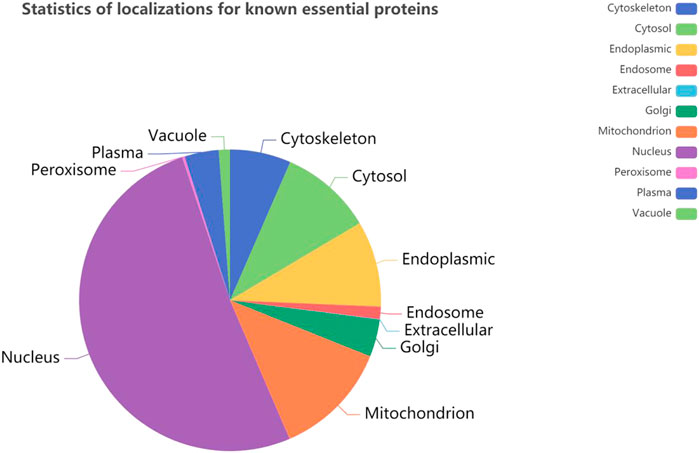
It is obvious that the location information of a protein in a cell is an important characteristic of essential proteins. First, we analyze the 11 kinds of subcellular location relationship between the known essential proteins, and the Figure 3 statistical distribution of each subcellular location is shown in Figure 4. We can find that essential proteins are not randomly distributed in different subcellular locations, and essential proteins appear more often in the nucleus and mitochondrion, which means that proteins in the nucleus and mitochondrion are more possible to be essential proteins. What is more, from Figure 4, there are more essential proteins in the nucleus and mitochondrion and a few essential proteins in the peroxisome and extracellular, which provides us with convenience.

FIGURE 4. The number of proteins in each subcellular locations based on the DIP and Krogan protein databases.
In order to distinguish the importance of different subcellular locations, let
Let
Similar to describing subcellular scores, for any given protein
We use the Pearson correlation coefficient (Priness et al., 2007) as a similarity measure of gene expression profiles to calculate the expression intensity of two genes.
Here
where
It is a fact that essential proteins are more likely products of complex functions (Dezso et al., 2003). In addition, it is obvious that triangles have stable characteristics. Inspired by this, we further utilize the major triangle topological feature calculated by the original PPI network for obtaining each protein topological feature score. Therefore, for a given protein
Based on the above formulas for any given protein
In order to effectively solve the problem of multifeature integration, we apply an improved entropy weight method (Dastbaz et al., 2018) to automatically generate the best parameters to integrate biological features. Based on the protein characteristics we have normalized, let
Next, based on our normalized biological features, we can obtain the entropy value of each feature separately as follows:
Therefore, for the
Based on the above formula, for a given protein
Finally, according to the above Eq. 18, for any given protein
Here,
Construction of the Prediction Model Collaborative Filtering Model-Based Method
According to
Based on the above distribution rate matrix DRPM, let a possibility vector
Here the parameter
Based on the above descriptions, our prediction method CFMM can be concisely described as follows.
Performance Evaluation
Comparison Between Collaborative Filtering Model-Based Method and 14 Representative Methods
In order to further evaluate the performance of CFMM in this section, two different datasets, the DIP database and the Krogan database, are adopted to compare CFMM with 14 competitive detection models, which include DC (Hahn and Kern, 2005), SC (Estrada and Rodríguez-Velázquez, 2005), BC (Joy et al., 2005), EC (Bonacich, 1987), IC (Stephenson and Zelen, 1989), CC (Wuchty and Stadler, 2003), NC (J. Wang et al., 2012), ION (Peng et al., 2012), Pec (Li et al., 2012), CoEWC (Zhang et al., 2013), POEM ((Zhao et al., 2014), TEGS (Zhang W. et al., 2018), CVIM (S. Li et al., 2020), and NPRI (Z. Chen et al., 2020). For the purpose of observing the accuracy of the experiment more intuitively, we chose to use a bar graph to compare the 1, 5, 10, 15, 20, and top 25% of each method. Figure 5 shows that the comparison of the identifying results of different algorithms on the DIP and Krogan database separately. From Figure 5A, the newly put forward CFMM method detected a larger number of essential proteins in the top 1–25% compared with 14 other competitive methods. It is obvious that CFMM can reach the accuracy of 92.16, 83.14, 71.37, 63.87, 55.84, and 52.43% in the top 1, 5, 10, 15, 20, and 25% predicted candidate key proteins based on the DIP database. Among the top 25% proteins predicted by the CFMM method, there are 668 proteins correctly detected, which indicates that the CFMM method has superior advantages over other methods. From Figure 5B, we can see that CFMM can reach the accuracy of 94.59, 75.54, 70.03, 65.34, 60.08, and 54.68% in the top 1, 5, 10, 15, 20, and 25%, which are superior to all 14 advanced methods, except that in the top 10% CFMM-predicted 257 proteins, they are a little lower than NPRI. Therefore, we can make a conclusion that CFMM always obtains the better prediction accuracy from the top 1% to the top 25%.
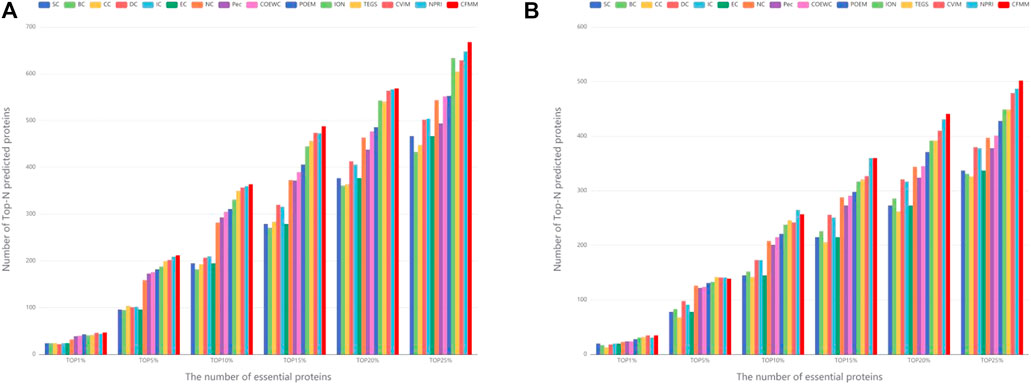
FIGURE 5. (A) Performances achieved by CFMM and other candidate methods under the DIP database. (B) Performances achieved by CFMM and other candidate methods under the Krogan database.
Validated by Jackknife Methodology
Due to the jackknife methodology (Holman et al., 2009) that can evaluate the advantages and disadvantages of the prediction model, in this section, we will apply the jackknife method to assess the predictive effect of our proposed mode CFMM. Figures 6, 7 show the experimental comparisons between CFMM and 14 advanced competitive methods based on the first 1,000 candidate proteins. By observing Figure 6A, it is obvious that CFMM can achieve better performance than the seven network topology-based methods including DC, SC, BC, EC, IC, CC, and NC. What is more, Figure 6B shows that the performance of CFMM is better than the other seven methods that are based on the combination of biological information of proteins and PPI networks including Pec, CoEWC, POEM, ION, TEGS, CVIM, and NPRI. From Figure 7A, we can easily conclude that the CFMM is advanced than these centrality-based methods including DC, IC, EC, BC, CC, SC, and NC. Although the performance curves of CFFM and NPRI overlap partially, as the number of candidate proteins increases to 450, the predictive performance of CFMM will be significantly higher than that of NPRI. Therefore, based on the above description, we can make a conclusion that the performance of CFMM is not only superior to the first category of methods, such as DC, SC, BC, EC, IC, CC, and NC, but also better than these multiple biological data methods including Pec, CoEWC, POEM, ION, TEGS, CVIM, and NPRI.
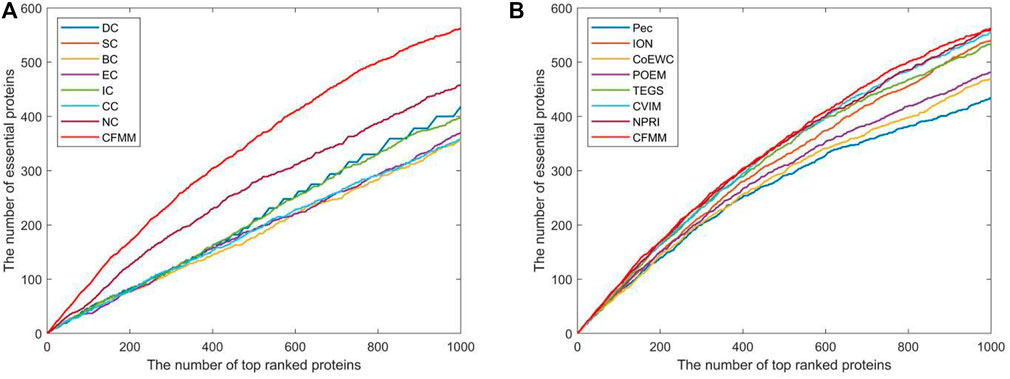
FIGURE 6. Comparison of jackknife curves of CFMM and 14 other methods under the DIP database. (A) Comparison between CFMM and DC, IC, EC, SC, BC, CC, and NC. (B) Comparison between CFMM and Pec, CoEWC, POEM, ION, TEGS, CVIM, and NPRI.

FIGURE 7. Comparison of jackknife curves of CFMM and 14 other methods under the Krogan database. (A) Comparison between CFMM and DC, IC, EC, SC, BC, CC, and NC. (B) Comparison between CFMM and Pec, CoEWC, POEM, ION, TEGS, CVIM, and NPRI.
Differences Between Collaborative Filtering Model-Based Method and Competitive Methods
In order to further prove the accuracy of the CFMM model, we will analyze the differences between CFMM and other models based on the top 100 predicted proteins under the DIP database and the Krogan database separately, and comparison results are shown in Tables 2, 3, respectively. Here ME denotes one of the 14 competitive methods.

TABLE 2. The connection and difference between CFMM and 14 competing methods based on the top 100 ranked proteins in the DIP database.

TABLE 3. The connection and difference between CFMM and 14 competing methods based on the top 100 ranked proteins in the Krogan database.
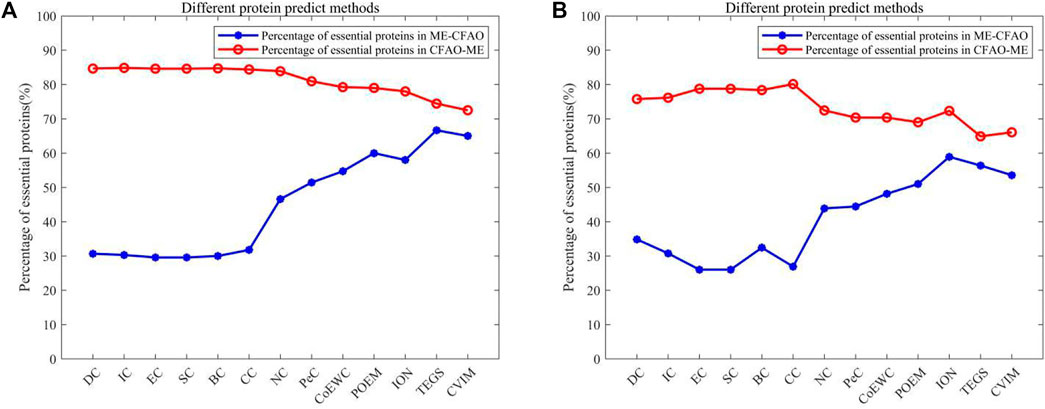
FIGURE 8. The X-axis represents different protein predicted methods. The Y-axis represents the proportion of essential proteins in {ME−CFMM} or {CFMM−ME}.
Validation by Receiver Operating Characteristic Curve
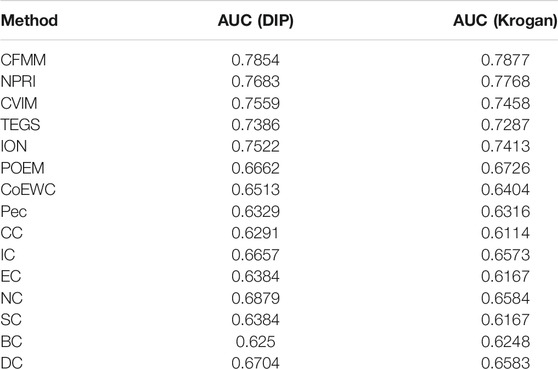
The receiver operating characteristic (ROC) curve and precision recall curve (PR) are used to scientifically prove the performance of the prediction model. The area under the curve (AUC) is used to evaluate the performance of the prediction method. The closer the AUC value is to 1, the better the prediction performance of the method. The curve can be plotted by the ratio of true positive rate (TPR) to false positive rate (FPR) according to different thresholds (Peng et al., 2020). Hence, we will further utilize the ROC curves to compare CFMM with other advanced models. Figures 9, 10 indicate that the ROC curves and PR curves of CFMM and other competitive models are based on the DIP and Krogan databases separately. It is obvious that CFMM has a higher AUC curve than other competitive models. Although we can see that the ROC curve of CFMM and the NPRI ROC curves overlap slightly, the AUC value of CFMM is higher than NPRI. Finally, in order to prove the applicability of CFMM, we will further test it in the Gavin database and compare with other methods. The experimental results are shown in Tables 4, 5.
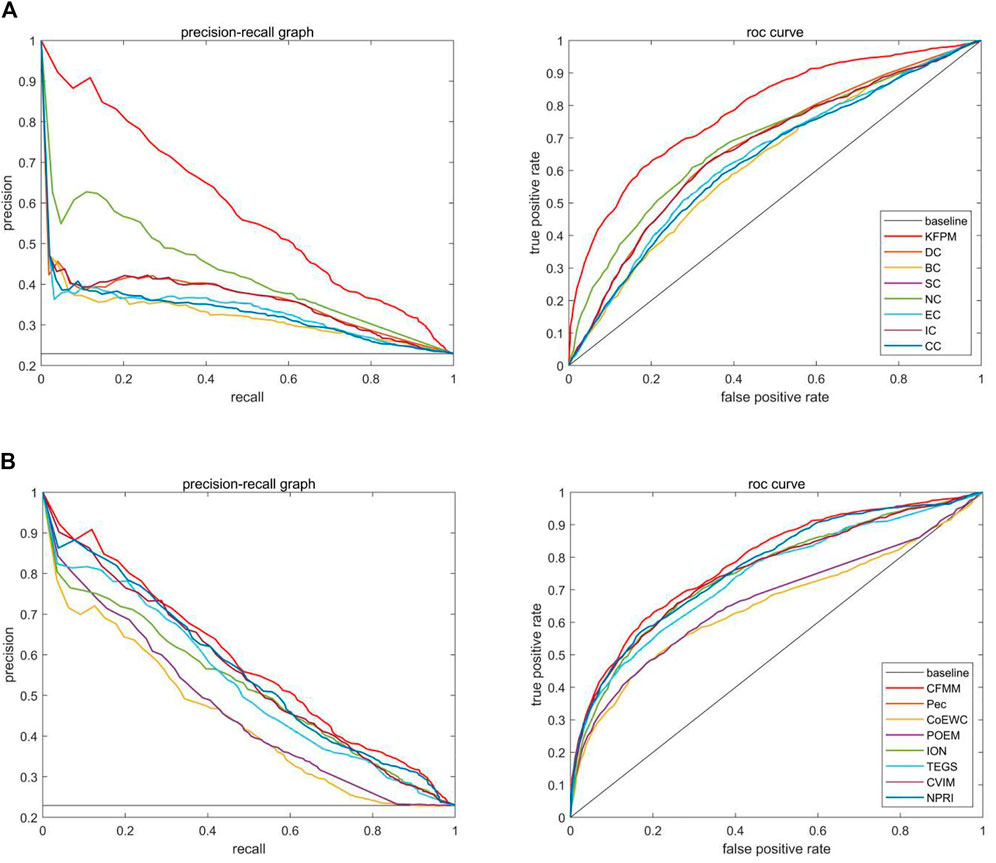
FIGURE 9. The precision recall (PR) curves and receiver operating characteristic (ROC) curves between CFMM and other advanced methods based on the DIP database. (A) The PR curves and the ROC curves of DC, BC, SC, NC, EC, IC, and CC. (B) The PR curves and the ROC curves of Pec, CoEWC, POEM, ION, TEGS, CVIM, and NPRI.
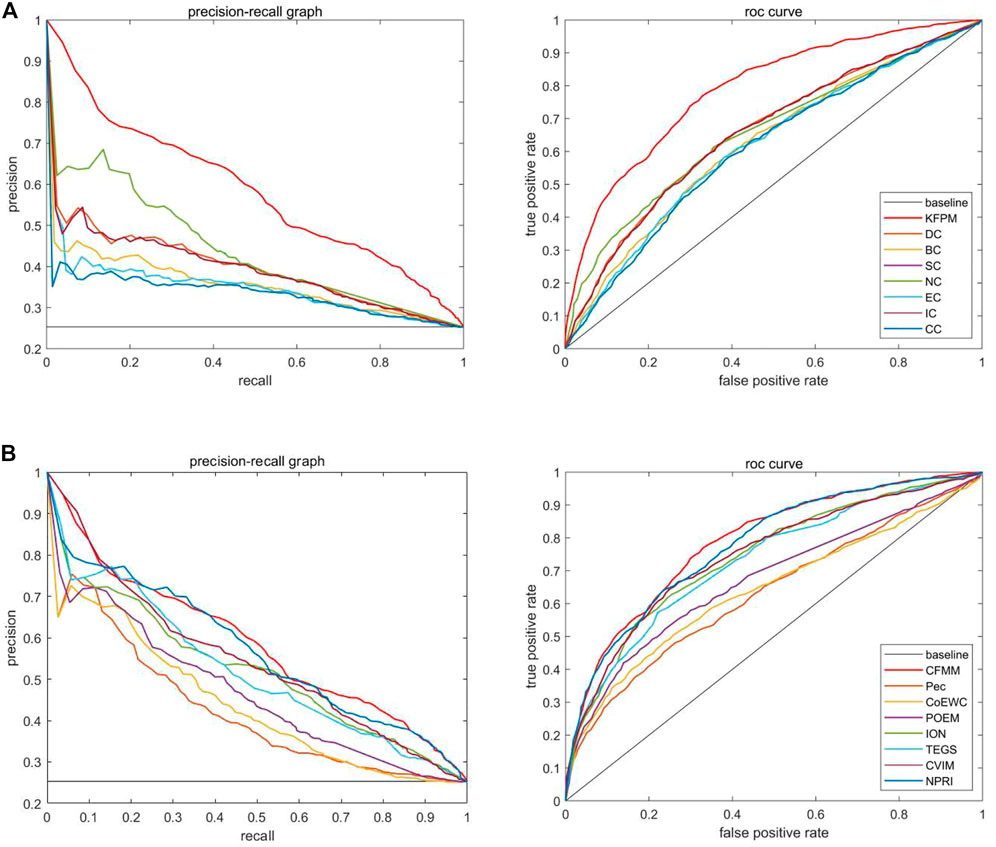
FIGURE 10. The PR curves and ROC curves between CFMM and other advanced methods based on the Krogan database. (A) The PR curves and the ROC curves of DC, BC, SC, NC, EC, IC, and CC. (B) The PR curves and the ROC curves of Pec, CoEWC, POEM, ION, TEGS, CVIM, and NPRI.

TABLE 5. The number of key proteins recognized by CFMM and other methods based on the Gavin database.
The Analysis of Parameter
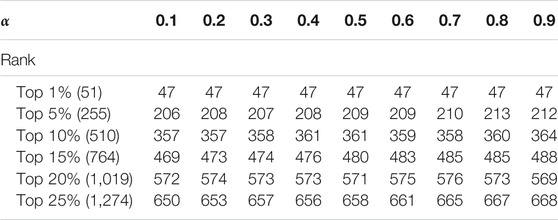
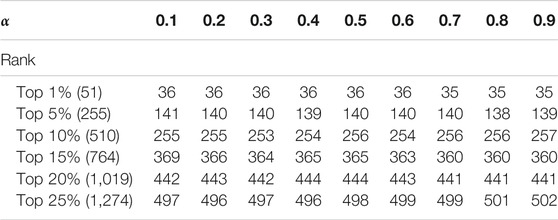
In this section, we discuss the effect of the two self-defined parameters α and
Discussion
Accumulating evidence have shown that prediction of essential proteins is important for the development of an organism in biological process, complex disease diagnoses, and drug design. However, the requirement of identifying key protein prediction accuracy is not satisfied only through biological experiments and relying on the topological characteristics of the PPI network. In this manuscript, we constructed an original protein–domain network by combining protein and domain associations first. Then we formulated the prediction of potential essential proteins as a problem of the recommendation system and obtained an updated recommendation network through applying a novel mutual recommendation between protein and domain to the original association network. Next, after we integrate the biological features, we combine with the major topological features to obtain the initial protein score. Finally, we design a novel distribution rate matrix and apply an iterative algorithm based on the improved PageRank algorithm to calculate protein scores iteratively. In addition, we apply the CFMM method on the DIP database, Krogan database, and Gavin database to testify the performance, respectively. Experiments show that CFMM can achieve better performance than other advanced methods. In future work, we will use multi-information fusion method to integrate various information related to proteins and machine learning methods to further improve the prediction performance (Peng et al., 2017; Zhou et al., 2019).
Data Availability Statement
The datasets presented in this study can be found in online repositories. The names of the repository/repositories and accession number(s) can be found in the article/Supplementary Material.
Author Contributions
XZ and XH conceived the study. XZ, XH, LK, and ZC improved the study based on the original model. XZ and XH implemented the algorithms corresponding to the study. ZC and LK supervised the study. XZ and XH wrote the manuscript. All authors including CL reviewed and improved the manuscript.
Funding
This research is partly sponsored by the Research Foundation of Education Bureau of Hunan Province (No. 20B080), the Natural Science Foundation of Hunan Province (No. 2019JJ70010), the Hunan Provincial Natural Science Foundation of China (2020JJ4152), and the Science and Technology Plan Project of Hunan Province (2016TP1020). The Hunan Province Science and Technology Project Funds (2018TP1036), the National Scientific Research Foundation of Hunan Province Education Commission (18B367).
Conflict of Interest
The authors declare that the research was conducted in the absence of any commercial or financial relationships that could be construed as a potential conflict of interest.
Publisher’s Note
All claims expressed in this article are solely those of the authors and do not necessarily represent those of their affiliated organizations, or those of the publisher, the editors and the reviewers. Any product that may be evaluated in this article, or claim that may be made by its manufacturer, is not guaranteed or endorsed by the publisher.
Acknowledgments
The authors sincerely thank all the teachers and students who participated in this study for their guidance and help.
Supplementary Material
The Supplementary Material for this article can be found online at: https://www.frontiersin.org/articles/10.3389/fgene.2021.763153/full#supplementary-material
References
Bateman, A., Coin, L., Durbin, R., Finn, R. D., Hollich, V., Griffiths‐Jones, S., et al. (2004). The Pfam Protein Families Database. Nucleic Acids Res. 32, 138D–141D. doi:10.1093/nar/gkh121
Binder, J. X., Pletscher-Frankild, S., Tsafou, K., Stolte, C., O'Donoghue, S. I., Schneider, R., et al. (2014). COMPARTMENTS: Unification and Visualization of Protein Subcellular Localization Evidence. Database 2014, bau012. doi:10.1093/database/bau012
Bonacich, P. (1987). Power and Centrality: A Family of Measures. Am. J. Sociol. 92, 1170–1182. doi:10.1086/228631
Chen, L., Zhang, Y.-H., Wang, S., Zhang, Y., Huang, T., and Cai, Y.-D. (2017). Prediction and Analysis of Essential Genes Using the Enrichments of Gene Ontology and KEGG Pathways. PLoS One 12, e0184129. doi:10.1371/journal.pone.0184129
Chen, Z., Meng, Z., Liu, C., Wang, X., Kuang, L., Pei, T., et al. (2020). A Novel Model for Predicting Essential Proteins Based on Heterogeneous Protein-Domain Network. IEEE Access 8, 8946–8958. doi:10.1109/ACCESS.2020.2964571
Cherry, J., Adler, C., Ball, C., Chervitz, S. A., Dwight, S. S., Hester, E. T., et al. (1998). SGD: Saccharomyces Genome Database. Nucleic Acids Res. 26, 73–79. doi:10.1093/nar/26.1.73
Cullen, L. M., and Arndt, G. M. (2005). Genome‐wide Screening for Gene Function Using RNAi in Mammalian Cells. Immunol. Cell Biol 83, 217–223. doi:10.1111/j.1440-1711.2005.01332.x
Dastbaz, M., Arabnia, H., and Akhgar, B. (2018). Technology for Smart Futures (Cham: Springer International Publishing). doi:10.1007/978-3-319-60137-3
Dezso, Z., Oltvai, Z. N., and Barabási, A.-L. (2003). Bioinformatics Analysis of Experimentally Determined Protein Complexes in the Yeast Saccharomyces cerevisiae. Genome Res. 13, 2450–2454. doi:10.1101/gr.1073603
Estrada, E., and Rodríguez-Velázquez, J. A. (2005). Subgraph Centrality in Complex Networks. Phys. Rev. E 71, 056103. doi:10.1103/PhysRevE.71.056103
Fan, Y., Hu, X., Tang, X., Ping, Q., and Wu, W. (2016). “A Novel Algorithm for Identifying Essential Proteins by Integrating Subcellular Localization,” in Proceeding of the 2016 IEEE International Conference on Bioinformatics and Biomedicine (BIBM), Shenzhen, China, 15-18 Dec. 2016 (IEEE), 107–110. doi:10.1109/BIBM.2016.7822501
Fang, M., Lei, X., Cheng, S., Shi, Y., and Wu, F.-X. (2018). Feature Selection via Swarm Intelligence for Determining Protein Essentiality. Molecules 23, 1569. doi:10.3390/molecules23071569
Gavin, A.-C., Aloy, P., Grandi, P., Krause, R., Boesche, M., Marzioch, M., et al. (2006). Proteome Survey Reveals Modularity of the Yeast Cell Machinery. Nature 440, 631–636. doi:10.1038/nature04532
Giaever, G., Chu, A. M., Ni, L., Connelly, C., Riles, L., Véronneau, S., et al. (2002). Functional Profiling of the Saccharomyces cerevisiae Genome. Nature 418, 387–391. doi:10.1038/nature00935
Hahn, M. W., and Kern, A. D. (2005). Comparative Genomics of Centrality and Essentiality in Three Eukaryotic Protein-Interaction Networks. Mol. Biol. Evol. 22, 803–806. doi:10.1093/molbev/msi072
Holman, A. G., Davis, P. J., Foster, J. M., Carlow, C. K., and Kumar, S. (2009). Computational Prediction of Essential Genes in an Unculturable Endosymbiotic Bacterium, Wolbachia of Brugia malayi. BMC Microbiol. 9, 243. doi:10.1186/1471-2180-9-243
Jeong, H., Mason, S. P., Barabási, A.-L., and Oltvai, Z. N. (2001). Lethality and Centrality in Protein Networks. Nature 411, 41–42. doi:10.1038/35075138
Jiang, Y., Wang, Y., Pang, W., Chen, L., Sun, H., Liang, Y., et al. (2015). Essential Protein Identification Based on Essential Protein-Protein Interaction Prediction by Integrated Edge Weights. Methods 83, 51–62. doi:10.1016/j.ymeth.2015.04.013
Joy, M. P., Brock, A., Ingber, D. E., and Huang, S. (2005). High-Betweenness Proteins in the Yeast Protein Interaction Network. J. Biomed. Biotechnol. 2005, 96–103. doi:10.1155/JBB.2005.96
Krogan, N. J., Cagney, G., Yu, H., Zhong, G., Guo, X., Ignatchenko, A., et al. (2006). Global Landscape of Protein Complexes in the Yeast Saccharomyces cerevisiae. Nature 440, 637–643. doi:10.1038/nature04670
Lei, X., Zhao, J., Fujita, H., and Zhang, A. (2018). Predicting Essential Proteins Based on RNA-Seq, Subcellular Localization and GO Annotation Datasets. Knowledge-Based Syst. 151, 136–148. doi:10.1016/j.knosys.2018.03.027
Li, M., Wang, J., Chen, X., Wang, H., and Pan, Y. (2011). A Local Average Connectivity-Based Method for Identifying Essential Proteins from the Network Level. Comput. Biol. Chem. 35, 143–150. doi:10.1016/j.compbiolchem.2011.04.002
Li, M., Zhang, H., Wang, J.-x., and Pan, Y. (2012). A New Essential Protein Discovery Method Based on the Integration of Protein-Protein Interaction and Gene Expression Data. BMC Syst. Biol. 6, 15. doi:10.1186/1752-0509-6-15
Li, S., Chen, Z., He, X., Zhang, Z., Pei, T., Tan, Y., et al. (2020). An Iteration Method for Identifying Yeast Essential Proteins from Weighted PPI Network Based on Topological and Functional Features of Proteins. IEEE Access 8, 90792–90804. doi:10.1109/ACCESS.2020.2993860
Liu, W., Ma, L., Chen, L., Chen, B., Jeon, B., and Qiang, J. (2020). A Novel Scheme for Essential Protein Discovery Based on Multi-Source Biological Information. J. Theor. Biol. 504, 110414. doi:10.1016/j.jtbi.2020.110414
Liu, W., Wang, J., Chen, L., and Chen, B. (2018). Prediction of Protein Essentiality by the Improved Particle Swarm Optimization. Soft Comput. 22, 6657–6669. doi:10.1007/s00500-017-2964-1
Meng, Z., Kuang, L., Chen, Z., Zhang, Z., Tan, Y., Li, X., et al. (2021). Method for Essential Protein Prediction Based on a Novel Weighted Protein-Domain Interaction Network. Front. Genet. 12, 645932. doi:10.3389/fgene.2021.645932
Mewes, H. W., Amid, C., Arnold, R., Frishman, D., Güldener, U., Mannhaupt, G., et al. (2004). MIPS: Analysis and Annotation of Proteins from Whole Genomes. Nucleic Acids Res. 32, 41D–44D. doi:10.1093/nar/gkh092
Östlund, G., Schmitt, T., Forslund, K., Köstler, T., Messina, D. N., Roopra, S., et al. (2010). InParanoid 7: New Algorithms and Tools for Eukaryotic Orthology Analysis. Nucleic Acids Res. 38, D196–D203. doi:10.1093/nar/gkp931
Peng, L., Liao, B., Zhu, W., Li, Z., and Li, K. (2017). Predicting Drug-Target Interactions with Multi-Information Fusion. IEEE J. Biomed. Health Inform. 21, 561–572. doi:10.1109/JBHI.2015.2513200
Peng, L., Shen, L., Liao, L., Liu, G., and Zhou, L. (2020). RNMFMDA: A Microbe-Disease Association Identification Method Based on Reliable Negative Sample Selection and Logistic Matrix Factorization with Neighborhood Regularization. Front. Microbiol. 11, 592430. doi:10.3389/fmicb.2020.592430
Peng, W., Jianxin Wang, J., Yingjiao Cheng, Y., Yu Lu, Y., Fangxiang Wu, F., and Yi Pan, Y. (2015a). UDoNC: An Algorithm for Identifying Essential Proteins Based on Protein Domains and Protein-Protein Interaction Networks. Ieee/acm Trans. Comput. Biol. Bioinf. 12, 276–288. doi:10.1109/TCBB.2014.2338317
Peng, W., Wang, J., Wang, W., Liu, Q., Wu, F.-X., and Pan, Y. (2012). Iteration Method for Predicting Essential Proteins Based on Orthology and Protein-Protein Interaction Networks. BMC Syst. Biol. 6, 87. doi:10.1186/1752-0509-6-87
Peng, X., Wang, J., Zhong, J., Junwei Luo, J., and Pan, Y. (2015b). “An Efficient Method to Identify Essential Proteins for Different Species by Integrating Protein Subcellular Localization Information,” in Proceeding of the 2015 IEEE International Conference on Bioinformatics and Biomedicine (BIBM), Washington, DC, USA, 9-12 Nov. 2015 (IEEE), 277–280. doi:10.1109/BIBM.2015.7359693
Priness, I., Maimon, O., and Ben-Gal, I. (2007). Evaluation of Gene-Expression Clustering via Mutual Information Distance Measure. BMC Bioinformatics 8, 111. doi:10.1186/1471-2105-8-111
Qin, C., Sun, Y., and Dong, Y. (2017). A New Computational Strategy for Identifying Essential Proteins Based on Network Topological Properties and Biological Information. PLoS One 12, e0182031. doi:10.1371/journal.pone.0182031
Qin, C., Sun, Y., and Dong, Y. (2016). A New Method for Identifying Essential Proteins Based on Network Topology Properties and Protein Complexes. PLoS One 11, e0161042. doi:10.1371/journal.pone.0161042
Stephenson, K., and Zelen, M. (1989). Rethinking Centrality: Methods and Examples. Social Networks 11, 1–37. doi:10.1016/0378-8733(89)90016-6
Tu, B. P., Kudlicki, A., Rowicka, M., and McKnight, S. L. (2005). Logic of the Yeast Metabolic Cycle: Temporal Compartmentalization of Cellular Processes. Science 310, 1152–1158. doi:10.1126/science.1120499
van Laarhoven, T., Nabuurs, S. B., and Marchiori, E. (2011). Gaussian Interaction Profile Kernels for Predicting Drug-Target Interaction. Bioinformatics 27, 3036–3043. doi:10.1093/bioinformatics/btr500
Wang, H., Li, M., Wang, J., and Pan, Y. (2011). “A New Method for Identifying Essential Proteins Based on Edge Clustering Coefficient,” in Bioinformatics Research and Applications. Editors J. Chen, J. Wang, and A. Zelikovsky (Berlin, Heidelberg: Springer Berlin Heidelberg), 87–98. doi:10.1007/978-3-642-21260-4_12
Wang, J., Min Li, M., Huan Wang, H., and Yi Pan, Y. (2012). Identification of Essential Proteins Based on Edge Clustering Coefficient. Ieee/acm Trans. Comput. Biol. Bioinf. 9, 1070–1080. doi:10.1109/TCBB.2011.147
Wang, J., Peng, W., and Wu, F.-X. (2013). Computational Approaches to Predicting Essential Proteins: A Survey. Proteomices. Clin. Appl. 7, 181–192. doi:10.1002/prca.201200068
Wuchty, S., and Stadler, P. F. (2003). Centers of Complex Networks. J. Theor. Biol. 223, 45–53. doi:10.1016/S0022-5193(03)00071-7
Xenarios, I., Salwínski, L., Duan, X. J., Higney, P., Kim, S.-M., and Eisenberg, D. (2002). DIP, the Database of Interacting Proteins: a Research Tool for Studying Cellular Networks of Protein Interactions. Nucleic Acids Res. 30, 303–305. doi:10.1093/nar/30.1.303
Xu, B., Guan, J., Wang, Y., and Wang, Z. (2019). Essential Protein Detection by Random Walk on Weighted Protein-Protein Interaction Networks. Ieee/acm Trans. Comput. Biol. Bioinf. 16, 377–387. doi:10.1109/TCBB.2017.2701824
Zhang, R., and Lin, Y. (2009). DEG 5.0, a Database of Essential Genes in Both Prokaryotes and Eukaryotes. Nucleic Acids Res. 37, D455–D458. doi:10.1093/nar/gkn858
Zhang, W., Xu, J., Li, Y., and Zou, X. (2018a). Detecting Essential Proteins Based on Network Topology, Gene Expression Data, and Gene Ontology Information. Ieee/acm Trans. Comput. Biol. Bioinf. 15, 109–116. doi:10.1109/tcbb.2016.2615931
Zhang, X., Xiao, W., and Hu, X. (2018b). Predicting Essential Proteins by Integrating Orthology, Gene Expressions, and PPI Networks. PLoS One 13, e0195410. doi:10.1371/journal.pone.0195410
Zhang, X., Xu, J., and Xiao, W.-x. (2013). A New Method for the Discovery of Essential Proteins. PLoS One 8, e58763. doi:10.1371/journal.pone.0058763
Zhao, B., Wang, J., Li, M., Wu, F.-X., and Pan, Y. (2014). Prediction of Essential Proteins Based on Overlapping Essential Modules. IEEE Trans.on Nanobioscience 13, 415–424. doi:10.1109/tnb.2014.2337912
Zhao, B., Zhao, Y., Zhang, X., Zhang, Z., Zhang, F., and Wang, L. (2019). An Iteration Method for Identifying Yeast Essential Proteins from Heterogeneous Network. BMC Bioinformatics 20, 355. doi:10.1186/s12859-019-2930-2
Keywords: essential proteins, collaborative filtering model, PDI network, data integration, prediction model
Citation: Zhu X, He X, Kuang L, Chen Z and Lancine C (2021) A Novel Collaborative Filtering Model-Based Method for Identifying Essential Proteins. Front. Genet. 12:763153. doi: 10.3389/fgene.2021.763153
Received: 23 August 2021; Accepted: 13 September 2021;
Published: 21 October 2021.
Edited by:
Tao Huang, Shanghai Institute of Nutrition and Health (CAS), ChinaReviewed by:
Guohua Huang, Shaoyang University, ChinaLihong Peng, Hunan University of Technology, China
Copyright © 2021 Zhu, He, Kuang, Chen and Lancine. This is an open-access article distributed under the terms of the Creative Commons Attribution License (CC BY). The use, distribution or reproduction in other forums is permitted, provided the original author(s) and the copyright owner(s) are credited and that the original publication in this journal is cited, in accordance with accepted academic practice. No use, distribution or reproduction is permitted which does not comply with these terms.
*Correspondence: Xianyou Zhu, enh5QGh5bnUuZWR1LmNu; Xin He, MTU3NzMyNTM5MDFAMTM5LmNvbQ==
†These authors share first authorship
 Xianyou Zhu1,2*†
 Xin He
 Linai Kuang
