 Chen Liu1
 Dehan Cai
 Yun Huang
- 1Department of Chemotherapy, The First Affiliated Hospital of Fujian Medical University, Fuzhou, China
- 2Department of Electrical Engineering, City University of Hong Kong, Hong Kong, China
- 3Department of Geriatric Medicine, The First Affiliated Hospital of Fujian Medical University, Fuzhou, China
Evidences increasingly indicate the involvement of gene network rewiring in disease development and cell differentiation. With the accumulation of high-throughput gene expression data, it is now possible to infer the changes of gene networks between two different states or cell types via computational approaches. However, the distribution diversity of multi-platform gene expression data and the sparseness and high noise rate of single-cell RNA sequencing (scRNA-seq) data raise new challenges for existing differential network estimation methods. Furthermore, most existing methods are purely rely on gene expression data, and ignore the additional information provided by various existing biological knowledge. In this study, to address these challenges, we propose a general framework, named weighted joint sparse penalized D-trace model (WJSDM), to infer differential gene networks by integrating multi-platform gene expression data and multiple prior biological knowledge. Firstly, a non-paranormal graphical model is employed to tackle gene expression data with missing values. Then we propose a weighted group bridge penalty to integrate multi-platform gene expression data and various existing biological knowledge. Experiment results on synthetic data demonstrate the effectiveness of our method in inferring differential networks. We apply our method to the gene expression data of ovarian cancer and the scRNA-seq data of circulating tumor cells of prostate cancer, and infer the differential network associated with platinum resistance of ovarian cancer and anti-androgen resistance of prostate cancer. By analyzing the estimated differential networks, we find some important biological insights about the mechanisms underlying platinum resistance of ovarian cancer and anti-androgen resistance of prostate cancer.
1 Introduction
Biological systems often involve the complex regulatory relationships between genes, which could change substantially in different states or developmental stages. Inferring the changes of gene regulatory networks between two different states or cell types is important for revealing the regulatory mechanisms relevant to disease development and cell differentiation (Tian et al., 2016; Zhang et al., 2017). With the accumulation of state-specific gene expression data, a great number of computational approaches have been proposed for estimating gene regulatory networks as well as their difference between two distinct states from gene expression data (Danaher et al., 2014; Ha et al., 2015; Lichtblau et al., 2016; Tian et al., 2016; Zhang et al., 2016; Ou-Yang et al., 2017; Uppal et al., 2018).
Due to the ability in capturing the conditional dependencies among genes, Gaussian graphical models have been widely used to infer gene regulatory networks (Danaher et al., 2014; Zhang et al., 2016; Yuan et al., 2017; Ou-Yang et al., 2019). Existing Gaussian graphical model-based differential network estimation methods can be roughly divided into two categories, i.e., indirect estimation models (Danaher et al., 2014; Zhang et al., 2016) and direct estimation models (Tian et al., 2016; Yuan et al., 2017). Indirect estimation models first estimate each state-specific network separately and then infer the differential network by calculating the difference between two state-specific networks (Danaher et al., 2014). Whereas direct estimation models directly estimate the difference between two state-specific networks without the need to estimate individual state-specific networks (Tian et al., 2016). As the number of parameters that needs to be estimated in direct estimation models is half of that in indirect estimation models, direct estimation models usually achieve better performance than indirect estimation models in differential network estimation, especially in the case of small sample size (Yuan et al., 2017).
Although the above models have been successfully used to infer differential networks (Danaher et al., 2014; Tian et al., 2016; Yuan et al., 2017), they are mainly designed for bulk tissue gene expression data collected from a single data platform. Recently, with the development of high-throughput experimental technologies, we are able to collect bulk gene expression data of same samples from multiple data platforms. As the gene expression data collected from different data platforms may provide some shared and specific information about the regulatory relationships between genes, integrating multi-platform gene expression data could help to improve the accuracy of differential network estimation (Zhang et al., 2016, 2017). Moreover, the advance of single-cell RNA sequencing (scRNA-seq) techniques offers a great opportunity for inferring the regulatory relationships between genes at single cell resolution. The accumulation of scRNA-seq data paves the way to infer cell-type-specific gene networks, which could help to explore the heterogeneity between different cell types (Pratapa et al., 2020). However, due to technical limitations of existing scRNA-seq technologies, a truly expressed gene may not be identified in some cells, which leads to excess of false zeros in scRNA-seq data (i.e., dropout events) (Stegle et al., 2015). Existing differential network estimation models usually assume that the observed data are complete, and rarely consider missing value problem. To handle the distribution diversity of multi-platform gene expression data and the sparseness of single-cell RNA sequencing (scRNA-seq) data, Ou-Yang et al. (2021) proposed an indirect differential network estimation model, which can integrate the gene expression data collected from multiple data platforms and tackle the missing value problem. Moreover, their model can take into account the changes in gene expression levels when inferring differential networks.
The above models only use gene expression data to infer differential networks. However, since the number of samples are usually much smaller than the number of genes, and scRNA-seq data are much sparser and noisier than bulk RNA-seq data, it is difficult to infer differential networks accurately only based on gene expression data. Besides gene expression data, existing knowledge of genes and knowledge of the regulatory relationships among genes may also help to improve the accuracy of differential network estimation (Xu et al., 2018). For example, we can collect some literature-curated gene regulatory interactions from public database (Han et al., 2015). As the changes of regulatory relationships between two different states is more likely to occur between genes that are known to have regulatory interactions, considering prior gene regulatory interactions may help to improve the accuracy of differential network estimation. Moreover, researchers have found that genes within same pathways usually interact with each other to carry out their biological functions, and genes belong to different pathways seldom interact with each other (Wu et al., 2019). Thus, taking into account pathway information may also facilitate the inference of differential networks.
In this study, to address the above problems and provide a differential network estimation method that can generally work well on different types of data, we propose a novel method named Weighted Joint Sparse penalized D-trace Model (WJSDM). Our model can directly estimate the differential networks between two different states by integrating multi-platform gene expression data with additional biological knowledge. Similar to (Ou-Yang et al., 2021), based on non-paranormal graphical model and revised Kendall’s tau correlation, our model can tackle non-Gaussian data with missing values, which make it able to deal with multi-platform gene expression and scRNA-seq data. By using D-trace loss function, our model can estimate the differential network directly, which reduce the number of parameters that need to be estimated. To integrate various prior biological knowledge and take into account changes in gene expression levels, we propose a weighted group bridge penalty. Our model can be solved by using an accelerated proximal gradient method. Simulation studies are first conducted to evaluate the performance of our model. According to the experiment results, our model can always achieve better performance than other state-of-the-art differential network estimation models, which demonstrate the effectiveness of our model in integrating prior information and handling gene expression data with missing values. Extensive experiments on two real data sets also demonstrate the advantages of our model in inferring differential networks and revealing the underlying mechanisms of disease developments. The source code of our proposed model is available at https://github.com/Yunhuang85/WJSDM.
2 Methods
In this section, we will first review the non-paranormal distribution and D-trace loss. Then we will introduce our weighted joint sparse penalized D-trace model.
2.1 Non-paranormal Distribution
Let X = (X1, X2, … , Xp) denote a p-dimensional random vector which follows a multivariate normal distribution X ∼ N(0, Σ), where
2.2 D-Trace Loss
Given the gene expression data
where
2.3 Notations and Problem Statement
Assuming that there are two different groups of samples. As the gene expression data of same samples can be collected from multiple data platforms, suppose we can observe the expression levels of p common genes for these two groups of samples from K different data platforms, and the cth group contains nc samples, c = 1, 2. Let
2.4 Weighted Joint Sparse Penalized D-Trace Model
The above D-trace loss is designed to infer the differential network between two different groups of samples from a single data platform, and cannot utilize the common information provided by gene expression data collected from multiple data platforms. Thus, in this study, we extend D-trace loss and develop a weighted joint sparse D-trace model (WJSDM), which can draw support from gene expression data collected from multiple data platforms to estimate the differential network between two different states.
According to the above D-trace loss, the loss function LKD of K data platforms can be given by:
where
As Kendall’s tau correlation are invariant under strictly monotone marginal transformations (Liu et al., 2012),
In this study, each sample non-paranormal covariance matrix
Note that the differential networks inferred from gene expression data collected from different data platforms may share certain network structures, and the differential networks between two different states may be sparse. Furthermore, differentially expressed genes usually tend to change their regulatory relationships with other genes. Thus, to jointly estimate multiple differential networks and consider the changes in expression levels of individual genes when inferring differential networks, similar to (Ou-Yang et al., 2021), we introduce the following group bridge penalty function:
where
Besides gene expression data, there are usually some prior biological knowledge that can help to improve the accuracy of differential network estimation, such as pathway information and prior gene interactions. To incorporate these prior information when inferring differential networks, we extend the above group bridge penalty function to the following weighted group bridge penalty function:
Here, W = [Wij] is the weight matrix defined by prior knowledge. In this study, the prior information we used includes pathway information and gene interactions that have been verified from other biological studies. Let G ∈ {0,1}p×p and F ∈ {0,1}p×p denote the prior gene interaction and co-pathway indication matrices, respectively, where Gij = 1 if the ith and jth genes are known to have regulatory relationship and Gij = 0 otherwise, Fij = 1 if the ith and jth genes belong to at least one common pathway and Fij = 0 otherwise. To assign different weights to different pairs of genes, we define Wij as follows:
where wg and wf are two predefined weight parameters. In reality, the differential edges are more likely to take place between gene pairs that are known to have interactions, and the differential edges are less likely to occur between genes that belong to different pathways. Thus, to assign small penalties to gene pairs that are known to have interactions and large penalties to gene pairs that belong to different pathways, the value of wg should be less than 1 and the value of wf should be larger than 1. Following previous studies (Xu et al., 2018), in this study, we fix wg = 0.3 and wf = 10.
By combining (2) and (6), the objective function of our Weighted Joint Sparse penalized D-trace Model (WJSDM) is given by:
where λ is a non-negative tuning parameter to control the sparsity levels of the estimated differential networks. We use an iterative approach based on local linear approximation (Zou and Li, 2008) and the accelerated proximal gradient method (Parikh and Boyd, 2014; Xu et al., 2018) to solve problem (Eq. 8).
According to (Yuan et al., 2017), the gradient of the D-trace loss function with respect to Δ takes the following form:
Following the proximal gradient method (Parikh and Boyd, 2014), LKD can be approximated by the following function:
where
where
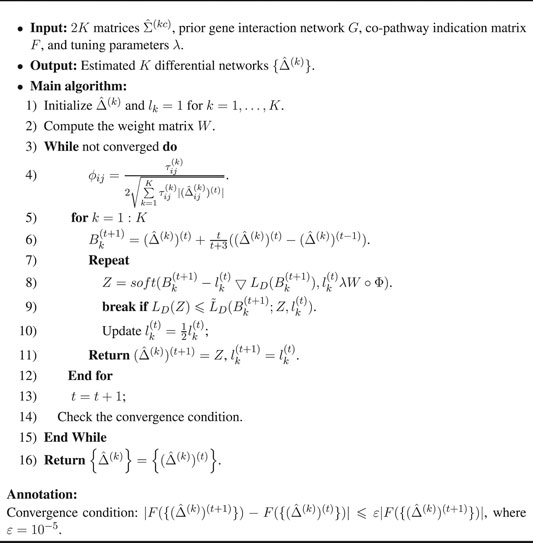
Algorithm 1 Complete Algorithm for WJSDM (8)
According to local linear approximation (Parikh and Boyd, 2014), Eq. 6 can be approximated as:
where
The solution of our WJSDM is summarized in Algorithm 1. The computational complexity of each iteration in Algorithm 1 is O(Kp3 + Kp2), where K is the number of data platforms and p is the number of genes.
2.5 Parameter Selection
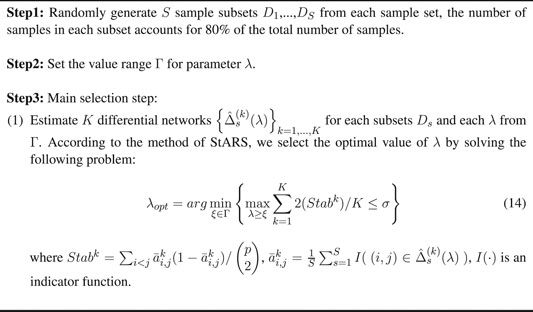
There is a tuning parameter λ in WJSDM, which affects the sparsity level of the estimated differential networks. In this study, following previous studies (Zhang et al., 2016), we use a stability approach, named StARS method (Liu et al., 2010; Meinshausen and Bühlmann, 2010), to determine the value of λ. The detailed procedure of our parameter selection method is summarized in Algorithm 2.
Algorithm 2 Tuning Parameter Selection for WJSDM
3 Results
In this section, we first perform simulation studies to assess the performance of our proposed WJSDM. Then we apply our model on real data sets.
3.1 Simulation Studies
To demonstrate the effectiveness of our WJSDM in inferring differential networks, we compare WJSDM with five state-of-the-art differential network estimation models, i.e., FGL (Danaher et al., 2014), TDJGL (Zhang et al., 2016), WDNE (Ou-Yang et al., 2021), GGL (Danaher et al., 2014) and D-trace (Yuan et al., 2017).
3.1.1 Data Generation
In this simulation study, we consider two groups of samples and their observations on p common genes collected from K = 3 data platforms, and generate six scale-free networks for the two groups of samples and three data platforms. Here, we set p = 100 and generate n1 = n2 = n ∈ {50, 100, 200} observations for each data platform. Each network includes three pathways with 0.4p genes per pathway, and there are 0.2p genes shared by the second and third pathway. For each pathway, we choose 10% edges as differential edges. To model the heterogeneity between different data platforms, we choose 10% of differential edges to be platform-specific. Since differentially expressed genes tend to change their regulatory relationships with other genes, we select 30% genes as differentially expressed genes and the edges connected to differentially expressed genes are more likely to be differential edges. There are no differential edges between genes belong to different pathways. To make a fair comparison with Gaussian graphical model-based methods, the gene expression levels of each cell are simulated by using a multivariate normal distribution. To generate the prior gene interaction network G, we select a prior rate δ of nonzero elements from the above six scale-free networks randomly and connect the corresponding genes in G. Note that gene expression data may include missing values. In this study, the expression values of a gene may be lost randomly, and the missing rate is set to τ ∈ {0.6, 0.8}.
3.1.2 Simulation Results
Let
where TPR denotes true positive rate, FPR denotes false positive rate, and I(⋅) is an indicator function.
As all methods have some hyper-parameters that need to be predefined, we generate a series of solutions for each model with different values of hyper-parameters, and assess their performances. In particular, for FGL, GGL, TDJGL and WDNE, there are two parameters λ1 and λ2. While for D-trace and our WJSDM, there is one parameter λ. To ease interpretation, following Danaher et al. (2014), the tuning parameters for GGL are reparameterized as
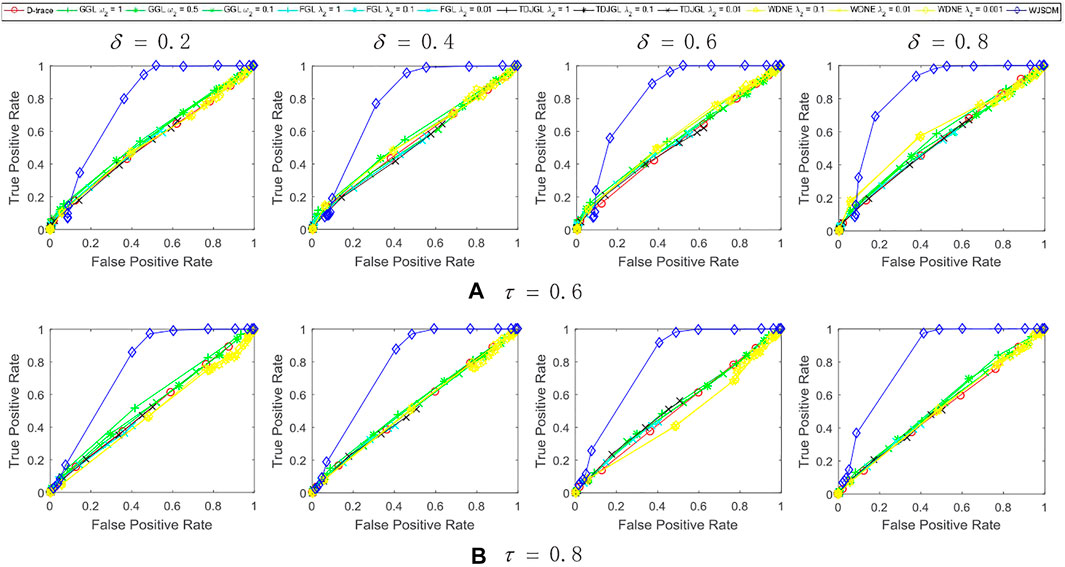
FIGURE 1. Performance of WJSDM, D-trace, GGL, FGL, TDJGL and WDNE with p = 100, K = 3, n = 50 and missing rate (A) τ = 0.6, (B) τ = 0.8. Within each plot, each line presents the performance of a method with the value of λ (for WJSDM and D-trace), λ1 (for FGL, TDJGL and WDNE) or ω1 (for GGL) varying for a fixed value of λ2 (for FGL, TDJGL and WDNE) or ω2 (for GGL). Each curve is obtained by averaging the performance of a method over ten random generations of data.
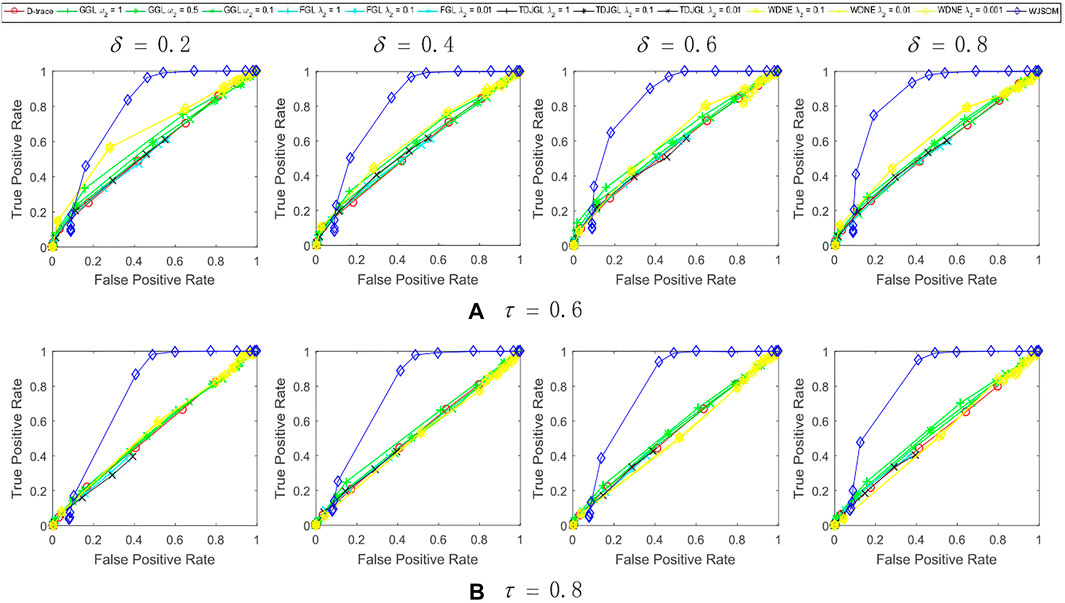
FIGURE 2. Performance of WJSDM, D-trace, GGL, FGL, TDJGL and WDNE with p = 100, K = 3, n = 100 and missing rate (A) τ = 0.6, (B) τ = 0.8. Within each plot, each line presents the performance of a method with the value of λ (for WJSDM and D-trace), λ1 (for FGL, TDJGL and WDNE) or ω1 (for GGL) varying for a fixed value of λ2 (for FGL, TDJGL and WDNE) or ω2 (for GGL). Each curve is obtained by averaging the performance of a method over ten random generations of data.
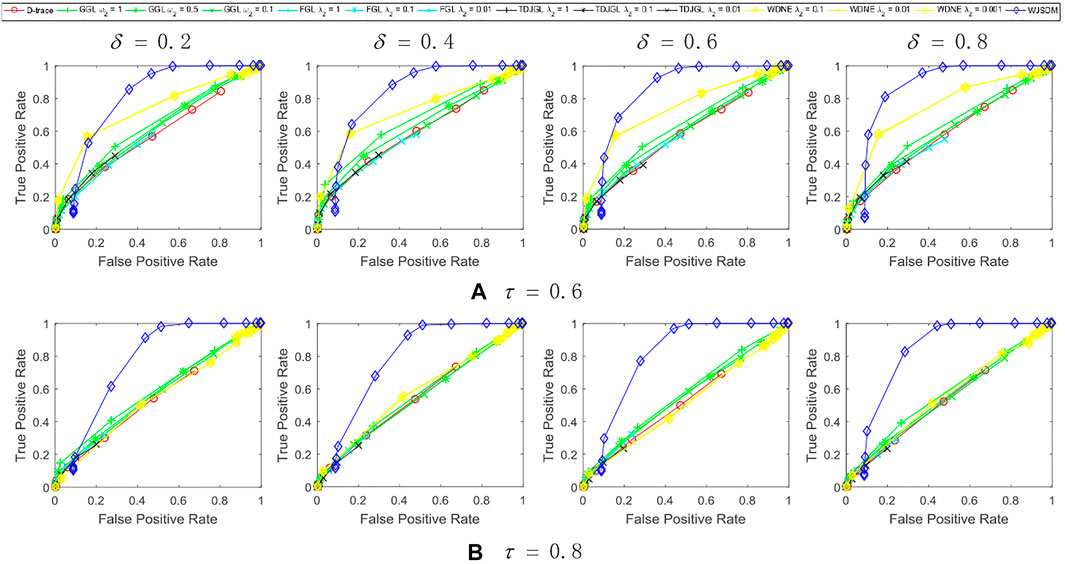
FIGURE 3. Performance of WJSDM, D-trace, GGL, FGL, TDJGL and WDNE with p = 100, K = 3, n = 200 and missing rate (A) τ = 0.6, (B) τ = 0.8. Within each plot, each line presents the performance of a method with the value of λ (for WJSDM and D-trace), λ1 (for FGL, TDJGL and WDNE) or ω1 (for GGL) varying for a fixed value of λ2 (for FGL, TDJGL and WDNE) or ω2 (for GGL). Each curve is obtained by averaging the performance of a method over ten random generations of data.
We can find from these figures that our WJSDM outperforms other compared methods in all cases. GGL can estimate multiple networks that share common network structures, but it cannot identify the differences between different networks. FGL and D-trace can infer the changes between different networks, but they cannot integrate the data collected from different data platforms. TDJGL is an extension of FGL, which can integrate multi-platform gene expression data. WDNE is an extension of TDJGL, which can handle gene expression data with missing values and take into account changes in gene expression levels. All of the above methods cannot make use of the prior information provided by additional knowledge when inferring differential networks. WDNE is a indirect differential network estimation model, which need to estimate the state-specific networks in advance. Thus, when the sample size is small, it cannot estimate differential network accurately. As shown in Figure 3, when the sample size is large, WDNE can achieve good performance and outperform other compared methods in most cases. The superior performance of WJSDM over WDNE demonstrates the benefit of inferring differential network directly and integrating multiple additional knowledge.
3.2 Real Data Analysis
3.2.1 Ovarian Cancer Analysis
Platinum agents, represented by cisplatin, are the most active cytotoxic drugs in ovarian cancer (Tapia and Diaz-Padilla, 2013). Women with platinum-resistant ovarian cancer continue to have poor survival rates, and effective treatment of platinum resistance still remains the largest unmet need in ovarian cancer (van Zyl et al., 2018). To explore the underlying mechanisms of platinum resistance, we utilize WJSDM to infer the changes of gene regulatory networks between platinum-sensitive and platinum-resistant ovarian tumors. In particular, we collect three gene expression datasets from TCGA database (Network, 2011), which measure gene expression levels from three platforms, i.e., Agilent 244K Custom Gene Expression G450, Affymetrix HT Human Genome U133 Array Plate Set and Affymetrix Human Exon 1.0 ST Array. The expression levels of 8,417 genes for 512 samples are available for all these three platforms. Among the 512 samples, 97 samples are platinum-resistant and 243 samples are platinum-sensitive. Following Zhang et al. (2017), we focus our analysis on seven critical pathways involved in platinum resistance, i.e., apoptosis, cell cycle, ErbB signaling pathway, mismatch repair, nucleotide excision repair, p53 signaling pathway and platinum drug resistance (Kanehisa and Goto, 2000). There are 315 genes in our datasets that belong to these seven pathways. The prior gene interaction network is downloaded from the TRRUST database (Han et al., 2015). There are 361 prior interactions among the 315 genes.
According to the parameter selection strategy (i.e., StARS) introduced above, the tuning parameter λ of our WJSDM is set to λ = 2.5. The estimated differential network between platinum-resistant and platinum-sensitive tumors, which describes the changes of gene regulatory relationships associated with platinum resistance, is shown in Figure 4. Since we are not able to obtain the true differential network between platinum-resistant and platinum-sensitive tumors, it is hard to measure the accuracy of the estimated differential networks. In fact, a common challenge in evaluating the performance of differential network estimation on real data sets is the lack of reference data. Hub genes in the differential network have more differential edges, which means they may play more important roles in driving the resistance of platinum. Thus, in this study, following previous studies (Zhang et al., 2016, 2017; Ou-Yang et al., 2019), we investigate the functions of the hub genes in our estimated differential network. In particular, the top 10 genes with the highest degree in our estimated differential network are considered as hubs (Table 1). To verify whether our identified hub genes are related to platinum resistance in ovarian cancer, similar to (Zhang et al., 2017), we draw support from six public datasets. In particular, we collect 161 cisplatin resistance-related genes and 758 drug resistance-related genes from the database of Genomic Elements Associated with drug Resistance (GEAR) (Wang et al., 2017), 548 experimentally verified ovarian cancer-related genes from the ovarian cancer gene database (OCGene) (Liu et al., 2015), 116 anti-cancer drug targets from the cancer drug resistance database (CancerDR) (Kumar et al., 2013), 572 cancer genes from the Cancer Gene Census database (Futreal et al., 2004) and 3,545 regulator genes from (Grechkin et al., 2016). Among the identified 10 hub genes, five of them are cisplatin resistance-related genes, eight of them are drug resistance-related genes, six of them are ovarian cancer-related genes, five of them are anti-cancer drug targets, four of them are cancer genes and nine of them are regulator genes.
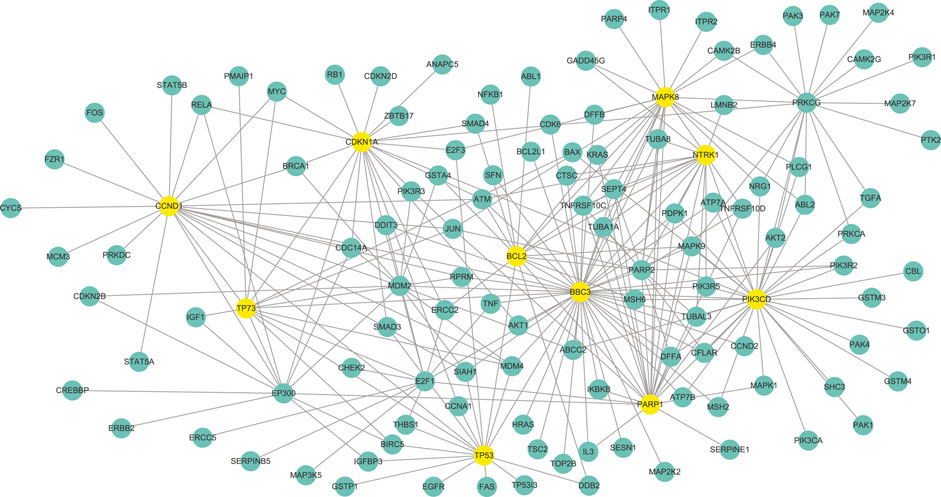
FIGURE 4. The differential network between platinum-resistant and platinum-sensitive tumors identified by WJSDM. Here, yellow nodes denote the top-10 hub genes in the differential network.

TABLE 1. Top-10 hub genes in the estimated differential gene network between platinum-resistant and platinum-sensitive tumors.
Note that the above six public datasets are still far from complete. Thus, we also draw support from literature search to explore whether our identified hub genes are related to cisplatin resistance in ovarian cancer. Among these genes, BBC3 has been reported to be associated with cisplatin resistance in ovarian cancer (Zhang et al., 2012; Grozav et al., 2015), and has been proposed as a chemosensitizer in platinum compounds-based ovarian cancer therapy (Yuan et al., 2011). PARP1 have been shown to involved in cisplatin resistance in ovarian cancer, and could be treated as a potential sensitizer in cisplatin chemotherapy (Liu et al., 2018). TP73 has been found to be associated with clinical responsiveness to platinum-based chemotherapy in advanced non-small cell lung cancer (NSCLC) (Yuan et al., 2006). Researches have found that TP73 could be a genetic marker for ovarian response (Bakay et al., 2021). Thus, it is interesting to study the association between TP73 and platinum resistance in ovarian cancer.
We can also find from Table 1 that our identified hub genes include both differentially (in this study, genes whose p-values are less than 0.05 are treated as differentially expressed genes) and non-differentially expressed genes. For example, MAPK8, CCND1, TP53, CDKN1A and BCL2 are related to cisplatin resistance in ovarian cancers. None of these five genes showed differential expression between platinum-resistant and platinum-sensitive tumors. Thus, our model can identify functional important genes that cannot be found by differential expression analysis, which demonstrate the superiority of our model over differential expression analysis.
3.2.2 Prostate Cancer Analysis
Enzalutamide is a second-generation anti-androgen medication which has been used in the treatment of prostate cancer (Scher et al., 2012). However, the mechanisms underlying the resistance of enzalutamide remain vague. We then apply WJSDM to the scRNA-seq data of circulating tumor cells of prostate cancer, and investigate the changes of gene regulatory relationships that associated with enzalutamide-resistant. In particular, we collect a scRNA-seq data set of prostate circulating tumor cells from GEO database with accession number: GSE67980 (Miyamoto et al., 2015). There are 77 samples isolated from 13 patients, where 41 samples are enzalutamide-naive and 36 samples are enzalutamide-resistant (Chiu et al., 2018). Among 21,696 genes, 7,508 genes have no sequencing reads in all the 77 samples. We focus our analysis on three critical pathways download from the Kyoto Encyclopedia of Genes and Genomes database (Kanehisa and Goto, 2000), i.e., Notch signaling pathway, Wnt signaling pathway and PI3K-AKT signaling pathway. By removing genes with no sequencing reads, there are 234 genes in the scRNA-seq data that belong to these three pathways. The prior gene interaction network is downloaded from the TRRUST database (Han et al., 2015). There are 178 prior interactions among the 234 genes.
According to the parameter selection strategy (i.e., StARS) introduced above, the tuning parameter λ of our WJSDM is set to λ = 0.7197. The estimated differential network between enzalutamide-resistant and enzalutamide-naive samples, which describes the changes of gene regulatory relationships associated with enzalutamide resistance, is shown in Figure 5. Hub genes in the differential network have more differential edges, which means they may play more important roles in driving the resistance of enzalutamide. Thus, we investigate the functions of the hub genes in our estimated differential network. In particular, the top 10 genes with the highest degree in our estimated differential network are considered as hubs (as shown in Table 2). We can find from Table 2 that all of these 10 hub genes are related to prostate cancer and five of them are associated with enzalutamide-resistant.
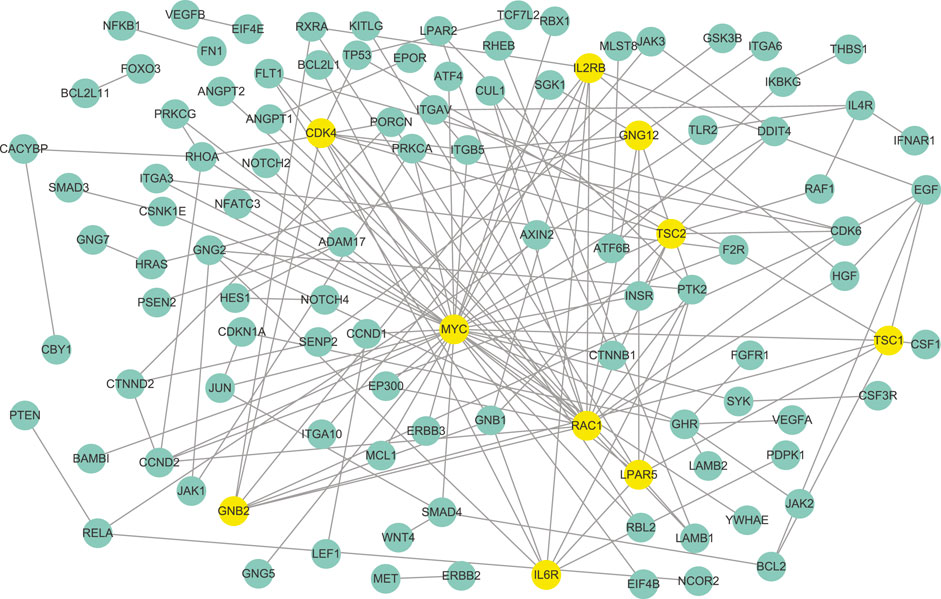
FIGURE 5. The differential network between enzalutamide-resistant and enzalutamide-naive samples identified by WJSDM. Here, yellow nodes denote the top-10 hub genes in the differential network.
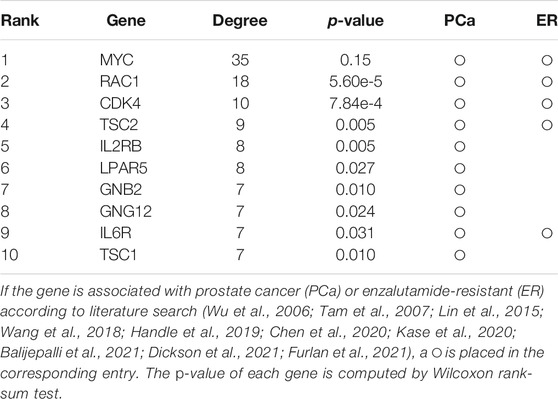
TABLE 2. Top-10 hub genes in the estimated differential gene network between enzalutamide-resistant and enzalutamide-naive samples.
Among these genes, MYC has been reported to be implicated in the development of enzalutamide resistance and the increase of MYC expression is correlated with shorter progression free survival in patients undergoing enzalutamide treatment (Handle et al., 2019; Furlan et al., 2021). However, this gene does not show differential expression between enzalutamide-resistant and enzalutamide-naive samples. Thus, it cannot be found by differential expression analysis. RAC1, which has been demonstrated to be upregulated in enzalutamide-resistant prostate cancer cells, plays a crucial role in enzalutamide resistance and could be a potential target for the treatment of castration-resistant prostate cancer (Chen et al., 2020). Knockdown of TSC1 and TSC2 have been shown to promote the proliferation of prostate cancer cells Lin et al. (2015). LPAR5 has been reported to be involved with immune response inhibition and cancer progression Geraldo et al. (2021). Researches have found that GRB2 is associated with shorter survival of patients with aggressive prostate cancer (Iwata et al., 2021). The activation of the IL-6R/JAK/STAT3 pathway has been found to be involved with the development of hormonerefractory prostate cancer (Tam et al., 2007). The combined inhibition of IL6R and HMGB1 has been reported to be a new treatment for enzalutamide resistance in patients with advanced prostate cancer (Wang et al., 2018).
The above results demonstrate the effectiveness of our WJSDM in inferring the difference between the gene networks of different disease states, and provide important insights about the underlying regulatory mechanisms of the platinum resistance in ovarian cancer and the enzalutamide resistance in prostate cancer.
4 Conclusion
Increasing evidences indicate the changes of gene regulatory relationships between different cell states or developmental stages, which motivate the development of computational models to infer differential networks. In this paper, based on gene expression data and additional biological knowledge, we propose a novel differential network estimation method named weighted joint sparse penalized D-trace model (WJSDM), to infer the changes of gene regulatory networks between two different states. By employing D-trace loss function and using a revised Kendall’s tau correlation, our method can directly infer the differential network between two different states from gene expression data with missing values. Furthermore, to integrate the gene expression data collected from different data platforms and utilize the information provided by various prior biological knowledge, we propose a weighted group bridge penalty function, which enable our model to draw support from multiple related data sets. Experiment results on synthetic data sets show that compared with other state-of-the-art differential network estimation methods, our method can infer differential networks more accurately. We also apply our method to the gene expression data of ovarian tumors and circulating tumor cells of prostate cancer, and estimate the differential network associated with platinum resistance of ovarian cancer and anti-androgen resistance of prostate cancer. By analyzing our estimated differential networks, we find some important biological insights about the mechanisms underlying platinum resistance of ovarian cancer and anti-androgen resistance of prostate cancer.
With the development of single-cell sequencing techniques, an increasing number of single-cell multi-omics data are becoming available. How to efficiently integrate single-cell multi-omics data is an interesting future work. We will try to extend our model to handle this problem.
Data Availability Statement
Publicly available datasets were analyzed in this study. This data can be found here: https://portal.gdc.cancer.gov/ https://www.ncbi.nlm.nih.gov/geo/ https://www.kegg.jp/ https://www.grnpedia.org/trrust/.
Author Contributions
CL and DC conceived and designed the study, performed the statistical analysis and drafted the manuscript. YH and WZ conceived of the study, and participated in its design and coordination and helped to draft and revise the manuscript. All authors read and approved the final manuscript.
Funding
This work is supported by the Natural Science Foundation of Fujian Province, China (Grant No. 2020J01956) and Startup Fund for scientific research, Fujian Medical University (Grant No.2019QH1065, 2020QH1041).
Conflict of Interest
The authors declare that the research was conducted in the absence of any commercial or financial relationships that could be construed as a potential conflict of interest.
Publisher’s Note
All claims expressed in this article are solely those of the authors and do not necessarily represent those of their affiliated organizations, or those of the publisher, the editors and the reviewers. Any product that may be evaluated in this article, or claim that may be made by its manufacturer, is not guaranteed or endorsed by the publisher.
References
Bakay, K., Coban, U., Arslan, M. A., Guven, D., and Tural, S. (2021). Effects of Hrg and Tp73 Gene Variations on Ovarian Response. Gynecol. Endocrinol. 1, 1–5. doi:10.1080/09513590.2021.1974379
Balijepalli, P., Sitton, C. C., and Meier, K. E. (2021). Lysophosphatidic Acid Signaling in Cancer Cells: What Makes Lpa So Special. Cells 10, 2059. doi:10.3390/cells10082059
Chen, X., Yin, L., Qiao, G., Li, Y., Li, B., Bai, Y., et al. (2020). Inhibition of Rac1 Reverses Enzalutamide Resistance in Castration-resistant P-rostate C-ancer. Oncol. Lett. 20, 2997–3005. doi:10.3892/ol.2020.11823
Chiu, Y. C., Hsiao, T. H., Wang, L. J., Chen, Y., and Shao, Y. J. (2018). Scdnet: a Computational Tool for Single-Cell Differential Network Analysis. BMC Syst. Biol. 12, 124–166. doi:10.1186/s12918-018-0652-0
Danaher, P., Wang, P., and Witten, D. M. (2014). The Joint Graphical Lasso for Inverse Covariance Estimation across Multiple Classes. J. R. Stat. Soc. B 76, 373–397. doi:10.1111/rssb.12033
Dickson, M. A., Ravi, V., Ganjoo, K. N., and Iyer, G. (2021). Institutional Experience with Nab-Sirolimus in Patients with Malignancies Harboring Tsc1 or Tsc2 Mutations. Jco 39, 3111. doi:10.1200/jco.2021.39.15_suppl.3111
Furlan, T., Kirchmair, A., Sampson, N., Puhr, M., Gruber, M., Trajanoski, Z., et al. (2021). Myc-mediated Ribosomal Gene Expression Sensitizes Enzalutamide-Resistant Prostate Cancer Cells to Ep300/crebbp Inhibitors. Am. J. Pathol. 191, 1094–1107. doi:10.1016/j.ajpath.2021.02.017
Futreal, P. A., Coin, L., Marshall, M., Down, T., Hubbard, T., Wooster, R., et al. (2004). A Census of Human Cancer Genes. Nat. Rev. Cancer 4, 177–183. doi:10.1038/nrc1299
Geraldo, L. H. M., de Sampaio Spohr, T. C. L., do Amaral, R. F., da Fonseca, A. C. C., Garcia, C., de Almeida Mendes, F., et al. (2021). Role of Lysophosphatidic Acid and its Receptors in Health and Disease: Novel Therapeutic Strategies. Signal. Transduction Targeted Ther. 6, 1–18. doi:10.1038/s41392-020-00367-5
Grechkin, M., Logsdon, B. A., Gentles, A. J., and Lee, S.-I. (2016). Identifying Network Perturbation in Cancer. Plos Comput. Biol. 12, e1004888. doi:10.1371/journal.pcbi.1004888
Grozav, A., Balacescu, O., Balacescu, L., Cheminel, T., Berindan-Neagoe, I., and Therrien, B. (2015). Synthesis, Anticancer Activity, and Genome Profiling of Thiazolo Arene Ruthenium Complexes. J. Med. Chem. 58, 8475–8490. doi:10.1021/acs.jmedchem.5b00855
Ha, M. J., Baladandayuthapani, V., and Do, K.-A. (2015). Dingo: Differential Network Analysis in Genomics. Bioinformatics 31, 3413–3420. doi:10.1093/bioinformatics/btv406
Han, H., Shim, H., Shin, D., Shim, J. E., Ko, Y., Shin, J., et al. (2015). Trrust: a Reference Database of Human Transcriptional Regulatory Interactions. Sci. Rep. 5, 11432. doi:10.1038/srep11432
Handle, F., Prekovic, S., Helsen, C., Van den Broeck, T., Smeets, E., Moris, L., et al. (2019). Drivers of Ar Indifferent Anti-androgen Resistance in Prostate Cancer Cells. Sci. Rep. 9, 13786. doi:10.1038/s41598-019-50220-1
Higham, N. J. (1988). Computing a Nearest Symmetric Positive Semidefinite Matrix. Linear algebra its Appl. 103, 103–118. doi:10.1016/0024-3795(88)90223-6
Iwata, T., Sedukhina, A. S., Kubota, M., Oonuma, S., Maeda, I., Yoshiike, M., et al. (2021). A New Bioinformatics Approach Identifies Overexpression of Grb2 as a Poor Prognostic Biomarker for Prostate Cancer. Sci. Rep. 11, 5696–5698. doi:10.1038/s41598-021-85086-9
Kanehisa, M., and Goto, S. (2000). Kegg: Kyoto Encyclopedia of Genes and Genomes. Nucleic Acids Res. 28, 27–30. doi:10.1093/nar/28.1.27
Kase, A. M., Copland, J. A., and Tan, W. (2020). Novel Therapeutic Strategies for Cdk4/6 Inhibitors in Metastatic Castrate-Resistant Prostate Cancer. Ott 13, 10499–10513. doi:10.2147/ott.s266085
Kumar, R., Chaudhary, K., Gupta, S., Singh, H., Kumar, S., Gautam, A., et al. (2013). Cancerdr: Cancer Drug Resistance Database. Sci. Rep. 3, 1445–1446. doi:10.1038/srep01445
Lichtblau, Y., Zimmermann, K., Haldemann, B., Lenze, D., Hummel, M., and Leser, U. (2016). Comparative Assessment of Differential Network Analysis Methods. Brief Bioinform 18, 837–850. doi:10.1093/bib/bbw061
Lin, H.-P., Lin, C.-Y., Huo, C., Jan, Y.-J., Tseng, J.-C., Jiang, S. S., et al. (2015). AKT3 Promotes Prostate Cancer Proliferation Cells through Regulation of Akt, B-Raf & TSC1/TSC2. Oncotarget 6, 27097–27112. doi:10.18632/oncotarget.4553
Liu, H., Roeder, K., and Wasserman, L. (2010). Stability Approach to Regularization Selection (Stars) for High Dimensional Graphical Models. Adv. Neural Inf. Process. Syst. 24, 1432–1440.
Liu, H., Han, F., Yuan, M., Lafferty, J., and Wasserman, L. (2012). High-dimensional Semiparametric Gaussian Copula Graphical Models. Ann. Stat. 40, 2293–2326. doi:10.1214/12-aos1037
Liu, Q., Zhu, D., Hao, B., Zhang, Z., and Tian, Y. (2018). Luteolin Promotes the Sensitivity of Cisplatin in Ovarian Cancer by Decreasing Prpa1-Medicated Autophagy. Cel Mol Biol (Noisy-le-grand) 64, 17–22. doi:10.14715/cmb/2018.64.6.4
Liu, Y., Xia, J., Sun, J., and Zhao, M. (2015). Ocgene: a Database of Experimentally Verified Ovarian Cancer-Related Genes with Precomputed Regulation Information. Cell Death Dis. 6, e2036. doi:10.1038/cddis.2015.380
Meinshausen, N., and Bühlmann, P. (2010). Stability Selection. J. R. Stat. Soc. Ser. B (Statistical Methodology) 72, 417–473. doi:10.1111/j.1467-9868.2010.00740.x
Miyamoto, D. T., Zheng, Y., Wittner, B. S., Lee, R. J., Zhu, H., Broderick, K. T., et al. (2015). Rna-seq of Single Prostate Ctcs Implicates Noncanonical Wnt Signaling in Antiandrogen Resistance. Science 349, 1351–1356. doi:10.1126/science.aab0917
Network, T. C. G. A. R. (2011). Integrated Genomic Analyses of Ovarian Carcinoma. Nature 474, 609–615. doi:10.1038/nature10166
Ou-Yang, L., Cai, D., Zhang, X. F., and Yan, H. (2021). Wdne: an Integrative Graphical Model for Inferring Differential Networks from Multi-Platform Gene Expression Data with Missing Values. Brief Bioinform, bbab086. doi:10.1093/bib/bbab086
Ou-Yang, L., Yan, H., and Zhang, X.-F. (2017). Identifying Differential Networks Based on Multi-Platform Gene Expression Data. Mol. Biosyst. 13, 183–192. doi:10.1039/c6mb00619a
Ou-Yang, L., Zhang, X.-F., Zhao, X.-M., Wang, D. D., Wang, F. L., Lei, B., et al. (2019). Joint Learning of Multiple Differential Networks with Latent Variables. IEEE Trans. Cybern. 49, 3494–3506. doi:10.1109/tcyb.2018.2845838
Parikh, N., and Boyd, S. (2014). Proximal Algorithms. FNT in Optimization 1, 127–239. doi:10.1561/2400000003
Pratapa, A., Jalihal, A. P., Law, J. N., Bharadwaj, A., and Murali, T. M. (2020). Benchmarking Algorithms for Gene Regulatory Network Inference from Single-Cell Transcriptomic Data. Nat. Methods 17, 147–154. doi:10.1038/s41592-019-0690-6
Scher, H. I., Fizazi, K., Saad, F., Taplin, M.-E., Sternberg, C. N., Miller, K., et al. (2012). Increased Survival with Enzalutamide in Prostate Cancer after Chemotherapy. N. Engl. J. Med. 367, 1187–1197. doi:10.1056/nejmoa1207506
Stegle, O., Teichmann, S. A., and Marioni, J. C. (2015). Computational and Analytical Challenges in Single-Cell Transcriptomics. Nat. Rev. Genet. 16, 133–145. doi:10.1038/nrg3833
Tam, L., McGlynn, L. M., Traynor, P., Mukherjee, R., Bartlett, J. M. S., and Edwards, J. (2007). Expression Levels of the Jak/stat Pathway in the Transition from Hormone-Sensitive to Hormone-Refractory Prostate Cancer. Br. J. Cancer 97, 378–383. doi:10.1038/sj.bjc.6603871
Tapia, G., and Diaz-Padilla, I. (2013). Molecular Mechanisms of Platinum Resistance in Ovarian Cancer. Ovarian Cancer-A Clin. translational Update, 205–223doi:10.5772/55562
Tian, D., Gu, Q., and Ma, J. (2016). Identifying Gene Regulatory Network Rewiring Using Latent Differential Graphical Models. Nucleic Acids Res. 44, e140. doi:10.1093/nar/gkw581
Uppal, K., Ma, C., Go, Y.-M., and Jones, D. P. (2018). Xmwas: a Data-Driven Integration and Differential Network Analysis Tool. Bioinformatics 34, 701–702. doi:10.1093/bioinformatics/btx656
van Zyl, B., Tang, D., and Bowden, N. A. (2018). Biomarkers of Platinum Resistance in Ovarian Cancer: what Can We Use to Improve Treatment. Endocrine-related cancer 25, R303–R318. doi:10.1530/erc-17-0336
Wang, C., Peng, G., Huang, H., Liu, F., Kong, D.-P., Dong, K.-Q., et al. (2018). Blocking the Feedback Loop between Neuroendocrine Differentiation and Macrophages Improves the Therapeutic Effects of Enzalutamide (Mdv3100) on Prostate Cancer. Clin. Cancer Res. 24, 708–723. doi:10.1158/1078-0432.ccr-17-2446
Wang, H., Fazayeli, F., Chatterjee, S., and Banerjee, A. (2014). Gaussian Copula Precision Estimation with Missing Values. Artif. Intelligence Stat., 33, 978–986.
Wang, Y.-Y., Chen, W.-H., Xiao, P.-P., Xie, W.-B., Luo, Q., Bork, P., et al. (2017). Gear: A Database of Genomic Elements Associated with Drug Resistance. Sci. Rep. 7, 44085. doi:10.1038/srep44085
Wu, H.-C., Chang, C.-H., Wan, L., Wu, C.-I., Tsai, F.-J., and Chen, W.-C. (2006). Il-2 Gene C/t Polymorphism Is Associated with Prostate Cancer. J. Clin. Lab. Anal. 20, 245–249. doi:10.1002/jcla.20149
Wu, N., Huang, J., Zhang, X.-F., Ou-Yang, L., He, S., Zhu, Z., et al. (2019). Weighted Fused Pathway Graphical Lasso for Joint Estimation of Multiple Gene Networks. Front. Genet. 10, 623. doi:10.3389/fgene.2019.00623
Xu, T., Ou-Yang, L., Hu, X., and Zhang, X.-F. (2018). Identifying Gene Network Rewiring by Integrating Gene Expression and Gene Network Data. Ieee/acm Trans. Comput. Biol. Bioinf. 15, 2079–2085. doi:10.1109/tcbb.2018.2809603
Yuan, H., Xi, R., Chen, C., and Deng, M. (2017). Differential Network Analysis via Lasso Penalized D-Trace Loss. Biometrika 104, 755–770. doi:10.1093/biomet/asx049
Yuan, P., Miao, X. P., Zhang, X. M., Wang, Z. H., Tan, W., Zhang, X. R., et al. (2006). Association of the Responsiveness of Advanced Non-small Cell Lung Cancer to Platinum-Based Chemotherapy with P53 and P73 Polymorphisms. Zhonghua Zhong Liu Za Zhi 28, 107–110.
Yuan, Z., Cao, K., Lin, C., Li, L., Liu, H.-y., Zhao, X.-y., et al. (2011). The P53 Upregulated Modulator of Apoptosis (PUMA) Chemosensitizes Intrinsically Resistant Ovarian Cancer Cells to Cisplatin by Lowering the Threshold Set by Bcl-xL and Mcl-1. Mol. Med. 17, 1262–1274. doi:10.2119/molmed.2011.00176
Zhang, P., Liu, S. S., and Ngan, H. Y. S. (2012). Tap73-mediated the Activation of C-Jun N-Terminal Kinase Enhances Cellular Chemosensitivity to Cisplatin in Ovarian Cancer Cells. PLoS ONE 7, e42985. doi:10.1371/journal.pone.0042985
Zhang, X.-F., Ou-Yang, L., and Yan, H. (2017). Incorporating Prior Information into Differential Network Analysis Using Non-paranormal Graphical Models. Bioinformatics 33, 2436–2445. doi:10.1093/bioinformatics/btx208
Zhang, X.-F., Ou-Yang, L., Yan, T., Hu, X. T., and Yan, H. (2021). A Joint Graphical Model for Inferring Gene Networks across Multiple Subpopulations and Data Types. IEEE Trans. Cybern. 51, 1043–1055. doi:10.1109/TCYB.2019.2952711
Zhang, X.-F., Ou-Yang, L., Zhao, X.-M., and Yan, H. (2016). Differential Network Analysis from Cross-Platform Gene Expression Data. Sci. Rep. 6, 34112. doi:10.1038/srep34112
Keywords: single-cell RNA sequencing, differential network analysis, prior information, graphical model, gene regulatory network
Citation: Liu C, Cai D, Zeng W and Huang Y (2021) Inferring Differential Networks by Integrating Gene Expression Data With Additional Knowledge. Front. Genet. 12:760155. doi: 10.3389/fgene.2021.760155
Received: 17 August 2021; Accepted: 13 October 2021;
Published: 11 November 2021.
Edited by:
Min Wu, Institute for Infocomm Research (A∗STAR), SingaporeReviewed by:
Mengwei Li, Singapore Immunology Network (A∗STAR), SingaporeWen Zhang, Huazhong Agricultural University, China
Copyright © 2021 Liu, Cai, Zeng and Huang. This is an open-access article distributed under the terms of the Creative Commons Attribution License (CC BY). The use, distribution or reproduction in other forums is permitted, provided the original author(s) and the copyright owner(s) are credited and that the original publication in this journal is cited, in accordance with accepted academic practice. No use, distribution or reproduction is permitted which does not comply with these terms.
*Correspondence: Yun Huang, aHVhbmd5dW4yMDE1MDMxOEAxNjMuY29t