 Fei Xu1†
 Qianqian Tang2†
 Yejinpeng Wang3
 Gang Wang3,4,5,6
 Kaiyu Qian3,4,5,6
 Lingao Ju3,4,5,6
 Yu Xiao1,3,4,5,6*
- 1Department of Laboratory Medicine, Zhongnan Hospital of Wuhan University, Wuhan, China
- 2Department of Breast and Thyroid Surgery, Zhongnan Hospital of Wuhan University, Wuhan, China
- 3Laboratory of Precision Medicine, Zhongnan Hospital of Wuhan University, Wuhan, China
- 4Department of Biological Repositories, Zhongnan Hospital of Wuhan University, Wuhan, China
- 5Human Genetic Resource Preservation Center of Hubei Province, Wuhan, China
- 6Human Genetic Resource Preservation Center of Wuhan University, Wuhan, China
Human bladder cancer (BCa) is the most common urogenital system malignancy. Patients with BCa have limited treatment efficacy in clinical practice. Novel biomarkers could provide more crucial information conferring to cancer diagnosis, treatment, and prognosis. Here, we aimed to explore and identify novel biomarkers associated with cancer-specific survival of patients with BCa to build a prognostic signature. Based on univariate Cox regression, Lasso regression, and multivariate Cox regression analysis, we conducted an integrated analysis in the training set (GSE32894) and established a six-gene signature to predict the cancer-specific survival for human BCa. The six genes were Cyclin Dependent Kinase 4 (CDK4), E2F Transcription Factor 7 (E2F7), Collagen Type XI Alpha 1 Chain (COL11A1), Bradykinin Receptor B2 (BDKRB2), Yip1 Interacting Factor Homolog B (YIF1B), and Zinc Finger Protein 415 (ZNF415). Then, we validated the prognostic value of the model by using two other datasets (GSE13507 and TCGA). Also, we conducted univariate and multivariate Cox regression analyses, and results indicated that the six-gene signature was an independent prognostic factor of cancer-specific survival of patients with BCa. Functional analysis was performed based on the differentially expressed genes of low- and high-risk patients, and we found that they were enriched in lipid metabolic and cell division-related biological processes. Meanwhile, the gene set enrichment analysis (GSEA) revealed that high-risk samples were enriched in cell cycle and cancer-related pathways [G2/M checkpoint, E2F targets, mitotic spindle, mTOR signaling, spermatogenesis, epithelial–mesenchymal transition (EMT), DNA repair, PI3K/AKT/mTOR signaling, unfolded protein response (UPR), and MYC targets V2]. Lastly, we detected the relative expression of each signature in BCa cell lines by quantitative real-time PCR (qRT-PCR). As far as we know, currently, the present study is the first research that developed and validated a cancer-specific survival prognostic index based on three independent cohorts. The results revealed that this six-gene signature has a predictive ability for cancer-specific prognosis. Moreover, we also verified the relative expression of these six signatures between the bladder cell line and four BCa cell lines by qRT-PCR. Nevertheless, experiments to further explore the function of six genes are lacking.
1 Introduction
Human bladder cancer (BCa) is the most common urogenital system malignancy, and among the cancers related to males, it ranks fourth (Siegel et al., 2013). In China, BCa is also one of the most common urologic malignancies, and in the past few years, the incidence and mortality rates have increased gradually (Chen et al., 2015). The major risk factors for human BCa are still smoking and occupational exposures, whereas chronic infection with Schistosoma hematobium is relatively rare (Pang et al., 2016). BCa is divided into two types: non-muscle-invasive bladder cancer (NMIBC) and muscle-invasive bladder cancer (MIBC). Most BCa patients are diagnosed with NMIBC, which is featured as high recurrence (Prout et al., 1992). Nowadays, the common treatment for superficial BCa is transurethral resection and intravesical perfusion chemotherapy. Bacillus Calmette Guerin installation remains the gold standard of NMIBC, while appropriately 40% of patients are not sensitive to it, even 15% of patients may progress into MIBC after treating it (Seidl, 2020). What is more, the 5-year overall survival rate of patients remains at a level of 15%–20% (Cao et al., 2019). Furthermore, BCa is easy to recur and progress into MIBC. Most MIBCs were treated with radical cystectomy (Chen et al., 2015; Pang et al., 2016). As a result, the expenditure for treating BCa is huge (Sloan et al., 2020). Besides, the risks of radical cystectomy contain infection, incontinence, stones in the urethrostomy, obstruction of urine flow, damage to nearby organs, and so on (Seidl, 2020). Plenty of patients undergoing radical cystectomy generally have a poor quality of life. Therefore, it is essential to understand the critical biomarkers and key pathways governing tumor behavior for better treatment strategies and prediction of prognosis.
Due to microarray and high-throughput sequencing technology development, we could identify thousands of cancer-related genes and generate innovative insights into understanding the potential molecular mechanism of them, therefore applying them to the biomedical research field to benefit patients (Cui et al., 2015). Additionally, it is increasingly being used to search for potential biomarkers related to cancer diagnosis, treatment, and prognosis (Cancer Genome Atlas Research, 2014). In clinical practice, we found that the optional treatment strategies for patients with BCa were limited and the efficacy was not satisfactory. Hence, it is urgent to explore original target to explore new targets to provide new treatment strategies for patients with BCa. Therefore, we developed a prognostic model for BCa to predict the progression of BCa, hoping that it can provide a basis for clinical setting for BCa patients in the future.
Our study obtained mRNA expression microarray data of GSE32894 from the GEO database as the training set and another two independent test datasets, GSE13507 microarray data and The Cancer Genome Atlas (TCGA) mRNA sequencing data of BLCA. By executing univariate Cox, Least Absolute Shrinkage and Selection Operator (LASSO), and multivariate hazard Cox regression analysis, six genes related to cancer-specific survival were identified and thus constructed a six-gene prognostic index based on these genes. Another two independent test sets performed the validation of the prognostic value of the six-gene signature. Finally, we performed qRT-PCR to further verify these six genes in the bladder cell line (SV-HUV-1) and four BCa cell lines (5637, T24, UM-UC3, and J82). Our study proved that the six-gene signature could function as the independent biomarkers for the cancer-specific prognosis of human BCa and their potential roles in tumor progression.
2 Materials and Methods
2.1 Data Collection
Expressing mRNA profiles and related clinical data of human BCa were downloaded from the Gene Expression Omnibus (GEO) database (http://www.ncbi.nlm.nih.gov/geo/) (Barrett et al., 2013). Dataset GSE32894 performed on Illumina Human HT-12 V3.0 expression bead chip was used as the training set (Sjödahl et al., 2012). Dataset GSE13507 performed on Illumina human-6 v2.0 expression bead chip (Kim et al., 2010; Lee et al., 2010) and mRNA expression profiles of BLCA patients were obtained from the TCGA data portal (https://gdc-portal.nci.nih.gov/) (Ye et al., 2019) and were used as another test set. Prognostic data for all TCGA survival analyses were obtained from published papers (Liu et al., 2018).
2.2 Data Preprocessing
We used RMA background correction for the raw expression data for the microarray analyses at first, and log2 transformation and normalization were employed for processed signals. Then, we used the “affy” R package to summarize the median-polish probe sets. The Affymetrix annotation files annotated probes. For TCGA BLCA data, the gene expression data were based on the RNA-sequencing technology of IlluminaHiseq.
2.3 Signature Development and Validation
Firstly, we excluded samples without exact survival data. By applying the univariate hazard Cox regression analysis with survival as a dependent characteristic, the correlation between each gene expression profile and cancer-specific survival in patients was evaluated based on the training dataset (GSE32894). Here, we identified genes with p < 1E-6 of cancer-specific survival as prognostic gene signatures and then performed LASSO regression analysis. Genes selected from LASSO regression analysis were taken as the candidate factors, and then were subjected to perform multivariate hazard Cox regression analysis in the training dataset with cancer-specific survival as the dependent prognostic influence factor. The risk score was developed based on a linear combination of the mRNA expression level weighted by the estimated regression coefficient generated from the multivariate hazard Cox regression analysis. The formula of risk score for each patient was calculated as follows: Risk score = βgene1 × exprgene1 + βgene2 × exprgene2+ ··· + βgeneN × exprgeneN, in which N is the number of prognostic gene signatures, expr represents the expression profiles of gene signatures, and β means the estimated regression coefficient of gene signatures derived from the multivariate hazard Cox regression analysis. Then, the gene signatures could calculate a risk score for each patient, and we could divide the patients into two (high- and low-risk) groups according to the median risk score. The Kaplan–Meier analysis was used to evaluate the cancer-specific survival distributions by the R “survival” package. Then, another two independent datasets were used to perform the test of the prognostic signature. GSE13507 was used to test the cancer-specific survival and TCGA BLCA data were used to test the disease-specific survival distribution. Moreover, we performed univariate Cox regression and multivariate Cox regression analysis to further verify the prognostic model’s accuracy and precision by integrating clinical features (including gender, age, tumor stage, tumor grade, and progression).
2.4 DEGs Analysis for High- and Low-Risk Groups
The “limma” R package was utilized to screen the distinguishingly expressed genes between high-risk and low-risk patients. The SAM (significance analysis of microarrays) with FDR (false discovery rate) < 0.05 and |log2 fold change (FC)| > 1 were set as the cutoff, and the DEGs were applied to further analysis.
2.5 Functional Analysis for DEGs
Gene ontology (GO) analysis (here, we chose the biological process) was accomplished using the R package cluster Profiler to observe the potential functions of DEGs. p < 0.05 was set as the cutoff criterion.
2.6 Gene Set Enrichment Analysis
To further analyze the potential function, the training set was performed into two groups according to the median risk score. For use with GSEA software (https://www.gsea-msigdb.org/gsea/index.jsp) (Subramanian et al., 2005), the collection of annotated gene sets of h.all.v6.1.symbol.gmat [Hallmarks] in Molecular Signatures Database (MSigDB, http://software.broadinstitute.org/gsea/msigdb/index.jsp) was chosen as the reference gene sets (Subramanian et al., 2005; Croken et al., 2014). We selected the gene sets enriched in high-risk groups or high expression level groups, and p < 0.05 was chosen as the cutoff criteria.
2.7 Gene Expression Level Evaluation
To further evaluate the gene expression level between normal bladder and BCa tissues, we used an online database GEPIA2 (http://gepia2.cancer-pku.cn/) (Tang et al., 2019). Moreover, the test set GSE13507 was used to compare the differences between normal bladder mucosae, bladder mucosae surrounding cancer, primary non-muscle invasive BCa, primary muscle invasive BCa, and recurrent non-muscle invasive tumor.
2.8 RNA Extraction, Reverse Transcription, and qRT-PCR
Total RNA was extracted from the nontumorous immortalized bladder cell line (SV-HUV-1) and four BCa cell lines (5637, T24, UM-UC3, and J82) using HiPure Total RNA Mini Kit (Cat. #R4111-03, Magen, China) according to the manufacturer’s instruction. The reverse transcription process was carried out with the ReverTra Ace qPCR RT Kit (Toyobo, China). The expressions of six genes were normalized to GAPDH expression. The primer sequences are listed as Supplementary Table S1.
2.9 Statistical Analysis
Univariate hazard Cox regression, LASSO regression, and multivariate hazard Cox regression analyses were performed to identify the prognostic factors and to establish a prognostic model. The survival curve was drawn by the Kaplan–Meier method and compared by log-rank test. ROC curve was used to evaluate the predictive power of the prognostic index. Univariate Cox regression analysis and multivariate Cox regression analysis were performed to further verify the independent prognostic value of the prognostic signature. The statistical significance of differences in qRT-PCR was compared using the Student’s t-test as appropriate. Bioinformatic analysis was done in the R language (version 3.6.2) and p < 0.05 was considered as statistically significant at two sides.
3 Results
3.1 Recognition of Prognostic Genes Related to Patients’ Cancer-Specific Survival From the Training Dataset
The flow chart of recognition and validation of the six-gene signature is shown as Figure 1. Originally, we employed the univariate hazard Cox regression analysis to assess the connection between all gene expressions and patients’ cancer-specific survival in the training dataset (GSE32894) (Figure 1). Moreover, the result revealed that there were 60 genes significantly associated with prognosis (p < 1E-6), which were defined as prognostic genes. Then, the candidate genes were performed by LASSO regression (Figures 2A,B), and CDK4, GUCY1A2, NMMT, E2F7, ZNF415, HTR2A, NUAK1, COL11A1, THOP1, TNFRSF6B, BCAT1, CBX2, CTRC, DHRS2, BDKRB2, YIF1B, and SLC22A16 were screened. Among these prognostic genes, only three genes (ZNF415, HTR2A, and DHRS2) with higher expression were correlated with more prolonged survival [whose z (coefficient) < 0], whereas other genes (CDK4, GUCY1A2, NMMT, E2F7, NUAK1, COL11A1, THOP1, TNFRSF6B, BCAT1, CBX2, CTRC, BDKRB2, YIF1B, and SLC22A16) with higher expression were lined with shorter survival [whose z (coefficient) > 0].
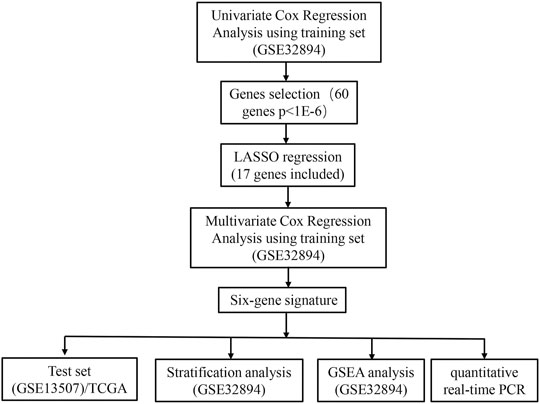
FIGURE 1. Flow chart representing the process used to select target genes included in the analysis.
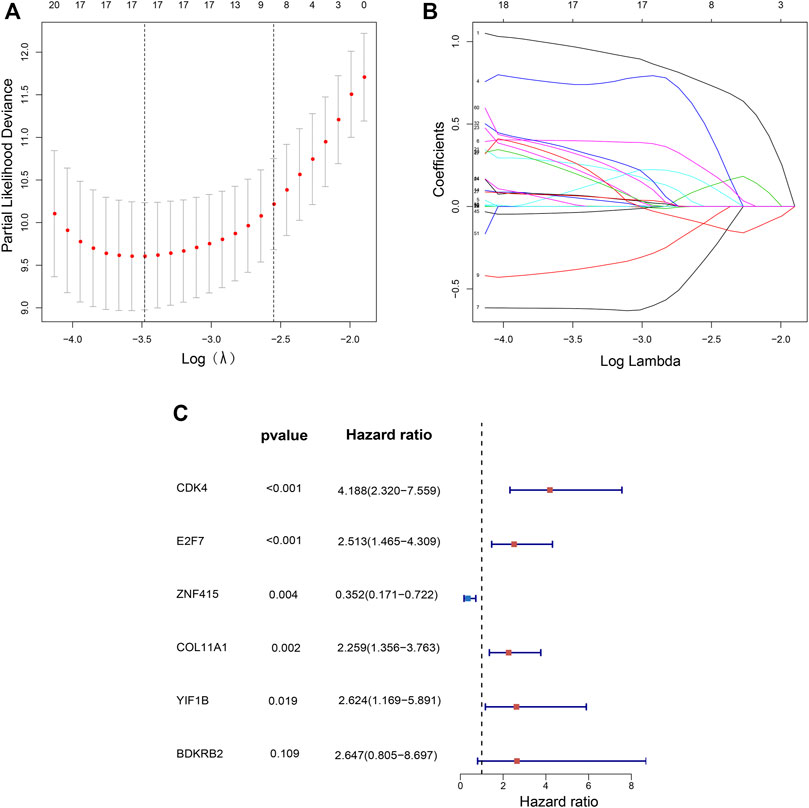
FIGURE 2. Independent prognostic-related genes selection utilizing LASSO and Multivariate cox regression. Plots of the 10-fold cross-validation error rates (A). LASSO coefficient profiles of 17 prognostic-related signatures (B). The multivariate hazard Cox regression analysis results show six independent prognostic-related signatures (C).
3.2 Establishment and Validation of a Six-Gene Signature for Predicting Patients’ Cancer-Specific Survival in the Training Dataset
Multivariate hazard Cox regression analysis was further used to analyze those 17 prognostic genes and then selected genes independently related to cancer-specific survival. Eventually, we screened six genes (CDK4, E2F7, COL11A1, BDKRB2, YIF1B, and ZNF415) as the independent factor and established a prognostic model (Figure 2C). Via integrating the expression of those six genes and the estimated regression coefficient, we then obtained the following calculation model: Risk score = (1.43215589574675 × expression of CDK4) + (0.921330280956022 × expression of E2F7) + (−1.04548254381182 × expression of ZNF415) + (0.814780461026126 × expression of COL11A1) + (0.973314699914422 × expression value of BDKRB2) + (0.964685342668668 × expression value of YIF1B). With the six-gene signature, the risk score for each patient with BCa in the training dataset could be calculated and ranked from the largest to the smallest. Based on the median risk score (0.630561), 224 BCa patients in the training dataset were divided into a high-risk group (n = 112) and a low-risk group (n = 112). There was an obvious difference (p = 6.6956E-08) in patients’ cancer-specific survival between the high-risk and the low-risk groups (Figure 3A). Moreover, we could observe that those ranked into the high-risk group had remarkably shorter survival (median 28.84 months) than those in the low-risk group (median 44.28 months). The time-dependent ROC curve was carried out for 3- and 5-year cancer-specific survival to evaluate the efficacy of the six-gene signature for predicting the cancer-specific survival. The AUCs for the six-gene signature at the cancer-specific survival of 3 and 5 years were 0.96 and 0.967, respectively (Figure 3D). The distribution of the risk score, cancer-specific survival time, and six genes’ expression profiles in the training dataset are shown in Figure 3G, ranked with the increasing risk score. We could find that high-risk patients lived shorter than low-risk patients, and meanwhile, the expression level of patients had a similar trend in five genes (CDK4, E2F7, COL11A1, BDKRB2, and YIF1B), elevating with the increasing risk score, while ZNF415 demonstrated the opposite trend.
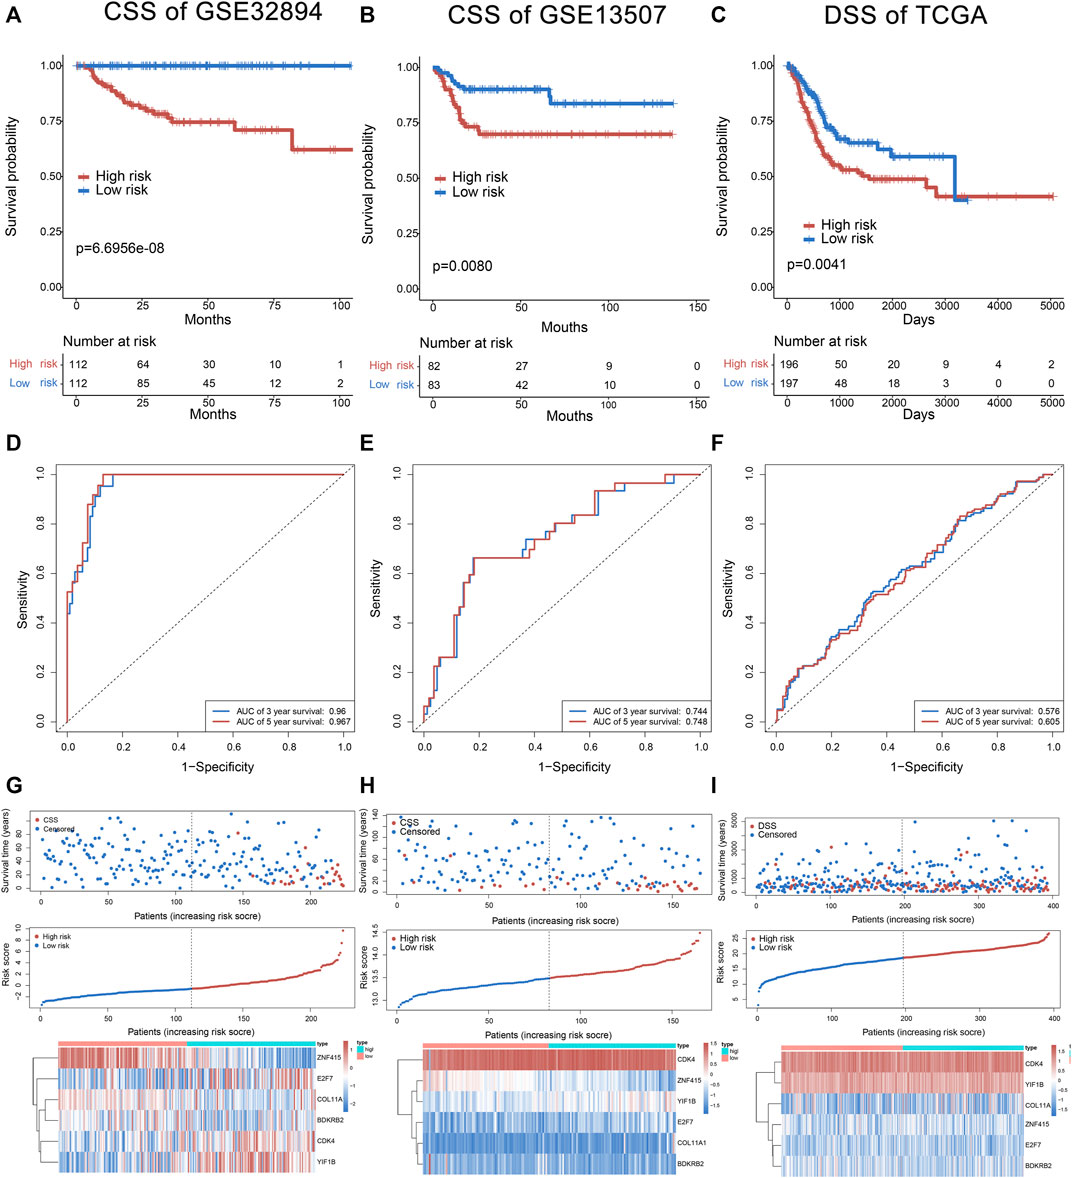
FIGURE 3. The six-gene signature in the prognosis of cancer-specific survival of bladder cancer patients in the training set and test sets (GSE13507 and TCGA). The Kaplan–Meier curves of survival between high-risk and low-risk patients in the training set and test sets (A–C). The ROC curve for survival prediction by the six-gene signature within 3 and 5 years as the defining point in the training set and test sets (D–F). The six-gene risk score distribution, survival of patients, and heatmap of the six-gene expression profiles in the training set and test sets (G–I).
3.3 Validation of the Six-Gene Signature in the Test Sets
Cancer-specific survival of GSE13507 was utilized to test and verify the prognostic efficacy of the six-gene signature for cancer-specific survival prediction; 165 patients of the test set (GSE13507) were classified into the high-risk group (n = 83) and low-risk group (n = 82) according to the same formula generating from GSE32894. The result showed a significant difference (p = 0.0080; median 29.37 vs. 46.835 months) in cancer-specific survival between high-risk and low-risk groups (Figure 3B). The AUC for the six-gene signature was 0.744 and 0.748 at the cancer-specific survival of 3 and 5 years, respectively, in the test set (GSE13507) (Figure 3E). The distribution of the risk score, cancer-specific survival time, and six genes’ expression profiles in the test set of GSE13507 are shown in Figure 3H, ranked with the increasing risk score. In addition, the disease-specific survival of TCGA was used to verify the accuracy of the six-gene signature. As shown in Figure 3C, patients in high risk had a lower survival rate than those in low risk (p = 0.0041). The AUC for the six-gene signature was 0.576 and 0.606 at the disease-specific survival of 3 and 5 years, respectively (Figure 3F). The distribution of the risk score, disease-specific survival time, and six genes’ expression profiles in TCGA are shown in Figure 3I. Above all, the results indicated the good reliability and reproducibility of the six-gene prognostic model for forecasting cancer-specific survival for patients with BCa.
3.4 Independent Prognostic Analysis of Prognostic Signature
In order to explore whether the prognostic index is an independent prognostic factor, we conducted univariate Cox regression analysis and multivariate Cox regression analysis by integrating several clinicopathological characteristics, including gender, age, tumor stage, tumor grade, and progression. The results indicated that prognostic signature was significantly associated with the cancer-specific survival of BLCA not only in univariate Cox regression analysis (p < 0.001) (Figure 4A), but also in multivariate Cox regression analysis (p < 0.001) (Figure 4B). In summary, the six-gene prognostic model can be seen as an independent prognostic indicator of BLCA.
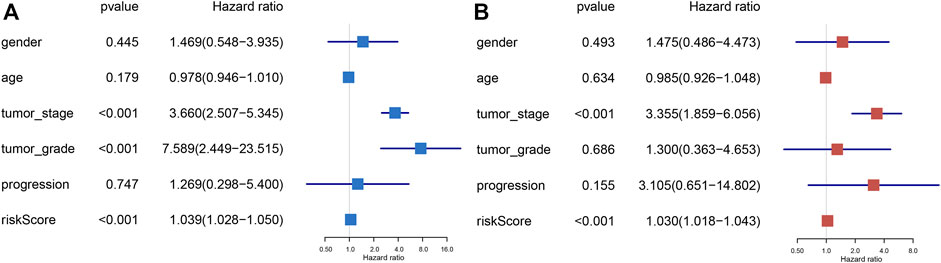
FIGURE 4. Univariate Cox and multivariate Cox regression of the prognostic signature integrating with clinical parameters, including gender, age, tumor stage, tumor grade, and progression. Univariate Cox regression analysis for signature and clinical variants (A). Multivariate Cox regression analysis for signature and clinical features (B).
3.5 Clinicopathological Correlation Analysis of Prognostic Signature
Subsequently, the correlation of the six-gene signature with clinicopathological features and its prognostic significance were analyzed in the training set and two test sets. We observed that the signature was significantly correlated with BCa divided by T-stage in GSE32894 and GSE13507 (Figures 5A,D) grade in all sets (Figures 5B,E,H). In addition, we found that it was also associated with molecular subtype in GSE32894 (Figure 5C), pathological stage in TCGA (Figure 5G) and progression in test sets GSE13507 (Figure 5F) and TCGA (Figure 5I).
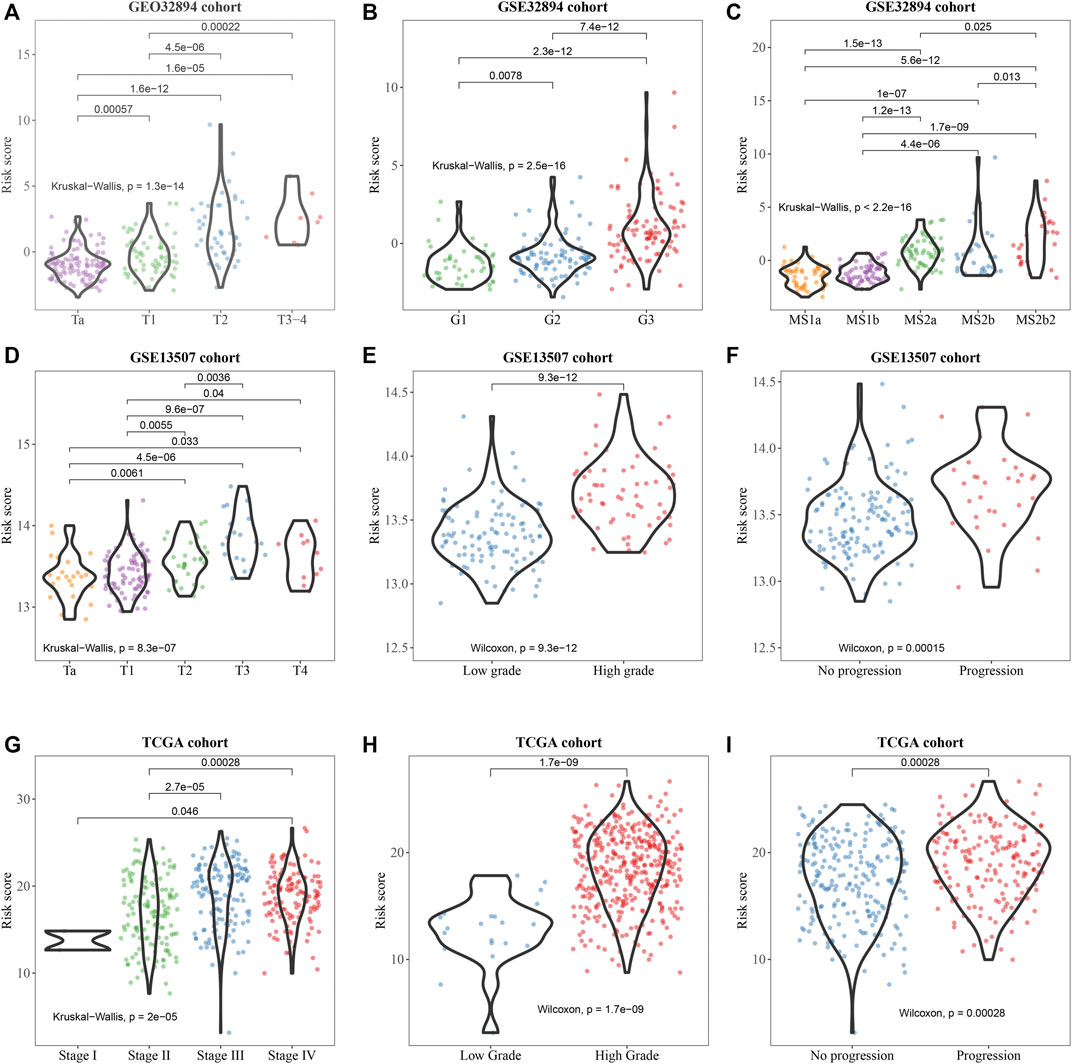
FIGURE 5. Clinicopathological significance of the prognostic signature of bladder cancer in the training set (GSE32894) and test sets (GSE13507 and TCGA). p values were statistically significant at T-stage (A, D), grade (B, E, H), molecular subtype (C), pathological stage (G), and progression (F, I).
3.6 Stratified Analyses of the Six-Gene Signature for Cancer-Specific Survival Prediction of Other Clinical Characteristics
Furthermore, to assess the prognostic value of the six-gene index, the stratified analyses were performed by using clinical information including age, gender, tumor grade, tumor stage, node status, and tumor progression. All 224 BCa patients were firstly stratified by age into the younger dataset (<65 years old, n = 70) and the elder dataset (≥65 years old, n = 154), by gender into a female dataset (n = 61) and male dataset (n = 163), and by tumor grade into grade 1–2 (n = 129) and grade 3 (n = 93). The prognostic power of the six-gene signature was significant in the younger dataset, the elder dataset, the female dataset, the male dataset, the grade 1–2 dataset, and the grade 3 dataset (Figures 6A–F). Based on the tumor stage, patients were categorized into low stage (Ta and T1, n = 173) and high stage (T2–T4, n = 51). Meanwhile, patients were also stratified by node status into N0 (n = 26) and N+ (n = 20) and by tumor progression status into non-tumor progression dataset (n = 211) and tumor progression dataset (n = 13). Interestingly, a similar significant prognostic value could be observed in the high-stage dataset and patients without progression dataset (Figures 6H,I). Otherwise, the prognosis of the low-stage dataset, and N0 and N+ and tumor progression datasets had no significance (data not shown), which may be due to the limited patients.
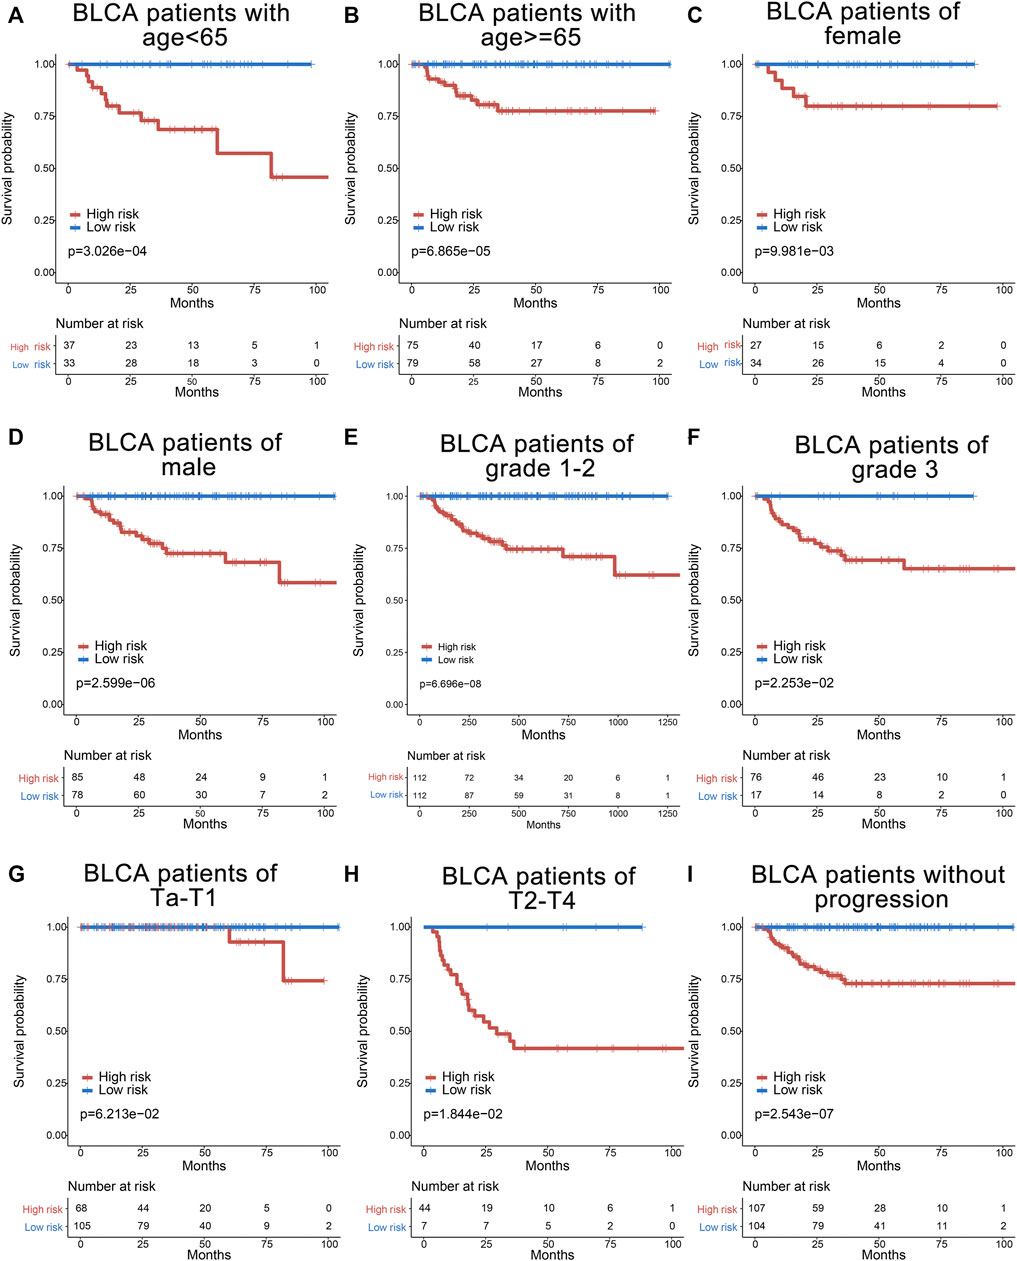
FIGURE 6. Survival analyses of bladder cancer patients stratified by age, gender, grade, T stage, and tumor progression with the six-gene signature in GSE32894. The Kaplan–Meier curves for the young (age <65) and old (age ≥65) groups (A,B), for the female and male patients (C,D), for the grade 1–2 and grade 3 groups (E,F), for the low stage (Ta and T1) and high stage (T2–T4) groups (G,H), and for the non-progression (without progression to higher stage or grade) group (I).
3.7 DEGs for High- and Low-Risk Patients
To investigate the potential function of the six prognostic genes, samples in the training set GSE32894 were divided into two groups according to the risk score. Under the threshold of FDR < 0.05 and |log2 FC| > 1, a total of 82 DEGs were screened (54 downregulated and 28 upregulated). The volcano plot presented the differential expressed signatures between high- and low-risk groups (Figure 7A).
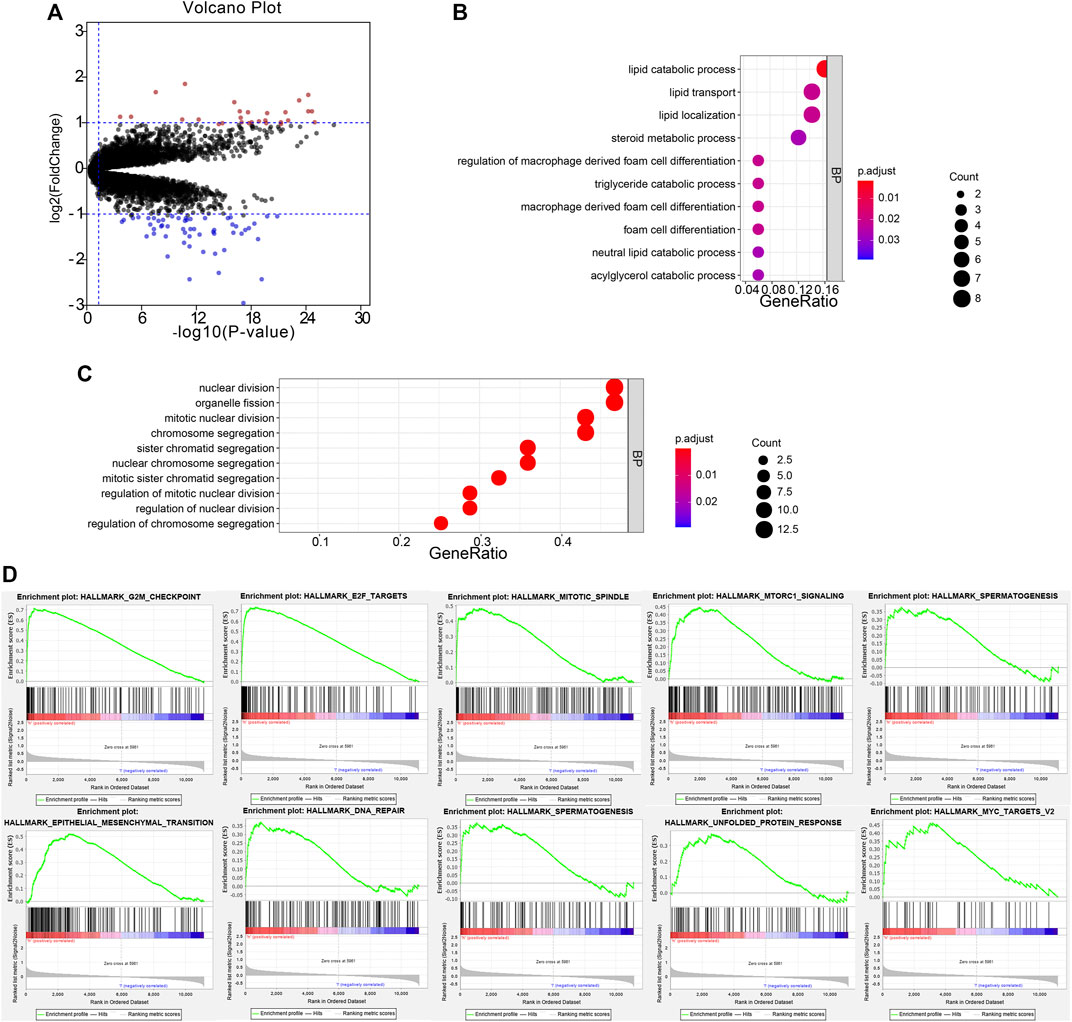
FIGURE 7. Functional annotation of DEGs. The volcano plot based on the differentially expressed genes (A). Biological process analysis of the remarkable association of down- and upregulated genes (B,C). The top 10 enriched pathways in the high-risk group were analyzed by gene set enrichment analysis (D).
3.8 Functional Annotation of the DEGs
The biological process of down- and upregulated genes between high- and low-risk groups is visualized in Figures 6B,C, respectively. In the low-risk group, the biological process was enriched in lipid catabolic process, lipid transport, lipid localization, steroid metabolic process, regulation of macrophage-derived foam cell differentiation, triglyceride catabolic process, macrophage-derived foam cell differentiation, foam cell differentiation, neutral lipid catabolic process, and acylglycerol catabolic process. In the high-risk group, the biological processes were significantly enriched in the nuclear division, organelle fission, mitotic nuclear division, chromosome segregation, sister chromatid segregation, nuclear chromosome segregation, mitotic sister chromatid segregation, regulation of mitotic nuclear division, regulation of nuclear division, and regulation of chromosome segregation. Moreover, GSEA analysis was performed, and it revealed that high-risk samples were enriched in G2/M checkpoint, E2F targets, mitotic spindle, mTOR signaling, spermatogenesis, EMT, DNA repair, PI3K/AKT/mTOR signaling, UPR, and MYC targets V2 (Figure 7D).
3.9 Relative Expression of Six Genes in Bladder Cell Line and for BCa Cell Lines
The results of qRT-PCR and expression profiles between the normal bladder and BCa tissues of six signatures are shown in Figure 7. Compared with normal bladder epithelial cell line (SV-HUV-1), the level of CDK4, E2F7, COL11A1, BDKRB2, and YIF1B was upregulated in most BCa cell lines (Figures 8A,C,E,G,I). On the contrary, the level of ZNF415 (Figure 7K) was downregulated, compared with SV-HUV-1, which were in line with our above contents. In GEPIA2, the expression of CDK4, E2F7, COL11A1, and YIF1B was upregulated in BCa tissues compared with normal bladder tissues (Figures 8B,D,F,J), while the level of BDKRB2 and ZNF415 showed an opposite outcome (Figures 7H,L). FDR < 0.05 and |log2 FC| > 1 were used as thresholds for judging the significance of gene expression differences in GEPIA2. The results of qRT-PCR were roughly in line with the consequences of GEPIA2 and our above contents that higher expression was related with shorter survival, such as CDK4 and E2F7, and that higher expression was connected with longer survival, for instance, ZNF415.
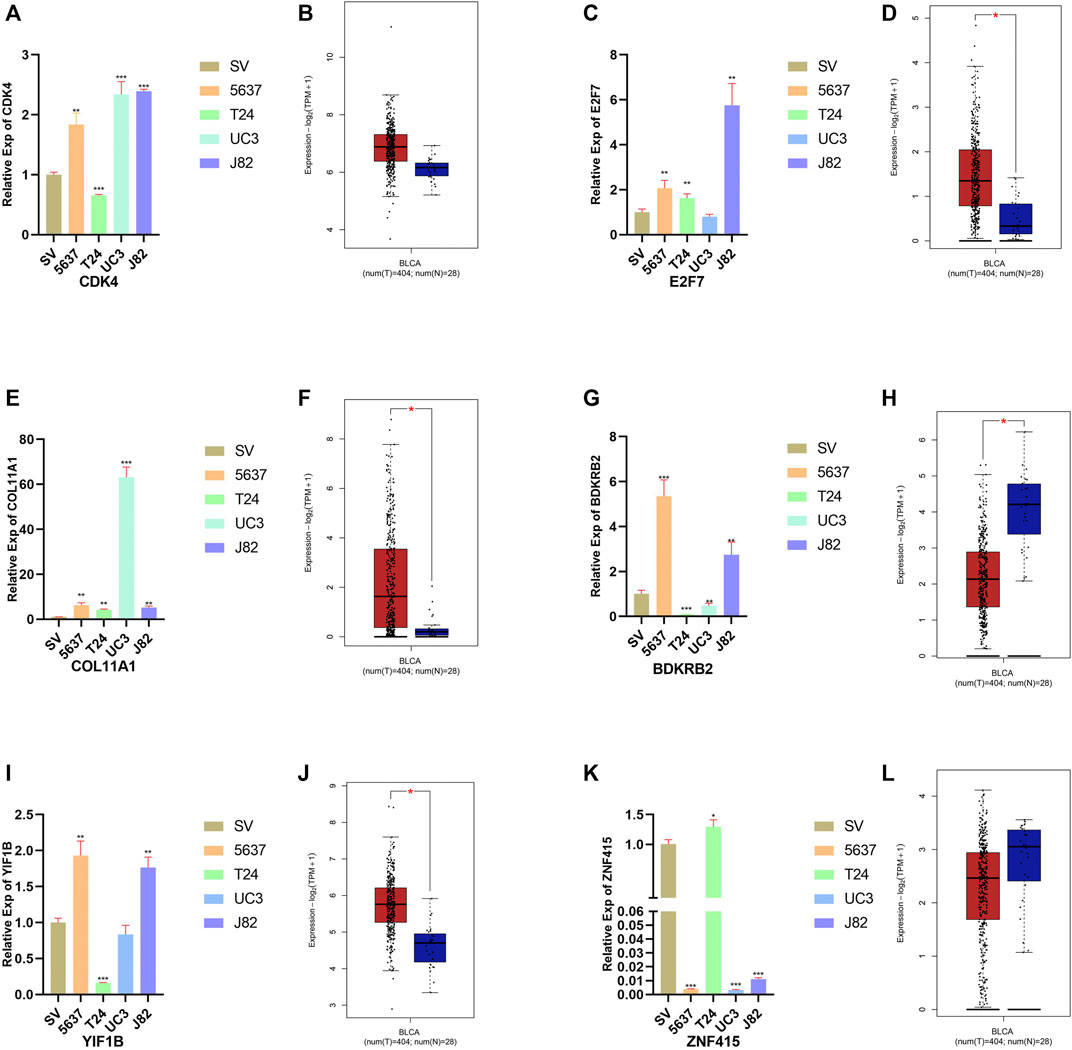
FIGURE 8. Relative expression of six signatures in the bladder cell line and four BCa cell lines. Expression of CDK4, E2F7, COL11A1, BDKRB2, YIF1B, and ZNF415 in the bladder cell line (SV-HUV-1 (SV in short)) and four BCa cell lines (5637, T24, UM-UC3 (UC3 in short), and J82) (A, C, E, G, I, K). Relative expression of CDK4, E2F7, COL11A1, BDKRB2, YIF1B, and ZNF415 in normal bladder and BCa cancer tissues in GEPIA2 (B, D, F, H, J, L).
4 Discussion
With the development of molecular biomarkers, like tumoral suppressors or oncogenes, which are less expensive and less invasive, we could detect human BCa or predict patients’ outcomes more easily. Additionally, together with the currently used cystoscopy, patients could be provided a better chance for appropriate therapies.
We identified six genes (CDK4, E2F7, COL11A1, BDKRB2, YIF1B, and ZNF415) that were significantly associated with BCa prognosis and developed a six-gene signature. Based on the six-gene signature, we observed that patients in the high-risk group had shorter cancer-specific survival than the low-risk group. Furthermore, the high-risk group also showed worse cancer-specific survival than the low-risk group in patients with other clinical features (age, gender, tumor grade, tumor stage and node status, and tumor progression). In addition, the results of univariate Cox regression and multivariate Cox regression analysis showed that the six-gene prognostic signature was an independent prognostic factor of BLCA.
All of the six genes have vital functions. CDK4, a Ser/Thr protein kinase family member and its partner CDK6, is a key player in cell cycle progression (Sheppard and McArthur, 2013). It is reported that CDKs could induce genomic and chromosomal instability and unscheduled proliferation, which attach great importance to oncogenesis (Malumbres and Barbacid, 2009). E2F7, a member of the E2F family, plays an essential role in regulating the cell cycle (Chen et al., 2009). It is also reported that E2F7 is a unique repressor of a subset of E2F target genes whose products are required for cell cycle progression (Di Stefano et al., 2003). Mitxelena et al. reported that E2F7 controlled a new regulatory network involving transcriptional and post-transcriptional mechanisms to restrain cell cycle progression through repression of proliferation-promoting miRNAs (Mitxelena et al., 2016). Chu et al. demonstrated that upregulated E2F7 restrains the level of miR-15a/16 and therefore promotes Cyclin E1 and Bcl-2, thereby bringing out tamoxifen resistance. COL11A1 is a part of type XI collagen, which acts as a vital role in skeletal development. Other studies have shown that high expression of COL11A1 is related to poor clinical prognosis in diverse cancers. Overexpression of COL11A1 could accelerate cancer cell proliferation, invasion, migration, and metastasis, and resist chemotherapy sensitivity (Cheon et al., 2014; Wu et al., 2014; Wu et al., 2019; Wang et al., 2020; Nallanthighal et al., 2021). BDKRB2, an angiogenesis-related gene, demonstrated as a direct IRX1 target gene and was reported to be involved in gastric cancer progression (Jiang et al., 2011). A previous study revealed that bradykinin could upregulate the levels of TRPM7 and MMP2 to promote the invasion and migration of hepatocellular carcinoma cells (Chen et al., 2016). YIF1B is a gene related to nervous development, whose mutation could lead to neurodevelopmental syndrome (Diaz et al., 2020). With the development of bioinformatics, YIF1B was gradually exploited to predict clinical prognosis for cancer patients (Liu et al., 2020; Jia et al., 2021). ZNF415, a member of zinc finger proteins, was reported to play an essential role in AP-1 and p53-mediated transcriptional activity regulation (Cheng et al., 2006). In addition, Omura et al. observed that ZNF415, as a methylated promoter, is involved in pancreatic adenocarcinoma (Omura et al., 2008).
In the test set, we could observe that five (CDK4, E2F7, BDKRB2, YIF1B, and ZNF415) of these six signatures were differentially expressed between BCa tissues and normal bladder tissues. Moreover, CDK4 and YIF1B were discovered as the biomarkers to distinguish the recurrent BCa and BCa.
To further study the potential function, GO analysis and GSEA were performed. GO biological process enrichment analysis for differentially expressed genes between high- and low-risk groups indicated that the lipid metabolic process and associated terms were enriched in the low-risk group, whereas cell division and interrelated terms were enriched in the high-risk group. Cell division is essential for tumor development and progression. Many times, cell divisions were asymmetric, containing protein content, cell size, or developmental potential, leading to cancer incidence and other diseases (Chia et al., 2008; Neumuller and Knoblich, 2009). Because DNA is the only cellular component that can accumulate and transmit changes throughout life (from zygote to death), it was soon accepted that carcinogenesis of cancer requires a multi-step accumulation of DNA (López-Lázaro, 2018). Conferring to the GSEA analysis, we found that the G2/M checkpoint, E2F targets, and mitotic spindle, which regulated the cell cycle, were enriched. Meanwhile, other functional pathways were enriched either. mTOR signaling activated protein synthesis by phosphorylating 4E-BP1 and S6K1 (Holz, 2012); regulated metabolic pathways on transcriptional, translational, and posttranslational levels (Peng et al., 2002); promoted lipid and cholesterol synthesis (Porstmann et al., 2008); and was involved in autophagy (Codogno and Meijer, 2005), which was essential for the cancer progression. EMT signaling pathway was closely related to the progress of cancer, which promoted the mobility, invasion, and resistance to apoptotic stimuli to accelerate the metastasis of cancer cells (Mittal, 2018; Lu and Kang, 2019). DNA repair was crucial to maintain the survival and growth of cells. Lack of DNA repair pathway led to the change of genome, which favored cancer cell proliferation (Klinakis et al., 2020). The PI3K/AKT/mTOR signaling pathway was implicated in a wide spectrum of cancers, neurological diseases, and proliferative disorders (Alayev and Holz, 2013). The PI3K/AKT/mTOR pathway regulated cell proliferation, growth, cell size, metabolism, and motility (Alzahrani, 2019). UPR was the potential driver for cancer and other chronic metabolic diseases. UPR delivered the information of protein folding status to the nucleus and cytosol to induce cell apoptosis when the body is in a state of chronic injury and consumption (Hetz et al., 2020). MYC was demonstrated to promote cell proliferation. High targets V2 was able to act as an indicator to predict the clinical prognosis (Schulze et al., 2020).
The six-gene prognostic model can effectively predict the prognosis of patients with BCa and may provide a clinical setting for individualized treatment of BCa in the future. Moreover, we verified the relative expression of these six signatures between the bladder cell line and four BCa cell lines by qRT-PCR. However, we have to admit that our research is insufficient. First of all, we only have TCGA and one GEO dataset to validate the prognostic index, and we have not further validated our model through other databases such as ICGC and Oncomine. In addition, the cell function experiments of the six genes in BCa have not been explored in depth.
5 Conclusion
In conclusion, those six genes are able to distinguish human BCa tissues and normal tissues, and their expression signature combination could also possess a predictive ability for the cancer-specific prognosis.
Data Availability Statement
The datasets presented in this study can be found in online repositories. The names of the repository/repositories and accession number(s) can be found in the article/Supplementary Material.
Author Contributions
FX, QT, LJ, and YX conceived and designed the study. FX and QT performed the analysis procedures. FX, QT, YW, GW, KQ, LJ, and YX analyzed the results. FX, QT, and YX contributed analysis tools. FX, QT, GW, KQ, LJ, and YX contributed to the writing of the manuscript. All authors reviewed the manuscript.
Funding
This work was funded by the Fundamental Research Funds for the Central Universities (2042021kf1049 and 2042021kf1050), the Science and Technology Department of Hubei Province Key Project (2018ACA159), the Medical Science Advancement Program (Clinical Medicine) of Wuhan University (TFLC2018002), the Chinese Central Special Fund for Local Science and Technology Development of Hubei Province (2018ZYYD023), the research fund from medical Sci-Tech innovation platform of Zhongnan Hospital, Wuhan University (PTXM2021023), and the Improvement Project for Theranostic Ability on Difficulty Miscellaneous Disease (Tumor) from the National Health Commission of China (ZLYNXM202006).
Conflict of Interest
The authors declare that the research was conducted in the absence of any commercial or financial relationships that could be construed as a potential conflict of interest.
Publisher’s Note
All claims expressed in this article are solely those of the authors and do not necessarily represent those of their affiliated organizations, or those of the publisher, the editors, and the reviewers. Any product that may be evaluated in this article, or claim that may be made by its manufacturer, is not guaranteed or endorsed by the publisher.
Acknowledgments
We would like to express our gratitude to Kanehisa Laboratory for developing the KEGG database and offering the original source of KEGG pathway images. We also would like to appreciate the GEO, TCGA, and GEPIA databases for free use.
Supplementary Material
The Supplementary Material for this article can be found online at: https://www.frontiersin.org/articles/10.3389/fgene.2021.758612/full#supplementary-material
Abbreviations
BCa, Bladder cancer; CSS, Cancer-specific survival; DEG, Differentially expressed gene; DSS, Disease-specific survival; FC, Fold change; FDR, False discovery rate; GEO, Gene Expression Omnibus; GEPIA, Gene Expression Profiling Interactive Analysis; GSEA, Gene Set Enrichment Analysis; ICGC, International Cancer Genome Consortium; qRT-PCR, Quantitative real-time PCRRMA, Robust Multi-array Average; ROC curve, Receiver operating characteristic curve; SAM, Significance Analysis of Microarrays; TCGA, The Cancer Genome Atlas.
References
Alayev, A., and Holz, M. K. (2013). mTOR Signaling for Biological Control and Cancer. J. Cel. Physiol. 228 (8), 1658–1664. doi:10.1002/jcp.24351
Alzahrani, A. S. (2019). PI3K/Akt/mTOR Inhibitors in Cancer: At the Bench and Bedside. Semin. Cancer Biol. 59, 125–132. doi:10.1016/j.semcancer.2019.07.009
Barrett, T., Wilhite, S. E., Ledoux, P., Evangelista, C., Kim, I. F., Tomashevsky, M., et al. (2013). NCBI GEO: Archive for Functional Genomics Data Sets-Uupdate. Nucleic Acids Res. 41 (Database issue), D991–D995. doi:10.1093/nar/gks1193
Cancer Genome Atlas Research, N. (2014). Comprehensive Molecular Characterization of Gastric Adenocarcinoma. Nature 513 (7517), 202–209. doi:10.1038/nature13480
Cao, J., Yang, X., Li, J., Wu, H., Li, P., Yao, Z., et al. (2019). Screening and Identifying Immune-Related Cells and Genes in the Tumor Microenvironment of Bladder Urothelial Carcinoma: Based on TCGA Database and Bioinformatics. Front. Oncol. 9, 1533. doi:10.3389/fonc.2019.01533
Chen, H.-Z., Tsai, S.-Y., and Leone, G. (2009). Emerging Roles of E2Fs in Cancer: an Exit from Cell Cycle Control. Nat. Rev. Cancer 9 (11), 785–797. doi:10.1038/nrc2696
Chen, W., Zheng, R., Zeng, H., Zhang, S., and He, J. (2015). Annual Report on Status of Cancer in China, 2011. Chin. J. Cancer Res. 27 (1), 2–12. doi:10.3978/j.issn.1000-9604.2015.01.06
Chen, Y., Yu, Y., Sun, S., Wang, Z., Liu, P., Liu, S., et al. (2016). Bradykinin Promotes Migration and Invasion of Hepatocellular Carcinoma Cells through TRPM7 and MMP2. Exp. Cel Res. 349 (1), 68–76. doi:10.1016/j.yexcr.2016.09.022
Cheng, Y., Wang, Y., Li, Y., Deng, Y., Hu, J., Mo, X., et al. (2006). A Novel Human Gene ZNF415 with Five Isoforms Inhibits AP-1- and P53-Mediated Transcriptional Activity. Biochem. Biophysical Res. Commun. 351 (1), 33–39. doi:10.1016/j.bbrc.2006.09.161
Cheon, D.-J., Tong, Y., Sim, M.-S., Dering, J., Berel, D., Cui, X., et al. (2014). A Collagen-Remodeling Gene Signature Regulated by TGF-β Signaling Is Associated with Metastasis and Poor Survival in Serous Ovarian Cancer. Clin. Cancer Res. 20 (3), 711–723. doi:10.1158/1078-0432.ccr-13-1256
Chia, W., Somers, W. G., and Wang, H. (2008). Drosophila Neuroblast Asymmetric Divisions: Cell Cycle Regulators, Asymmetric Protein Localization, and Tumorigenesis. J. Cel Biol 180 (2), 267–272. doi:10.1083/jcb.200708159
Codogno, P., and Meijer, A. J. (2005). Autophagy and Signaling: Their Role in Cell Survival and Cell Death. Cell Death Differ 12 (Suppl. 2), 1509–1518. doi:10.1038/sj.cdd.4401751
Croken, M. M., Qiu, W., White, M. W., and Kim, K. (2014). Gene Set Enrichment Analysis (GSEA) of Toxoplasma Gondii Expression Datasets Links Cell Cycle Progression and the Bradyzoite Developmental Program. BMC Genomics 15, 515. doi:10.1186/1471-2164-15-515
Cui, J., Yin, Y., Ma, Q., Wang, G., Olman, V., Zhang, Y., et al. (2015). Comprehensive Characterization of the Genomic Alterations in Human Gastric Cancer. Int. J. Cancer 137 (1), 86–95. doi:10.1002/ijc.29352
Di Stefano, L., Jensen, M. R., and Helin, K. (2003). E2F7, a Novel E2F Featuring DP-independent Repression of a Subset of E2F-Regulated Genes. EMBO J. 22 (23), 6289–6298. doi:10.1093/emboj/cdg613
Diaz, J., Gérard, X., Emerit, M.-B., Areias, J., Geny, D., Dégardin, J., et al. (2020). YIF1B Mutations Cause a post-natal Neurodevelopmental Syndrome Associated with Golgi and Primary Cilium Alterations. Brain 143 (10), 2911–2928. doi:10.1093/brain/awaa235
Hetz, C., Zhang, K., and Kaufman, R. J. (2020). Mechanisms, Regulation and Functions of the Unfolded Protein Response. Nat. Rev. Mol. Cel Biol 21 (8), 421–438. doi:10.1038/s41580-020-0250-z
Holz, M. K. (2012). The Role of S6K1 in ER-Positive Breast Cancer. Cell Cycle 11 (17), 3159–3165. doi:10.4161/cc.21194
Jia, L., Ling, Y., Li, K., Zhang, L., Wang, Y., and Kang, H. (2021). A 10-Gene Signature for Predicting the Response to Neoadjuvant Trastuzumab Therapy in HER2-Positive Breast Cancer. Clin. Breast Cancer. doi:10.1016/j.clbc.2021.04.010
Jiang, J., Liu, W., Guo, X., Zhang, R., Zhi, Q., Ji, J., et al. (2011). IRX1 Influences Peritoneal Spreading and Metastasis via Inhibiting BDKRB2-dependent Neovascularization on Gastric Cancer. Oncogene 30 (44), 4498–4508. doi:10.1038/onc.2011.154
Kim, W.-J., Kim, E.-J., Kim, S.-K., Kim, Y.-J., Ha, Y.-S., Jeong, P., et al. (2010). Predictive Value of Progression-Related Gene Classifier in Primary Non-muscle Invasive Bladder Cancer. Mol. Cancer 9, 3. doi:10.1186/1476-4598-9-3
Klinakis, A., Karagiannis, D., and Rampias, T. (2020). Targeting DNA Repair in Cancer: Current State and Novel Approaches. Cell. Mol. Life Sci. 77 (4), 677–703. doi:10.1007/s00018-019-03299-8
Lee, J.-S., Leem, S.-H., Lee, S.-Y., Kim, S.-C., Park, E.-S., Kim, S.-B., et al. (2010). Expression Signature ofE2F1and its Associated Genes Predict Superficial to Invasive Progression of Bladder Tumors. J. Clin. Oncol. 28 (16), 2660–2667. doi:10.1200/jco.2009.25.0977
Liu, J., Chen, Z., Zhao, P., and Li, W. (2020). Prognostic and Immune Regulating Roles of YIF1B in Pan-Cancer: a Potential Target for Both Survival and Therapy Response Evaluation. Biosci. Rep. 40 (7), BSR20201384. doi:10.1042/BSR20201384
Liu, J., Lichtenberg, T., Hoadley, K. A., Poisson, L. M., Lazar, A. J., Cherniack, A. D., et al. (2018). An Integrated TCGA Pan-Cancer Clinical Data Resource to Drive High-Quality Survival Outcome Analytics. Cell 173 (2), 400–416.e11. doi:10.1016/j.cell.2018.02.052
López-Lázaro, M. (2018). The Stem Cell Division Theory of Cancer. Crit. Rev. Oncol/Hematol. 123, 95–113. doi:10.1016/j.critrevonc.2018.01.010
Lu, W., and Kang, Y. (2019). Epithelial-Mesenchymal Plasticity in Cancer Progression and Metastasis. Develop. Cel 49 (3), 361–374. doi:10.1016/j.devcel.2019.04.010
Malumbres, M., and Barbacid, M. (2009). Cell Cycle, CDKs and Cancer: a Changing Paradigm. Nat. Rev. Cancer 9 (3), 153–166. doi:10.1038/nrc2602
Mittal, V. (2018). Epithelial Mesenchymal Transition in Tumor Metastasis. Annu. Rev. Pathol. Mech. Dis. 13, 395–412. doi:10.1146/annurev-pathol-020117-043854
Mitxelena, J., Apraiz, A., Vallejo-Rodríguez, J., Malumbres, M., and Zubiaga, A. M. (2016). E2F7 Regulates Transcription and Maturation of Multiple microRNAs to Restrain Cell Proliferation. Nucleic Acids Res. 44 (12), 5557–5570. doi:10.1093/nar/gkw146
Nallanthighal, S., Heiserman, J. P., and Cheon, D. J. (2021). Collagen Type XI Alpha 1 (COL11A1): A Novel Biomarker and a Key Player in Cancer. Cancers (Basel) 13 (5), 935. doi:10.3390/cancers13050935
Neumuller, R. A., and Knoblich, J. A. (2009). Dividing Cellular Asymmetry: Asymmetric Cell Division and its Implications for Stem Cells and Cancer. Genes Dev. 23 (23), 2675–2699. doi:10.1101/gad.1850809
Omura, N., Li, C.-P., Li, A., Hong, S.-M., Walter, K., Jimeno, A., et al. (2008). Genome-wide Profiling at Methylated Promoters in Pancreatic Adenocarcinoma. Cancer Biol. Ther. 7 (7), 1146–1156. doi:10.4161/cbt.7.7.6208
Pang, C., Guan, Y., Li, H., Chen, W., and Zhu, G. (2016). Urologic Cancer in China. Jpn. J. Clin. Oncol. 46 (6), 497–501. doi:10.1093/jjco/hyw034
Peng, T., Golub, T. R., and Sabatini, D. M. (2002). The Immunosuppressant Rapamycin Mimics a Starvation-like Signal Distinct from Amino Acid and Glucose Deprivation. Mol. Cel Biol 22 (15), 5575–5584. doi:10.1128/mcb.22.15.5575-5584.2002
Porstmann, T., Santos, C. R., Griffiths, B., Cully, M., Wu, M., Leevers, S., et al. (2008). SREBP Activity Is Regulated by mTORC1 and Contributes to Akt-dependent Cell Growth. Cel Metab. 8 (3), 224–236. doi:10.1016/j.cmet.2008.07.007
Prout, G. R., Barton, B. A., Griffin, P. P., and Friedell, G. H. (1992). Treated History of Noninvasive Grade 1 Transitional Cell Carcinoma. The National Bladder Cancer Group. J. Urol. 148 (5), 1413–1419. doi:10.1016/s0022-5347(17)36924-0
Schulze, A., Oshi, M., Endo, I., and Takabe, K. (2020). MYC Targets Scores Are Associated with Cancer Aggressiveness and Poor Survival in ER-Positive Primary and Metastatic Breast Cancer. Int. J. Mol. Sci. 21 (21), 8127. doi:10.3390/ijms21218127
Seidl, C. (2020). Targets for Therapy of Bladder Cancer. Semin. Nucl. Med. 50 (2), 162–170. doi:10.1053/j.semnuclmed.2020.02.006
Sheppard, K. E., and McArthur, G. A. (2013). The Cell-Cycle Regulator CDK4: an Emerging Therapeutic Target in Melanoma. Clin. Cancer Res. 19 (19), 5320–5328. doi:10.1158/1078-0432.ccr-13-0259
Siegel, R., Naishadham, D., and Jemal, A. (2013). Cancer Statistics, 2013. CA: A Cancer J. Clinicians 63 (1), 11–30. doi:10.3322/caac.21166
Sjödahl, G., Lauss, M., Lövgren, K., Chebil, G., Gudjonsson, S., Veerla, S., et al. (2012). A Molecular Taxonomy for Urothelial Carcinoma. Clin. Cancer Res. 18 (12), 3377–3386. doi:10.1158/1078-0432.ccr-12-0077-t
Sloan, F. A., Yashkin, A. P., Akushevich, I., and Inman, B. A. (2020). The Cost to Medicare of Bladder Cancer Care. Eur. Urol. Oncol. 3 (4), 515–522. doi:10.1016/j.euo.2019.01.015
Subramanian, A., Tamayo, P., Mootha, V. K., Mukherjee, S., Ebert, B. L., Gillette, M. A., et al. (2005). Gene Set Enrichment Analysis: a Knowledge-Based Approach for Interpreting Genome-wide Expression Profiles. Proc. Natl. Acad. Sci. 102 (43), 15545–15550. doi:10.1073/pnas.0506580102
Tang, Z., Kang, B., Li, C., Chen, T., and Zhang, Z. (2019). GEPIA2: an Enhanced Web Server for Large-Scale Expression Profiling and Interactive Analysis. Nucleic Acids Res. 47 (W1), W556–W560. doi:10.1093/nar/gkz430
Wang, H., Ren, Y., Qian, C., Liu, J., Li, G., and Li, Z. (2020). Over-expression of CDX2 Alleviates Breast Cancer by Up-Regulating microRNA Let-7b and Inhibiting COL11A1 Expression. Cancer Cel Int 20, 13. doi:10.1186/s12935-019-1066-9
Wu, Y.-H., Chang, T.-H., Huang, Y.-F., Huang, H.-D., and Chou, C.-Y. (2014). COL11A1 Promotes Tumor Progression and Predicts Poor Clinical Outcome in Ovarian Cancer. Oncogene 33 (26), 3432–3440. doi:10.1038/onc.2013.307
Wu, Y.-H., Huang, Y.-F., Chen, C.-C., and Chou, C.-Y. (2019). Akt Inhibitor SC66 Promotes Cell Sensitivity to Cisplatin in Chemoresistant Ovarian Cancer Cells through Inhibition of COL11A1 Expression. Cell Death Dis 10 (4), 322. doi:10.1038/s41419-019-1555-8
Keywords: bladder cancer, biomarkers, cancer-specific survival, six-gene prognostic signature, bioinformatics analysis
Citation: Xu F, Tang Q, Wang Y, Wang G, Qian K, Ju L and Xiao Y (2021) Development and Validation of a Six-Gene Prognostic Signature for Bladder Cancer. Front. Genet. 12:758612. doi: 10.3389/fgene.2021.758612
Received: 14 August 2021; Accepted: 08 November 2021;
Published: 06 December 2021.
Edited by:
Chunquan Li, Harbin Medical University Daqing Campus, ChinaReviewed by:
Shailender Kumar Verma, Central University of Himachal Pradesh, IndiaRodrigo Ligabue-Braun, Federal University of Health Sciences of Porto Alegre, Brazil
YiHeng Du, Suzhou Kowloon Hospital, China
Copyright © 2021 Xu, Tang, Wang, Wang, Qian, Ju and Xiao. This is an open-access article distributed under the terms of the Creative Commons Attribution License (CC BY). The use, distribution or reproduction in other forums is permitted, provided the original author(s) and the copyright owner(s) are credited and that the original publication in this journal is cited, in accordance with accepted academic practice. No use, distribution or reproduction is permitted which does not comply with these terms.
*Correspondence: Yu Xiao, eXUueGlhb0B3aHUuZWR1LmNu
†These authors have contributed equally to this work