 Tamar E. Crum
 Robert D. Schnabel
 Jared E. Decker
 Jeremy F. Taylor
- 1Division of Animal Sciences, University of Missouri, Columbia, MO, United States
- 2Informatics Institute, University of Missouri, Columbia, MO, United States
Development of the American Breeds of beef cattle began in the 1920s as breeders and U. S. Experiment Station researchers began to create Bos taurus taurus × Bos taurus indicus hybrids using Brahman as the B. t. indicus source. By 1954, U.S. Breed Associations had been formed for Brangus (5/8 Angus × 3/8 Brahman), Beefmaster (½ Brahman × ¼ Shorthorn × ¼ Hereford), and Santa Gertrudis (5/8 Shorthorn × 3/8 Brahman). While these breeds were developed using mating designs expected to create base generation animals with the required genome contributions from progenitor breeds, each association has now registered advanced generation animals in which selection or drift may have caused the realized genome compositions to differ from initial expected proportions. The availability of high-density SNP genotypes for 9,161 Brangus, 3,762 Beefmaster, and 1,942 Santa Gertrudis animals allowed us to compare the realized genomic architectures of breed members to the base generation expectations. We used RFMix to estimate local ancestry and identify genomic regions in which the proportion of Brahman ancestry differed significantly from a priori expectations. For all three breeds, lower than expected levels of Brahman composition were found genome-wide, particularly in early-generation animals where we demonstrate that selection on beef production traits was likely responsible for the taurine enrichment. Using a proxy for generation number, we also contrasted the genomes of early- and advanced-generation animals and found that the indicine composition of the genome has increased with generation number likely due to selection on adaptive traits. Many of the most-highly differentiated genomic regions were breed specific, suggesting that differences in breeding objectives and selection intensities exist between the breeds. Global ancestry estimation is commonly performed in admixed animals to control for stratification in association studies. However, local ancestry estimation provides the opportunity to investigate the evolution of specific chromosomal segments and estimate haplotype effects on trait variation in admixed individuals. Investigating the genomic architecture of the American Breeds not only allows the estimation of indicine and taurine genome proportions genome-wide, but also the locations within the genome where either taurine or indicine alleles confer a selective advantage.
Introduction
Indicine cattle were first imported into the United States from India in 1906 and then from Brazil in the 1920’s and were used via crossbreeding with taurine cattle and backcrossing to develop the Bos taurus indicus Brahman (Sanders, 1980) which has very little residual Bos taurus taurus within its genome (Chan et al., 2010). The American Breeds of beef cattle are populations that were developed in the United States beginning shortly after the introduction of the B. t. indicus cattle to capitalize on breed complementarity and heterosis for production and adaptation to heat stress and the nutritional limitations, parasites, and disease-causing pathogens prevalent in the southern tier of the country (Cartwright, 1970; Dickerson, 1970). Indicine × taurine crossbred individuals have been widely produced throughout subtropical and tropical regions of the world (Porto-Neto et al., 2014; Goszczynski et al., 2018) and the use of systematic crossbreeding programs world-wide has resulted in the development of at least 46 recognized indicine × taurine breeds (https://en.wikipedia.org/wiki/List_of_cattle_breeds). Breed Associations for the American Breeds began to be formed in the 1940’s and advanced generation composite animals now exist for the older Brangus, Beefmaster, and Santa Gertrudis breeds.
Brangus cattle were derived from animals created in public and private breeding experiments involving crosses between Angus (B. t. taurus) and Brahman cattle in Oklahoma, Mississippi, Texas, and Louisiana in the 1930’s and have been stabilized at an expected genome content of ⅜ Brahman and ⅝ Angus (http://afs.okstate.edu/breeds/cattle/brangus/index.html/). The American Brangus Breeders Association was formed in 1949 but was later renamed the International Brangus Breeders Association (https://gobrangus.com/jan-17-bj-con-lilley/). Santa Gertrudis cattle were initially developed on the King Ranch in Kingsville, Texas, where experimental crossbreeding between Shorthorn (B. t. taurus), and Brahman cattle between 1910 and 1920 led to the birth of the bull “Monkey” from which all registered Santa Gertrudis cattle descend (http://afs.okstate.edu/breeds/cattle/santagertrudis/index.html). However, the utilized Brahman bulls ranged in composition from ¾ to ⅞ B. t. indicus and, consequently, the Santa Gertrudis breed is considered to have a composition of ⅜ Brahman and ⅝ Shorthorn (Rhoad, 1949; Warwick, 1958). Santa Gertrudis was recognized as a breed by the United States Department of Agriculture in 1940. The foundation animals for the Beefmaster breed were developed beginning in 1908 as cross between Brahman, Shorthorn, and Hereford (B. t. taurus) on the Lasater Ranch in Falfurrias, Texas and are now maintained at an expected pedigree proportion of ½ Brahman, ¼ Hereford, and ¼ Shorthorn (Warwick, 1958). Beefmaster was recognized as a beef breed by the United States Department of Agriculture in 1954. These American Breeds of cattle now provide an interesting opportunity to study the genomic architectures of advanced generation composites with a priori known expected genomic breed proportions based on pedigree that have been exposed to natural selection for adaptation and artificial selection for beef performance traits.
Several approaches have been developed for the estimation of local ancestry (breed of origin of the two alleles present at specific loci) in admixed individuals, however, these applications have primarily been focused on recently admixed populations. Individuals from admixed populations have chromosomes that comprise mosaics of chromosomal segments originating from each of the ancestral populations (Thornton and Bermejo, 2014). On the other hand, global ancestry estimates predict the relative proportions of the ancestral genomes present in an admixed individual, which is an average of the local ancestry estimates, and ignores information pertaining to the variability among locus-specific ancestries (Tang et al., 2005). Drift and strong selection can lead to regions of the genome with ancestries that differ significantly from breed expectation and examination of these regions may identify candidate genes that are under selection and suggest the nature of the selected phenotype. We estimated local ancestry for registered Brangus, Santa Gertrudis, and Beefmaster animals that had been genotyped with the BovineSNP50, or derivative assays, and examined the average ancestries at specific chromosomal locations to identify regions of the genome that differ from expected global proportions both within and across breeds. Using the total number of haplotypes detected in each animal’s genome as a proxy for its generation number, we also contrasted the genomes of early- and advanced-generation animals to ascertain those genomic regions which had been exposed to recurrent selection within each of the breeds.
Materials and Methods
Genotype Data
Genotype data were obtained for deidentified individuals from the International Brangus Breeders Association, Beefmaster Breeders United, and Santa Gertrudis Breeders International Breed Associations (American Breed Associations) (Table 1). These individuals had been genotyped using at least one of 8 commonly used assays including the GeneSeek (Lincoln, NE) BOVG50v1, GGP-90KT, GGP-HDV3, GGP-LDV3 and GGP-LDV4, the Illumina (San Diego, CA) BovineHD and BovineSNP50, and the Zoetis (Kalamazoo, MI) i50K. PLINK1.9 (Purcell et al., 2007) was used to filter variants and individuals. SNP positions were based on the ARS-UCD1.2 bovine reference genome assembly (Rosen et al., 2020). Non-autosomal variants were removed from the data. Variants and individuals with genotype call rates <0.90 were also removed. Genotypes were phased using Eagle 2.4 (Loh et al., 2016) with a reference panel of haplotypes for 9,937 individuals genotyped with the BovineHD (HD) assay. Phased haplotypes were then imputed to the SNP content represented in the union of the HD and GeneSeek GGP-F250 (F250) assays using Minimac3 (Das et al., 2016). The multi-breed reference set created by Rowan et al. (2019) was used for genotype imputation. The reference panel contained 2,719 animals that had been genotyped with both the F250 and the HD assays, 25,772 animals genotyped with only the F250, and 7,218 animals genotyped with only the HD assay. Following imputation, each sample had genotypes for 836,118 variants.

TABLE 1. Genotyped samples for the American Breeds.
Reference Panels
Local ancestry estimation requires a reference panel of genotypes for representatives of each ancestral population. We developed two reference panels for each American Breed. The first panel was identical for all three breeds and comprised animals registered by the American Angus Association, American Hereford Association, American Shorthorn Association, and American Brahman Breeders Association for which CRUMBLER (Crum et al., 2019) breed composition estimates were ≥85% to the respective breed (Table 2). The second reference panel was created using only individuals from the respective ancestral breeds (ANCESTRAL reference) (Table 2). Since some ancestry estimation software is influenced by unequal reference panel sample sizes (Maples et al., 2013; Crum et al., 2019), the breed possessing the smallest number of available individuals determined the approximate random sample size for the remaining breed(s). Reference panel individuals had been genotyped using one of 8 commercially available assays including the GeneSeek BOVG50v1, GGP-F250, GGP-HDV3, and GGP-LDV3, the BovineHD, BovineSNP50, i50K, and Irish Cattle Breeding Federation (Cork, Ireland) IDBv3, and were phased and imputed following the same procedures as for the American Breed individuals.
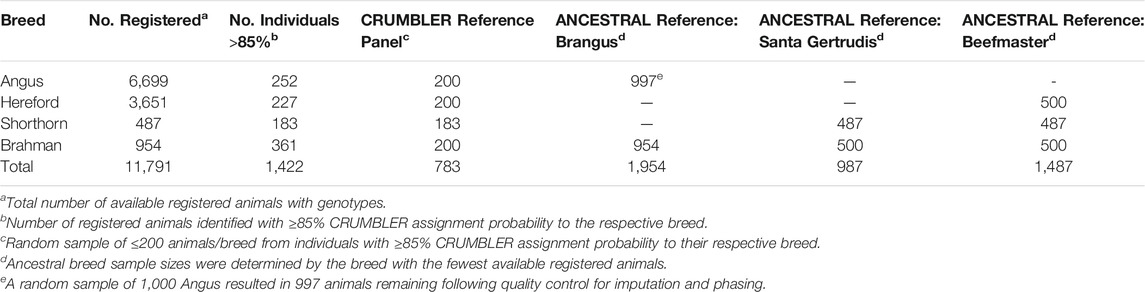
TABLE 2. Genotype data for registered individuals from 4 breeds used to generate reference panels.
Local Ancestry Estimation
Gobena et al. (2018) used ADMIXTURE to estimate ancestry in an Angus × Brahman population, however, we have previously found the software to be sensitive to the order of animals within the input files (Crum et al., 2019) and consequently we used RFMix v2.03, for local ancestry and admixture estimation (Maples et al., 2013). RFMix partitions chromosomes into non-overlapping windows and infers ancestry for each window. If contiguous windows are assigned the same ancestry, RFMix concatenates the windows resulting in a variable number of haplotypes of varying length predicted for each individual. We first inferred local ancestry with a window size of 100 SNPs (spanning an average of ∼300 kb) using two reference panels for comparison. We next examined a window size of 25 SNPs (spanning on average ∼75 kb) for the ANCESTRAL reference panel. RFMix allows the specification of the number of generations separating the query samples from the initial reference population admixture event. However, because pedigree and generation information were not provided by the American Breed Associations, we used a generation interval of 5 years and the dates of formation of each Breed Association to arrive at an estimate of a maximum of 16 generations, with an average of about 8 generations for these individuals. This reflects the fact that first generation American Breed animals are continuously being generated and registered by breeders using superior animals from the requisite foundation breeds to capture the benefits of on-going selection within the numerically larger foundational breeds.
Many of the American Breed Associations allow the registration of the purebred, F1, and back-cross animals used to create first generation registered animals to enable a complete pedigree based on consistent registration numbers within their herdbook. To determine if some of these animals may have been genotyped and provided by the Breed Associations, we removed samples assigned by CRUMBLER to be ≥ 50% Brahman or ≥ 90% Angus or Shorthorn ancestry from the Brangus and Santa Gertrudis data, respectively (Brangus, n = 297; Santa Gertrudis, n = 4). For the Beefmaster, we removed samples with ≥ 90% assignment to Shorthorn, Hereford, or Brahman to remove potential purebred founders and any samples with ≤ 5% assignment to any one of these breeds to remove potential F1 individuals (n = 10).
Generation Proxy
Genotypes used in this study were provided by the American Breed Associations with each animal’s identity anonymized and without pedigree or generation information. Since selection operates each generation, the cumulative effects of selection on a composite genome should increase with generation number. To enable the stratification of the animals within each American Breed based on generation number, we utilized the RFMix output to compute the total number of taurine and indicine haplotypes present within the diploid autosomal genome (2N = 58) of each animal and the average length of all haplotypes within the diploid genome. Under the assumption of selective neutrality, the number of haplotypes within the genome should increase each generation due to recombination and correspondingly, the average length of the haplotypes should decrease each generation. Purebred and F1 animals have 58 haplotypes represented as full length chromosomes and assuming an average of one crossover per chromosome pair each meiosis, back-cross (Purebred × F1) animals have, on average, 87 haplotypes which average ¾ of the chromosome length and F2 (F1 × F1) animals have, on average, 116 haplotypes which average ½ of the chromosome length.
Genomic Divergence From Breed Expectation
Within each of the American Breeds, for the ith window within the genome we tested the null hypothesis that Ho:
Here,
Genomic Divergence Between Early- and Advanced-Generations
Within each of the American Breeds, we sampled ∼10% of individuals with the smallest and largest number of haplotypes with their genomes to characterize early- and advanced-generation individuals, respectively. Sampling was such that all animals within a haplotype number class were included resulting in slightly unequal sample sizes. There were 918, 207, and 400 animals in the early- and 955, 213, and 423 Brangus, Santa Gertrudis, and Beefmaster animals in the advanced-generation groups, respectively.
For the ith window within the genome, we tested the null hypothesis that Ho:
Here,
Results
Reference Panels
RFMix generates three output files for each analysis: 1) the most likely reference population assignments for each haplotype found in a window, 2) the marginal probabilities of each reference population being the ancestral population of origin for the haplotypes found in the window, and 3) global diploid ancestry estimates (Maples et al., 2013). We utilized the most likely assignment files to define the breed of origin of haplotypes found within each window and then computed the relative frequencies of haplotype origin from each representative breed in each of the windows.
Following the strategy employed by Browning et al. (2016), we created two reference panels to evaluate the effects of panel size on the estimation of local ancestry. We first selected the Brahman, Angus, Hereford, and Shorthorn animals present in the CRUMBLER (Crum et al., 2019) reference panel which had been extensively developed and evaluated for use in global ancestry estimation for breeds commonly found in North America. Alternatively, for each of the American Breeds, an ANCESTRAL reference panel was created from all available registered animals. To avoid potential issues caused by unequal sample sizes, we randomly down-sampled the larger populations to the sample size for the breed with the fewest available samples (Table 2). For each of the American Breeds, the ANCESTRAL reference panel contained at least twice the number of animals from the ancestral populations than the CRUMBLER reference panel and ancestry estimates produced using the two panels were similar (Supplementary Figures S1–S3). However, the proportion of Hereford ancestry appeared to be underestimated and the proportion of Shorthorn ancestry overestimated when the CRUMBLER reference panel was used for local ancestry estimation in Beefmaster (Supplementary Figure S3). Consequently, we decided to utilize the ANCESTRAL reference panels for all further analyses.
Window Size
Since RFMix concatenates contiguous windows with the same ancestry to form extended haplotypes within individuals and considering the large number of SNPs used in this study, we were interested in whether a window size of 25 SNPs would impact the analysis in terms of resolution near recombination breakpoints or the ability to discriminate between haplotype breed of origin. Figures 1–3 show the local ancestry by chromosomal location for each of the American Breeds and are strikingly similar to the results shown in Supplementary Figures S1B, S2B, and S3B. Consequently, we conducted all further analyses using a window size of 25 SNPs.
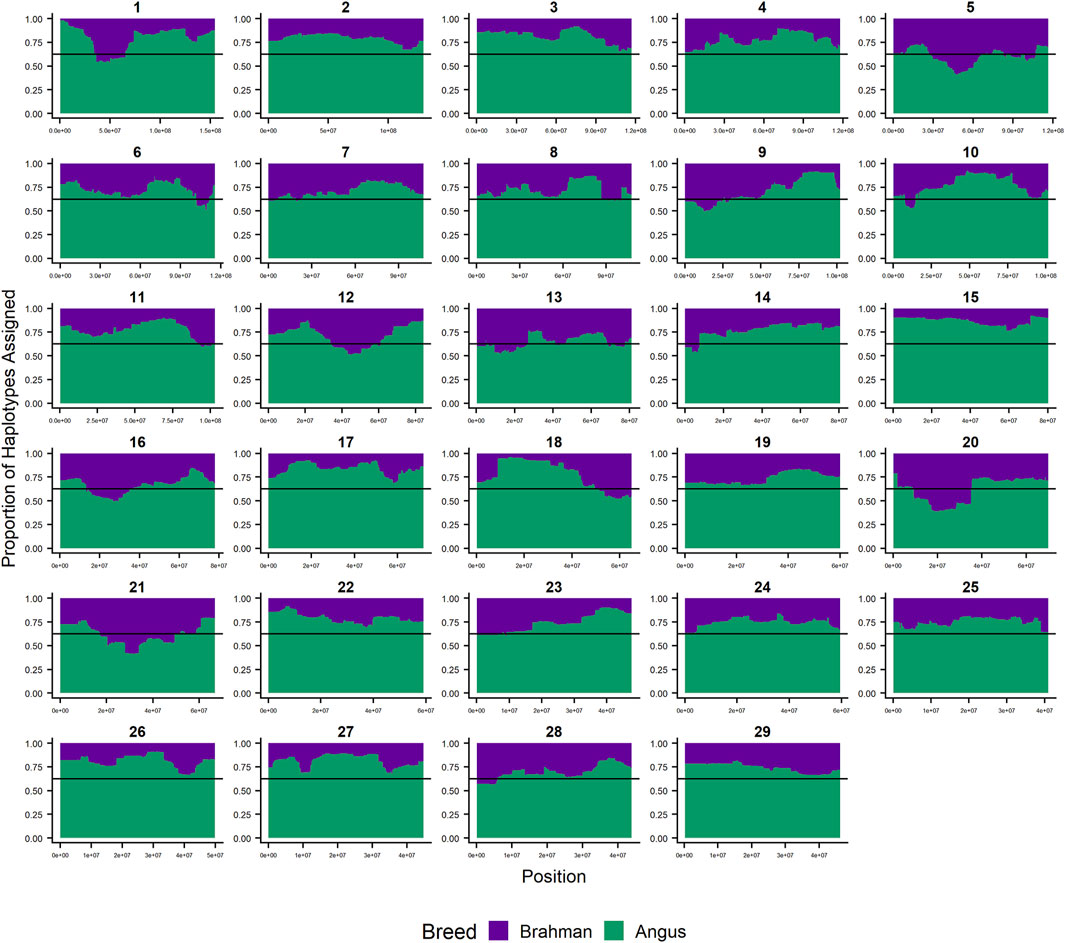
FIGURE 1. RFMix most likely assignment by chromosome for the ANCESTRAL reference panel for each 25 SNP window for Brangus. Brahman (purple) and Angus (green). Horizontal line indicates 5/8 expected Angus proportion.
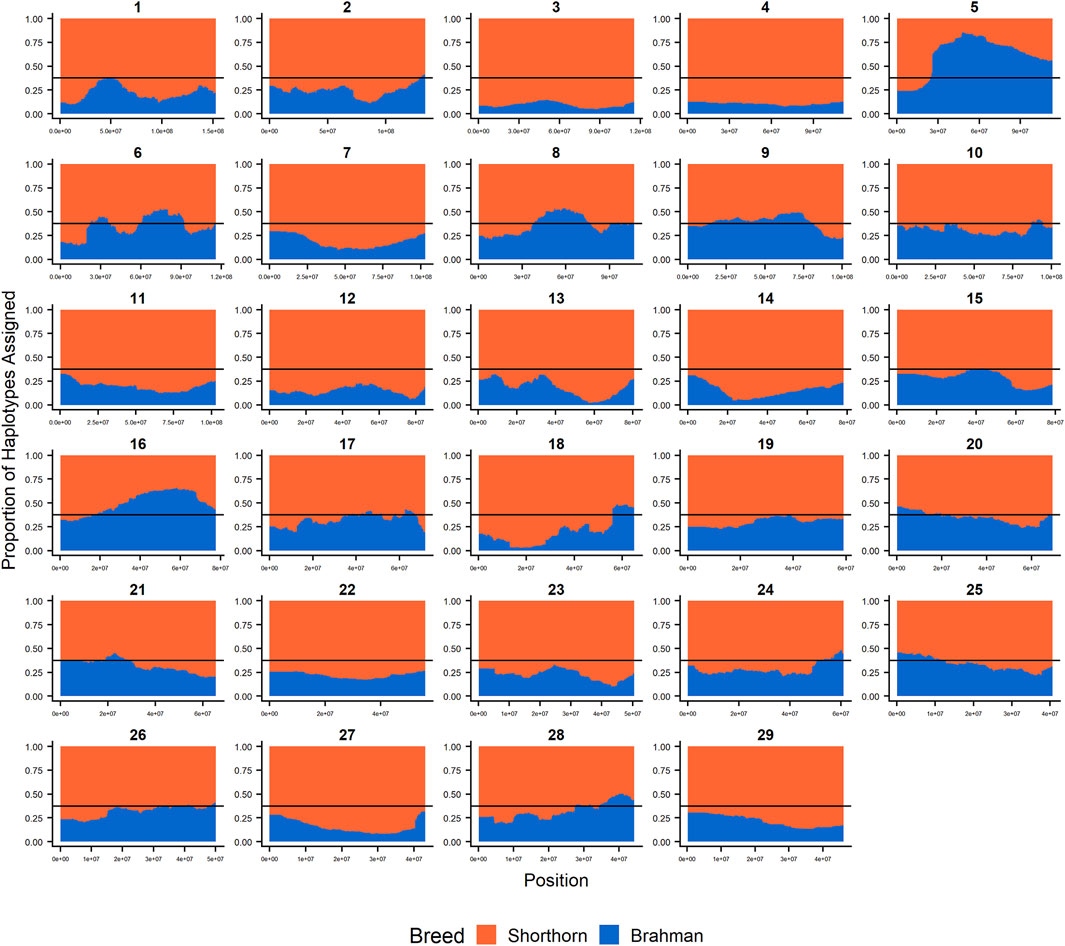
FIGURE 2. RFMix most likely assignment by chromosome for the ANCESTRAL reference panel for each 25 SNP window for Santa Gertrudis. Brahman (blue) and Shorthorn (orange). Horizontal line indicates 3/8 expected Brahman proportion.
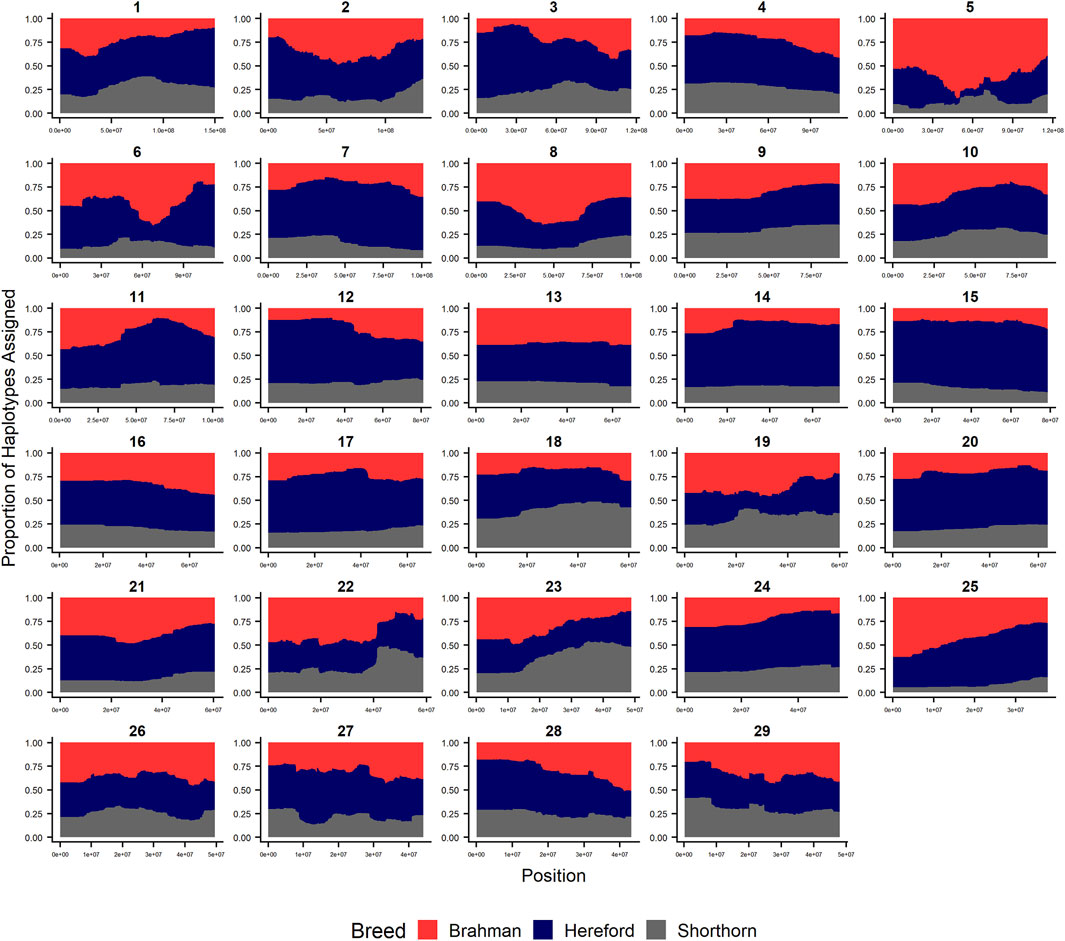
FIGURE 3. RFMix most likely assignment by chromosome for the ANCESTRAL reference panel for each 25 SNP window for Beefmaster. Brahman (red), Hereford (navy) and Shorthorn (gray). Beefmaster is expected to be ½ Brahman, ¼ Hereford and ¼ Shorthorn.
Generation Proxy
Using the RFMix output for all samples provided by the American Breed Associations (Table 2), we estimated the number of Angus, Shorthorn, Hereford, and Brahman haplotypes present within the genotyped individuals, and also the average length of these haplotypes by breed of origin. Haplotype metrics for all three of the American Breeds are presented in Supplementary Table S1 and suggest that the genomic architectures of the Brangus and Santa Gertrudis breeds are quite similar. Each breed possesses, on average, 50% more taurine than indicine haplotypes and the taurine haplotypes are almost twice the length of the indicine haplotypes.
The correlation between the number of Angus and Brahman haplotypes in each Brangus individual was 0.80, while the correlation between the number of Shorthorn and Brahman haplotypes in each Santa Gertrudis individual was 0.73. This follows our expectation that the total number of haplotypes from each of the foundation breeds increases in advanced generation animals due to recombination. However, the correlation between the number of Brahman and taurine (Shorthorn and Hereford) haplotypes in each Beefmaster individual was only 0.40. The correlation between the number of Brahman and Hereford haplotypes was 0.50 while the correlation between the number of Brahman and Shorthorn haplotypes was −0.11 suggesting that other forces such as selection may be influencing the evolution of the Beefmaster genome.
Breed Ancestry
The average Brahman genome content was 25.81 ± 8.01% (±standard deviation among sampled individuals) for Brangus and 27.60 ± 7.05% for Santa Gertrudis (Table 3), far less than the 37.5% based upon breed expectations. Likewise, the Beefmaster had considerably fewer haplotypes of Brahman origin of smaller than average length (Supplementary Table S1) resulting in an average Brahman genome content of 30.84 ± 7.48%, far less than the breed expectation of 50%. The average Shorthorn genome content in Beefmaster individuals was 22.93 ± 8.01% and the average Hereford genome content was 46.23 ± 6.00%.
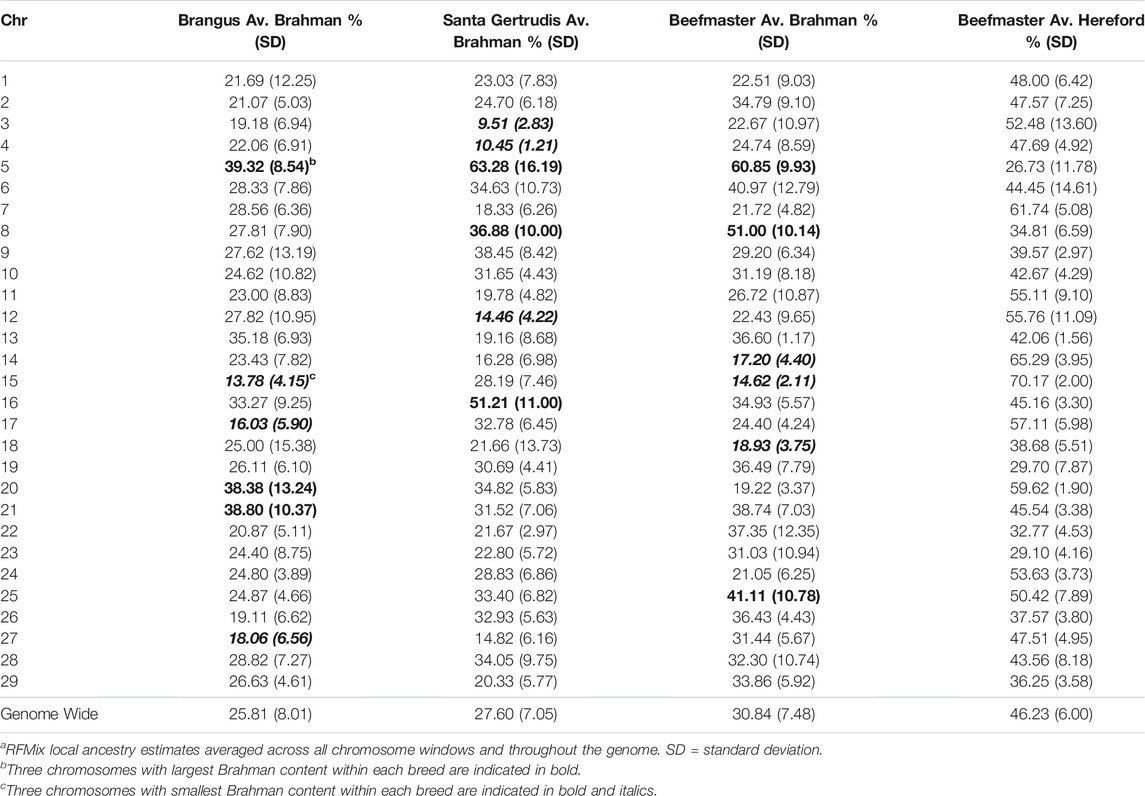
TABLE 3. Average ancestry to reference populations by chromosome for each of the American breedsa.
Table 3 shows that chromosome 5 consistently had the highest Brahman ancestry in all three breeds, but there was not a strong concordance between chromosomes with the highest or lowest Brahman ancestry across the breeds. Despite this, the correlations between estimated Brahman ancestry percentages across all 29 autosomes were 0.49 for Brangus and Santa Gertrudis, 0.43 between Brangus and Beefmaster, and 0.61 between Santa Gertrudis and Beefmaster which also share a Shorthorn ancestry. These correlations certainly indicate that, on a chromosomal basis, there is a tendency for the breeds to share elevated or reduced Brahman ancestry.
Individual Ancestry
Figures 4–6 show the proportions of ancestral breed inheritance for each individual by chromosome (panel A) and genome-wide (panel B). Individuals within each figure are sorted by the total number of haplotypes predicted within their genomes (X-axes and see Supplementary Table S1). For all three breeds, the proportion of Brahman content within the diploid genome increases with haplotype number, which we use as a proxy for the generation number of these individuals (see also Supplementary Figure S4). The results for individual chromosomes (Figures 4A, 5A, 6A) are not quite as obvious, however, the evolution of chromosome 5 clearly differs from most of the other chromosomes in all three breeds (see also Table 3).
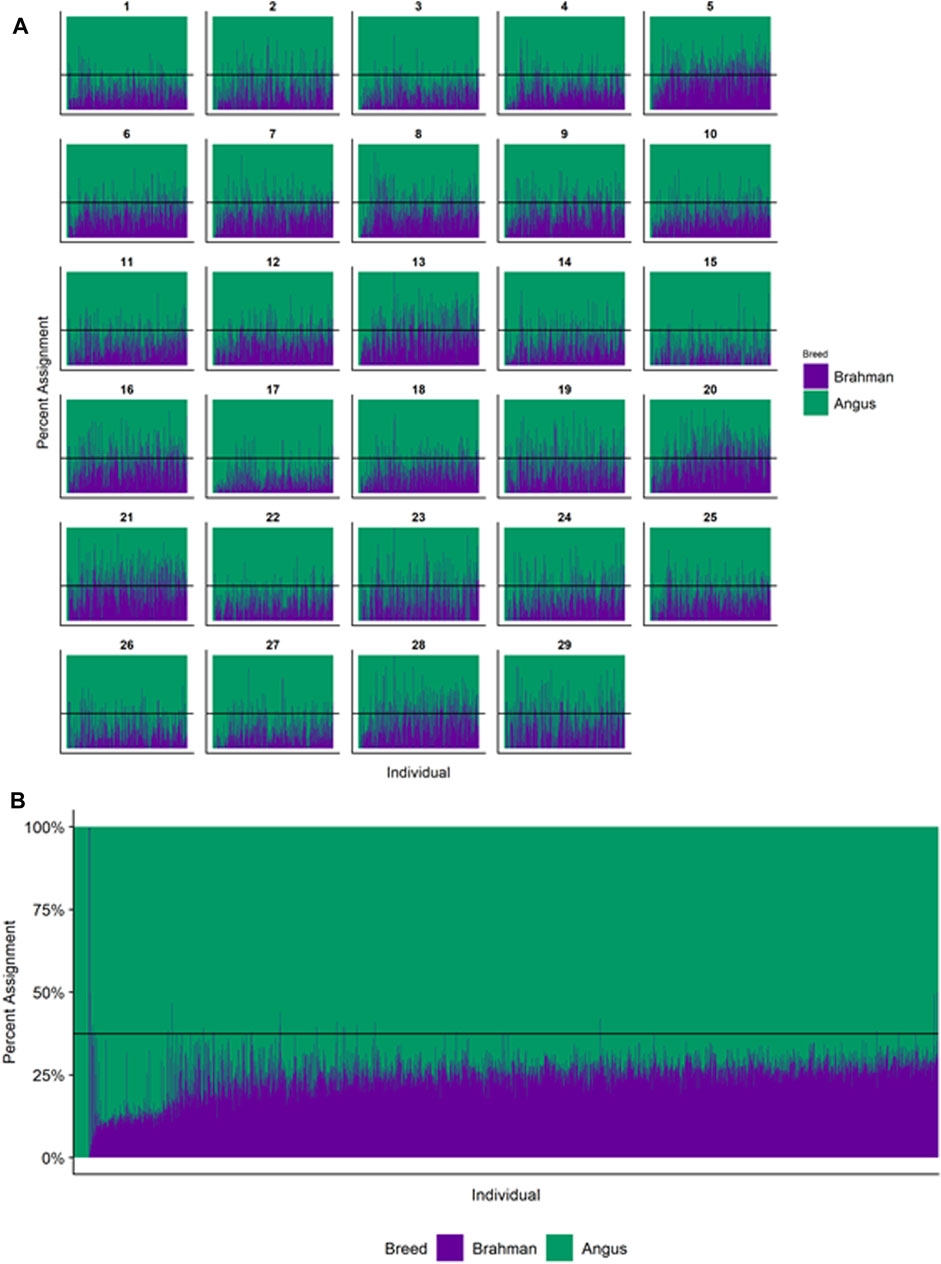
FIGURE 4. Ancestry estimated by RFMix for each Brangus individual plotted with animals sorted by total number of haplotypes. (A) Ancestry assignment for each chromosome, and (B) Genome-wide ancestry. Individuals are represented by vertical bars within each plot with Brahman proportion in purple and Angus proportion in green. Animals to the left on the X-axes have the fewest number of haplotypes predicted within their genomes. The black line represents the expected proportion of 3/8 Brahman.
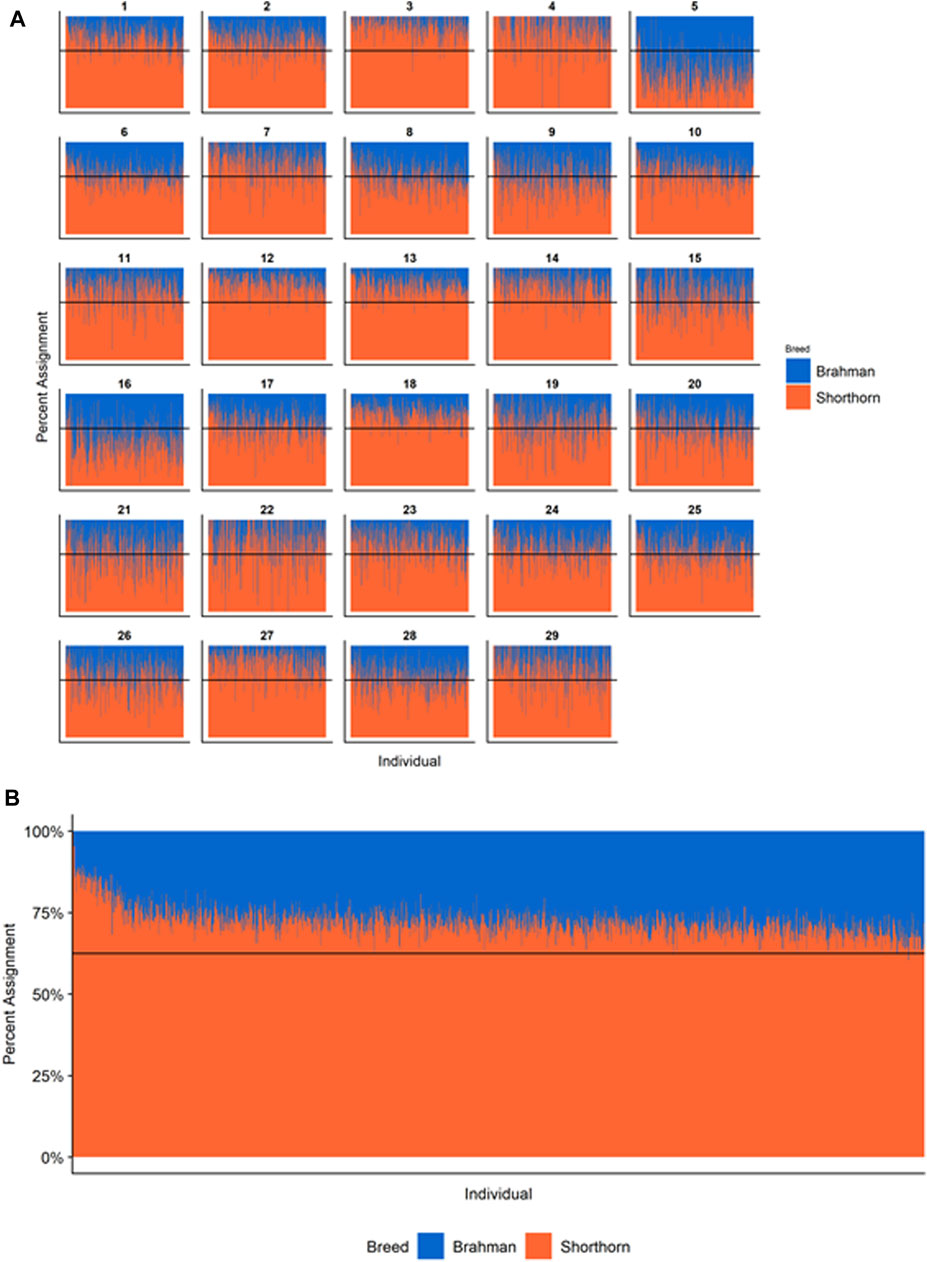
FIGURE 5. Ancestry estimated by RFMix for each Santa Gertrudis individual plotted with animals sorted by total number of haplotypes. (A) Ancestry assignment for each chromosome, and (B) Genome-wide ancestry. Individuals are represented by vertical bars within each plot with Brahman proportion in blue and Shorthorn proportion in orange. Animals to the left on the X-axes have the fewest number of haplotypes predicted within their genomes. The black line represents the expected proportion of 5/8 Shorthorn.
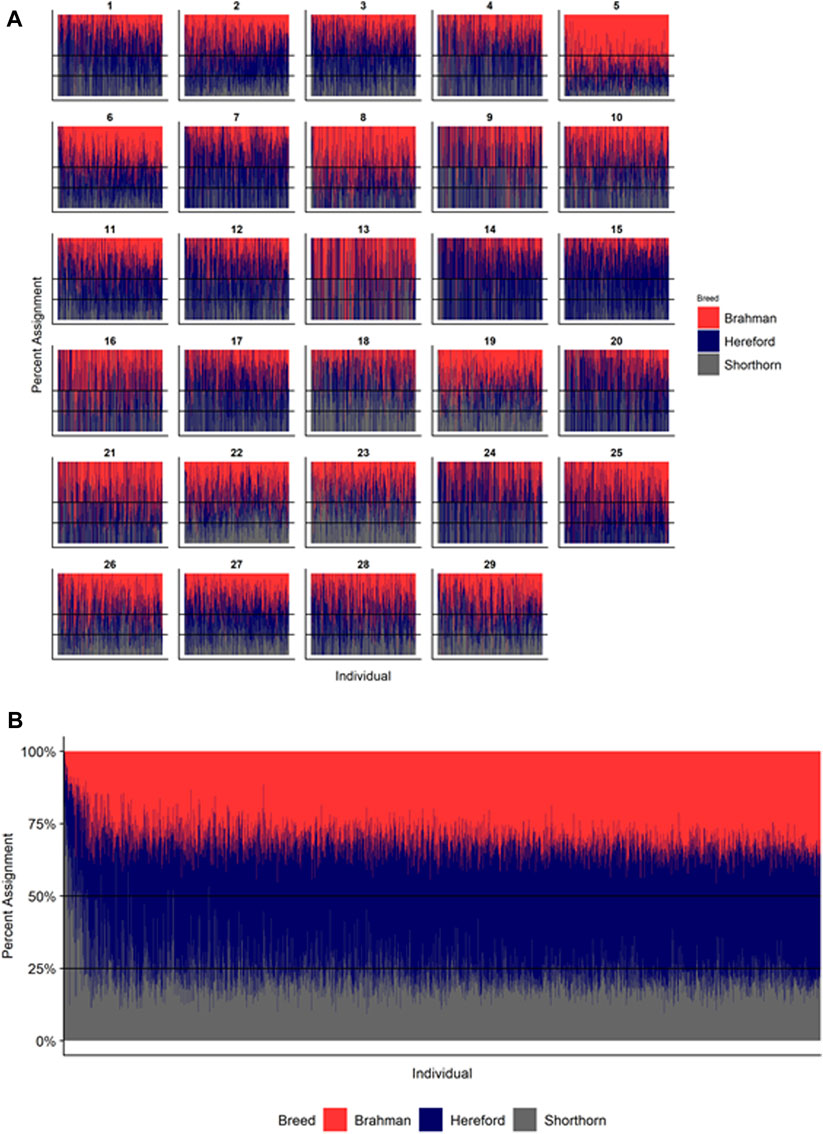
FIGURE 6. Ancestry estimated by RFMix for each Beefmaster individual plotted with animals sorted by total number of haplotypes. (A) Ancestry assignment for each chromosome, and (B) Genome-wide ancestry. Individuals are represented by vertical bars within each plot with Brahman proportion in red, Hereford in navy, and Shorthorn proportion in gray. Animals to the left on the X-axes have the fewest number of haplotypes predicted within their genomes.
Genomic Divergence From Breed Expectation
Nominal significance thresholds to achieve a FDR <0.001 using the Benjamini and Hochberg (1995) procedure were −log10 p = 3.0527 for Brangus, 3.0506 for Santa Gertrudis, and 3.0193 for Beefmaster. Using these values, 88.6% of tests performed for Brangus, 85.2% for Santa Gertrudis, and 95.2% for Beefmaster were significant. Values of the −log10Pi values for each American breed are plotted according to their chromosomal coordinates in Figure 7. These results reveal that most of the genomes of each of the American Breeds differ in Brahman composition from the expected breed proportion based upon pedigree when assuming selective neutrality and the absence of drift.
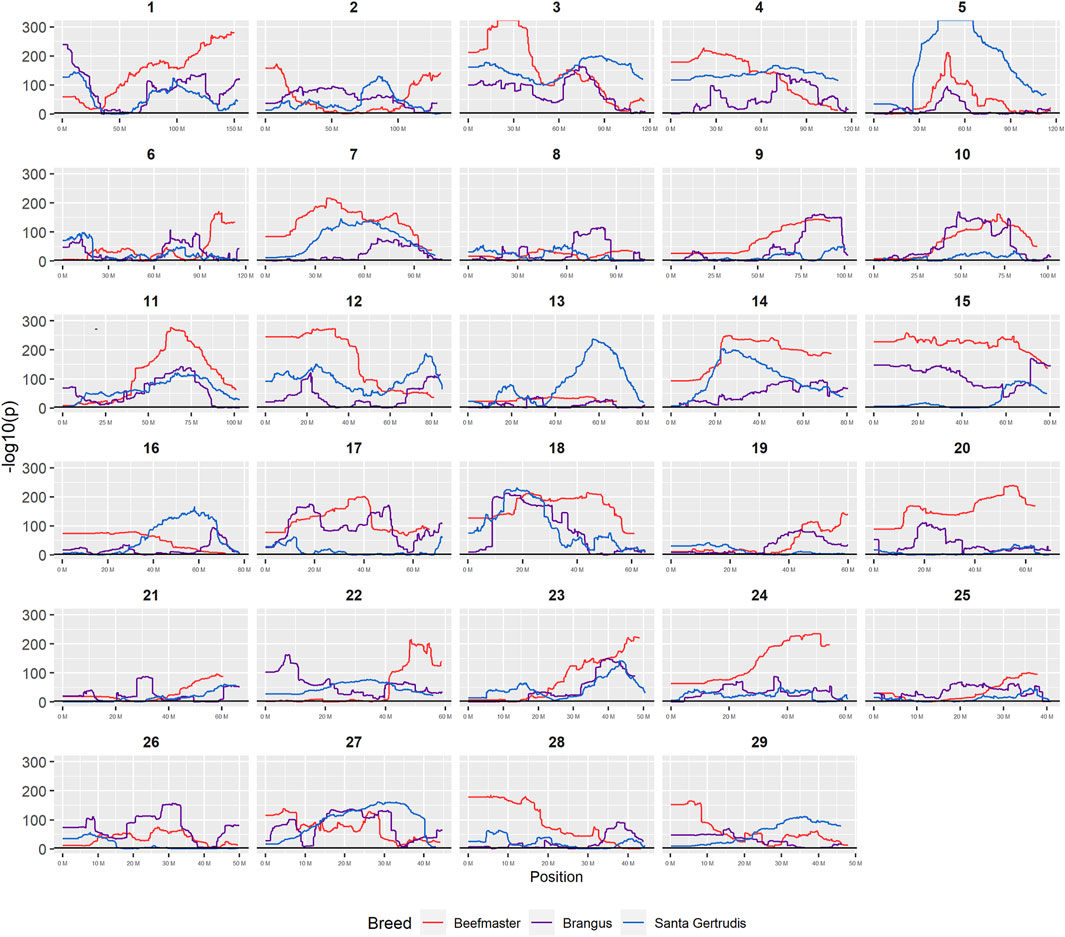
FIGURE 7. Plots of −log10P for tests of each genomic window for deviation from breed expected Brahman proportion by chromosome.
Regions With the Greatest Brahman Divergence From Breed Expectation
The 5 most differentiated windows for Brahman genome content within each of the American breeds are in Table 4. These windows vary in size due to variation in the distribution of SNP locations throughout the genome, but also because RFMix concatenates contiguous windows where all individuals have the same ancestral population origin of haplotypes. Except for the locus on chromosome 5, all regions were enriched for taurine alleles. Table 5 contains beef trait QTL from the CattleQTLdb within the 1 Mb region centered on the regions enriched for taurine alleles in Table 4, except for the regions on chromosomes 1 and 18 in Brangus which are separately discussed.
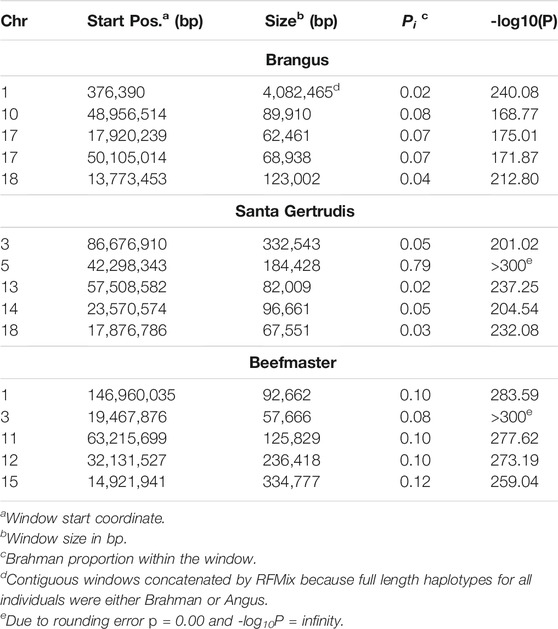
TABLE 4. Five most significantly diverged regions from expected Brahman breed proportion by breed.
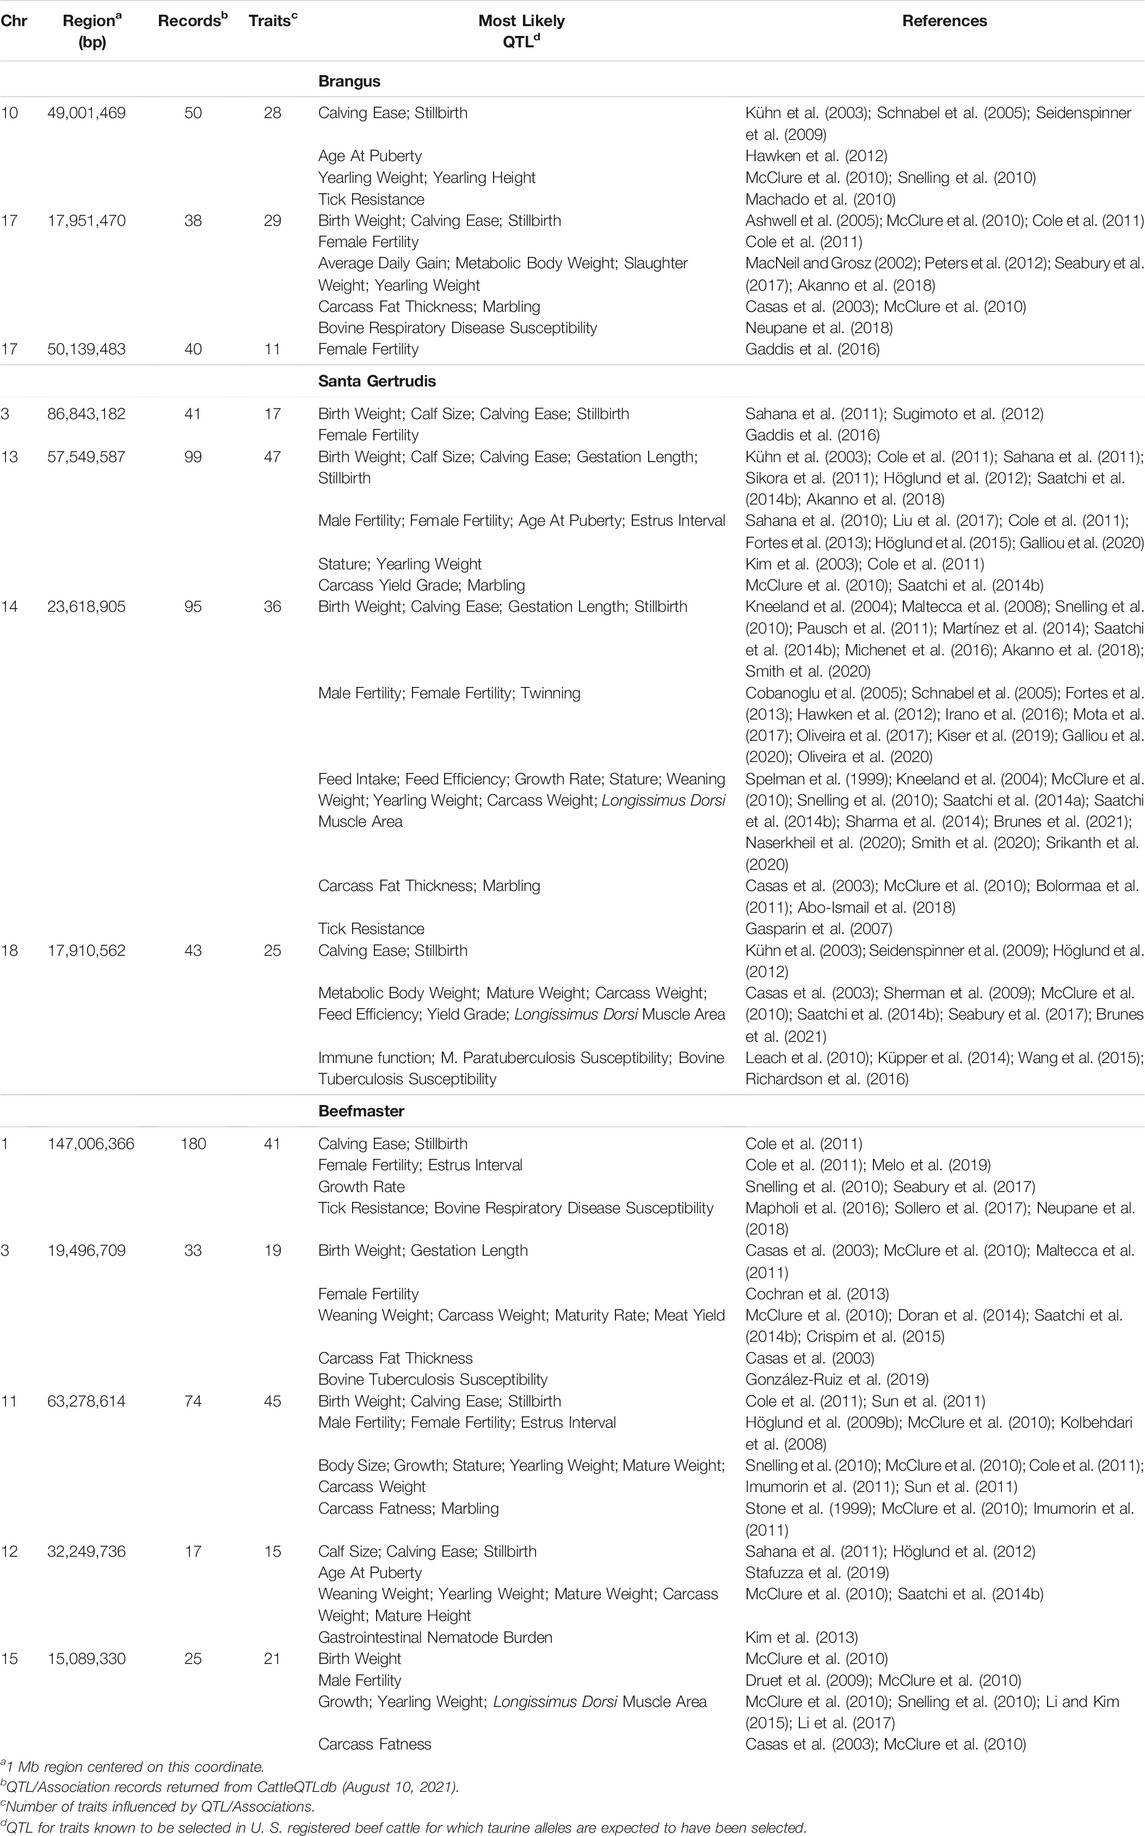
TABLE 5. CattleQTLdb queries for QTL influencing traits selected in U. S. beef cattle for regions enriched for taurine alleles in American Breed cattle.
Genomic Divergence Between Early- and Advanced-Generations
The average number of haplotypes was 112.10 ± 9.03, 125.21 ± 11.16, and 103.60 ± 4.25 within the early-generation and 177.06 ± 5.12, 172.28 ± 5.13, and 140.71
Nominal significance thresholds to achieve a FDR <0.001 using the Benjamini and Hochberg. (1995) procedure were −log10p = 3.0317 for Brangus, 3.2030 for Santa Gertrudis, and 3.2399 for Beefmaster. Using these values, 91.23% of tests performed for Brangus, 62.61% for Santa Gertrudis, and 57.46% for Beefmaster were significant. The Brahman proportion was greater in the advanced-generation animals for all significant regions in Brangus and Santa Gertrudis and for 93.84% of the significant regions in Beefmaster. Values of the −log10Pi values for each American breed are plotted according to their chromosomal coordinates in Supplementary Figure S6. These results reveal that most of the genomes of advanced-generation individuals from each of the American Breeds have a greater Brahman composition than early-generation individuals.
Regions With the Greatest Brahman Divergence Between Early- and Advanced-Generations
The 5 most differentiated windows for Brahman genome content between early and advanced-generation animals within each of the American Breeds are in Supplementary Table S2. For all 15 regions, the Brahman proportion was greater in the advanced-than in the early-generation animals. Supplementary Table S3 contains beef trait QTL from the CattleQTLdb within the 1 Mb region centered on the differentiated region in Supplementary Table S2.
Discussion
Reference Panels
Reference panel sample sizes have been shown to have significant effects on the accuracy of RFMix estimates (Maples et al., 2013). Reference panel sizes for analyses of local ancestry in human have ranged from as few as 19 samples to more than 500 samples per population (Maples et al., 2013; Browning et al., 2016) and human effective population size has been estimated to be 3,100 for Europeans and 7,500 for Yorubans (Tenesa et al., 2007). In cattle, the effective population size of most taurine breeds has been estimated to be about 100 (Bovine HapMap Consortium et al., 2009) and, consequently, we would expect that smaller reference panel sizes would be sufficient to capture the haplotypic diversity present within cattle breeds than for human. However, random samples of 200 individuals from each ancestral breed may not be sufficient to capture a large proportion of the haplotypic diversity within these breeds and larger sample sizes would certainly capture more of the rare haplotypes potentially leading to a greater accuracy of local ancestry estimation in admixed individuals (Maples et al., 2013). This is particularly important considering that the individuals in the reference panels and the founders of the American Breeds are separated by up to 16 generations and selection and drift may have caused large differences in haplotype frequencies between members of the groups. This appears to have impacted the estimation of local ancestry for the Beefmaster animals where proportions of Shorthorn and Hereford within the genome varied significantly depending on whether the CRUMBLER or ANCESTRAL reference panels were used. This may have been because the representation of horned Hereford and Line 1 Hereford animals was limited by sample size in the CRUMBLER reference panel and animals from these Hereford populations would have been prevalent at the time that the Beef master was initially formed.
Generation Proxy, Breed, and Individual Ancestry
To examine genome evolution in these breeds, we utilized the total number of haplotypes present within the genomes of the animals as proxy for the generation number of the animal. Under selective neutrality we would expect the number of taurine and indicine haplotypes present within individuals to increase with generation number due to recombination among homologous chromosomes at each meiosis. Indeed, we found quite strong correlations (70–80%) between the numbers of indicine and taurine haplotypes within Brangus and Santa Gertrudis, but less so (50%) in Beefmaster. Strong selection for alleles found predominantly in one of the breeds will reduce the strength of this correlation and reduce the accuracy of the proxy for the prediction of generation number. However, we did not have any animals with known generation numbers with which to directly validate the utility of the proxy. Moreover, the results for Beefmaster may have been affected by our use of the most likely breed of haplotype origin, an absolute assignment, rather than the marginal probabilities of breed assignment. If the marginal probabilities of haplotype assignment to Shorthorn and Hereford are similar, but tend to favor one breed throughout the genome, we could see large differences in predicted Hereford and Shorthorn proportions genome-wide when, in fact, this is an artifact, and the true differences genome-wide are small. This would also artificially impact the correlations between taurine and indicine haplotype numbers in Beefmaster.
However, the results in Figures 4B, Figures 5B, Figures 6B are both encouraging and interesting. In all three figures, the animals with the fewest numbers of haplotypes within their genomes have by far the lowest Brahman genome content. We suspect that these animals are not early generation Brangus, Santa Gertrudis, or Beefmaster animals but are intermediary crosses (1/8 × 7/8 and ¼ × ¾) produced by cattle breeders generating first generation members of each of the breeds who decided to genotype these animals and provide them to their respective Breed Associations (see e.g., https://gobrangus.com/tperkins-breeding-up/). Despite this, the two interesting features of these plots are that the proportions of Brahman within all three of these breeds are far less than would be expected based upon the mating schemes used to produce the animals, and the proportion of Brahman within the genomes of advanced generation animals is consistently increasing supporting our results from the direct comparison of early- and advanced-generation animals. Our interpretation of these results are that breeders of American Breed cattle select very strongly for performance and type (coat color, polled, sheath score, performance) characteristics, particularly in early generation animals, resulting in a selective advantage for taurine alleles which creates widespread linkage drag throughout the genome dramatically reducing the Brahman content. However, in advanced-generation cattle, selection emphases change towards adaptive alleles (nutrient utilization, temperature tolerance, pathogen resistance) favoring indicine alleles. In the Beefmaster, the increase in Brahman genome content in advanced-generation animals appears to be primarily at the expense of the Shorthorn content (Supplementary Figure S5).
Goszczynski et al. (2018) used STRUCTURE to estimate the Brahman proportion within the genomes of 100 Argentinean registered Brangus animals to be 34.7%, which is very close to the breed expectation of 0.375 based upon pedigree. We suspect that the difference between this result and our finding reflects a very different selection history within the U. S. and Argentinian registered Brangus populations. Paim et al. (2020a) used ADMIXTURE applied to genotypes for 59 registered U.S Brangus cattle and estimated the Brahman proportion of their genomes to be 29.6%, on average, slightly larger than found in this study, but below breed expectation. Their estimates of breed proportion by chromosomal location show considerable similarity to our results in Figures 1–3, and they also found that chromosomes 5 and 15 had the lowest and highest Angus contents, respectively (Table 3), despite a much smaller sample size (Paim et al., 2020a).
Genomic Divergence From Breed Expectation
To test genomic windows for divergence from breed expectations, we conducted a simulation to estimate the variance in the proportion of Brahman genome content that would be expected across loci in a large population of advanced generation individuals. The estimate of variance from the simulation was quite small
Figure 7 reveals that the patterns of divergence are complex but quite similar among the breeds for several chromosomes. The entirety of chromosome 25 possesses the least divergence, while chromosomes 1, 5, 11, 12, and 18 possess regions of very high divergence for all three breeds - characteristic of loci that have been strongly selected. Entire chromosomes are highly diverged for their Brahman composition including 15 in Brangus, 3 and 4 in Santa Gertrudis, and 14, 15, and 20 in Beefmaster. Chromosomes 8, 9, 13, 17, 20, 22, 24, and 29 reveal loci that have been exposed to selection in only a subset of the breeds. Selection for favorable alleles at multiple polygenes of large effect on a chromosome will generate a complex signature of selection that is dependent on initial phase relationships among the selected alleles and the relative intensities of selection applied to each of the alleles. Consequently, it is not likely to be a fruitful exercise to attempt to identity the underlying selected loci and phenotypes except perhaps for the largest effect loci and for loci that are well known to have been exposed to selection in these breeds.
Goszczynski et al. (2018) found a significant enrichment for Brahman alleles within the BoLA region of chromosome 23 (chr23:28,720,113–28,724,739), however, we found no evidence for this (Figure 7) and once again speculate that this reflects a different selection history for the U.S and Argentinian populations.
Coat Color and Polled Loci
Breed Characteristics
Brangus cattle are required to be polled (absence of horns) and to have solid black or red coat colors. Santa Gertrudis cattle may be horned or polled, with a light or dark solid red coat color preferred; roan (red coat with white patches) or white outside the underline or other spotting in other parts of the body disqualifies an animal from registration. Beefmaster cattle may be horned or polled and while brownish-red is the most common color, the breed has no color standards. Brahman cattle are primarily horned and have complex coat colors that can range from solid gray to brindled. Angus are polled due to the autosomal dominant Celtic polled allele, a complex structural insertion, at Polled located near the centromere of chromosome 1 (Brenneman et al., 1996; Medugorac et al., 2012) and have either solid black (American Angus Association) or red (American Red Angus Association) coat colors due to variation within MC1R located at 14,704,918–14,707,018 on chromosome 18. American Shorthorn can be horned or polled and can have red, white, or roan coat color patterns caused by variation at KITLG (Seitz et al., 1999) located at 18,245,986–18,317,616 on chromosome 5. American Hereford cattle can be horned or polled and have dark red to red-yellow coat colors. They are piebald with white on the head, ventral areas, lower legs, and tail switch which is inherited as an autosomal dominant due to structural variation located proximal to KIT at 70,157,944–70,262,786 Mb on chromosome 6 (Grosz and MacNeil, 1999; Whitacre, 2014). QTL associated with variation in white spotting in cattle have also been identified on chromosome 6 near KIT (Reinsch et al., 1999; Liu et al., 2009).
Selection Signatures at Coat Color and Polled Loci
Figure 7 confirms the selection of Angus alleles (Figure 1) at Polled and MC1R in Brangus (windows with strongest signal Chr1:376,390–4,458,855;
Large Effect Locus Enriched for Ancestral Brahman Alleles
As the global proportion of indicine ancestry increases in B. t. taurus × B. t. indicus hybrids, coat color lightens, males tend to have more pendulous sheaths, body weight and condition scores increase, and tick and worm burdens decrease (Porto-Neto et al., 2014). B. t. indicus cattle tend to have a lower performance than B. t. taurus cattle under favorable conditions, but significantly outperform B. t. taurus cattle in extreme climates and environments where parasites, heat, and low inputs play important roles in the production system (Frisch and Vercoe, 1977; Frisch and Vercoe, 1984; Menjo et al., 2009; Porto-Neto et al., 2014). In almost all cases, the most significantly diverged regions are enriched for taurine alleles (Figures 1–3 and Figure 7). However, Brahman alleles are strongly enriched in frequency in all three of the American breeds in the central region of chromosome 5 (Figures 1–3). The window with the greatest Brahman composition was Chr5:48,183,014–48,275,554;
The genes closest to the windows with the greatest Brahman ancestry in Brangus and Beefmaster are HMGA2 (Chr5:47,819,475–47,966,336) and MSRB3 (Chr5:48,330,041–48,511,868). In human, HMGA2 has been associated with 62 traits (https://www.ebi.ac.uk/gwas/genes/HMGA2; Accessed Sept. 18, 2021), including body height, birth weight, systolic blood pressure, brain cortical volume, intelligence, and insomnia. Brahman females are known to suppress the birth weight of their calves (Dillon et al., 2015) to increase calving ease and reduce calf mortality. MSRB3 has been associated with 33 traits in human (https://www.ebi.ac.uk/gwas/genes/MSRB3; Accessed Sept. 18, 2021) including brain cortical volume, snoring, lung function, height, and temperament. The window with the greatest Brahman ancestry in Santa Gertrudis overlaps CPNE8, associated with 14 human traits (https://www.ebi.ac.uk/gwas/genes/CPNE8; Accessed Sept. 18, 2021) including chronotype and circadian rhythm, IgG glycosylation, heart rate, and bipolar disorder. Consequently, this broad genomic region includes genes which may explain several of the physiological differences between B. t. taurus and B. t. indicus cattle, including birth weight, height, blood vessel morphology, hair morphology, disease resistance, and temperament.
Large Effect Loci Enriched for Ancestral Taurine Alleles
We queried CattleQTLdb for the remaining 12 loci in Table 4 to identify candidate QTL responsible for the enrichment of taurine alleles at these highly diverged loci and the results are in Table 5. We performed the query for 1 Mb regions centered on the window centers reported in Table 4 and restricted our attention to loci responsible for variation in traits known to be under artificial selection or potentially under natural selection in U. S. beef breeds and discovered in taurine or B. t. taurus × B. t. indicus hybrid populations. We also collapsed database entries from the same author with separate QTL identities into a single QTL when they co-localized within the genome. For example, the query for chromosome 14 region retrieved 5 database entries for Birth Weight from Snelling et al. (2010) with QTL identifiers 68615, 68626, 68630, 68658, and 68672 with coordinates Chr14:23,893,200–23,893,240, Chr14:23,946,416–23,946,456, Chr14:23,571,834–23,571,874, Chr14:23,853,791–23,853,831, and Chr14:23,421,913–23,421,953, respectively. These clearly all represent the same Birth Weight QTL and were collapsed into a single entry in Table 5. However, this feature of the CattleQTLdb makes it difficult to perform enrichment analyses, since the numbers of trait associations detected in any study is dependent upon the number of markers used. The CattleQTLdb contains 161,781 QTL from 1,049 publications representing 680 different traits (https://www.animalgenome.org/cgi-bin/QTLdb/index; Accessed August 11, 2021). The bovine autosomal genome length is 2,489.39 Mb in the ARS-UCD1.2 bovine reference genome assembly and so if QTL are randomly located through the genome, we would expect to find an average of 64.98 QTL within each 1 Mb window. We retrieved an average of 61.25 ± 45.49 QTL or Association entries for 27.83 ± 12.07 traits within the 12 genomic windows in Table 5 indicating that these genomic regions are typical for their QTL content.
Two features of Table 5 are particularly interesting. First, 7 of the 12 differentiated regions harbor single reports of QTL for Tick or Disease Resistance. However, the CattleQTLdb contains 2,923 Disease, 210 Parasite, 254 Immune Capacity, and 124 Parasite Pest Resistance QTL or Association entries, prior to coalescence to remove redundant QTL reporting. These data suggest that we should have found, on average, 1.41 QTL or Association entries within the CattleQTLdb per 1 Mb autosomal region. From the Poisson distribution, the probability of 1 or more CattleQTLdb entries per region is 0.76 and from the Binomial distribution, the probability of 7 or more regions possessing CattleQTLdb entries is 0.95. The second feature is that 11 of the 12 differentiated regions harbor QTL for Birth Weight or Calving Ease for which 1,180 and 4,105 QTL or Association entries are reported, respectively, in the CattleQTLdb. This corresponds to an average of 2.12 database entries per 1 Mb window and a probability of 0.57 of 11 or more of the windows having CattleQTLdb entries for Birth Weight or Calving Ease. However, the distributions of database entries for Birth Weight and Calving Ease by chromosome are not random, with 511 (43.3%) entries for Birth Weight on chromosome 6 and 1,968 (47.9%) entries for Calving Ease on chromosome 21. Removing these outlier chromosomes from the analysis leads to the expectation of 1.22 database entries per 1 Mb window and a probability of only 0.09 of finding entries for Birth Weight or Calving Ease in at least 11 of 12 randomly sampled 1 Mb windows.
Ten of the regions in Table 5 have CattleQTLdb entries for growth and weight traits and 7 of these are for Weaning Weight. We found 616 CattleQTLdb entries for Weaning Weight, again with an overrepresentation on chromosome 6 (146 or 24%). After removing chromosome 6 from the analysis, this corresponds to an average of only 0.20 database entries per 1 Mb window for the remainder of the autosomal genome and a probability of only 0.002 of finding at least 7 out of 12 randomly sampled 1 Mb genomic regions containing database entries for Weaning Weight. Four of the regions in Table 5 have CattleQTLdb entries for Marbling Score for which there are 441 CattleQTLdb entries corresponding to an average of only 0.18 database entries per 1 Mb window for the autosomal genome. This generates a probability of 0.12 of finding at least 4 out of 12 randomly sampled 1 Mb genomic regions containing database entries for Marbling Score. Finally, there are 19,572 entries in CattleQTLdb for Fertility indicating that we should have expected to find fertility trait QTL in all 12 of the genomic regions reported in Table 5.
These results suggest that artificial selection on production traits practiced by breeders of American Breed cattle is responsible for the surfeit of taurine alleles at the 12 loci in Table 5. Our analyses suggest that American Breed cattle breeders are placing the greatest selection emphases on growth, calving ease, and meat quality traits, which is consistent with the findings of Decker et al. (2012) in U.S registered Angus cattle.
Genomic Divergence Between Early- and Advanced-Generations
Although statistical power was limited when comparing the Brahman content of the genomes of early- and advanced-generation animals due to the use of only ∼10% of the animals from each breed in each tail of the haplotype number distribution, these analyses clearly revealed that the Brahman proportion of the genome of these American breeds has increased with generation number and that this increase has occurred almost genome-wide.
There are several interesting features of Supplementary Table S3. First, we found two of the most differentiated 1 Mb regions between early- and advanced-generation American Breed animals to have no previously identified QTL within them. Considering an average of 64.98 QTL within each 1 Mb window for the CattleQTLdb, the probability of two such intervals in 15 randomly sampled 1 Mb genomic regions is small (p = 3.88E-55), indicating that the selected loci in these regions impact traits that have not been well studied in cattle, suggesting that they may have roles in environmental adaptation. Second, the locus on chromosome 6 at 71.5 Mb in Beefmaster supports our conjecture that Beefmaster breeders have selected for solid coat colors in advanced-generation animals, despite the fact that the breed does not have coat color standards. Finally, if we remove the locus on chromosome 6 at 71.5 Mb in Beefmaster, 11 of the 12 genomic regions with identified QTL harbor QTL that influence heat tolerance or animal health, immune response, parasite burden or disease susceptibility. The probability of 11 or all 12 regions harboring disease or parasite CattleQTLdb entries reduces to 0.18. These results suggest that these genomic regions have been selected to increase the proportion of Brahman alleles because they confer an adaptive advantage in American Breed cattle.
Conclusion
The American breeds are advanced generation B. t. taurus × B. t. indicus hybrid cattle that were developed to capitalize on breed complementarity and heterosis to produce cattle that were suited to harsh, subtropical climates as well as disease and parasite threats, while still maintaining acceptable levels of growth and productivity. The breeds employed mating systems designed to produce cattle that were either ⅝ taurine and ⅜ indicine (Brangus and Santa Gertrudis) or ½ taurine and ½ indicine (Beefmaster). However, we found strong evidence that selection for polledness, coat color phenotypes, growth, calving ease, and intra-muscular fat content produced early-generation cattle with much smaller than expected indicine composition within the genomes of all three breeds. At least 85% of the genomes within each of the breeds possess less Brahman ancestry than expected in the absence of selection and drift. We utilized the total number of haplotypes predicted by RFMix in the diploid genome of each animal as a proxy for the generation number for each animal and when we ranked animals based on this proxy, we detected an increase in the Brahman genome content in advanced-generation cattle of all three breeds. By comparing the genomes of early- and advanced-generation animals within each breed, we found evidence for strong selection for indicine alleles which likely confer an adaptive advantage for heat tolerance and healthfulness in advance-generation animals.
Data Availability Statement
The datasets analyzed in this study belong to the respective Breed Associations. For access to the data, contact: Darrell Wilkes, Executive Vice President, International Brangus Breeders Association: ZHdpbGtlc0Bnb2JyYW5ndXMuY29t. Collin Osbourn, Executive Vice President, Beefmaster Breeders United: Y29zYm91cm5AYmVlZm1hc3RlcnMub3Jn, Webb Fields, Executive Director, Santa Gertrudis Breeders International: d2ZpZWxkc0BzYW50YWdlcnRydWRpcy5jb20=.
Ethics Statement
Ethical review and approval was not required for the animal study because all animals for which samples were obtained for genotyping in this study were either sampled via cryopreserved semen or tissue samples (e.g., hair, blood) obtained by the owners of the cattle according to standard industry practices. Written informed consent for participation was not obtained from the owners because genotype data are owned and were provided to us by the three Breed Associations.
Author Contributions
All authors contributed to the overall design and approaches used to conduct the research and read and edited the final manuscript. TEC and JFT conducted the analyses and wrote the manuscript. RDS managed the genotypes and prepared files for the analyses. JED oversaw the development of the genotype imputation pipeline and generated the imputed data set.
Funding
JT was supported by grant number 2017-67015-26760 from the United States Department for Agriculture National Institute for Food and Agriculture.
Conflict of Interest
The authors declare that the research was conducted in the absence of any commercial or financial relationships that could be construed as a potential conflict of interest.
Publisher’s Note
All claims expressed in this article are solely those of the authors and do not necessarily represent those of their affiliated organizations, or those of the publisher, the editors and the reviewers. Any product that may be evaluated in this article, or claim that may be made by its manufacturer, is not guaranteed or endorsed by the publisher.
Acknowledgments
The authors appreciate data sharing by the International Brangus Breeders Association, Beefmaster Breeders United, and Santa Gertrudis Breeders International Breed Associations. We also appreciate the efforts of two reviewers which prompted us to more formally examine the increasing Brahman content within advanced generation animals.
Supplementary Material
The Supplementary Material for this article can be found online at: https://www.frontiersin.org/articles/10.3389/fgene.2021.758394/full#supplementary-material
References
Abo-Ismail, M. K., Lansink, N., Akanno, E., Karisa, B. K., Crowley, J. J., Moore, S. S., et al. (2018). Development and Validation of a Small SNP Panel for Feed Efficiency in Beef Cattle1. J. Anim. Sci. 96, 375–397. doi:10.1093/jas/sky020
Akanno, E. C., Chen, L., Abo-Ismail, M. K., Crowley, J. J., Wang, Z., Li, C., et al. (2018). Genome-wide Association Scan for Heterotic Quantitative Trait Loci in Multi-Breed and Crossbred Beef Cattle. Genet. Sel. Evol. 50, 48. doi:10.1186/s12711-018-0405-y
Ashwell, M. S., Heyen, D. W., Weller, J. I., Ron, M., Sonstegard, T. S., Van Tassell, C. P., et al. (2005). Detection of Quantitative Trait Loci Influencing Conformation Traits and Calving Ease in Holstein-Friesian Cattle. J. Dairy Sci. 88, 4111–4119. doi:10.3168/jds.s0022-0302(05)73095-2
Benjamini, Y., and Hochberg, Y. (1995). Controlling the False Discovery Rate: A Practical and Powerful Approach to Multiple Testing. J. R. Stat. Soc. Ser. B (Methodological) 57, 289–300. doi:10.1111/j.2517-6161.1995.tb02031.x
Bovine HapMap Consortium Gibbs, R. A., Gibbs, R. A., Taylor, J. F., Van Tassell, C. P., Barendse, W., Eversole, K. A., et al. (2009). Genome-wide Survey of SNP Variation Uncovers the Genetic Structure of Cattle Breeds. Science 324, 528–532. doi:10.1126/science.1167936
Boichard, D., Grohs, C., Bourgeois, F., Cerqueira, F., Faugeras, R., Neau, A., et al. (2003). Detection of Genes Influencing Economic Traits in Three French Dairy Cattle Breeds. Genet. Sel. Evol. 35, 77–101. doi:10.1186/1297-9686-35-1-77
Bolormaa, S., Neto, L. R. P., Zhang, Y. D., Bunch, R. J., Harrison, B. E., Goddard, M. E., et al. (2011). A Genome-wide Association Study of Meat and Carcass Traits in Australian Cattle1. J. Anim. Sci. 89, 2297–2309. doi:10.2527/jas.2010-3138
Brenneman, R. A., Davis, S. K., Sanders, J. O., Burns, B. M., Wheeler, T. C., Turner, J. W., et al. (1996). The Polled Locus Maps to BTA1 in a Bos indicus X Bos taurus Cross. J. Hered. 87, 156–161. doi:10.1093/oxfordjournals.jhered.a022975
Browning, S. R., Grinde, K., Plantinga, A., Gogarten, S. M., Stilp, A. M., Kaplan, R. C., et al. (2016). Local Ancestry Inference in a Large US-Based Hispanic/Latino Study: Hispanic Community Health Study/Study of Latinos (HCHS/SOL). G 6, 1525–1534. doi:10.1534/g3.116.028779
Brunes, L. C., Baldi, F., Lopes, F. B., Lôbo, R. B., Espigolan, R., Costa, M. F. O., et al. (2021). Weighted Single‐step Genome‐wide Association Study and Pathway Analyses for Feed Efficiency Traits in Nellore Cattle. J. Anim. Breed. Genet. 138, 23–44. doi:10.1111/jbg.12496
Buzanskas, M. E., Grossi, D. D. A., Ventura, R. V., Schenkel, F. S., Chud, T. C. S., Stafuzza, N. B., et al. (2017). Candidate Genes for Male and Female Reproductive Traits in Canchim Beef Cattle. J. Anim. Sci Biotechnol 8, 67. doi:10.1186/s40104-017-0199-8
Cai, Z., Guldbrandtsen, B., Lund, M. S., and Sahana, G. (2019). Prioritizing Candidate Genes for Fertility in Dairy Cows Using Gene-Based Analysis, Functional Annotation and Differential Gene Expression. BMC Genomics 20, 255. doi:10.1186/s12864-019-5638-9
Carignano, H. A., Roldan, D. L., Beribe, M. J., Raschia, M. A., Amadio, A., Nani, J. P., et al. (2018). Genome-wide Scan for Commons SNPs Affecting Bovine Leukemia Virus Infection Level in Dairy Cattle. BMC Genomics 19, 142. doi:10.1186/s12864-018-4523-2
Cartwright, T. C. (1970). Selection Criteria for Beef Cattle for the Future. J. Anim. Sci. 30, 706–711. doi:10.2527/jas1970.305706x
Casas, E., Hessman, B. E., Keele, J. W., and Ridpath, J. F. (2015). A Genome-wide Association Study for the Incidence of Persistent Bovine Viral Diarrhea Virus Infection in Cattle. Anim. Genet. 46, 8–15. doi:10.1111/age.12239
Casas, E., Shackelford, S. D., Keele, J. W., Koohmaraie, M., Smith, T. P. L., and Stone, R. T. (2003). Detection of quantitative trait loci for growth and carcass composition in cattle. J. Anim. Sci. 81, 2976–2983.
Casas, E., Shackelford, S. D., Keele, J. W., Stone, R. T., Kappes, S. M., and Koohmaraie, M. (2000). Quantitative Trait Loci Affecting Growth and Carcass Composition of Cattle Segregating Alternate Forms of Myostatin. J. Anim. Sci. 78, 560–569. doi:10.2527/2000.783560x
Casas, E., and Snowder, G. D. (2008). A Putative Quantitative Trait Locus on Chromosome 20 Associated with Bovine Pathogenic Disease Incidence1,2. J. Anim. Sci. 86, 2455–2460. doi:10.2527/jas.2008-0933
Casas, E., and Stone, R. T. (2006). Putative Quantitative Trait Loci Associated with the Probability of Contracting Infectious Bovine Keratoconjunctivitis1,2. J. Anim. Sci. 84, 3180–3184. doi:10.2527/jas.2006-200
Chan, E. K. F., Nagaraj, S. H., and Reverter, A. (2010). The Evolution of Tropical Adaptation: Comparing Taurine and Zebu Cattle. Anim. Genet. 41, 467–477. doi:10.1111/j.1365-2052.2010.02053.x
Cobanoglu, O., Berger, P. J., and Kirkpatrick, B. W. (2005). Genome Screen for Twinning Rate QTL in Four North American Holstein Families. Anim. Genet. 36, 303–308. doi:10.1111/j.1365-2052.2005.01299.x
Cochran, S. D., Cole, J. B., Null, D. J., and Hansen, P. J. (2013). Discovery of Single Nucleotide Polymorphisms in Candidate Genes Associated with Fertility and Production Traits in Holstein Cattle. BMC Genet. 14, 49. doi:10.1186/1471-2156-14-49
Cole, J. B., Wiggans, G. R., Ma, L., Sonstegard, T. S., Lawlor, T. J., Crooker, B. A., et al. (2011). Genome-wide Association Analysis of Thirty One Production, Health, Reproduction and Body Conformation Traits in Contemporary U.S. Holstein Cows. BMC Genomics 12, 408. doi:10.1186/1471-2164-12-408
Coppieters, W., Mes, T. H., Druet, T., Farnir, F., Tamma, N., Schrooten, C., et al. (2009). Mapping QTL Influencing Gastrointestinal Nematode burden in Dutch Holstein-Friesian Dairy Cattle. BMC Genomics 10, 96. doi:10.1186/1471-2164-10-96
Crispim, A. C., Kelly, M. J., Guimarães, S. E. F., e Silva, F. F., Fortes, M. R. S., Wenceslau, R. R., et al. (2015). Multi-trait GWAS and New Candidate Genes Annotation for Growth Curve Parameters in Brahman Cattle. PLoS One 10, e0139906. doi:10.1371/journal.pone.0139906
Crum, T. E., Schnabel, R. D., Decker, J. E., Regitano, L. C. A., and Taylor, J. F. (2019). CRUMBLER: A Tool for the Prediction of Ancestry in Cattle. PLoS One 14, e0221471. doi:10.1371/journal.pone.0221471
Das, S., Forer, L., Schönherr, S., Sidore, C., Locke, A. E., Kwong, A., et al. (2016). Next-generation Genotype Imputation Service and Methods. Nat. Genet. 48, 1284–1287. doi:10.1038/ng.3656
de Oliveira, P. S., Cesar, A. S., do Nascimento, M. L., Chaves, A. S., Tizioto, P. C., Tullio, R. R., et al. (2014). Identification of Genomic Regions Associated with Feed Efficiency in Nelore Cattle. BMC Genet. 15, 100. doi:10.1186/s12863-014-0100-0
Decker, J. E., Vasco, D. A., McKay, S. D., McClure, M. C., Rolf, M. M., Kim, J., et al. (2012). A Novel Analytical Method, Birth Date Selection Mapping, Detects Response of the Angus (Bos taurus) Genome to Selection on Complex Traits. BMC Genomics 13, 606. doi:10.1186/1471-2164-13-606
Dickerson, G. (1970). Efficiency of Animal Production-Molding the Biological Components. J. Anim. Sci. 30, 849–859. doi:10.2527/jas1970.306849x
Dikmen, S., Cole, J. B., Null, D. J., and Hansen, P. J. (2013). Genome-wide Association Mapping for Identification of Quantitative Trait Loci for Rectal Temperature during Heat Stress in Holstein Cattle. PLoS One 8, e69202. doi:10.1371/journal.pone.0069202
Dillon, J. A., Riley, D. G., Herring, A. D., Sanders, J. O., and Thallman, R. M. (2015). Genetic Effects on Birth Weight in Reciprocal Brahman-Simmental Crossbred Calves1. J. Anim. Sci. 93, 553–561. doi:10.2527/jas.2014-8525
Doran, A. G., Berry, D. P., and Creevey, C. J. (2014). Whole Genome Association Study Identifies Regions of the Bovine Genome and Biological Pathways Involved in Carcass Trait Performance in Holstein-Friesian Cattle. BMC Genomics 15, 837. doi:10.1186/1471-2164-15-837
Druet, T., Fritz, S., Sellem, E., Basso, B., Gérard, O., Salas-Cortes, L., et al. (2009). Estimation of Genetic Parameters and Genome Scan for 15 Semen Characteristics Traits of Holstein Bulls. J. Anim. Breed. Genet. 126, 269–277. doi:10.1111/j.1439-0388.2008.00788.x
Duarte, D. A. S., Newbold, C. J., Detmann, E., Silva, F. F., Freitas, P. H. F., Veroneze, R., et al. (2019). Genome‐wide Association Studies Pathway‐based Meta‐analysis for Residual Feed Intake in Beef Cattle. Anim. Genet. 50, 150–153. doi:10.1111/age.12761
Elo, K. T., Vilkki, J., Koning, D.-J. d., Velmala, R. J., and Mäki-Tanila, A. V. (1999). A Quantitative Trait Locus for Live Weight Maps to Bovine Chromosome 23. Mamm. Genome 10, 831–835. doi:10.1007/s003359901098
Espigolan, R., Baldi, F., Boligon, A. A., Souza, F. R. P., Fernandes Júnior, G. A., Gordo, D. G. M., et al. (2015). Associations between Single Nucleotide Polymorphisms and Carcass Traits in Nellore Cattle Using High-Density Panels. Genet. Mol. Res. 14, 11133–11144. doi:10.4238/2015.september.22.7
Fortes, M. R. S., Reverter, A., Kelly, M., McCulloch, R., and Lehnert, S. A. (2013). Genome-wide Association Study for Inhibin, Luteinizing Hormone, Insulin-like Growth Factor 1, Testicular Size and Semen Traits in Bovine Species. Andrology 1, 644–650. doi:10.1111/j.2047-2927.2013.00101.x
Frisch, J. E., and Vercoe, J. E. (1977). Food Intake, Eating Rate, Weight Gains, Metabolic Rate and Efficiency of Feed Utilization in Bos taurus and Bos indicus Crossbred Cattle. Anim. Sci. 25, 343–358. doi:10.1017/s0003356100016755
Frisch, J. E., and Vercoe, T. E. (1984). An Analysis of Growth of Different Cattle Genotypes Reared in Different Environments. J. Agric. Sci. 103, 137–153. doi:10.1017/s0021859600043409
Gaddis, K. L., Null, D. J., and Cole, J. B. (2016). Explorations in Genome-wide Association Studies and Network Analyses with Dairy Cattle Fertility Traits. J. Dairy Sci. 99, 6420–6435. doi:10.3168/jds.2015-10444
Galliou, J. M., Kiser, J. N., Oliver, K. F., Seabury, C. M., Moraes, J. G. N., Burns, G. W., et al. (2020). Identification of Loci and Pathways Associated with Heifer Conception Rate in U.S. Holsteins. Genes 11, 767. doi:10.3390/genes11070767
Garcia, M. D., Matukumalli, L., Wheeler, T. L., Shackelford, S. D., Smith, T. P. L., and Casas, E. (2010). Markers on Bovine Chromosome 20 Associated with Carcass Quality and Composition Traits and Incidence of Contracting Infectious Bovine Keratoconjunctivitis. Anim. Biotechnol. 21, 188–202. doi:10.1080/10495398.2010.495012
Gasparin, G., Miyata, M., Coutinho, L. L., Martinez, M. L., Teodoro, R. L., Furlong, J., et al. (2007). Mapping of Quantitative Trait Loci Controlling Tick [Riphicephalus (Boophilus) Microplus] Resistance on Bovine Chromosomes 5, 7 and 14. Anim. Genet. 38, 453–459. doi:10.1111/j.1365-2052.2007.01634.x
Gobena, M., Elzo, M. A., and Mateescu, R. G. (2018). Population Structure and Genomic Breed Composition in an Angus-Brahman Crossbred Cattle Population. Front. Genet. 9, 90. doi:10.3389/fgene.2018.00090
González-Ruiz, S., Strillacci, M. G., Durán-Aguilar, M., Cantó-Alarcón, G. J., Herrera-Rodríguez, S. E., Bagnato, A., et al. (2019). Genome-wide Association Study in Mexican Holstein Cattle Reveals Novel Quantitative Trait Loci Regions and Confirms Mapped Loci for Resistance to Bovine Tuberculosis. Animals 9, 636. doi:10.3390/ani9090636
Goszczynski, D. E., Corbi-Botto, C. M., Durand, H. M., Rogberg-Muñoz, A., Munilla, S., Peral-Garcia, P., et al. (2018). Evidence of Positive Selection towards Zebuine Haplotypes in the BoLA Region of Brangus Cattle. Animal 12, 215–223. doi:10.1017/s1751731117001380
Grosz, M. D., and MacNeil, M. D. (1999). Brief Communication. The 'spotted' Locus Maps to Bovine Chromosome 6 in Hereford-cross Population. J. Hered. 90, 233–236. doi:10.1093/jhered/90.1.233
Gutierrez-Gil, B., Ball, N., Burton, D., Haskell, M., Williams, J. L., and Wiener, P. (2008). Identification of Quantitative Trait Loci Affecting Cattle Temperament. J. Hered. 99, 629–638. doi:10.1093/jhered/esn060
Hanotte, O., Ronin, Y., Agaba, M., Nilsson, P., Gelhaus, A., Horstmann, R., et al. (2003). Mapping of Quantitative Trait Loci Controlling Trypanotolerance in a Cross of Tolerant West African N'Dama and Susceptible East African Boran Cattle. Proc. Natl. Acad. Sci. 100, 7443–7448. doi:10.1073/pnas.1232392100
Hawken, R. J., Zhang, Y. D., Fortes, M. R. S., Collis, E., Barris, W. C., Corbet, N. J., et al. (2012). Genome-wide Association Studies of Female Reproduction in Tropically Adapted Beef Cattle1. J. Anim. Sci. 90, 1398–1410. doi:10.2527/jas.2011-4410
Heeney, J. L., and Valli, V. E. (1985). Bovine Ocular Squamous Cell Carcinoma: an Epidemiological Perspective. Can. J. Comp. Med. 49, 21–26.
Hiendleder, S., Thomsen, H., Reinsch, N., Bennewitz, J., Leythe-Horn, B., Looft, C., et al. (2003). Mapping of QTL for Body Conformation and Behavior in Cattle. J. Hered. 94, 496–506. doi:10.1093/jhered/esg090
Hiltpold, M., Niu, G., Kadri, N. K., Crysnanto, D., Fang, Z.-H., Spengeler, M., et al. (2020). Activation of Cryptic Splicing in Bovine WDR19 Is Associated with Reduced Semen Quality and Male Fertility. Plos Genet. 16, e1008804. doi:10.1371/journal.pgen.1008804
Höglund, J. K., Buitenhuis, A. J., Guldbrandtsen, B., Su, G., Thomsen, B., and Lund, M. S. (2009a). Overlapping Chromosomal Regions for Fertility Traits and Production Traits in the Danish Holstein Population. J. Dairy Sci. 92, 5712–5719. doi:10.3168/jds.2008-1964
Höglund, J. K., Buitenhuis, B., Guldbrandtsen, B., Lund, M. S., and Sahana, G. (2015). Genome-wide Association Study for Female Fertility in Nordic Red Cattle. BMC Genet. 16, 110. doi:10.1186/s12863-015-0269-x
Höglund, J. K., Guldbrandtsen, B., Lund, M. S., and Sahana, G. (2012). Analyzes of Genome-wide Association Follow-Up Study for Calving Traits in Dairy Cattle. BMC Genet. 13, 71. doi:10.1186/1471-2156-13-71
Höglund, J. K., Guldbrandtsen, B., Su, G., Thomsen, B., and Lund, M. S. (2009b). Genome Scan Detects Quantitative Trait Loci Affecting Female Fertility Traits in Danish and Swedish Holstein Cattle. J. Dairy Sci. 92, 2136–2143. doi:10.3168/jds.2008-1104
Holmberg, M., and Andersson-Eklund, L. (2006). Quantitative Trait Loci Affecting Fertility and Calving Traits in Swedish Dairy Cattle. J. Dairy Sci. 89, 3664–3671. doi:10.3168/jds.s0022-0302(06)72406-7
Howard, J. T., Kachman, S. D., Snelling, W. M., Pollak, E. J., Ciobanu, D. C., Kuehn, L. A., et al. (2014). Beef Cattle Body Temperature during Climatic Stress: a Genome-wide Association Study. Int. J. Biometeorol. 58, 1665–1672. doi:10.1007/s00484-013-0773-5
Hu, Z.-L., Park, C. A., and Reecy, J. M. (2019). Building a Livestock Genetic and Genomic Information Knowledgebase through Integrative Developments of Animal QTLdb and CorrDB. Nucleic Acids Res. 47, D701–D710. doi:10.1093/nar/gky1084
Imumorin, I. G., Kim, E.-H., Lee, Y.-M., De Koning, D.-J., van Arendonk, J. A., De Donato, M., et al. (2011). Genome Scan for Parent-Of-Origin QTL Effects on Bovine Growth and Carcass Traits. Front. Gene 2, 44. doi:10.3389/fgene.2011.00044
Irano, N., de Camargo, G. M. F., Costa, R. B., Terakado, A. P. N., Magalhães, A. F. B., Silva, R. M. d. O., et al. (2016). Genome-wide Association Study for Indicator Traits of Sexual Precocity in Nellore Cattle. PLoS One 11, e0159502. doi:10.1371/journal.pone.0159502
Jivanji, S., Worth, G., Lopdell, T. J., Yeates, A., Couldrey, C., Reynolds, E., et al. (2019). Genome-wide Association Analysis Reveals QTL and Candidate Mutations Involved in white Spotting in Cattle. Genet. Sel. Evol. 51, 62. doi:10.1186/s12711-019-0506-2
Júnior, G. A. F., Costa, R. B., de Camargo, G. M. F., Carvalheiro, R., Rosa, G. J. M., Baldi, F., et al. (2016). Genome Scan for Postmortem Carcass Traits in Nellore Cattle1. J. Anim. Sci. 94, 4087–4095. doi:10.2527/jas.2016-0632
Karisa, B. K., Thomson, J., Wang, Z., Stothard, P., Moore, S. S., and Plastow, G. S. (2013). Candidate Genes and Single Nucleotide Polymorphisms Associated with Variation in Residual Feed Intake in Beef Cattle1. J. Anim. Sci. 91, 3502–3513. doi:10.2527/jas.2012-6170
Kaupe, B., Brandt, H., Prinzenberg, E.-M., and Erhardt, G. (2007). Joint Analysis of the Influence of CYP11B1 and DGAT1 Genetic Variation on Milk Production, Somatic Cell Score, Conformation, Reproduction, and Productive Lifespan in German Holstein Cattle1. J. Anim. Sci. 85, 11–21. doi:10.2527/jas.2005-753
Keele, J. W., Kuehn, L. A., McDaneld, T. G., Tait, R. G., Jones, S. A., Keel, B. N., et al. (2016). Genomewide Association Study of Liver Abscess in Beef Cattle1,2. J. Anim. Sci. 94, 490–499. doi:10.2527/jas.2015-9887
Kim, E.-S., Sonstegard, T. S., Silva, M. V. G. B., Gasbarre, L. C., and Van Tassell, C. P. (2013). Identification of Quantitative Trait Loci Affecting Gastrointestinal Parasite Resistance in an Experimental Angus Population. Anim. Genet. 45, 117–121. doi:10.1111/age.12101
Kim, J.-J., Farnir, F., Savell, J., and Taylor, J. F. (2003). Detection of Quantitative Trait Loci for Growth and Beef Carcass Fatness Traits in a Cross between Bos taurus (Angus) and Bos indicus (Brahman) Cattle1. J. Anim. Sci. 81, 1933–1942. doi:10.2527/2003.8181933x
Kiser, J. N., Clancey, E., Moraes, J. G. N., Dalton, J., Burns, G. W., Spencer, T. E., et al. (2019). Identification of Loci Associated with conception Rate in Primiparous Holstein Cows. BMC Genomics 20, 840. doi:10.1186/s12864-019-6203-2
Kneeland, J., Li, C., Basarab, J., Snelling, W. M., Benkel, B., Murdoch, B., et al. (2004). Identification and fine Mapping of Quantitative Trait Loci for Growth Traits on Bovine Chromosomes 2, 6, 14, 19, 21, and 23 within One Commercial Line of Bos taurus1. J. Anim. Sci. 82, 3405–3414. doi:10.2527/2004.82123405x
Kolbehdari, D., Wang, Z., Grant, J. R., Murdoch, B., Prasad, A., Xiu, Z., et al. (2008). A Whole-Genome Scan to Map Quantitative Trait Loci for Conformation and Functional Traits in Canadian Holstein Bulls. J. Dairy Sci. 91, 2844–2856. doi:10.3168/jds.2007-0585
Kühn, C., Bennewitz, J., Reinsch, N., Xu, N., Thomsen, H., Looft, C., et al. (2003). Quantitative Trait Loci Mapping of Functional Traits in the German Holstein Cattle Population. J. Dairy Sci. 86, 360–368. doi:10.3168/jds.s0022-0302(03)73614-5
Küpper, J. D., Brandt, H. R., and Erhardt, G. (2014). Genetic Association betweenNOD2polymorphism and Infection Status byMycobacterium aviumssp.Paratuberculosisin German Holstein Cattle. Anim. Genet. 45, 114–116. doi:10.1111/age.12097
Leach, R. J., Craigmile, S. C., Knott, S. A., Williams, J. L., and Glass, E. J. (2010). Quantitative Trait Loci for Variation in Immune Response to a Foot-And-Mouth Disease Virus Peptide. BMC Genet. 11, 107. doi:10.1186/1471-2156-11-107
Leach, R. J., O'Neill, R. G., Fitzpatrick, J. L., Williams, J. L., and Glass, E. J. (2012). Quantitative Trait Loci Associated with the Immune Response to a Bovine Respiratory Syncytial Virus Vaccine. PLoS One 7, e33526. doi:10.1371/journal.pone.0033526
Leal-Gutiérrez, J. D., Elzo, M. A., Johnson, D. D., Hamblen, H., and Mateescu, R. G. (2019). Genome Wide Association and Gene Enrichment Analysis Reveal Membrane Anchoring and Structural Proteins Associated with Meat Quality in Beef. BMC Genomics 20, 151. doi:10.1186/s12864-019-5518-3
Li, G., Peñagaricano, F., Weigel, K. A., Zhang, Y., Rosa, G., and Khatib, H. (2012). Comparative Genomics between Fly, Mouse, and Cattle Identifies Genes Associated with Sire conception Rate. J. Dairy Sci. 95, 6122–6129. doi:10.3168/jds.2012-5591
Li, Y., Gao, Y., Kim, Y. S., Iqbal, A., and Kim, J. J. (2017). A Whole Genome Association Study to Detect Additive and Dominant Single Nucleotide Polymorphisms for Growth and Carcass Traits in Korean Native Cattle, Hanwoo. Asian-australas J. Anim. Sci. 30, 8–19. doi:10.5713/ajas.16.0170
Li, Y., and Kim, J.-J. (2015). Multiple Linkage Disequilibrium Mapping Methods to Validate Additive Quantitative Trait Loci in Korean Native Cattle (Hanwoo). Asian Australas. J. Anim. Sci. 28, 926–935. doi:10.5713/ajas.15.0077
Liu, A., Wang, Y., Sahana, G., Zhang, Q., Liu, L., Lund, M. S., et al. (2017). Genome-wide Association Studies for Female Fertility Traits in Chinese and Nordic Holsteins. Sci. Rep. 7, 8487. doi:10.1038/s41598-017-09170-9
Liu, L., Harris, B., Keehan, M., and Zhang, Y. (2009). Genome Scan for the Degree of white Spotting in Dairy Cattle. Anim. Genet. 40, 975–977. doi:10.1111/j.1365-2052.2009.01936.x
Loh, P.-R., Danecek, P., Palamara, P. F., Fuchsberger, C., A Reshef, Y., K Finucane, H., et al. (2016). Reference-based Phasing Using the Haplotype Reference Consortium Panel. Nat. Genet. 48, 1443–1448. doi:10.1038/ng.3679
Lu, D., Miller, S., Sargolzaei, M., Kelly, M., Vander Voort, G., Caldwell, T., et al. (2013). Genome-wide Association Analyses for Growth and Feed Efficiency Traits in Beef Cattle1. J. Anim. Sci. 91, 3612–3633. doi:10.2527/jas.2012-5716
Lund, M. S., Guldbrandtsen, B., Buitenhuis, A. J., Thomsen, B., and Bendixen, C. (2008). Detection of Quantitative Trait Loci in Danish Holstein Cattle Affecting Clinical Mastitis, Somatic Cell Score, Udder Conformation Traits, and Assessment of Associated Effects on Milk Yield. J. Dairy Sci. 91, 4028–4036. doi:10.3168/jds.2007-0290
Machado, M., S Azevedo, A., Teodoro, R. L., Pires, M. A., Cd Peixoto, M., de Freitas, C., et al. (2010). Genome Wide Scan for Quantitative Trait Loci Affecting Tick Resistance in Cattle (Bos taurus × Bos indicus). BMC Genomics 11, 280. doi:10.1186/1471-2164-11-280
MacNeil, M. D., and Grosz, M. D. (2002). Genome-wide Scans for QTL Affecting Carcass Traits in Hereford × Composite Double Backcross Populations. J. Anim. Sci. 80, 2316–2324. doi:10.2527/2002.8092316x
Maltecca, C., Weigel, K. A., Khatib, H., Cowan, M., and Bagnato, A. (2008). Whole-genome Scan for Quantitative Trait Loci Associated with Birth Weight, Gestation Length and Passive Immune Transfer in a Holstein X Jersey Crossbred Population. Anim. Genet. 40, 27–34. doi:10.1111/j.1365-2052.2008.01793.x
Maltecca, C., Gray, K. A., Weigel, K. A., Cassady, J. P., and Ashwell, M. (2011). A Genome-wide Association Study of Direct Gestation Length in US Holstein and Italian Brown Populations. Anim. Genet. 42, 585–591. doi:10.1111/j.1365-2052.2011.02188.x
Mapholi, N. O., Maiwashe, A., Matika, O., Riggio, V., Bishop, S. C., MacNeil, M. D., et al. (2016). Genome-wide Association Study of Tick Resistance in South African Nguni Cattle. Ticks Tick-borne Dis. 7, 487–497. doi:10.1016/j.ttbdis.2016.02.005
Maples, B. K., Gravel, S., Kenny, E. E., and Bustamante, C. D. (2013). RFMix: a Discriminative Modeling Approach for Rapid and Robust Local-Ancestry Inference. Am. J. Hum. Genet. 93, 278–288. doi:10.1016/j.ajhg.2013.06.020
Martínez, R., Gómez, Y., and Rocha, J. F. M. (2014). Genome-wide Association Study on Growth Traits in Colombian Creole Breeds and Crossbreeds with Zebu Cattle. Genet. Mol. Res. 13, 6420–6432. doi:10.4238/2014.august.25.5
McClure, M. C., Morsci, N. S., Schnabel, R. D., Kim, J. W., Yao, P., Rolf, M. M., et al. (2010). A Genome Scan for Quantitative Trait Loci Influencing Carcass, post-natal Growth and Reproductive Traits in Commercial Angus Cattle. Anim. Genet. 41, 597–607. doi:10.1111/j.1365-2052.2010.02063.x
McDaneld, T. G., Kuehn, L. A., Thomas, M. G., Snelling, W. M., Smith, T. P. L., Pollak, E. J., et al. (2014). Genomewide Association Study of Reproductive Efficiency in Female Cattle1,2,3,4. J. Anim. Sci. 92, 1945–1957. doi:10.2527/jas.2012-6807
Medugorac, I., Seichter, D., Graf, A., Russ, I., Blum, H., Göpel, K. H., et al. (2012). Bovine Polledness - an Autosomal Dominant Trait with Allelic Heterogeneity. PLoS One 7, e39477. doi:10.1371/journal.pone.0039477
Melo, T. P., Fortes, M. R. S., Fernandes Junior, G. A., Albuquerque, L. G., and Carvalheiro, R. (2019). RAPID COMMUNICATION: Multi-Breed Validation Study Unraveled Genomic Regions Associated with Puberty Traits Segregating across Tropically Adapted Breeds1. J. Anim. Sci. 97, 3027–3033. doi:10.1093/jas/skz121
Menjo, D. K., Bebe, B. O., Okeyo, A. M., and Ojango, J. M. K. (2009). Analysis of Early Survival of Holstein-Friesian Heifers of Diverse Sire Origins on Commercial Dairy Farms in Kenya. Trop. Anim. Health Prod. 41, 171–181. doi:10.1007/s11250-008-9172-z
Mészáros, G., Petautschnig, E., Schwarzenbacher, H., and Sölkner, J. (2015). Genomic Regions Influencing Coat Color Saturation and Facial Markings in Fleckvieh Cattle. Anim. Genet. 46, 65–68. doi:10.1111/age.12249
Michenet, A., Barbat, M., Saintilan, R., Venot, E., and Phocas, F. (2016). Detection of Quantitative Trait Loci for Maternal Traits Using High-Density Genotypes of Blonde d'Aquitaine Beef Cattle. BMC Genet. 17, 88. doi:10.1186/s12863-016-0397-y
Mizoshita, K., Watanabe, T., Hayashi, H., Kubota, C., Yamakuchi, H., Todoroki, J., et al. (2004). Quantitative Trait Loci Analysis for Growth and Carcass Traits in a Half-Sib Family of Purebred Japanese Black (Wagyu) Cattle1. J. Anim. Sci. 82, 3415–3420. doi:10.2527/2004.82123415x
Morris, C. A., Bottema, C. D. K., Cullen, N. G., Hickey, S. M., Esmailizadeh, A. K., Siebert, B. D., et al. (2010). Quantitative Trait Loci for Organ Weights and Adipose Fat Composition in Jersey and Limousin Back-Cross Cattle Finished on Pasture or Feedlot. Anim. Genet. 41, 589–596. doi:10.1111/j.1365-2052.2010.02058.x
Mota, R. R., Guimarães, S. E. F., Fortes, M. R. S., Hayes, B., Silva, F. F., Verardo, L. L., et al. (2017). Genome-wide Association Study and Annotating Candidate Gene Networks Affecting Age at First Calving in Nellore Cattle. J. Anim. Breed. Genet. 134, 484–492. doi:10.1111/jbg.12299
Naserkheil, M., Bahrami, A., Lee, D., and Mehrban, H. (2020). Integrating Single-step GWAS and Bipartite Networks Reconstruction Provides Novel Insights into Yearling Weight and Carcass Traits in Hanwoo Beef Cattle. Animals 10, 1836. doi:10.3390/ani10101836
Nayeri, S., Schenkel, F., Fleming, A., Kroezen, V., Sargolzaei, M., Baes, C., et al. (2019). Genome-wide Association Analysis for β-hydroxybutyrate Concentration in Milk in Holstein Dairy Cattle. BMC Genet. 20, 58. doi:10.1186/s12863-019-0761-9
Neupane, M., Kiser, J. N., and Neibergs, H. L. (2018). Gene Set Enrichment Analysis of SNP Data in Dairy and Beef Cattle with Bovine Respiratory Disease. Anim. Genet. 49, 527–538. doi:10.1111/age.12718
Oliveira, J. G. A., Perez, B. C., Cole, J. B., Santana, M. H. A., Silveira, J., Mazzoni, G., et al. (2017). Genomic Study and Medical Subject Headings Enrichment Analysis of Early Pregnancy Rate and Antral Follicle Numbers in Nelore Heifers. J. Anim. Sci. 95, 4796–4812. doi:10.2527/jas2017.1752
Oliveira, J. G. A., Santos, D. J. A., Cesar, A. S. M., Boison, S. A., Ventura, R. V., Perez, B. C., et al. (2020). Fine Mapping of Genomic Regions Associated with Female Fertility in Nellore Beef Cattle Based on Sequence Variants from Segregating Sires. J. Anim. Sci. Biotechnol. 10, 97. doi:10.1186/s40104-019-0403-0
Paim, T. D. P., Hay, E. H. A., Wilson, C., Thomas, M. G., Kuehn, L. A., Paiva, S. R., et al. (2020a). Dynamics of Genomic Architecture during Composite Breed Development in Cattle. Anim. Genet. 51, 224–234. doi:10.1111/age.12907
Paim, T. D. P., Hay, E. H. A., Wilson, C., Thomas, M. G., Kuehn, L. A., Paiva, S. R., et al. (2020b). Genomic Breed Composition of Selection Signatures in Brangus Beef Cattle. Front. Genet. 11, 710. doi:10.3389/fgene.2020.00710
Pausch, H., Flisikowski, K., Jung, S., Emmerling, R., Edel, C., Götz, K. U., et al. (2011). Genome-wide Association Study Identifies Two Major Loci Affecting Calving Ease and Growth-Related Traits in Cattle. Genetics 187, 289–297. doi:10.1534/genetics.110.124057
Peters, S. O., Kizilkaya, K., Garrick, D. J., Fernando, R. L., Reecy, J. M., Weaber, R. L., et al. (2012). Bayesian Genome-wide Association Analysis of Growth and Yearling Ultrasound Measures of Carcass Traits in Brangus Heifers. J. Anim. Sci. 90, 3398–3409. doi:10.2527/jas.2011-4507
Porto-Neto, L. R., Reverter, A., Prayaga, K. C., Chan, E. K. F., Johnston, D. J., Hawken, R. J., et al. (2014). The Genetic Architecture of Climatic Adaptation of Tropical Cattle. PLoS One 9, e113284. doi:10.1371/journal.pone.0113284
Pryce, J. E., Hayes, B. J., Bolormaa, S., and Goddard, M. E. (2011). Polymorphic Regions Affecting Human Height Also Control Stature in Cattle. Genetics 187, 981–984. doi:10.1534/genetics.110.123943
Purcell, S., Neale, B., Todd-Brown, K., Thomas, L., Ferreira, M. A. R., Bender, D., et al. (2007). PLINK: a Tool Set for Whole-Genome Association and Population-Based Linkage Analyses. Am. J. Hum. Genet. 81, 559–575. doi:10.1086/519795
Reinsch, N., Thomsen, H., Xu, N., Brink, M., Looft, C., Kalm, E., et al. (1999). A QTL for the Degree of Spotting in Cattle Shows Synteny with the KIT Locus on Chromosome 6. J. Hered. 90, 629–634. doi:10.1093/jhered/90.6.629
Rhoad, A. O. (1949). The Santa Gertrudis Breed: The Genesis and the Genetics of a New Breed of Beef Cattle. J. Hered. 40, 115–126. doi:10.1093/oxfordjournals.jhered.a106008
Richardson, I. W., Berry, D. P., Wiencko, H. L., Higgins, I. M., More, S. J., McClure, J., et al. (2016). A Genome-wide Association Study for Genetic Susceptibility to Mycobacterium Bovis Infection in Dairy Cattle Identifies a Susceptibility QTL on Chromosome 23. Genet. Sel. Evol. 48, 19. doi:10.1186/s12711-016-0197-x
Ring, S. C., Purfield, D. C., Good, M., Breslin, P., Ryan, E., Blom, A., et al. (2019). Variance Components for Bovine Tuberculosis Infection and Multi-Breed Genome-wide Association Analysis Using Imputed Whole Genome Sequence Data. PLoS One 14, e0212067. doi:10.1371/journal.pone.0212067
Rolf, M. M., Taylor, J. F., Schnabel, R. D., McKay, S. D., McClure, M. C., Northcutt, S. L., et al. (2012). Genome‐wide Association Analysis for Feed Efficiency in Angus Cattle. Anim. Genet. 43, 367–374. doi:10.1111/j.1365-2052.2011.02273.x
Rosen, B. D., Bickhart, D. M., Schnabel, R. D., Koren, S., Elsik, C. G., Tseng, E., et al. (2020). De Novo assembly of the Cattle Reference Genome with Single-Molecule Sequencing. Gigascience 9, giaa021. doi:10.1093/gigascience/giaa021
Rowan, T. N., Hoff, J. L., Crum, T. E., Taylor, J. F., Schnabel, R. D., and Decker, J. E. (2019). A Multi-Breed Reference Panel and Additional Rare Variants Maximize Imputation Accuracy in Cattle. Genet. Sel. Evol. 51, 77. doi:10.1186/s12711-019-0519-x
Saatchi, M., Beever, J. E., Decker, J. E., Faulkner, D. B., Freetly, H. C., Hansen, S. L., et al. (2014a). QTLs Associated with Dry Matter Intake, Metabolic Mid-test Weight, Growth and Feed Efficiency Have Little Overlap across 4 Beef Cattle Studies. BMC Genomics 15, 1004. doi:10.1186/1471-2164-15-1004
Saatchi, M., Schnabel, R. D., Taylor, J. F., and Garrick, D. J. (2014b). Large-effect Pleiotropic or Closely Linked QTL Segregate within and across Ten US Cattle Breeds. BMC Genomics 15, 442. doi:10.1186/1471-2164-15-442
Sahana, G., Guldbrandtsen, B., Bendixen, C., and Lund, M. S. (2010). Genome-wide Association Mapping for Female Fertility Traits in Danish and Swedish Holstein Cattle. Anim. Genet. 41, 579–588. doi:10.1111/j.1365-2052.2010.02064.x
Sahana, G., Guldbrandtsen, B., and Lund, M. S. (2011). Genome-wide Association Study for Calving Traits in Danish and Swedish Holstein Cattle. J. Dairy Sci. 94, 479–486. doi:10.3168/jds.2010-3381
Sanchez, M.-P., Guatteo, R., Davergne, A., Saout, J., Grohs, C., Deloche, M.-C., et al. (2020). Identification of the ABCC4, IER3, and CBFA2T2 Candidate Genes for Resistance to Paratuberculosis from Sequence-Based GWAS in Holstein and Normande Dairy Cattle. Genet. Sel. Evol. 52, 14. doi:10.1186/s12711-020-00535-9
Sanders, J. O. (1980). History and Development of Zebu Cattle in the United States. J. Anim. Sci. 50, 1188–1200. doi:10.2527/jas1980.5061188x
Schnabel, R. D., Sonstegard, T. S., Taylor, J. F., and Ashwell, M. S. (2005). Whole-genome Scan to Detect QTL for Milk Production, Conformation, Fertility and Functional Traits in Two US Holstein Families. Anim. Genet. 36, 408–416. doi:10.1111/j.1365-2052.2005.01337.x
Schrooten, C., Bink, M. C. A. M., and Bovenhuis, H. (2004). Whole Genome Scan to Detect Chromosomal Regions Affecting Multiple Traits in Dairy Cattle. J. Dairy Sci. 87, 3550–3560. doi:10.3168/jds.s0022-0302(04)73492-x
Schrooten, C., Bovenhuis, H., Coppieters, W., and Van Arendonk, J. A. M. (2000). Whole Genome Scan to Detect Quantitative Trait Loci for Conformation and Functional Traits in Dairy Cattle. J. Dairy Sci. 83, 795–806. doi:10.3168/jds.s0022-0302(00)74942-3
Schulman, N. F., Sahana, G., Lund, M. S., Viitala, S. M., and Vilkki, J. H. (2008). Quantitative Trait Loci for Fertility Traits in Finnish Ayrshire Cattle. Genet. Sel. Evol. 40, 195–214. doi:10.1051/gse:2007044
Seabury, C. M., Oldeschulte, D. L., Saatchi, M., Beever, J. E., Decker, J. E., Halley, Y. A., et al. (2017). Genome-wide Association Study for Feed Efficiency and Growth Traits in U.S. Beef Cattle. BMC Genomics 18, 386. doi:10.1186/s12864-017-3754-y
Seidenspinner, T., Bennewitz, J., Reinhardt, F., and Thaller, G. (2009). Need for Sharp Phenotypes in QTL Detection for Calving Traits in Dairy Cattle. J. Anim. Breed. Genet. 126, 455–462. doi:10.1111/j.1439-0388.2009.00804.x
Seitz, J. J., Schmutz, S. M., Thue, T. D., and Buchanan, F. C. (1999). A Missense Mutation in the Bovine MGF Gene Is Associated with the Roan Phenotype in Belgian Blue and Shorthorn Cattle. Mamm. Genome 10, 710–712. doi:10.1007/s003359901076
Sharma, A., Dang, C. G., Kim, K. S., Kim, J. J., Lee, H. K., Kim, H. C., et al. (2014). Validation of Genetic Polymorphisms on BTA14 Associated with Carcass Trait in a Commercial Hanwoo Population. Anim. Genet. 45, 863–867. doi:10.1111/age.12204
Sherman, E. L., Nkrumah, J. D., Li, C., Bartusiak, R., Murdoch, B., and Moore, S. S. (2009). Fine Mapping Quantitative Trait Loci for Feed Intake and Feed Efficiency in Beef Cattle1. J. Anim. Sci. 87, 37–45. doi:10.2527/jas.2008-0876
Sikora, K. M., Magee, D. A., Berkowicz, E. W., Berry, D. P., Howard, D. J., Mullen, M. P., et al. (2011). DNA Sequence Polymorphisms within the Bovine Guanine Nucleotide-Binding Protein Gs Subunit Alpha (Gsα)-Encoding (GNAS) Genomic Imprinting Domain Are Associated with Performance Traits. BMC Genet. 12, 4. doi:10.1186/1471-2156-12-4
Smith, J. L., Wilson, M. L., Nilson, S. M., Rowan, T. N., Oldeschulte, D. L., Schnabel, R. D., et al. (2020). Genome-wide Association and Genotype by Environment Interactions for Growth Traits in U.S. Gelbvieh Cattle. BMC Genomics 20, 926. doi:10.1186/s12864-019-6231-y
Snelling, W. M., Allan, M. F., Keele, J. W., Kuehn, L. A., McDaneld, T., Smith, T. P. L., et al. (2010). Genome-wide Association Study of Growth in Crossbred Beef Cattle12. J. Anim. Sci. 88, 837–848. doi:10.2527/jas.2009-2257
Sollero, B. P., Junqueira, V. S., Gomes, C. C. G., Caetano, A. R., and Cardoso, F. F. (2017). Tag SNP Selection for Prediction of Tick Resistance in Brazilian Braford and Hereford Cattle Breeds Using Bayesian Methods. Genet. Sel. Evol. 49, 49. doi:10.1186/s12711-017-0325-2
Spelman, R. J., Huisman, A. E., Singireddy, S. R., Coppieters, W., Arranz, J., Georges, M., et al. (1999). Short Communication: Quantitative Trait Loci Analysis on 17 Nonproduction Traits in the New Zealand Dairy Population. J. Dairy Sci. 82, 2514–2516. doi:10.3168/jds.s0022-0302(99)75503-7
Srikanth, K., Lee, S.-H., Chung, K.-Y., Park, J.-E., Jang, G.-W., Park, M.-R., et al. (2020). A Gene-Set Enrichment and Protein-Protein Interaction Network-Based GWAS with Regulatory SNPs Identifies Candidate Genes and Pathways Associated with Carcass Traits in Hanwoo Cattle. Genes 11, 316. doi:10.3390/genes11030316
Stafuzza, N. B., Costa e Silva, E. V. d., Silva, R. M. d. O., Costa Filho, L. C. C. d., Barbosa, F. B., Macedo, G. G., et al. (2019). Genome‐wide Association Study for Age at Puberty in Young Nelore Bulls. J. Anim. Breed. Genet. 137, 234–244. doi:10.1111/jbg.12438
Stone, R. T., Keele, J. W., Shackelford, S. D., Kappes, S. M., and Koohmaraie, M. (1999). A Primary Screen of the Bovine Genome for Quantitative Trait Loci Affecting Carcass and Growth Traits. J. Anim. Sci. 77, 1379–1384. doi:10.2527/1999.7761379x
Sugimoto, M., Watanabe, T., and Sugimoto, Y. (2012). The Molecular Effects of a Polymorphism in the 5′UTR of Solute Carrier Family 44, Member 5 that Is Associated with Birth Weight in Holsteins. PLoS One 7, e41267. doi:10.1371/journal.pone.0041267
Sun, J., Jin, Q., Zhang, C., Fang, X., Gu, C., Lei, C., et al. (2011). Polymorphisms in the Bovine Ghrelin Precursor (GHRL) and Syndecan-1 (SDC1) Genes that Are Associated with Growth Traits in Cattle. Mol. Biol. Rep. 38, 3153–3160. doi:10.1007/s11033-010-9986-4
Tang, H., Peng, J., Wang, P., and Risch, N. J. (2005). Estimation of Individual Admixture: Analytical and Study Design Considerations. Genet. Epidemiol. 28, 289–301. doi:10.1002/gepi.20064
Tenesa, A., Navarro, P., Hayes, B. J., Duffy, D. L., Clarke, G. M., Goddard, M. E., et al. (2007). Recent Human Effective Population Size Estimated from Linkage Disequilibrium. Genome Res. 17, 520–526. doi:10.1101/gr.6023607
Thomasen, J. R., Guldbrandtsen, B., Sørensen, P., Thomsen, B., and Lund, M. S. (2008). Quantitative Trait Loci Affecting Calving Traits in Danish Holstein Cattle. J. Dairy Sci. 91, 2098–2105. doi:10.3168/jds.2007-0602
Thornton, T. A., and Bermejo, J. L. (2014). Local and Global Ancestry Inference and Applications to Genetic Association Analysis for Admixed Populations. Genet. Epidemiol. 38 (Suppl. 1), S5–S12. doi:10.1002/gepi.21819
Wang, Y., Wang, S., Liu, T., Tu, W., Li, W., Dong, G., et al. (2015). CARD15 Gene Polymorphisms Are Associated with Tuberculosis Susceptibility in Chinese Holstein Cows. PLoS One 10, e0135085. doi:10.1371/journal.pone.0135085
Warwick, E. J. (1958). Fifty Years of Progress in Breeding Beef Cattle. J. Anim. Sci. 17, 922–943. doi:10.2527/jas1958.174922x
Whitacre, L. (2014). Structural Variation at the KIT Locus Is Responsible for the Piebald Phenotype in Hereford and Simmental Cattle. Columbia, Missouri: University of Missouri-Columbia. MS thesis. Available at: https://mospace.umsystem.edu/xmlui/handle/10355/44434 (Accessed Aug 7, 2021).
Wu, X., Fang, M., Liu, L., Wang, S., Liu, J., Ding, X., et al. (2013). Genome Wide Association Studies for Body Conformation Traits in the Chinese Holstein Cattle Population. BMC Genomics 14, 897. doi:10.1186/1471-2164-14-897
Zhang, C., De Koning, D. J., Hernández-Sánchez, J., Haley, C. S., Williams, J. L., and Wiener, P. (2004). Mapping of Multiple Quantitative Trait Loci Affecting Bovine Spongiform Encephalopathy. Genetics 167, 1863–1872. doi:10.1534/genetics.104.026401
Keywords: indicine, taurine, hybrids, American breeds, selection, haplotype
Citation: Crum TE, Schnabel RD, Decker JE and Taylor JF (2021) Taurine and Indicine Haplotype Representation in Advanced Generation Individuals From Three American Breeds. Front. Genet. 12:758394. doi: 10.3389/fgene.2021.758394
Received: 13 August 2021; Accepted: 27 September 2021;
Published: 18 October 2021.
Edited by:
Tiago do Prado Paim, Goiano Federal Institute (IFGOIANO), BrazilReviewed by:
Marina Rufino Salinas Fortes, University of Queensland, AustraliaRon Lewis, University of Nebraska-Lincoln, United States
Copyright © 2021 Crum, Schnabel, Decker and Taylor. This is an open-access article distributed under the terms of the Creative Commons Attribution License (CC BY). The use, distribution or reproduction in other forums is permitted, provided the original author(s) and the copyright owner(s) are credited and that the original publication in this journal is cited, in accordance with accepted academic practice. No use, distribution or reproduction is permitted which does not comply with these terms.
*Correspondence: Tamar E. Crum, VGFtYXIuQ3J1bUBhY3VpdHlzd2luZS5jb20=; Jeremy F. Taylor, dGF5bG9yamVyckBtaXNzb3VyaS5lZHU=
†Present Address: Acuity Genetics, 7475 State Route 127, Carlyle, IL, United States