Abstract
Over the past decades, massive amounts of protein-protein interaction (PPI) data have been accumulated due to the advancement of high-throughput technologies, and but data quality issues (noise or incompleteness) of PPI have been still affecting protein function prediction accuracy based on PPI networks. Although two main strategies of network reconstruction and edge enrichment have been reported on the effectiveness of boosting the prediction performance in numerous literature studies, there still lack comparative studies of the performance differences between network reconstruction and edge enrichment. Inspired by the question, this study first uses three protein similarity metrics (local, global and sequence) for network reconstruction and edge enrichment in PPI networks, and then evaluates the performance differences of network reconstruction, edge enrichment and the original networks on two real PPI datasets. The experimental results demonstrate that edge enrichment work better than both network reconstruction and original networks. Moreover, for the edge enrichment of PPI networks, the sequence similarity outperformes both local and global similarity. In summary, our study can help biologists select suitable pre-processing schemes and achieve better protein function prediction for PPI networks.
1 Introduction
Over the past decades, massive amounts of un-annotated protein sequence data have been accumulated with the advancement of high-throughput biological technologies. Due to high costs and time-consummation of experimental determining protein function annotation, the proportion of annotated proteins has been still relatively low (Sharan et al., 2007; Barrell et al., 2009). The increasing efforts have been made to predict protein functions.
As the best-known and early method of protein function prediction, homology-based prediction method indeed gave rise to a series of protein function prediction methods based on protein sequence or structural similarity (Sleator and Walsh, 2010). At the same time, the emerging of available protein databases, such as FATCAT (Ye and Godzik, 2004), PAST (Täubig et al., 2006) and PROCAT (Wallace et al., 1996), has further helped to improve the effectiveness of protein prediction. However, the low sequence similarity scores often occur when comparing target protein sequences with source protein sequences (Ofran et al., 2005), and thus this significantly reduces the effective application of homology-based prediction methods.
With the increasing amounts of the measured protein-protein interaction (PPI) data, more and more protein function prediction methods based on PPI networks are proposed and generally outperform the above homology-based prediction methods. In PPI networks, proteins and protein-protein interactions are represented by nodes and edges, respectively (Sharan et al., 2007; Chen et al., 2020; Wu et al., 2020; Waiho et al., 2021). Up to now, numerous algorithms have been used in protein function prediction based on PPI networks, such as edge-betweenness clustering (Dunn et al., 2005), Graphlet-based edge clustering (Solava et al., 2012), clique percolation (Adamcsek et al., 2006), GRAAL (Kuchaiev et al., 2010), hybrid-property based method (Hu et al., 2011), and IsoRank (Singh et al., 2008). Moreover, advanced machine learning and deep learning techniques have also been used for protein function prediction, including collective classification (Xiong et al., 2013; Wu et al., 2014), active learning (Xiong et al., 2014), DeepInteract (Sunil et al., 2017), ConvsPPIS (Zhu et al., 2020), PhosIDN (Yang et al., 2021) and WinBinVec (Abdollahi et al., 2021), etc.
The above methods mainly use existing PPI data. However, current PPI data mainly generated by high-throughput or TAP-MS techniques (Berggard et al., 2007), are often in presence of noise and incompleteness, and this unavoidably causes adverse effects on the prediction performance. Two main methods of network reconstruction and edge enrichment are proposed to effectively boost the prediction performance. Different strategies are used for network reconstruction or edge enrichment. For example, Bogdanov and Singh (2010) presented a network reconstruction approach by extracting functional neighborhood features using random walk with restart. Chua et al. (2007) used weighting strategies to enrich PPI networks, and adopted a local prediction method to predict the functions of un-annotated proteins. Xiong et al. (2013) applied collective classification to PPI networks with enriched edges to predict protein functions.
Although the above two types of approaches achieve promising performance improvements, there still lack comparative studies of the performance differences between network reconstruction and edge enrichment. We do not still know which one is better in performance, or specifically, which one should be applied for different situations. Inspired by the question, we conducte a comprehensive comparison of two network transformation of network reconstruction and edge enrichment for boosting the performance of PPI network-based protein functional annotation. Concretely, we first use three different protein similarity metrics for network reconstruction and edge enrichment of PPI networks, and then evaluate the performance differences between the two transformed networks (network reconstruction and edge enrichment) and original networks on two real PPI datasets. The results of experiments demonstrate that edge enrichment work better than both network reconstruction and original networks. Moreover, for the edge enrichment of PPI networks, the sequence similarity outperformes both local and global similarity. More detailed work will be presented in later sections.
2 Materials and Methods
2.1 Similarity Metrics
As we point out above, the noise and incompleteness of PPI network data adversely affects the performance of protein functional annotation. Network reconstruction and edge enrichment are major approaches to improve PPI data quality. In this work, we carry out comparison study on these two approaches by reconstructing and enriching original networks using various protein similarity metrics, including sequence similarity, local similarity and global similarity. In what follows, we describe and discuss these similarity measures in detail.
2.1.1 Protein Sequence Similarity
BLAST method (Altschul et al., 1997) is used to measure the similarity between any two proteins in this study. The similarity of a given protein Vx with other proteins is defined aswhere Sx,i is the similarity score between the pair of proteins Vx and Vi. Due to ignoring self-similarity, Sx,i = 0 is set when x = i.
2.1.2 Local Similarity Indices
We consider three kinds of local similarity indices, including Common Neighbors (CN), Jaccard Index and Functional Similarity (FS).
Common Neighbors. Given nodes u and v, their neighboring sets are Nu and Nv, respectively. The CN is defined as the neighborhood overlap of the nodes (Newman, 2001). The more identical neighbors two nodes have, the higher the CN value is. The measure of CN is as follows:
Jaccard Index. Given nodes u and v and their corresponding neighboring sets of Nu and Nv, Jaccard index is used to measure the similarity between the Nu and Nv sets, and it is calculated as:
Functional Similarity (FS). For a PPI network, FS index was first used to measure the similarity of any pair of proteins (Chua et al., 2006), and it is defined as follows:where , and by using the λu,v factor, similarity weights between protein pairs are penalized when their common neighbors are too few. navg is the average number of close neighbors that each node has in the network. In a weighted PPI network, the labeled weights of edges mean interaction confidences between pairs of proteins. Thus, we can modify the FS index to take into account the confidence of each interaction. The extended FS index for weighted PPI networks, named FS.R, is defined as follows:
2.1.3 Global Similarity Indices
Two global similarity indices are considered in this paper, they are Katz index and random walk with restart.
Katz Index. This index is proposed by Lü and Zhou (2011). It sums the set of paths directly and deals with the paths by length so that the shorter paths get more weights. Formally,where is the set of the paths, which connect the nodes of u and v with a path length of L. The parameter of β controls the path weights.
Random Walk with Restart (RWR). Tong et al. (2008) used RWR index to measure the relevance score between node j and node i in a PPI network. Given the adjacency matrix Wn,n of a PPI network, a random walker transmits from the starting node i to one of its neighbors at random with probability c, and returns to the node i with the probability 1 − c. Finally, the walker will stay stably at node j with probability Ri,j. The steady-state probability Ri,j is defined as RWR index. We havewhere is the starting vector, the ith element is 1 and the other elements are 0. is a weighted matrix. For an unweighted network, (where m is the number of neighbors that node i has) if i and j are connected, and otherwise. For a weighted network,
2.2 Network Reconstruction and Edge Enrichment
Network reconstruction is carried out as follows: First, the similarity scores between protein pairs in the original PPI network are calculated according to the above similarity indexes. Next, some interactions are selected to reconstruct the PPI network based on the similarity scores. As in Liben-Nowell and Kleinberg (2007), an appropriate score threshold is used such that the number of protein pairs with higher scores than the threshold is as same as possible to the interaction number of the original network. Then, a new network is formed by using the protein pairs with higher scores over the threshold. However, this approach may lead to absence of some proteins in the new network. Alternatively, for any node Ni in the original network, we first remove all its interactions. We find the top k neighbors most similar to the node Ni. Then, the k edges from the node Ni to its top k neighbors are created, and their similarity scores are used as edge weights in the new network. Thus, we have
Edge enrichment is also performed in two steps as in network reconstruction, the only difference is that all interactions in the original network are preserved. An enriched network has two types of edges: explicit edges (old edges) and similarity-inferred edges (new edges). Here, there are two questions to be addressed: One is how to combine the edge weights with different semantics, and another is how many edges are added for each protein, that is, how to optimize the parameter k (see Eq. 9). The questions will be discussed in the following sections.
2.3 Protein Function Prediction Approaches
In this study, protein function predictions on two real PPI datasets are performed using two different approaches.The first one is majority method, which is a local neighbor counting approach (Schwikowski et al., 2000). The second is a global protein function prediction approach, which is common called collective classification (Xiong et al., 2013). Details of this approach are presented in the following subsections.
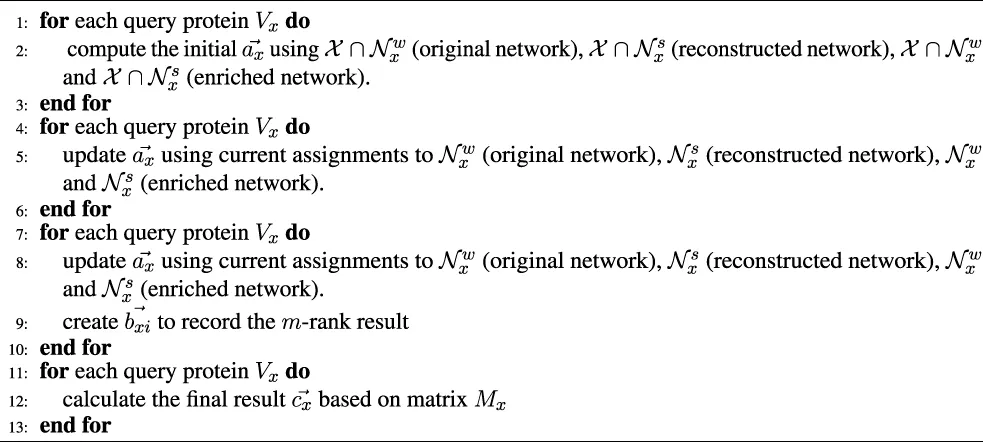
ALGORITHM 1
 |
Gibbs sampling
2.4 Gibbs Sampling Based Collective Classification
Gibbs sampling (GS) includes two main processes of bootstrapping and iterative classification (Sen et al., 2008). The pseudo-code is illustrated below.
2.4.1 Bootstrapping
The closer the proteins to each other, the more similar their functions become in a PPI network. For an unannotated protein, its probability distribution is estimated using a weighted voting method. In the original or reconstructed network, there is only one kind of annotated neighbors to vote. An unannotated protein Vx has the corresponding explicit neighbors of Nx or k similarity-inferred neighbors. For the above neighbor sets, we have their edge weights as follows:
The probability of Vx having the jth function Fj (VxFj) is calculated as follows:where and are the normalizers:
However, in the enriched network, there are both old (explicit) and new (similarity-inferred) neighbors which need to be voted. So, the parameter λ ∈ (0, 1) is used to combine the two types of different neighbors. Given a query protein Vx, the VxFj probability is calculated as follows:
A higher value indicates a higher probability that protein Vx is more likely to have jth function Fj. The VxFj probability distribution is represented as:
2.4.2 Iterative Classification
Iterative classification has two main steps of burn-in and sampling. In burn-in period, iteration number is fixed, and is updated in each iteration. In sampling period, we update in each iteration, and also count how many times the jth function Fj for protein Vx are sampled. Considering each protein with one or more functions, therefore, we define the most likely function of the protein Vx as follow:where represents the jth most likely function of the protein Vx, that is the jth-rank result. We further use vector to record all ranking results in the ith iteration.
The matrix Mx with s rows and m columns is produced after running the predetermined s number of iterations.
Finally, we obtain the required m-dimensional vector for query protein Vx:where is the first ranked prediction in the ith column of Mx.
3 Results and Discussion
3.1 Data Preprocessing and Experimental Workflow
The two PPI datasets of A and B are used in our study. The datasets A and B are downloaded from the databases of BioGRID (Stark et al., 2011) and STRING (Szklarczyk et al., 2011), respectively. The datasets A and B are annotated as in Ashburner et al. (2000). The datasets in this study are based on Gene Ontology (GO) annotation. GO annotations consist of three basic namespaces: molecular function, biological process and cellular component. We construct one protein interaction network for each GO namespace using only physical interactions.Therefore, there are totally six PPI networks (three for S.cerevisiae and the other three for M.musculus) in Dataset A. For Dataset B, we construct two PPI networks (one for S.cerevisiae and another for M.musculus).More detailed information was listed in the supplementary material (Supplementary Table S1).
The comparison of the function prediction performance on the reconstructed and enriched networks with that on the original networks is first performed using the cross validation of leave-one-out method (LOOM). LOOM takes each protein in turn as a query protein, and carries out function prediction with the remaining proteins in the network. As the bootstrapping in Gibbs sampling based collective classification does not result in updating of the query protein, therefore we use the majority method to predict protein functions in LOOM cross validation. Then, the annotated protein proportion is changed from 10% to 90%, and the average performance of 10 experiments is reported for each of all proportions. The majority method is not suitable in this setting because it is a local neighbor counting approach and does not work well in sparsely-labeled network. Thus, the Gibbs sampling based collective classification is used to predict protein functions. The main hardware configuration of an Inter dual-core processor (3 GHz) and 16GB RAM, with a Linux operating system, and Python 3.0 is as the programming environment for running the algorithms.
Finally, as in Bogdanov and Singh (2010), the ratio of the number of true positive (TP) predictions to the number of false positivepredictions (FP) is produced in the cross validation, i.e. TP/FP is used to assess prediction accuracy of PPI networks. We define the overall ith rank true positive (TP) as the number of proteins whose ith rank predicted function is one of the true functions of protein Vx, and the overall ith rank false positive (FP) as the number of proteins whose ith rank predicted function is not one of the true functions of protein Vx.
3.2 Similarity Index Selection and the Effect of the Parameters k and λ
In this study, in addition to sequence similarity, the PPI networks are reconstructed and enriched by using three local similarity indices (CN, Jaccard and FS)and two global similarity indices (Katz and RWR). In order to choose the best ones for the following experiments, the performance differences between the five similarity indices are evaluated over the two datasets of A and B. The experimental results over the dataset A are presented in Supplementary Table S3 and Table 1, and ones over the Dataset B listed in Table 2. Using FS as the local similarity index and RWR as the global similarity index generally achieve the best performance. Hence, FS and RWR are selected as the local similarity index and global similarity index, respectively in the following experiments.
TABLE 1
| Indices | Molecular function | Biological process | Cellular component | |||||||
|---|---|---|---|---|---|---|---|---|---|---|
| 1st rank | 2nd rank | 3rd rank | 1st rank | 2nd rank | 3rd rank | 4th rank | 1st rank | 2nd rank | 3rd rank | |
| Origin | 0.28 | 0.12 | 0.10 | 0.39 | 0.23 | 0.13 | 0.09 | 1.63 | 0.45 | 0.24 |
| CN | 0.21 | 0.09 | 0.07 | 0.27 | 0.22 | 0.14 | 0.09 | 1.44 | 0.47 | 0.16 |
| Jaccard | 0.30 | 0.16 | 0.11 | 0.49 | 0.30 | 0.129 | 0.11 | 1.94 | 0.56 | 0.25 |
| FS | 0.33 | 0.15 | 0.15 | 0.47 | 0.28 | 0.16 | 0.12 | 2.13 | 0.61 | 0.27 |
| CN+ | 0.27 | 0.14 | 0.10 | 0.37 | 0.26 | 0.14 | 0.11 | 1.70 | 0.54 | 0.21 |
| Jaccard+ | 0.35 | 0.16 | 0.12 | 0.54 | 0.34 | 0.15 | 0.12 | 2.03 | 0.62 | 0.27 |
| FS+ | 0.38 | 0.16 | 0.15 | 0.52 | 0.30 | 0.16 | 0.14 | 2.23 | 0.69 | 0.29 |
| Katz | 0.29 | 0.13 | 0.12 | 0.45 | 0.23 | 0.17 | 0.11 | 1.70 | 0.54 | 0.28 |
| RWR | 0.32 | 0.15 | 0.13 | 0.49 | 0.26 | 0.16 | 0.12 | 2.23 | 0.61 | 0.30 |
| Katz+ | 0.31 | 0.16 | 0.14 | 0.47 | 0.26 | 0.19 | 0.14 | 2.13 | 0.59 | 0.27 |
| RWR+ | 0.35 | 0.15 | 0.16 | 0.52 | 0.28 | 0.17 | 0.12 | 2.45 | 0.64 | 0.33 |
Comparison of performance differences between similarity indices (Dataset A: M.musculus).
TABLE 2
| Indices | S.cerevisiae | M.musculus | ||||
|---|---|---|---|---|---|---|
| 1st rank | 2nd rank | 3rd rank | 1st rank | 2nd rank | 3rd rank | |
| Origin | 2.23 | 0.75 | 0.49 | 1.94 | 1.49 | 0.82 |
| CN | 1.50 | 0.54 | 0.29 | 1.28 | 0.69 | 0.43 |
| Jaccard | 1.55 | 0.62 | 0.39 | 1.51 | 1.13 | 0.79 |
| FS | 1.70 | 0.64 | 0.41 | 1.56 | 1.22 | 0.75 |
| CN+ | 1.85 | 0.67 | 0.43 | 1.63 | 1.27 | 0.72 |
| Jaccard+ | 1.95 | 0.65 | 0.49 | 1.78 | 1.33 | 0.78 |
| FS+ | 2.13 | 0.72 | 0.47 | 1.92 | 1.51 | 0.81 |
| Katz | 1.63 | 0.62 | 0.41 | 1.70 | 1.33 | 0.75 |
| RWR | 1.78 | 0.67 | 0.43 | 1.78 | 1.27 | 0.79 |
| Katz+ | 1.86 | 0.64 | 0.47 | 1.86 | 1.51 | 0.79 |
| RWR+ | 2.23 | 0.75 | 0.52 | 2.03 | 1.49 | 0.85 |
Comparison of performance differences between similarity indices (Dataset B).
The effect of two parameters on the performance of network reconstruction and edge enrichment are also examined in our study. The first one is the number of similarity-inferred edges k. The prediction performance on the Datasets of A and B is listed in Supplementary Table S4, Table 3, and Table 4, with the varying values of k. For both the datasets A and B, experimental results show that BLAST roughly achieves the best performance by setting k = 5. When the values of k = {10, 30, 50, 100} are used for FS and RWR, using k = 30 or k = 50 generally works best in most cases, and the overall performance is relatively robust for the reconstructed or enriched networks. Hence, in the following experiments, the parameter value of k is used as 5, 30, 30 for BLAST, FS and RWR, respectively.
TABLE 3
| Indices | Molecular function | Biological process | Cellular component | |||||||
|---|---|---|---|---|---|---|---|---|---|---|
| 1st rank | 2nd rank | 3rd rank | 1st rank | 2nd rank | 3rd rank | 4th rank | 1st rank | 2nd rank | 3rd rank | |
| Origin | 0.28 | 0.12 | 0.10 | 0.39 | 0.23 | 0.13 | 0.09 | 1.63 | 0.45 | 0.24 |
| BLAST 1 | 0.34 | 0.19 | 0.09 | 0.30 | 0.16 | 0.08 | 0.04 | 0.79 | 0.34 | 0.13 |
| BLAST 5 | 0.43 | 0.26 | 0.13 | 0.45 | 0.22 | 0.12 | 0.08 | 0.98 | 0.38 | 0.18 |
| BLAST 10 | 0.45 | 0.27 | 0.11 | 0.43 | 0.18 | 0.13 | 0.09 | 0.96 | 0.35 | 0.17 |
| BLAST 15 | 0.41 | 0.21 | 0.13 | 0.42 | 0.20 | 0.11 | 0.09 | 0.92 | 0.33 | 0.19 |
| BLAST+1 | 0.39 | 0.24 | 0.15 | 0.47 | 0.26 | 0.15 | 0.12 | 1.71 | 0.49 | 0.27 |
| BLAST+5 | 0.47 | 0.29 | 0.23 | 0.56 | 0.30 | 0.18 | 0.14 | 2.02 | 0.67 | 0.32 |
| BLAST+10 | 0.49 | 0.24 | 0.21 | 0.54 | 0.32 | 0.14 | 0.11 | 1.94 | 0.58 | 0.29 |
| BLAST+15 | 0.46 | 0.27 | 0.20 | 0.49 | 0.34 | 0.15 | 0.12 | 1.86 | 0.62 | 0.33 |
| FS 10 | 0.30 | 0.14 | 0.12 | 0.42 | 0.24 | 0.14 | 0.09 | 1.71 | 0.54 | 0.23 |
| FS 30 | 0.33 | 0.15 | 0.15 | 0.47 | 0.28 | 0.16 | 0.12 | 2.13 | 0.61 | 0.27 |
| FS 50 | 0.35 | 0.16 | 0.17 | 0.46 | 0.30 | 0.18 | 0.14 | 2.04 | 0.64 | 0.28 |
| FS 100 | 0.32 | 0.18 | 0.12 | 0.45 | 0.27 | 0.17 | 0.15 | 1.95 | 0.57 | 0.26 |
| FS+10 | 0.32 | 0.14 | 0.12 | 0.26 | 0.14 | 0.14 | 0.10 | 1.95 | 0.58 | 0.25 |
| FS+30 | 0.39 | 0.16 | 0.15 | 0.52 | 0.30 | 0.16 | 0.14 | 2.23 | 0.70 | 0.30 |
| FS+50 | 0.41 | 0.15 | 0.11 | 0.54 | 0.24 | 0.14 | 0.14 | 2.21 | 0.67 | 0.25 |
| FS+100 | 0.38 | 0.18 | 0.16 | 0.50 | 0.27 | 0.16 | 0.13 | 2.07 | 0.64 | 0.27 |
| RWR 10 | 0.25 | 0.13 | 0.11 | 0.41 | 0.21 | 0.14 | 0.09 | 1.86 | 0.54 | 0.24 |
| RWR 30 | 0.32 | 0.15 | 0.13 | 0.49 | 0.26 | 0.16 | 0.11 | 2.23 | 0.61 | 0.30 |
| RWR 50 | 0.31 | 0.16 | 0.11 | 0.47 | 0.21 | 0.17 | 0.12 | 2.33 | 0.58 | 0.27 |
| RWR 100 | 0.29 | 0.15 | 0.15 | 0.44 | 0.22 | 0.16 | 0.14 | 2.12 | 0.55 | 0.30 |
| RWR+10 | 0.29 | 0.14 | 0.13 | 0.47 | 0.23 | 0.15 | 0.12 | 2.13 | 0.57 | 0.29 |
| RWR+30 | 0.35 | 0.15 | 0.16 | 0.52 | 0.28 | 0.18 | 0.12 | 2.45 | 0.64 | 0.33 |
| RWR+50 | 0.34 | 0.16 | 0.15 | 0.49 | 0.28 | 0.14 | 0.13 | 2.36 | 0.62 | 0.32 |
| RWR+100 | 0.31 | 0.15 | 0.15 | 0.46 | 0.25 | 0.16 | 0.12 | 2.23 | 0.58 | 0.36 |
The influence of the parameter of k (M.musculus in Dataset A).
TABLE 4
| Indices | S.cerevisiae | M.musculus | ||||
|---|---|---|---|---|---|---|
| 1st rank | 2nd rank | 3rd rank | 1st rank | 2nd rank | 3rd rank | |
| Origin | 2.23 | 0.75 | 0.49 | 1.94 | 1.49 | 0.82 |
| BLAST 1 | 0.96 | 0.37 | 0.17 | 1.28 | 0.59 | 0.35 |
| BLAST 5 | 1.18 | 0.43 | 0.28 | 1.63 | 0.75 | 0.45 |
| BLAST 10 | 1.21 | 0.39 | 0.24 | 1.70 | 0.72 | 0.41 |
| BLAST 15 | 1.15 | 0.42 | 0.26 | 1.56 | 0.70 | 0.50 |
| BLAST+1 | 2.11 | 0.64 | 0.45 | 2.15 | 1.51 | 0.82 |
| BLAST+5 | 2.83 | 0.82 | 0.64 | 2.45 | 1.63 | 0.87 |
| BLAST+10 | 2.57 | 0.75 | 0.65 | 2.33 | 1.57 | 0.85 |
| BLAST+15 | 2.40 | 0.69 | 0.62 | 2.28 | 1.49 | 0.76 |
| FS 10 | 1.53 | 0.55 | 0.38 | 1.33 | 1.06 | 0.68 |
| FS 30 | 1.72 | 0.64 | 0.41 | 1.56 | 1.22 | 0.75 |
| FS 50 | 1.75 | 0.57 | 0.38 | 1.64 | 1.19 | 0.79 |
| FS 100 | 1.63 | 0.61 | 0.37 | 1.68 | 1.18 | 0.73 |
| FS+10 | 1.93 | 0.65 | 0.40 | 1.85 | 0.42 | 0.79 |
| FS+30 | 2.13 | 0.72 | 0.47 | 1.92 | 1.51 | 0.81 |
| FS+50 | 2.05 | 0.70 | 0.44 | 1.83 | 1.40 | 0.76 |
| FS+100 | 1.90 | 0.67 | 0.49 | 1.92 | 1.45 | 0.78 |
| RWR 10 | 1.50 | 0.57 | 0.36 | 1.57 | 1.08 | 0.69 |
| RWR 30 | 1.78 | 0.67 | 0.43 | 1.78 | 1.27 | 0.79 |
| RWR 50 | 1.72 | 0.63 | 0.40 | 1.69 | 1.31 | 0.74 |
| RWR 100 | 1.70 | 0.61 | 0.45 | 1.64 | 1.17 | 0.82 |
| RWR+10 | 2.00 | 0.70 | 0.46 | 1.88 | 1.40 | 0.69 |
| RWR+30 | 2.23 | 0.75 | 0.52 | 2.03 | 1.49 | 0.85 |
| RWR+50 | 2.11 | 0.72 | 0.49 | 1.94 | 1.43 | 0.82 |
| RWR+100 | 1.94 | 0.81 | 0.48 | 1.82 | 1.45 | 0.75 |
The effect of the parameter k (Dataset B).
The second parameter λ dominates the tradeoff between explicit edges and similarity-inferred edges. Further, the effect of the parameter λ is evaluated on the prediction performance when it varies from 0.1 to 0.9. The results on the Dataset A are listed in Supplementary material (see Supplementary Table S5) and Table 5, and ones on the Dataset B in Table 6, respectively. Generally, the λ value has a relatively small impact on prediction accuracy, unless it is too large or too small. In the following experiments, the λ value is set uniformly at 0.7.
TABLE 5
| Indices | Molecular function | Biological process | Cellular component | |||||||
|---|---|---|---|---|---|---|---|---|---|---|
| 1st rank | 2nd rank | 3rd rank | 1st rank | 2nd rank | 3rd rank | 4th rank | 1st rank | 2nd rank | 3rd rank | |
| Origin | 0.28 | 0.12 | 0.10 | 0.39 | 0.23 | 0.13 | 0.09 | 1.63 | 0.45 | 0.24 |
| BLAST+0.1 | 0.38 | 0.21 | 0.11 | 0.43 | 0.24 | 0.12 | 0.13 | 1.52 | 0.41 | 0.20 |
| BLAST+0.3 | 0.40 | 0.25 | 0.18 | 0.49 | 0.29 | 0.17 | 0.11 | 1.65 | 0.54 | 0.25 |
| BLAST+0.5 | 0.44 | 0.30 | 0.16 | 0.537 | 0.27 | 0.15 | 0.15 | 1.85 | 0.62 | 0.28 |
| BLAST+0.7 | 0.47 | 0.29 | 0.23 | 0.56 | 0.32 | 0.16 | 0.14 | 2.02 | 0.67 | 0.34 |
| BLAST+0.9 | 0.33 | 0.16 | 0.15 | 0.42 | 0.23 | 0.13 | 0.10 | 1.76 | 0.55 | 0.27 |
| FS+0.1 | 0.31 | 0.14 | 0.12 | 0.49 | 0.24 | 0.15 | 0.13 | 1.94 | 0.59 | 0.27 |
| FS+0.3 | 0.35 | 0.16 | 0.16 | 0.53 | 0.33 | 0.13 | 0.10 | 1.86 | 0.68 | 0.25 |
| FS+0.5 | 0.37 | 0.15 | 0.13 | 0.49 | 0.31 | 0.18 | 0.11 | 2.04 | 0.63 | 0.28 |
| FS+0.7 | 0.39 | 0.16 | 0.15 | 0.52 | 0.30 | 0.16 | 0.14 | 2.23 | 0.70 | 0.30 |
| FS+0.9 | 0.30 | 0.13 | 0.10 | 0.42 | 0.222 | 0.14 | 0.11 | 1.86 | 0.57 | 0.26 |
| RWR+0.1 | 0.30 | 0.13 | 0.12 | 0.47 | 0.29 | 0.16 | 0.12 | 2.12 | 0.59 | 0.28 |
| RWR+0.3 | 0.33 | 0.15 | 0.14 | 0.50 | 0.31 | 0.11 | 0.08 | 2.22 | 0.64 | 0.32 |
| RWR+0.5 | 0.35 | 0.13 | 0.17 | 0.50 | 0.24 | 0.16 | 0.10 | 2.32 | 0.74 | 0.30 |
| RWR+0.7 | 0.37 | 0.17 | 0.14 | 0.52 | 0.28 | 0.18 | 0.12 | 2.45 | 0.64 | 0.33 |
| RWR+0.9 | 0.30 | 0.13 | 0.10 | 0.43 | 0.26 | 0.14 | 0.10 | 1.94 | 0.57 | 0.27 |
The influence of the parameter λ (M.musculus in Dataset A).
TABLE 6
| Indices | S.cerevisiae | M.musculus | ||||
|---|---|---|---|---|---|---|
| 1st rank | 2nd rank | 3rd rank | 1st rank | 2nd rank | 3rd rank | |
| Origin | 2.23 | 0.75 | 0.49 | 1.94 | 1.49 | 0.82 |
| BLAST+0.1 | 1.56 | 0.63 | 0.41 | 1.76 | 1.28 | 0.72 |
| BLAST+0.3 | 1.89 | 0.70 | 0.58 | 2.01 | 1.44 | 0.78 |
| BLAST+0.5 | 2.56 | 0.75 | 0.66 | 2.34 | 1.37 | 0.82 |
| BLAST+0.7 | 2.83 | 0.82 | 0.64 | 2.45 | 1.63 | 0.87 |
| BLAST+0.9 | 2.36 | 0.79 | 0.56 | 2.12 | 1.51 | 0.85 |
| FS+0.1 | 1.86 | 0.66 | 0.42 | 1.70 | 1.33 | 0.74 |
| FS+0.3 | 1.93 | 0.64 | 0.45 | 1.86 | 1.38 | 0.81 |
| FS+0.5 | 2.06 | 0.69 | 0.43 | 2.02 | 1.44 | 0.87 |
| FS+0.7 | 2.13 | 0.72 | 0.47 | 1.92 | 1.51 | 0.84 |
| FS+0.9 | 1.99 | 0.75 | 0.41 | 1.88 | 1.62 | 0.79 |
| RWR+0.1 | 1.82 | 0.62 | 0.42 | 1.65 | 1.38 | 0.77 |
| RWR+0.3 | 1.94 | 0.65 | 0.48 | 1.83 | 1.44 | 0.83 |
| RWR+0.5 | 2.02 | 0.71 | 0.54 | 1.95 | 1.46 | 0.73 |
| RWR+0.7 | 2.23 | 0.75 | 0.52 | 2.03 | 1.49 | 0.82 |
| RWR+0.9 | 2.12 | 0.69 | 0.47 | 1.92 | 1.43 | 0.77 |
The influence of the parameter λ (Dataset B).
3.3 Performance Evaluation on Dataset A
The performance comparison of reconstructed and enriched networks with that of the original networks is first carried out by leave-one-out validation. The top protein function prediction is selected according to the average number of useful functions per protein in the PPI networks. Therefore, only the top 2 predictions are performed on the PPI networks of S.cerevisiae in the Dataset A, and the top 3 or 4 predictions are examined for M.musculus in Dataset A.
Obviously, edge enrichment gains more accurate predictions than network reconstruction and original networks, due to the combination of explicit and implicit (similarity-inferred) edges (Figure 1). The results clearly indicate that edge enrichment indeed gains better prediction performance by adding similarity-inferred edges to PPI networks. BLAST-enriched networks always worke best, while BLAST-reconstructed networks always work worst. This is because BLAST-inferred edges are based on protein sequence information that is short in the original networks. The useful information in the original network greatly increases by adding BLAST-inferred edges, and consequently boosts prediction accuracy. However, in the reconstructed networks, the original PPI edges are put aside first, BLAST-reconstructed networks contain only protein sequence information, and thus performe worst. The experimental results also validate that FS-reconstructed networks and RWR-reconstructed networks work better than the original networks in most cases. This is because the reconstructed networks filter out noisy or spurious interactions in the original PPI networks.
FIGURE 1
We further evaluate prediction accuracy of these three kinds of networks by using Gibbs Sampling in sparse-labeled PPI networks. Concretely, in PPI networks, the annotated protein proportion is changed from 0.1 to 0.9, and the remaining protein functions are predicted. For each proportion of the annotated proteins, the average prediction accuracy of running 10 experiments is presented on the PPI networks of S.cerevisiae (Figure 2)and M.musculus (Figure 3), respectively. The enrichment gains more accurate predictions than network reconstruction and original networks. The BLAST-enriched networks always work the best, while the BLAST-reconstructed networks always perform the worst. As expected, the experimental results also validate that FS-reconstructed networks and RWR-reconstructed networks generally performe better than the original networks. As the annotated protein proportion in the original networks increases, the prediction performance gets better for most networks, especially for the 1-st rank function. However, the prediction performance of the original network slightly declines as its annotated protein proportion increases (Figure 3G, H).
FIGURE 2
FIGURE 3
3.4 Performance Evaluation on Dataset B
As above, the performance of reconstructed and enriched networks is first compared with that of the original networks by leave-one-out validation. Here, the top 3 protein function predictions are considered for both PPI networks of S. cerevisiae and M. musculus. As expected, edge enrichment gaines higher accurate predictions than network reconstruction and original networks. Moreover, BLAST-enriched networks get best, while the BLAST-reconstructed networks always work worst (Figure 4). The reasons are the same as for the dataset A.
FIGURE 4
Next, we evaluate the prediction performance of these networks in sparse-labeled conditions with the collective classification method. Similarly, the average prediction performance is generated over running 10 experiments, with the annotated-protein proportion varying from 0.1 to 0.9. Generally, the experimental results present a similar trend to the above for the dataset A (Figure 5). However, FS-reconstructed networks and RWR-reconstructed networks do not outperform the original networks, due to the quality properties of the dataset itself. This is mainly because many informative interactions are deleted and the prediction performance is impaired when reconstructing the networks based on similarity.
FIGURE 5
To validate this point, 10% and 50% interactions of the original network of the dataset B are randomly selected to construct two sparse networks. The leave-one-out validation is then performed over the two sparse networks. The selection process have two steps: First, a random weight is assigned to each edge of the original network, and a minimum spanning tree is constructed on the new network. The randomness of the minimum spanning tree (MST) is ensured by the random weights, and MST ensures the connectivity of the sparse network. Second, the MST is expanded by adding a number of edges, which are randomly selected from the original network (but not already on the MST). Hence, the number of edges in the sparse network is equal to 10% or 50% of edges in the original network. The sparse network preserves the basic topological properties of the original network.
The final experimental results also confirm the above-mentioned phenomenon. For example, in Figure 6, the FS-reconstructed networks and the RWR-reconstructed networks work better than the original networks when the networks are very sparse (e.g. 10%). However, as the networks become denser, the FS-reconstructed networks and the RWR-reconstructed networks get worse than the original networks.
FIGURE 6
4 Conclusion
The systematic comparison of two network transformation approaches (network reconstruction and edge enrichment) is performed using three different protein similarity metrics (sequence similarity, local and global similarity). In summary, edge enrichment performs better than network reconstruction and original networks, while network reconstruction is more effective on relatively small and incomplete PPI networks. The edge enrichment of PPI networks based on sequence similarity outperforms those based on both local and global similarity. As the PPI networks become more and more complete, the effectiveness of both edge enrichment and network reconstruction will decrease or relatively decrease.
Research efforts will be further expanded in future, which include: 1) how the removal of noisy edges and addition of informative edges affect the prediction performance; 2) a combining approach that combines the best properties of all these indices is developed since the similarity indices considered here have different properties and performances.
Statements
Data availability statement
Publicly available datasets were analyzed in this study. This data can be found here: (1) Datasets A: BioGRID, https://downloads.thebiogrid.org/BioGRID. (2) Datasets A: STRING, https://string-db.org.
Author contributions
JZ, JG, WX and JG, JH designed and performed the experiments. JZ, JG, WX and YW analyzed the data. The manuscript was written by JZ, JG and WX and approved by all authors.
Funding
This work was supported by National Natural Science Foundation of China (NSFC) under Grants Nos. 41877009, 61772367, 62172300, U1936205 and by the Fundamental Research Funds for the Central Universities.
Conflict of interest
The authors declare that the research was conducted in the absence of any commercial or financial relationships that could be construed as a potential conflict of interest.
Publisher’s note
All claims expressed in this article are solely those of the authors and do not necessarily represent those of their affiliated organizations, or those of the publisher, the editors and the reviewers. Any product that may be evaluated in this article, or claim that may be made by its manufacturer, is not guaranteed or endorsed by the publisher.
Supplementary material
The Supplementary Material for this article can be found online at: https://www.frontiersin.org/articles/10.3389/fgene.2021.758131/full#supplementary-material
References
1
AbdollahiS.LinP.-C.ChiangJ.-H. (2021). Winbinvec: Cancer-Associated Protein-Protein Interaction Extraction and Identification of 20 Various Cancer Types and Metastasis Using Different Deep Learning Models. IEEE J. Biomed. Health Inform.25, 4052–4063. 10.1109/JBHI.2021.3093441
2
AdamcsekB.PallaG.FarkasI. J.DerényiI.VicsekT. (2006). CFinder: Locating Cliques and Overlapping Modules in Biological Networks. Bioinformatics22, 1021–1023. 10.1093/bioinformatics/btl039
3
AltschulS.MaddenT.SchäfferA. A.ZhangJ.ZhangZ.MillerW.et al (1997). Gapped BLAST and PSI-BLAST: a New Generation of Protein Database Search Programs. Nucleic Acids Res.25, 3389–3402. 10.1093/nar/25.17.3389
4
AshburnerM.BallC. A.BlakeJ. A.BotsteinD.ButlerH.CherryJ. M.et al (2000). Gene Ontology: Tool for the Unification of Biology. Nat. Genet.25, 25–29. 10.1038/75556
5
BarrellD.DimmerE.HuntleyR. P.BinnsD.O'DonovanC.ApweilerR. (2009). The GOA Database in 2009--an Integrated Gene Ontology Annotation Resource. Nucleic Acids Res.37, D396–D403. 10.1093/nar/gkn803
6
BerggårdT.LinseS.JamesP. (2007). Methods for the Detection and Analysis of Protein-Protein Interactions. Proteomics7, 2833–2842. 10.1002/pmic.200700131
7
BogdanovP.SinghA. K. (2010). Molecular Function Prediction Using Neighborhood Features. Ieee/acm Trans. Comput. Biol. Bioinf.7, 208–217. 10.1109/TCBB.2009.81
8
ChenY.WangW.LiuJ.FengJ.GongX. (2020). Protein Interface Complementarity and Gene Duplication Improve Link Prediction of Protein-Protein Interaction Network. Front. Genet.11, 291. 10.3389/fgene.2020.00291
9
ChuaH. N.SungW.-K.WongL. (2007). An Efficient Strategy for Extensive Integration of Diverse Biological Data for Protein Function Prediction. Bioinformatics23, 3364–3373. 10.1093/bioinformatics/btm520
10
ChuaH. N.SungW.-K.WongL. (2006). Exploiting Indirect Neighbours and Topological Weight to Predict Protein Function from Protein-Protein Interactions. Bioinformatics22, 1623–1630. 10.1093/bioinformatics/btl145
11
DunnR.DudbridgeF.SandersonC. M. (2005). The Use of Edge-Betweenness Clustering to Investigate Biological Function in Protein Interaction Networks. BMC Bioinformatics6, 39. 10.1186/1471-2105-6-39
12
HuL.HuangT.ShiX.LuW.-C.CaiY.-D.ChouK.-C. (2011). Predicting Functions of Proteins in Mouse Based on Weighted Protein-Protein Interaction Network and Protein Hybrid Properties. PLOS ONE6, e14556. 10.1371/journal.pone.0014556
13
KuchaievO.MilenkovićT.MemiševićV.HayesW.PržuljN. (2010). Topological Network Alignment Uncovers Biological Function and Phylogeny. J. R. Soc. Interf.7, 1341–1354. 10.1098/rsif.2010.0063
14
Liben-NowellD.KleinbergJ. (2007). The Link-Prediction Problem for Social Networks. J. Am. Soc. Inf. Sci.58, 1019–1031. 10.1002/asi.20591
15
LüL.ZhouT. (2011). Link Prediction in Complex Networks: A Survey. Physica A: Stat. Mech. its Appl.390, 1150–1170. 10.1016/j.physa.2010.11.027
16
NewmanM. E. J. (2001). Clustering and Preferential Attachment in Growing Networks. Phys. Rev. E64, 025102. 10.1103/PhysRevE.64.025102
17
OfranY.PuntaM.SchneiderR.RostB. (2005). Beyond Annotation Transfer by Homology: Novel Protein-Function Prediction Methods to Assist Drug Discovery. Drug Discov. Today10, 1475–1482. 10.1016/S1359-6446(05)03621-4
18
PatelS.TripathiR.KumariV.VaradwajP. (2017). Deepinteract: Deep Neural Network Based Protein-Protein Interaction Prediction Tool. Cbio12, 551–557. 10.2174/1574893611666160815150746
19
SchwikowskiB.UetzP.FieldsS. (2000). A Network of Protein-Protein Interactions in Yeast. Nat. Biotechnol.18, 1257–1261. 10.1038/82360
20
SenP.NamataG.BilgicM.GetoorL.GalligherB.Eliassi-RadT. (2008). Collective Classification in Network Data. AIMag29, 93–106. 10.1609/aimag.v29i3.2157
21
SharanR.UlitskyI.ShamirR. (2007). Network‐based Prediction of Protein Function. Mol. Syst. Biol.3, 88. 10.1038/msb4100129
22
SinghR.XuJ.BergerB. (2008). Global Alignment of Multiple Protein Interaction Networks with Application to Functional Orthology Detection. Proc. Natl. Acad. Sci.105, 12763–12768. 10.1073/pnas.0806627105
23
SleatorR. D.WalshP. (2010). An Overview of In Silico Protein Function Prediction. Arch. Microbiol.192, 151–155. 10.1007/s00203-010-0549-9
24
SolavaR. W.MichaelsR. P.MilenkovićT. (2012). Graphlet-based Edge Clustering Reveals Pathogen-Interacting Proteins. Bioinformatics28, i480–i486. 10.1093/bioinformatics/bts376
25
StarkC.BreitkreutzB.-J.Chatr-AryamontriA.BoucherL.OughtredR.LivstoneM. S.et al (2011). The Biogrid Interaction Database: 2011 Update. Nucleic Acids Res.39, D698–D704. 10.1093/nar/gkq1116
26
SzklarczykD.FranceschiniA.KuhnM.SimonovicM.RothA.MinguezP.et al (2011). The String Database in 2011: Functional Interaction Networks of Proteins, Globally Integrated and Scored. Nucleic Acids Res.39, D561–D568. 10.1093/nar/gkq973
27
TäubigH.BuchnerA.GriebschJ. (2006). Past: Fast Structure-Based Searching in the PDB. Nucleic Acids Res.34, W20–W23. 10.1093/nar/gkl273
28
TongH.FaloutsosC.PanJ.-Y. (2008). Random Walk with Restart: Fast Solutions and Applications. Knowl Inf. Syst.14, 327–346. 10.1007/s10115-007-0094-2
29
WaihoK.Afiqah‐AlengN.IryaniM. T. M.FazhanH. (2021). Protein-protein Interaction Network: an Emerging Tool for Understanding Fish Disease in Aquaculture. Rev. Aquacult.13, 156–177. 10.1111/raq.12468
30
WallaceA. C.LaskowskiR. A.ThorntonJ. M. (1996). Derivation of 3D Coordinate Templates for Searching Structural Databases: Application to Ser-His-Asp Catalytic Triads in the Serine Proteinases and Lipases. Protein Sci.5, 1001–1013. 10.1002/pro.5560050603
31
WuQ.YeY.NgM. K.HoS.-S.ShiR. (2014). Collective Prediction of Protein Functions from Protein-Protein Interaction Networks. BMC Bioinformatics15, S9. 10.1186/1471-2105-15-S2-S9
32
WuZ.LiaoQ.LiuB. (2020). A Comprehensive Review and Evaluation of Computational Methods for Identifying Protein Complexes from Protein-Protein Interaction Networks. Brief. Bioinform.21, 1531–1548. 10.1093/bib/bbz085
33
XiongW.LiuH.GuanJ.ZhouS. (2013). Protein Function Prediction by Collective Classification with Explicit and Implicit Edges in Protein-Protein Interaction Networks. BMC Bioinformatics14, S4. 10.1186/1471-2105-14-S12-S4
34
XiongW.XieL.ZhouS.GuanJ. (2014). Active Learning for Protein Function Prediction in Protein-Protein Interaction Networks. Neurocomputing145, 44–52. 10.1016/j.neucom.2014.05.075
35
YangH.WangM.LiuX.ZhaoX.-M.LiA. (2021). PhosIDN: an Integrated Deep Neural Network for Improving Protein Phosphorylation Site Prediction by Combining Sequence and Protein-Protein Interaction Information. Bioinformatics, btab551. 10.1093/bioinformatics/btab551
36
YeY.GodzikA. (2004). FATCAT: a Web Server for Flexible Structure Comparison and Structure Similarity Searching. Nucleic Acids Res.32, W582–W585. 10.1093/nar/gkh430
37
ZhuH.DuX.YaoY. (2020). Convsppis: Identifying Protein-Protein Interaction Sites by an Ensemble Convolutional Neural Network with Feature Graph. Cbio15, 368–378. 10.2174/1574893614666191105155713
Summary
Keywords
edge enrichment, network reconstruction, protein-protein interaction networks, protein function prediction, protein sequence annotation
Citation
Zhou J, Xiong W, Wang Y and Guan J (2021) Protein Function Prediction Based on PPI Networks: Network Reconstruction vs Edge Enrichment. Front. Genet. 12:758131. doi: 10.3389/fgene.2021.758131
Received
13 August 2021
Accepted
11 November 2021
Published
14 December 2021
Volume
12 - 2021
Edited by
Liang Cheng, Harbin Medical University, China
Reviewed by
Cheng Liang, Shandong Normal University, China
Yongjun Tang, Central South University, China
Updates
Copyright
© 2021 Zhou, Xiong, Wang and Guan.
This is an open-access article distributed under the terms of the Creative Commons Attribution License (CC BY). The use, distribution or reproduction in other forums is permitted, provided the original author(s) and the copyright owner(s) are credited and that the original publication in this journal is cited, in accordance with accepted academic practice. No use, distribution or reproduction is permitted which does not comply with these terms.
*Correspondence: Jihong Guan, jhguan@tongji.edu.cn
†These authors have contributed equally to this work
This article was submitted to Statistical Genetics and Methodology, a section of the journal Frontiers in Genetics
Disclaimer
All claims expressed in this article are solely those of the authors and do not necessarily represent those of their affiliated organizations, or those of the publisher, the editors and the reviewers. Any product that may be evaluated in this article or claim that may be made by its manufacturer is not guaranteed or endorsed by the publisher.