 Dan Song1,2,3,4
 Tangbin Huo
94% of researchers rate our articles as excellent or good
Learn more about the work of our research integrity team to safeguard the quality of each article we publish.
Find out more
DATA REPORT article
Front. Genet. , 23 November 2021
Sec. Livestock Genomics
Volume 12 - 2021 | https://doi.org/10.3389/fgene.2021.747552
Burbot (Lota lota) is the sole freshwater representative of the family Gadidae and represents the widest longitudinal distributed freshwater fish species worldwide. It is mainly distributed in rivers and lakes above 40° north latitude, including Eurasia and North America water systems (Cohen, et al., 1990). Burbot evolved from marine codfish to freshwater fishes about 10 million years ago and retained many characteristics of its marine ancestors, including cold-water preference, low-temperature spawning, high fecundity, and larval pelagic stage (Blabolil, et al., 2018). For instance, burbot spawns in winter or early spring with very low water temperatures (below 4°C), and the water temperature of above 5°C will be detrimental to the survival of burbot eggs (Żarski, et al., 2010). Therefore, burbot serves as a good model for adaptive evolution studies on both marine freshwater transition and cold-water preference.
Due to the stenothermal distribution, burbot is vulnerable to environmental changes and regarded as an excellent indicator for cold-water fish species (Stapanian et al., 2010a; Stapanian et al., 2010b). In recent decades, the burbot stocks and distribution have been severely decreasing due to overfishing, pollution, and habitat destruction (Li et al., 2020), which also resulted in lower genetic diversity, lower age, and miniaturization of burbot individuals. At present, many burbot populations have been threatened and endangered or even extirpated in some regions of North America and Eurasia (Stapanian et al., 2010a). Therefore, the appropriate management measures, such as the protection of habitat and spawning grounds, are essential for the population recovery of burbot. In the meantime, it is important to develop genomic resources to protect, restore, and effectively manage the natural resources of burbot.
Owing to its high levels of unsaturated fatty acids and various amino acids, burbot also has an important economic value, and it is famous for its delicious liver and testis of male fish. In recent years, various progresses of reproduction, larval domestication, and farming of burbots have been achieved (Yang, et al., 2021). A high-quality burbot genome is necessary for the genome-assisted breeding. Here, we constructed a high-quality chromosome-level genome assembly of L. lota, and the availability of reference genome will provide valuable resources for in-depth biological and evolutionary studies and genetic improvement of burbot.
In total, we generated about 52.99-Gb Nanopore long reads with an average read length of 20,705 bp, 66.13-Gb Illumina short reads, and 66.45-Gb Hi-C data for genome assembly (Supplementary Table S1). To estimate the main genome characteristics of L. lota, the k-mer-based method was applied, and 22, 444, 539,464 of 17-kmers were generated from the Illumina sequencing data. Finally, the L. lota genome size was estimated to be 565.64 Mb with 0.5% heterozygosity (Supplementary Table S2).
We used Nanopore long reads to construct the primary assembly, the size of which was 583.75 Mb with contig N50 of 15.29 Mb (Supplementary Table S3) after correction. To improve the accuracy of the assembly, a chromosome-level genome was constructed by clean Hi-C data. Based on the genome-wide Hi-C heatmap, the interacting signals around the diagonal was strong, and the 24 pseudochromosomes could be distinguished clearly, consistent with the karyotype results based on cytological observation (Kirtiklis, et al., 2016; Zhou, et al., 2019) (Supplementary Figure S1). The final genome assembly was 583.78 Mb, with a contig N50 of 9.08 Mb, and a scaffold N50 of 21.89 Mb (Table 1). In comparison with a recently released burbot genome assembly by Han et al. (2021), it was suggested that the genome assembled in this study has better quality for higher contig N50 and more accurate chromosome number (Supplementary Table 4). The contig N50 of the genome assembled by Han et al. (2021) was 2.01 Mb, and the assembled sequences were anchored to 22 pseudochromosomes, which might be attributed to a low resolution of Hi-C assembly or chromosome loss or fusion caused by local adaptation. A total length of 537.89 Mb of the genomic sequence was anchored, accounting for 92.1% of the entire assembly (Supplementary Table 5). Furthermore, the quality of the genome was evaluated by mapping short reads to genome and benchmarking universal single-copy ortholog (BUSCO v3) analysis (Simão, et al., 2015); 99.56% of short reads were mapped, which covered 99.88% of the assembled genome. The genome contained 3,452 (94.8%) complete BUSCOs, including 3,419 single-copy BUSCOs and 33 duplicated BUSCOs (Supplementary Table 6), indicating that the genome assembly had high completeness.
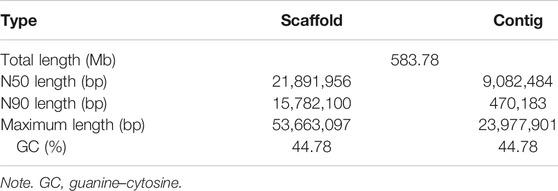
TABLE 1. Genome assembly statistics for the Lota lota.
We identified a total of 332.58-Mb repeat sequences in the burbot genome, which accounted for 56.97% of the whole genome. The top three categories of repetitive elements were long terminal repeats (LTRs; 38.04%), simple sequence repeat (SSR; 8.36%), and DNA elements (8.00%) (Supplementary Table 7). A total of 21,672 protein-coding genes were annotated in the genome by three strategies as described in the materials and methods (Supplementary Table 8). Approximately 97.63% of the predicted genes were successfully annotated using five protein databases: National Center for Biotechnology Information (NCBI) Refseq (NR) (97.19%), EuKaryotic Orthologous Groups (KOG; 70.77%), Kyoto Encyclopedia of Genes and Genomes (KEGG; 67.96%), Gene Ontology (GO; 58.97%), and Swiss-Prot (94.44%) (Supplementary Table 9). Furthermore, noncoding RNAs were predicted across the burbot genome; and a total of 853 microRNAs (miRNAs), 7,588 transfer RNAs (tRNAs), 155 ribosomal RNAs (rRNAs), and 1,371 small nuclear RNAs (snRNAs) were detected (Supplementary Table 10).
To investigate the phylogenetic relationships between L. lota and other teleosts, OrthoFinder v2.3.4 (Emms and Kelly 2015) was applied for ortholog group identification. A total of 7,524 gene families and 6,211 single-copy orthologs shared by L. lota and other fishes were identified. A total of 474 gene families were specific to L. lota (Figure 1B). We constructed a phylogenetic tree using 6,211 single-copy orthologs by Iq-TREE v2 (Minh, et al., 2020), which showed that Atlantic cod (Gadus morhua) was most closely related to L. lota with a divergence time around 49.21 million years ago (Figure 1A). Through synteny analysis between G. morhua and L. lota, we found that the chromosomes between L. lota and G. morhua were highly conserved (Figure 1C). We also detected that chromosome 1 of L. lota was compared with chromosomes NC044058 and NC044061 of G. morhua, and chromosomes 21 and 24 of L. lota were mapped to chromosome NC044051 of G. morhua (Figure 1C), which indicated chromosome fission and fusion events of the ancestral chromosomes.
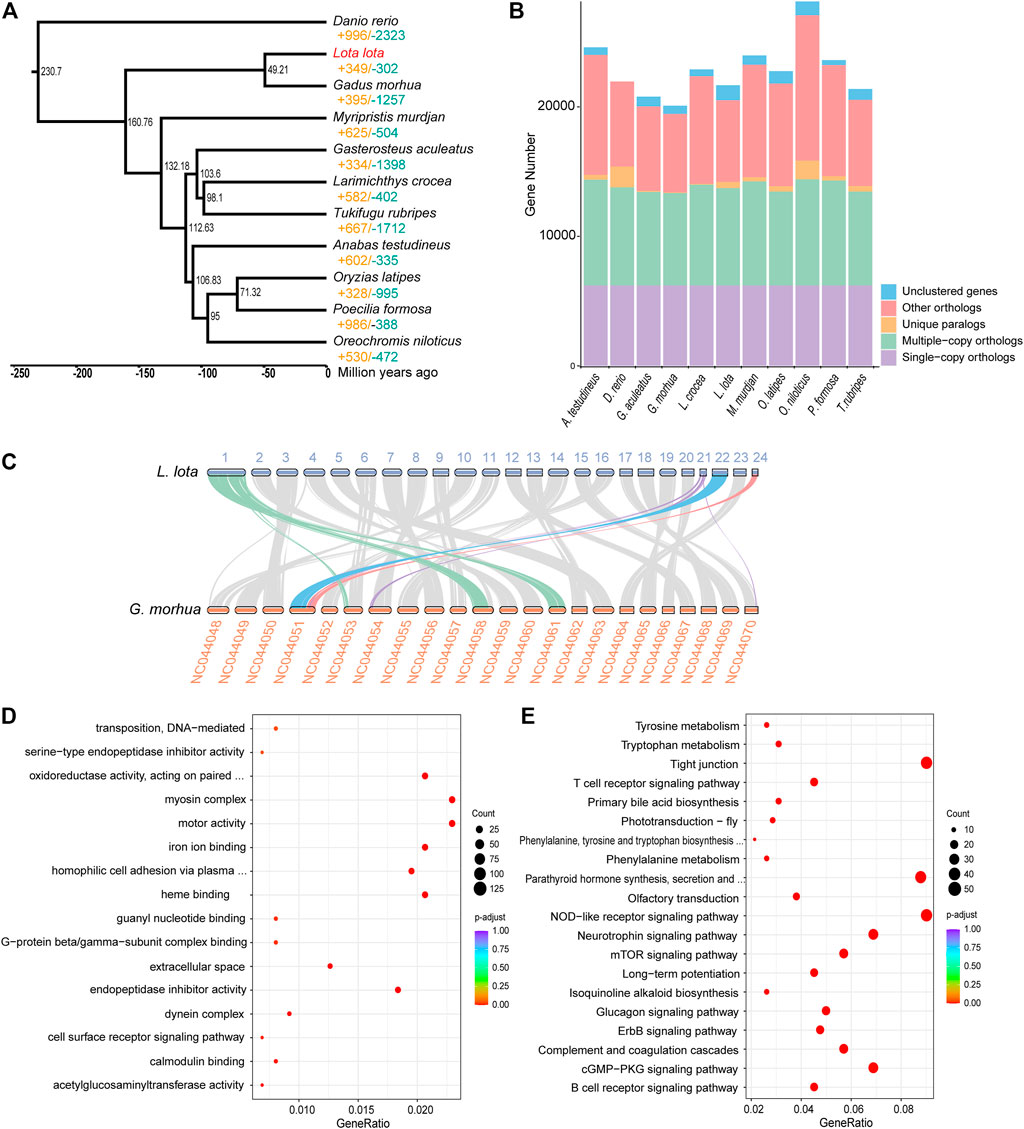
FIGURE 1. Phylogeny, orthologs, collinearity, and gene family evolution. (A) Phylogeny, dating, and gene family evolution. The value of significantly expanded (orange) and contracted (blue) gene families is designated on each branch. The estimated species divergence time (million years ago) is labelled at each branch site. (B) Statistics of orthologs and paralogs. “Others orthologs” indicates unclassified orthologs; “Unclustered genes,” orthologs that cannot be assigned into any orthogroups. (C) Collinearity analysis of Lota lota and Gadus morhua genomes. (D) Function enrichment of Gene Ontology (GO) for significantly expanded gene families. (E) Kyoto Encyclopedia of Genes and Genomes (KEGG) enrichment analysis for significantly expanded gene families. Only the top 20 categories are shown.
The expansion and contraction of gene family are two of the most important factors for formation of special adaptive mechanisms during evolutionary process. We estimated the gene family evolution using CAFÉ v4.2.1 (Han et al., 2013); there were 349 and 302 gene families that experienced significant expansions and contractions for L. lota, respectively. The expanded genes were significantly enriched in 16 GO terms, mainly involved in endopeptidase inhibitor activity (GO:0004866, GO:0006313), homophilic cell adhesion via plasma membrane adhesion molecules (GO:0030286), and iron ion binding (GO:0005506) (Figure 1D, Supplementary Table 11). Meanwhile, functional enrichment analyses using KEGG database mapped expanded genes to 53 pathways, including immune-associated pathways, such as NOD-like receptor signaling pathway, complement and coagulation cascades, and T-cell receptor signaling pathway. In addition, the pathway involved the biological process regulation, mTOR signaling pathway, which was significantly enriched (Figure 1E, Supplementary Table 12).
For genome sequencing and assembly, the muscle tissue of a male burbot was dissected, and genomic DNA was extracted using Qiagen GenomicTip100 (Qiagen, Hilden, Germany). To generate long reads used for genome assembly, we constructed a Nanopore 20-kb insert library with 1 µg of genomic DNA. The constructed library was sequenced by the Oxford Nanopore Technologies using PromethION sequencer. Then Illumina short reads were generated for base-level correction after assembly. A paired-end (PE) library with 500-bp insert size was constructed, and it was sequenced on Illumina HiSeq 4000 platform; finally, 150-bp PE reads were generated. To obtain a chromosome-scale genome, liver tissue from the same individual was used for Hi-C library preparation and sequencing. Firstly, the liver tissue was fixed in 1% formaldehyde solution to perform cross-linking. Nuclei were further obtained and digested with DpnII, marked with biotin-14-dCTP, and then ligated by T4 DNA ligase. The DNA was extracted and sheared, the biotin-labelled DNA fragments were enriched, and finally, PE libraries with 500-bp insert size were constructed. The Hi-C libraries were sequenced on Illumina HiSeq 4000 platform with 150-bp PE mode.
With the same method used in short-read sequencing, for gene prediction, RNA-seq was performed with several tissues, including three liver, heart, brain, ovary, and testis tissues. We constructed cDNA libraries for each tissue sample and sequencing on Illumina platform.
Before genome assembly, the k-mer analysis was conducted to estimate the genome size and heterozygosity of L. lota using Jellyfish v2.2.10 (Marçais and Kingsford 2011) and Genomescope v1.0 (Vurture, et al., 2017) based on Illumina short reads filtered by fastp v0.22.0 (Chen, et al., 2018). We corrected the Nanopore long reads by NextCorrect modules of NextDenovo v2.3.0 (https://github.com/Nextomics/NextDenovo) to assemble the primary genome using software wtdbg2 (Ruan and Li 2020). Three rounds of genome sequence polishing were performed to correct random sequencing errors using Pilon v1.23 (Walker, et al., 2014) with the cleaned short reads. For chromosome-level genome assembly, two ends of paired reads were independently aligned to the polished genome using Bowtie v1.2.2 (Langmead 2010), and only the read pairs that were uniquely mapped to the genome were selected. Last, the valid Hi-C read pairs were applied for clustering, ordering, and orienting to aid in anchoring the contig to the chromosomes using Lachesis (Burton, et al., 2013). Finally, to evaluate the quality of L. lota genome, the Illumina reads were mapped back to the genome using BWA-MEM v0.7.17 (Li and Durbin 2009) and the BUSCO analysis (Simão, et al., 2015) based on the actinopterygii_odb9 database performed.
To annotate repeat sequences in the genome of burbot, we combined homology repeat prediction with de novo repeat prediction. TRF v4.09 (Benson 1999), RepeatMasker v4.06 (Tarailo‐Graovac and Chen, 2009), and RepeatProteinMask v4.06 were used for homology prediction by aligning the genome sequences against the RepBase library. For the second method, we employed RepeatModeller v1.08 and LTR-FINDER v1.06 (Xu and Wang 2007) based on the de novo repetitive element database.
Protein-coding genes of the genome were predicted based on ab initio, homology-based and transcriptome-based strategies. The de novo approach was conducted using Augustus v3.2.1 (Stanke, et al., 2008), Snap v2013-11-29 (Leskovec and Sosič 2016), GeneMark-EP+ (Bruna, et al., 2020), Geneid v1.4 (Alioto, et al., 2018), and GlimmerHMM v3.0.4 (Majoros, et al., 2004) based on the repeat-masked genome. For homology-based annotation, the protein sequences of (Anabas testudineus, Danio rerio, Oryzias latipes, G. morhua, Poecilia formosa, and Myripristis murdjan) were downloaded from Ensemble and aligned to the genome of burbot using TBlastN v2.8.1 (E-value ≤ 1e−05) (Altschul, et al., 1990). Genewise 2.4.1 (Birney, et al., 2004) was then used to identify accurate gene structures of alignment. For transcriptome-based prediction, the Illumina transcriptome sequence reads were aligned via Hisat2 v2.1.0 (Kim, et al., 2015); subsequently, StringTie v1.3.3b (Pertea, et al., 2015) was used to predict gene models. All gene models generated by the above methods were integrated with EVidenceModeler (EVM) v1.1.1 (Haas, et al., 2008). Functional annotation of the predicted genes was performed by searching public databases, including NR (Marchler-Bauer, et al., 2011), Swiss-Prot, KEGG (Kanehisa and Goto 2000), GO (Dimmer, et al., 2012), and KOG (Tatusov, et al., 2001) databases.
Noncoding RNAs, including miRNAs, snRNAs, tRNAs, and rRNAs were identified and annotated across the L. lota genome. The tRNAs were identified by program tRNAscan-SE v2.0.6 (Chan and Lowe 2019), and the highly conserved rRNAs were annotated using BlastN v2.8.1. Other ncRNAs were identified by searching against the Rfam database using Infernal v1.1.2 (Nawrocki and Eddy 2013).
The protein sequences of 10 teleosts (D. rerio, Gasterosteus aculeatus, Oreochromis niloticus, O. latipes, Takifugu rubripes, Xiphophorus maculatus, G. morhua, P. formosa, Larimichthys crocea, and M. murdjan) were downloaded from Ensembl database (http://www.ensembl.org/index.html?redirect=no) (Supplementary Table S1), and the longest one was retained to represent each gene. Then the filtered sequences of the 10 species and L. lota were analyzed to construct different types of orthologs using OrthoFinder v2.3.4 (Emms and Kelly 2015). In order to study the evolutionary relationship, the single-copy protein sequences were used to construct the phylogenetic tree by Iq-TREE v2 (Minh, et al., 2020). We also estimated the divergence time through Bayesian relaxed molecular clock approach using MCMCTree in PAML v4.9j package (Yang 2007). Here, four soft-bound calibration times taken from www.timetree.org were applied: D. rerio–G. aculeatus (205–255 Mya), G. morhua–G. aculeatus (141–170 Mya), M. murdjan–O. niloticus (117–154 Mya), and O. niloticus–O. latipes (87–151 Mya). To visualize the consistency between the genomes of L. lota and its closely related species, G. morhua, the 24 L. lota chromosomes were aligned with G. morhua chromosomes by MCScanX (Wang et al., 2012).
We used the results from OrthoFinder and software CAFÉ v4.2.1 (Han, et al., 2013) to estimate expansion and contraction gene families among the 11 teleosts. The gene family with p-value <0.05 was thought to experience significant expansion or contraction. Then the significantly expanded families were functionally enriched by GO and KEGG enrichment analyses.
The datasets presented in this study can be found in online repositories. The names of the repository/repositories and accession number(s) can be found in the article/Supplementary Material.
The collection and sampling of the fish specimens were following approved guidelines of the Animal Care and Use Committee of Institute of hydrobiology, Chinese Academy of Science as Heilongjiang River Fisheries Research Institute, Chinese Academy of Fishery Sciences.
WL, DS, and TH conceived the study and collected the samples for sequencing. DS and MM performed the genomics analysis. DS and YQ wrote and revised the manuscript. All authors approved the final submission.
This study was funded by the Natural Science Foundation of Heilongjiang Province (Nos. LH 2019C089, LH2019C070).
MM was employed by Diggs (Wuhan) Biotechnology Co., Ltd.
The remaining authors declare that the research was conducted in the absence of any commercial or financial relationships that could be construed as a potential conflict of interest.
All claims expressed in this article are solely those of the authors and do not necessarily represent those of their affiliated organizations, or those of the publisher, the editors, and the reviewers. Any product that may be evaluated in this article, or claim that may be made by its manufacturer, is not guaranteed or endorsed by the publisher.
The Supplementary Material for this article can be found online at: https://www.frontiersin.org/articles/10.3389/fgene.2021.747552/full#supplementary-material
Alioto, T., Blanco, E., Parra, G., and Guigó, R. (2018). Using Geneid to Identify Genes. Curr. Protoc. Bioinformatics 64, e56. doi:10.1002/cpbi.56
Altschul, S. F., Gish, W., Miller, W., Myers, E. W., and Lipman, D. J. (1990). Basic Local Alignment Search Tool. J. Mol. Biol. 215, 403–410. doi:10.1016/S0022-2836(05)80360-2
Benson, G. (1999). Tandem Repeats Finder: a Program to Analyze DNA Sequences. Nucleic Acids Res. 27, 573–580. doi:10.1093/nar/27.2.573
Birney, E., Clamp, M., and Durbin, R. (2004). GeneWise and Genomewise. Genome Res. 14, 988–995. doi:10.1101/gr.1865504
Blabolil, P., Duras, J., Jůza, T., Kočvara, L., Matěna, J., Muška, M., et al. (2018). Assessment of Burbot Lota Lota (L. 1758) Population Sustainability in central European Reservoirs. J. Fish. Biol. 92, 1545–1559. doi:10.1111/jfb.13610
Brůna, T., Lomsadze, A., and Borodovsky, M. (2020). GeneMark-EP+: Eukaryotic Gene Prediction with Self-Training in the Space of Genes and Proteins. bioRxiv 2, 2019–2112. doi:10.1093/nargab/lqaa026
Burton, J. N., Adey, A., Patwardhan, R. P., Qiu, R., Kitzman, J. O., and Shendure, J. (2013). Chromosome-scale Scaffolding of De Novo Genome Assemblies Based on Chromatin Interactions. Nat. Biotechnol. 31, 1119–1125. doi:10.1038/nbt.2727
Chan, P. P., and Lowe, T. M. (2019). “tRNAscan-SE: Searching for tRNA Genes in Genomic Sequences,” in Gene Prediction. Editor M. Kollmar (Springer), 1–14. 1962. doi:10.1007/978-1-4939-9173-0_1
Chen, S., Zhou, Y., Chen, Y., and Gu, J. (2018). Fastp: an Ultra-fast All-In-One FASTQ Preprocessor. Bioinformatics 34, i884–i890. doi:10.1093/bioinformatics/bty560
Cohen, D. M., Inada, T., Iwamoto, T., Scialabba, N., and Whitehead, P. J. P. (1990). FAO Species Catalogue: Vol. 10 Gadiform Fishes of the World (Order Gadiformes), an Annotated and Ilustrated Catalogue of Cods. Hakes, Grenadiers and Other Gadiform Fishes Known to Date. Rome: FAO.
Dimmer, E. C., Huntley, R. P., Alam-Faruque, Y., Sawford, T., O'Donovan, C., Martin, M. J., et al. (2012). The UniProt-GO Annotation Database in 2011. Nucleic Acids Res. 40, D565–D570. doi:10.1093/nar/gkr1048
Emms, D. M., and Kelly, S. (2015). OrthoFinder: Solving Fundamental Biases in Whole Genome Comparisons Dramatically Improves Orthogroup Inference Accuracy. Genome Biol. 16, 1–14. doi:10.1186/s13059-015-0721-2
Haas, B. J., Salzberg, S. L., Zhu, W., Pertea, M., Allen, J. E., Orvis, J., et al. (2008). Automated Eukaryotic Gene Structure Annotation Using EVidenceModeler and the Program to Assemble Spliced Alignments. Genome Biol. 9, R7–R22. doi:10.1186/gb-2008-9-1-r7
Han, M. V., Thomas, G. W. C., Lugo-Martinez, J., and Hahn, M. W. (2013). Estimating Gene Gain and Loss Rates in the Presence of Error in Genome Assembly and Annotation Using CAFE 3. Mol. Biol. Evol. 30, 1987–1997. doi:10.1093/molbev/mst100
Han, Z., Liu, M., Liu, Q., Zhai, H., Xiao, S., and Gao, T. (2021). Chromosome‐level Genome Assembly of Burbot (Lota lota) Provides Insights into the Evolutionary Adaptations in Freshwater. Mol. Ecol. Resour. 21, 2022–2033. doi:10.1111/1755-0998.13382
Kanehisa, M., and Goto, S. (2000). KEGG: Kyoto Encyclopedia of Genes and Genomes. Nucleic Acids Res. 28, 27–30. doi:10.1093/nar/28.1.27
Kim, D., Langmead, B., and Salzberg, S. L. (2015). HISAT: a Fast Spliced Aligner with Low Memory Requirements. Nat. Methods 12, 357–360. doi:10.1038/nmeth.3317
Kirtiklis, L., Kuciński, M., Ocalewicz, K., Liszewski, T., Woźnicki, P., Nowosad, J., et al. (2016). Heterochromatin Organization and Chromosome Mapping of rRNA Genes and Telomeric DNA Sequences in the burbot Lota lota (Linnaeus, 1758) (Teleostei: Gadiformes: Lotidae). Caryologia 70, 15–20. doi:10.1080/00087114.2016.1254453
Langmead, B. (2010). Aligning Short Sequencing Reads with Bowtie. Curr. Protoc. Bioinformatics Chapter 11, Unit–7. doi:10.1002/0471250953.bi1107s32
Leskovec, J., and Sosič, R. (2016). Snap. ACM Trans. Intell. Syst. Technol. 8, 1–20. doi:10.1145/2898361
Li, H., and Durbin, R. (2009). Fast and Accurate Short Read Alignment with Burrows-Wheeler Transform. Bioinformatics 25, 1754–1760. doi:10.1093/bioinformatics/btp324
Li, H., Xia, Y., Zhu, M., and Han, Q., (2020). Research Percpectives on Biology and Culture of Burbot Lota lota: A Review. J. Dalian Fish. Univ. 35, 762–767.
Majoros, W. H., Pertea, M., and Salzberg, S. L. (2004). TigrScan and GlimmerHMM: Two Open Source Ab Initio Eukaryotic Gene-Finders. Bioinformatics 20, 2878–2879. doi:10.1093/bioinformatics/bth315
Marchler-Bauer, A., Lu, S., Anderson, J. B., Chitsaz, F., Derbyshire, M. K., DeWeese-Scott, C., et al. (2011). CDD: a Conserved Domain Database for the Functional Annotation of Proteins. Nucleic Acids Res. 39, D225–D229. doi:10.1093/nar/gkq1189
Marçais, G., and Kingsford, C. (2011). A Fast, Lock-free Approach for Efficient Parallel Counting of Occurrences of K-Mers. Bioinformatics 27, 764–770. doi:10.1093/bioinformatics/btr011
Minh, B. Q., Schmidt, H. A., Chernomor, O., Schrempf, D., Woodhams, M. D., von Haeseler, A., et al. (2020). IQ-TREE 2: New Models and Efficient Methods for Phylogenetic Inference in the Genomic Era. Mol. Biol. Evol. 37, 1530–1534. doi:10.1093/molbev/msaa13110.1093/molbev/msaa015
Nawrocki, E. P., and Eddy, S. R. (2013). Infernal 1.1: 100-fold Faster RNA Homology Searches. Bioinformatics 29, 2933–2935. doi:10.1093/bioinformatics/btt509
Pertea, M., Pertea, G. M., Antonescu, C. M., Chang, T.-C., Mendell, J. T., and Salzberg, S. L. (2015). StringTie Enables Improved Reconstruction of a Transcriptome from RNA-Seq Reads. Nat. Biotechnol. 33, 290–295. doi:10.1038/nbt.3122
Ruan, J., and Li, H. (2020). Fast and Accurate Long-Read Assembly with Wtdbg2. Nat. Methods 17, 155–158. doi:10.1038/s41592-019-0669-3
Simão, F. A., Waterhouse, R. M., Ioannidis, P., Kriventseva, E. V., and Zdobnov, E. M. (2015). BUSCO: Assessing Genome Assembly and Annotation Completeness with Single-Copy Orthologs. Bioinformatics 31, 3210–3212. doi:10.1093/bioinformatics/btv351
Stanke, M., Diekhans, M., Baertsch, R., and Haussler, D. (2008). Using Native and Syntenically Mapped cDNA Alignments to Improve De Novo Gene Finding. Bioinformatics 24, 637–644. doi:10.1093/bioinformatics/btn013
Stapanian, M. A., Paragamian, V. L., Madenjian, C. P., Jackson, J. R., Lappalainen, J., Evenson, M. J., et al. (2010a). Worldwide Status of Burbot and Conservation Measures. Fish Fish 11, 34–56. doi:10.1111/j.1467-2979.2009.00340.x
Stapanian, M. A., Witzel, L. D., and Cook, A. (2010b). Recruitment of Burbot (Lota lota L.) in Lake Erie: an Empirical Modelling Approach. Ecol. Freshw. Fish. 19, 326–337. doi:10.1111/j.1600-0633.2010.00414.x
Tarailo‐Graovac, M., and Chen, N. (2009). Using RepeatMasker to Identify Repetitive Elements in Genomic Sequences. Curr. Protoc. Bioinformatics 25, 4. doi:10.1002/0471250953.bi0410s25
Tatusov, R. L., Natale, D. A., Garkavtsev, I. V., Tatusova, T. A., Shankavaram, U. T., Rao, B. S., et al. (2001). The COG Database: New Developments in Phylogenetic Classification of Proteins from Complete Genomes. Nucleic Acids Res. 29, 22–28. doi:10.1093/nar/29.1.22
Vurture, G. W., Sedlazeck, F. J., Nattestad, M., Underwood, C. J., Fang, H., Gurtowski, J., et al. (2017). GenomeScope: Fast Reference-free Genome Profiling from Short Reads. Bioinformatics 33, 2202–2204. doi:10.1093/bioinformatics/btx153
Walker, B. J., Abeel, T., Shea, T., Priest, M., Abouelliel, A., Sakthikumar, S., et al. (2014). Pilon: an Integrated Tool for Comprehensive Microbial Variant Detection and Genome Assembly Improvement. PLoS One 9, e112963. doi:10.1371/journal.pone.0112963
Wang, Y., Tang, H., DeBarry, J. D., Tan, X., Li, J., Wang, X., et al. (2012). MCScanX: a Toolkit for Detection and Evolutionary Analysis of Gene Synteny and Collinearity. Nucleic Acids Res. 40, e49. doi:10.1093/nar/gkr1293
Xu, Z., and Wang, H. (2007). LTR_FINDER: an Efficient Tool for the Prediction of Full-Length LTR Retrotransposons. Nucleic Acids Res. 35, W265–W268. doi:10.1093/nar/gkm286
Yang, T., Zhang, Y., Meng, W., Zhong, X., Shan, Y., and Gao, T. (2021). Comparative Transcriptomic Analysis Brings New Insights into the Response to Acute Temperature Acclimation in Burbot (Lota lota). Aquacult. Rep. 20, 100657. doi:10.1016/j.aqrep.2021.100657
Yang, Z. (2007). PAML 4: Phylogenetic Analysis by Maximum Likelihood. Mol. Biol. Evol. 24, 1586–1591. doi:10.1093/molbev/msm088
Żarski, D., Kucharczyk, D., Sasinowski, W., Targońska, K., and Mamcarz, A. (2010). The Influence of Temperature on Successful Reproductions of Burbot, Lota lota (L.) under Hatchery Conditions. Polish J. Nat. Sci. 25, 93–105. doi:10.2478/v10020-010-0007-9
Keywords: Lota lota, chromosomal assembly, Nanopore, Hi-C, gene annotation, comparative genomics
Citation: Song D, Qian Y, Meng M, Dong X, Lv W and Huo T (2021) Chromosome-Level Genome Assembly of the Burbot (Lota lota) Using Nanopore and Hi-C Technologies. Front. Genet. 12:747552. doi: 10.3389/fgene.2021.747552
Received: 26 July 2021; Accepted: 07 October 2021;
Published: 23 November 2021.
Edited by:
Xiangdong Ding, China Agricultural University, ChinaCopyright © 2021 Song, Qian, Meng, Dong, Lv and Huo. This is an open-access article distributed under the terms of the Creative Commons Attribution License (CC BY). The use, distribution or reproduction in other forums is permitted, provided the original author(s) and the copyright owner(s) are credited and that the original publication in this journal is cited, in accordance with accepted academic practice. No use, distribution or reproduction is permitted which does not comply with these terms.
*Correspondence: Wenqi Lv, c25sdndlbnFpQDE2My5jb20=; Tangbin Huo, dGJodW9AMTYzLmNvbQ==
Disclaimer: All claims expressed in this article are solely those of the authors and do not necessarily represent those of their affiliated organizations, or those of the publisher, the editors and the reviewers. Any product that may be evaluated in this article or claim that may be made by its manufacturer is not guaranteed or endorsed by the publisher.
Research integrity at Frontiers
Learn more about the work of our research integrity team to safeguard the quality of each article we publish.