 Chiranjib Sarkar
 Rajender Parsad2
 Dwijesh C. Mishra
 Anil Rai
- 1ICAR-Indian Agricultural Research Institute, New Delhi, India
- 2ICAR-Indian Agricultural Statistics Research Institute, New Delhi, India
Gene regulatory network (GRN) construction involves various steps of complex computational steps. This step-by-step procedure requires prior knowledge of programming languages such as R. Development of a web tool may reduce this complexity in the analysis steps which can be easy accessible for the user. In this study, a web tool for constructing consensus GRN by combining the outcomes obtained from four methods, namely, correlation, principal component regression, partial least square, and ridge regression, has been developed. We have designed the web tool with an interactive and user-friendly web page using the php programming language. We have used R script for the analysis steps which run in the background of the user interface. Users can upload gene expression data for constructing consensus GRN. The output obtained from analysis will be available in downloadable form in the result window of the web tool.
1 Introduction
Gene regulatory network (GRN) construction is important for understanding complex biological processes. GRNs are represented as the nodes connected with edges where the nodes indicate the genes and each edge indicates the strength of the relationship between the genes. GRNs are constructed from high-dimensional gene expression data containing thousands of genes with expression values at different conditions or experiments. It is a computationally challenging task for analyzing high-dimensional gene expression data in a stepwise workflow. Constructing a GRN from gene expression data involves various steps of data analysis. The steps involved in GRN construction required use of computational techniques. Prior knowledge of the programming language is required for analyzing gene expression data as well as network construction. There are different statistical methods proposed for inferring GRN from high-dimensional expression data, and these methods are implemented using different R packages available in the CRAN depository. Some of the proposed statistical methods are implemented with online web tools. R packages like “BNArray” (Chen et al., 2006), “minet” (Meyer et al., 2008), “dna” (Gill et al., 2014), and “ENA” (Allen, 2014) are implemented based on the Bayesian network, mutual information, differential network analysis methods, and ensemble network aggregation, respectively. Instead of executing a script for each step of GRN construction, web tool development may provide easy accessibility to the user. There are some web tools developed for GRN construction like MIDER (Villaverde et al., 2014), NetworkAnalyst (Zhou et al., 2019), CoExpNetViz (Tzfadia et al., 2016), and GeNeCK (Zhang et al., 2019). For easy accessibility and to provide a more user-friendly procedure, we have introduced a web tool for constructing consensus GRN. It allows users to provide their own gene expression data to get the significant edges and nodes of the GRN. In our web tool, we have used Fisher’s weighted method for combining the output of GRN obtained from correlation, principal component regression (PCR), partial least square (PLS), and ridge regression (Sarkar et al., 2020). The data analysis part of computing the edge score from correlation, PCR, PLS, and ridge regression has been written in R programming language. The web pages were designed using the HTML and php languages with a user-friendly interface. Users can provide the input file in Microsoft Excel format, and the output of significant edges in each step will also be provided in Excel format.
2 Program Description and Methods
Our developed web tool mainly follows three steps—data uploading, data analysis, and combining the outputs of four methods. The input data of gene expressions can be provided in comma separated value (.csv) file format or in Microsoft excel format containing the list of genes in rows and the conditions or various experiments in columns. The user-uploaded input data are renamed with the date and time of data uploading to avoid repetition in the uploaded file name. The edge scores are computed using four methods, i.e., correlation, PCR, PLS, and ridge regression methods. Probability values are computed for edges from the mixture distribution of edge scores obtained from each method. The probability values are combined using Fisher’s weighted method (Figure 1). Different steps of analysis are done using R programming. Few R packages like “dna” and “fdrtool” are used in writing the R script for the analysis. The outputs of the analysis are available in downloadable format in the result tab. Each output file contains the names of the interacting genes and the connectivity score.
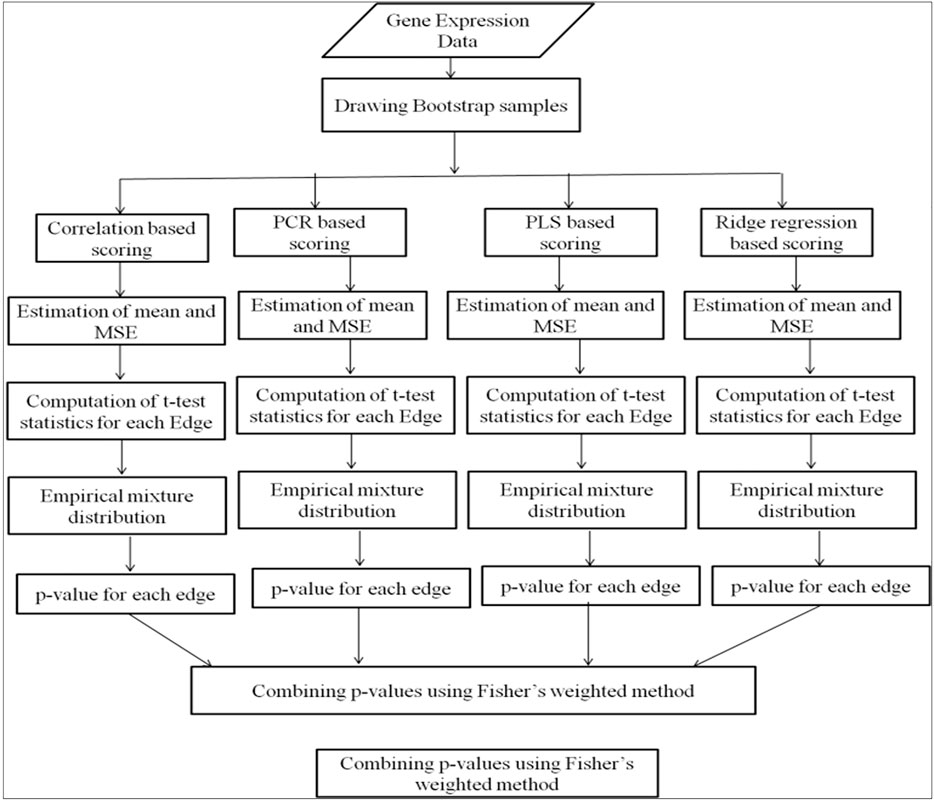
FIGURE 1. Workflow of web tool for consensus GRN construction.
2.1 Design of the Web Tool
The web tool has been designed using standard three-layer web architecture (Figure 2). The three layers of web architecture are:
• Layer I—user interface layer (UIL)
• Layer II—application layer (APL)
• Layer III—database layer (DBL)
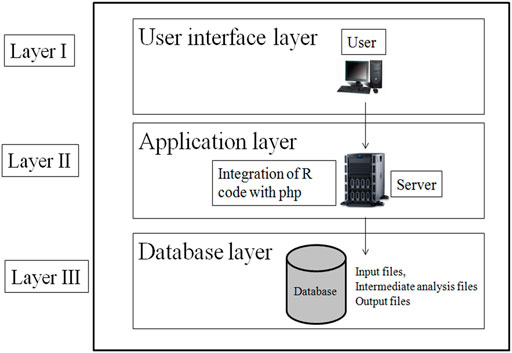
FIGURE 2. Three layer architecture of web tool for consensus GRN construction.
2.1.1 User interface layer
The UIL for the web tool was developed using HTML (Hyper Text Markup Language), CSS, and JavaScript. The UIL consists of forms to interact with users. In UIL, users can upload the gene expression dataset in excel format and download the result file.
2.1.2 Application Layer
The APL of the web tool has been designed using php and R code. The R script for constructing GRN has been integrated with php for analysis of gene expression data. The R script is executed in the background of the web tool which is not visible to the user.
2.1.3 Database Layer
The DBL has been designed as server side file storage. This layer stores the user-provided input file, the intermediate files generated in R script execution, and the final result file. Intermediate files are like files containing a pairwise scoring matrix from four individual methods: file containing p-value, fdr value, and Fw score.
The php scripts and R scripts are given in the Supplementary File.
2.2 Data Analysis
The expression values of genes in the input data file are considered for computing the connectivity score of each pair of genes using correlation, PCR, PLS, and ridge regression. Bootstrap samples are drawn from the input dataset. The “Sample” function has been used to draw bootstrap samples in R script. For each bootstrap sample, the connectivity score is computed using the four methods. The probability values of pair of genes are computed to measure the statistical significance of the connectivity of gene pair. The probabilities of gene pairs are obtained from the mixture distribution of the connectivity scores of all possible pairs of genes (Efron, 2004).
The correlation-based connectivity score (Gill et al., 2010) is:
where xj and xk are the standardized expression values of the ith and kth genes, respectively, and
The PCR-based connectivity score (Pihur et al., 2008) is:
where
The PLS-Based Connectivity Scoring Is
where
The ridge regression-based connectivity score (Gill et al., 2010) is:
where sgp is the connectivity score between the gth and pth genes.
The computation of the connectivity scores was implemented using the “dna” R package.
The mean and standard error (SE) are calculated as (Sarkar et al., 2020):
where B is the number of Bootstrap samples.
The computed t-test statistic is as follows:
For the correlation-based scoring method, the t-test statistic is computed as follows:
The t-statistic values are used for mixture distribution estimation using the “fdrtool” R package (Klaus and Strimmer, 2015).
The p-values are combined using Fisher’s weighted method (Hedges and Olkin, 2014) following the steps as given in Sarkar et al. (2020):
2.3 Implementation
The interface of our web tool has four tabs “Home,” “Analysis,” “Help,” and “Contact Us” (Figure 3). The “Analysis” tab has an option to upload gene expression data (Figure 4). The input file format of gene expression values should be in comma-separated values (csv) or Excel with genes in rows and conditions in columns. The output files are available in Excel format in the download tab of each method (Figure 5). The output file consists of edges, connectivity scores of edges, fdr values, and p-values of each edge. The p-values of edges computed from the four methods are combined using Fisher’s weighted method, and the combined result is available in downloadable format (Figure 6). The final output file contains the lists of the significant edges with F-score. The final result file contains the edges for consensus GRN.

FIGURE 3. Interface of homepage of web tool.
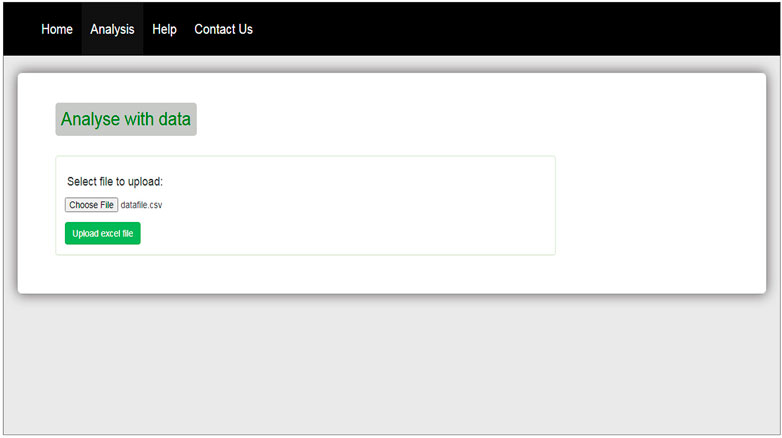
FIGURE 4. The upload option in analysis tab of web tool.
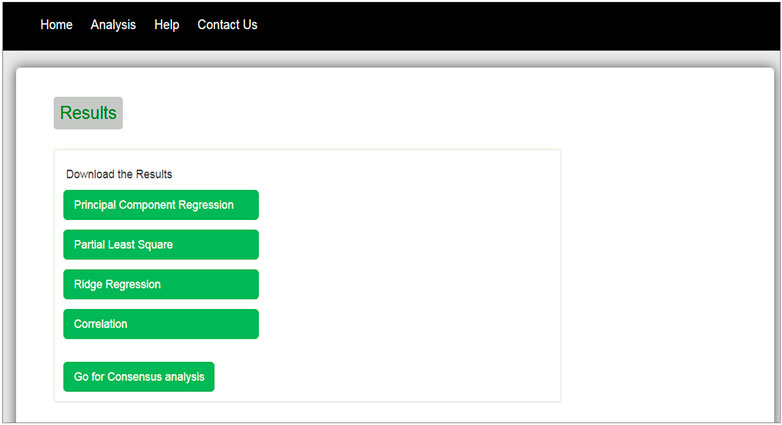
FIGURE 5. Download tab of results obtained from four methods.
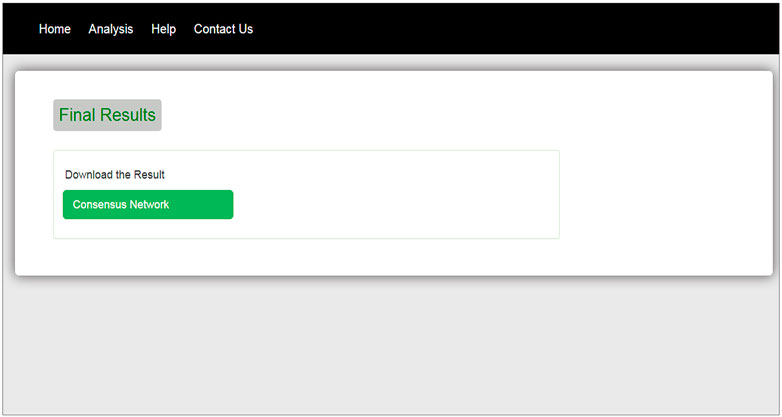
FIGURE 6. Download tab for final result.
Discussion
In this study, a web tool named “Consensus Approach for Gene Regulatory Network Construction” for GRN construction has been developed which provides the network file containing the edge scores of significant interactions of gene pairs. The output file can be visualized using network visualization tools like Cytoscape. In our web tool, we provide the output file containing all the score and statistic values obtained from four individual methods which can also be visualized in Cytoscape. The web tool is easy to use in that it does not require any prior knowledge of R programming and computational steps. It will be very easy for users to construct GRN from gene expression data.
Data Availability Statement
The original contributions presented in the study are included in the article/Supplementary Material, further inquiries can be directed to the corresponding author.
Author Contributions
CS is carried out the whole work and prepared the manuscript. RP helped in conceptualization, writing-review and editing. DM helped in writing-reviewing and editing. AR helped in conceptualization.
Conflict of Interest
The authors declare that the research was conducted in the absence of any commercial or financial relationships that could be construed as a potential conflict of interest.
Publisher’s Note
All claims expressed in this article are solely those of the authors and do not necessarily represent those of their affiliated organizations, or those of the publisher, the editors and the reviewers. Any product that may be evaluated in this article, or claim that may be made by its manufacturer, is not guaranteed or endorsed by the publisher.
Supplementary Material
The Supplementary Material for this article can be found online at: https://www.frontiersin.org/articles/10.3389/fgene.2021.745827/full#supplementary-material
References
Allen, J. D. (2014). ENA : Ensemble Network Aggregation. Welthandelsplatz: The Comprehensive R Archive Network (CRAN). R package Version 1.3-0.
Chen, X., Chen, M., and Ning, K. (2006). BNArray: an R Package for Constructing Gene Regulatory Networks from Microarray Data by Using Bayesian Network. Bioinformatics 22 (23), 2952–2954. doi:10.1093/bioinformatics/btl491
Efron, B. (2004). Large-Scale Simultaneous Hypothesis Testing. J. Am. Stat. Assoc. 99 (465), 96–104. doi:10.1198/016214504000000089
Gill, R., Datta, S., and Datta, S. (2010). A Statistical Framework for Differential Network Analysis from Microarray Data. BMC Bioinformatics 11, 95. doi:10.1186/1471-2105-11-95
Gill, R., Datta, S., Datta, S., and Datta, S. (2014). Dna: An R Package for Differential Network Analysis. Bioinformation 10 (4), 233–234. doi:10.6026/97320630010233
Hedges, L. V., and Olkin, I. (2014). Statistical Methods for Meta-Analysis. San Diego, CA: Academic Press.
Klaus, B., and Strimmer, K. (2015). Fdrtool: Estimation of (Local) False Discovery Rates and Higher Criticism. Welthandelsplatz.
Meyer, P. E., Lafitte, F., and Bontempi, G. (2008). Minet: A R/Bioconductor Package for Inferring Large Transcriptional Networks Using Mutual Information. BMC Bioinformatics 9, 461. doi:10.1186/1471-2105-9-461
Pihur, V., Datta, S., and Datta, S. (2008). Reconstruction of Genetic Association Networks from Microarray Data: a Partial Least Squares Approach. Bioinformatics 24 (4), 561–568. doi:10.1093/bioinformatics/btm640
Sarkar, C., Parsad, R., Mishra, D. C., and Rai, A. (2020). An Ensemble Approach for Gene Regulatory Network Study in rice Blast. J. Crop Weed 16 (3), 1–8. doi:10.22271/09746315.2020.v16.i3.1358
Tzfadia, O., Diels, T., De Meyer, S., Vandepoele, K., Aharoni, A., and Van de Peer, Y. (2016). CoExpNetViz: Comparative Co-expression Networks Construction and Visualization Tool. Front. Plant Sci. 6, 1194. doi:10.3389/fpls.2015.01194
Villaverde, A. F., Ross, J., Morán, F., and Banga, J. R. (2014). MIDER: Network Inference with Mutual Information Distance and Entropy Reduction. PloS one 9 (5), e96732. doi:10.1371/journal.pone.0096732
Zhang, M., Li, Q., Yu, D., Yao, B., Guo, W., Xie, Y., et al. (2019). GeNeCK: a Web Server for Gene Network Construction and Visualization. BMC bioinformatics 20 (1), 12–17. doi:10.1186/s12859-018-2560-0
Keywords: web tool, PHP, fisher’s weighted method, consensus approach, gene regulatory network
Citation: Sarkar C, Parsad R, Mishra DC and Rai A (2021) A Web Tool for Consensus Gene Regulatory Network Construction. Front. Genet. 12:745827. doi: 10.3389/fgene.2021.745827
Received: 22 July 2021; Accepted: 19 October 2021;
Published: 24 November 2021.
Edited by:
Josh Clevenger, HudsonAlpha Institute for Biotechnology, United StatesCopyright © 2021 Sarkar, Parsad, Mishra and Rai. This is an open-access article distributed under the terms of the Creative Commons Attribution License (CC BY). The use, distribution or reproduction in other forums is permitted, provided the original author(s) and the copyright owner(s) are credited and that the original publication in this journal is cited, in accordance with accepted academic practice. No use, distribution or reproduction is permitted which does not comply with these terms.
*Correspondence: Chiranjib Sarkar, Y3NjaGlyYW5qaWI5QGdtYWlsLmNvbQ==