 Yijun Liu1
 Fupeng Ding
95% of researchers rate our articles as excellent or good
Learn more about the work of our research integrity team to safeguard the quality of each article we publish.
Find out more
ORIGINAL RESEARCH article
Front. Genet. , 08 September 2021
Sec. Statistical Genetics and Methodology
Volume 12 - 2021 | https://doi.org/10.3389/fgene.2021.728563
This article is part of the Research Topic System Biology Methods and Tools for Integrating Omics Data, Volume II View all 15 articles
Bone mineral density (BMD) is a complex and highly hereditary trait that can lead to osteoporotic fractures. It is estimated that BMD is mainly affected by genetic factors (about 85%). BMD has been reported to be associated with both common and rare variants, and numerous loci related to BMD have been identified by genome-wide association studies (GWAS). We systematically integrated expression quantitative trait loci (eQTL) data with GWAS summary statistical data. We mainly focused on the loci, which can affect gene expression, so Summary data-based Mendelian randomization (SMR) analysis was implemented to investigate new genes and loci associated with BMD. We identified 12,477 single-nucleotide polymorphisms (SNPs) regulating 564 genes, which are associated with BMD. The genetic mechanism we detected could make a contribution in the density of BMD in individuals and play an important role in understanding the pathophysiology of cataclasis.
Bone mineral density (BMD), is a main risk factor for osteoporosis (OP) or systemic bone loss, which is associated with the increasing risk of fragility fracture, especially for older women (Glüer et al., 2004; Cauley et al., 2007). BMD also plays a role for causing bone fractures, including pressure fractures (Nattiv, 2000). Generally, BMD can be detected by dual-energy X-ray absorptiometry (DXA), which is a non-invasive bone densitometry method but hard to implement. Another method to measure BMD is quantitative ultrasound of the calcaneus (QUS), which is flexible, inexpensive, and easier to perform. BMDs at the spine and hip are reported to be highly heritable (Arden et al., 1996; Lee et al., 2006), which could be detected by DXA (Gonnelli et al., 2005), and are fracture risk related to fracture risk (Bauer et al., 2007).
Based on genome-wide association studies (GWAS) analysis using heel ultrasound parameters, Moayyeri et al. (2014) identified mutations at nine loci, including seven previously reported loci. GWAS, so far, have detected more than 100 genetic variants associated with BMD, including many significant loci associated with risk of fractures. In recent years, more and more BMD risk variants with low frequencies have been detected based on deep whole-genome sequencing. However, most experiment-verified variants can rarely explain approximately 5.8% of the phenotypic variance in BMD (Zheng et al., 2015). Estrada et al. (2012) identified 62 significant SNPs by performing a meta-analysis consisting of 17 BMD GWAS studies, which focused on lumbar spine or femur neck. Kemp et al. (2017) performed a genome-wide association screen by UK Biobank and identified 307 independent SNPs located in the 203 loci. However, it remains elusive on how these genetic loci lead risk to BMD based on linkage disequilibrium phenomenon (LD) between detected SNPs and real causative mutations. In addition, due to the strict statistical significance threshold set in GWAS analysis, it is difficult to detect co-pathogenic loci in a single GWAS study. Therefore, we need to use other omics data to reveal the potential effect of these weak GWAS association signals on BMD, which may help to understand the heritability of this trait.
By these biological experiments, researchers have found several genes, which are related to BMD. Some researchers have used computational method to identify more BMD-related genes (Wu et al., 2021). Machine learning and deep learning methods have been widely used in the prediction of trait-related genetic factors (Zhuang et al., 2019; Tarwadi et al., 2020; Zhao et al., 2020a). Most of these methods predict the associations between biomolecules by feature extraction and building mathematical models (Tianyi et al., 2021; Zhao et al., 2020b,2021a). However, these studies fail to explain the biological mechanism of results. Therefore, it is necessary to further reveal the mechanism of significant SNPs identified by GWAS (Zhao et al., 2019).
Considering the influence of LD, systematical approaches are proposed to explore the latent regulatory functions of the risk variants reported in previous GWAS studies by integrating multiple omics data (Peng and Zhao, 2020; Zhao et al., 2020c). Since gene expression is an important factor related to genetic mutations and traits, many researchers tried to reveal pathogenesis by gene expression (Zhao et al., 2021b). Researches have detected numerous expression quantitative trait loci (eQTLs) associated with BMD based on eQTL data from primary bone cell cultures (Grundberg et al., 2009; Kwan et al., 2009). Kwan et al. (2009) has found that rs136564 plays an important role in regulating the expression of a novel transcript of FAM118A, and rs136564 is also reported to be related to BMD based on GWAS analysis. Therefore, many studies focused on confirming whether an SNP can be detected by both GWAS and eQTL analysis (Farber, 2012). However, most studies focused on separately analyzing GWAS data and eQTL data rather than in an integrative way to identify disease genes (Farber and Lusis, 2008).
Mendelian randomization approach is proposed as a method of using genetic variants as instrumental variables to examine the causal influence of a modifiable exposure on diseases. Based on this assumption, we can identify the most functionally related genes to diseases. Apparently, complex traits, such as BMD, are not only derived from the effect of a single gene but also the integrated influence from complex biological networks (Schadt, 2009). In this study, we applied the Mendelian randomization (MR) method based on summary statistic data to identify novel causative genes associated with BMD. We first collected two GWAS datasets from UK Biobank [including 394,929 individuals (Zheng et al., 2015)], UK10K [including 32,965 individuals (Kim, 2018)], and blood eQTL data (Westra et al., 2013). Then SMR was implemented to investigate new genes and loci associated with BMD. As a result, we identified 12,477 SNPs regulating 564 genes, which have causal effect on BMD. Finally, we assessed the functional interactions between these genes to examine their underlying functional mechanism.
The GWAS summary data were obtained from UK Biobank and UK10K project, respectively. Individuals (394,929) with genotype and phenotype data were collected from the UK Biobank. The DNA variants were filtered by MAF > 0.1%. The dataset from UK10K is composed of 2,882 whole-genome sequencing (WGS data), 3,549 whole-exome sequencing (WES data), 26,543 deep imputation of genotyped samples, and 20,271 de novo replication genotyping. The detailed description information of GWAS datasets can be accessed from previous studies (Westra et al., 2013; Zheng et al., 2015).
It has been validated that bone metabolism is related to various types of cells such as peripheral blood monocyte cell (PBMC), B and T lymphocytes (Chalmers et al., 1981). PBMC plays an important role in studying gene expression functions related to human osteoporosis risk (Liu et al., 2005). They can also be considered as precursors of osteoclasts (Geissmann et al., 2010) and express various cytokines, which are essential in the biological process of osteoclast (Deng et al., 2011). B lymphocytes can also express biological factors associated with osteoclastogenesis and plays an important role in the immune system (Manabe et al., 2001). Recently, studies based on eQTL-mapping methods indicated that most of the disease-causative mutations actually have an influence on the expression level of nearby genes due to the phenomenon of LD (Dubois et al., 2010; Nicolae et al., 2010). Researchers have also identified that trans-eQTLs can reveal the downstream consequences of the variants (Fehrmann et al., 2011; Innocenti et al., 2011; Grundberg et al., 2012). In this study, we collected eQTL summary data of 5,311 samples in peripheral blood tissue, which is derived from a total of nine datasets from seven different cohorts (Westra et al., 2013).
Since GWAS analysis focus on the effect of a single genetic variant, it ignores the interactions between different loci. However, the effect size of an SNP is different from diverse datasets. Thus, we performed a GWAS meta-analysis on two GWAS summary datasets in order to correct the effect size of multiple GWAS datasets. By assigning different weights to each SNP from different datasets, we can integrate these GWAS datasets into a more comprehensive one. There are three measurements to assess the association score between variants and the trait in GWAS dataset, β, SE, and p-value. β measures the estimate of a causative effect between SNP and trait, and SE indicates the standard deviation (SD) of β. The p-value denotes the significance level of association between SNP and the trait.
Since SE can represent the reliability of β, it can be inferred that the bigger the SE, the more inaccurate the β. Because SE is the SD of β, the weight of β can be denoted as the inverse ratio of the SE square. Thus, the weight wi of βi in the ith GWAS dataset can be denoted as:
where SEi denotes the SD of the SNP in the ith dataset.
Thus, we can integrate the effect size measurement β between different datasets, and it can be denoted as:
In the meantime, SE after the integration of the datasets can be denoted as:
Then we calculated the Z-score of SNPs based on the effect size β and SE to obtain the significance of SNPs. Z-score can be denoted as:
Then we obtained the p-value of the association after the integration of the effect of SNPs from different datasets based on the hypothesis testing of the normal distribution of the Z-score.
Thus, we can integrate multiple GWAS datasets by applying the above method. It can be deduced that the reliability of SNPs and SE are negatively correlated, and the weight of β is lower compared with other datasets, while the SE value is bigger. Thus, the value of β can be corrected across multiple datasets according to different weights.
Multiple potential and unmeasurable confounding factors may lead to huge challenges in inferring the causative relationship between genes and complex traits. However, genetic mutation is a major factor of heredity. Thus, exploring the underlying mechanism of genetic variants is important to reveal the pathologies of complex traits. Due to the linkage disequilibrium, the effect size between SNPs detected by GWAS analysis and BMD may not be accurate. Moreover, GWAS cannot fully explain the association between BMD and SNPs. Thus, the MR method is first proposed to consider a genetic variant as a factor to assess and examine for the effect size of an exposure variable on an outcome (Smith and Ebrahim, 2008). Based on the MR theory, if we use z to denote an SNP, x as the gene expression, and y as the BMD, then the association of gene expression (x) and BMD (y) can be denoted as bxy,
where bzy indicates the association between SNP and BMD, and it can be represented as the slope of z to y. bzx denotes the association between SNP and gene expression, and it can be denoted as the slope of z to x. bzy and bzx can be obtained from two independent GWAS dataset and eQTL dataset.
Then the sampling variance of the estimate value of bxy can be denoted as:
where n denotes the size of samples, denotes the estimate value of bxy indicates the proportion of variance in BMD, which is explained by gene expression, indicates the proportion of variance in gene expression level explained by SNP. Therefore, the statistic TSMR is utilized to test the significance of bxy, and TSMR can be represented as:
However, it is not realistic, so far, to collect genotype data and gene expression data from a very large sample size. Also, because the effect size of eQTL was unavailable, bzx can be estimated from the Z-score of eQTL data as :
where , f is the allele frequency, and n is the sample size. An unbiased estimate of bzx could be denoted as . We therefore have:
where denotes the estimate of the effect of an SNP from GWAS data for BMD, and is the estimate of the effect of an SNP on the gene expression level from an eQTL data. The Delta method can be utilized to calculate the sampling variance of approximately (Lynch and Walsh, 1998):
where is 0 when εzx and bzy are derived from independent GWAS and eQTL datasets. Because the distribution of the Z-score is known, while the distributions of εzx and bzy are unknown, TSMR can be approximately denoted as:
where Zzy and Zzx denotes the Z-score derived from GWAS and eQTL data. Since the distribution of TSMR is x2 = 1, the significance of bxy can be calculated by performing a χ2-test of TSMR, which is also the significance of the association between gene and BMD.
We first integrated two independent GWAS datasets to obtain a more comprehensive GWAS dataset. After obtaining β and SE of each SNP based on GWAS dataset and eQTL dataset, respectively, we obtained the estimate of effect size of SNPs on BMD based on integrated GWAS summary data and estimate of effect size on gene expression based on SNPs from eQTL data. We obtained two Z-scores of the same SNP based on two datasets, ZGWAS and ZeQTL. The GWAS dataset provides the SNPs associated to BMD, and the eQTL dataset provides the association between these SNPs and expression level of gene. Then the SMR method is utilized to examine the effect size of SNPs on BMD excluding some irrelevant factors.
Since one single SNP can regulate multiple genes, we then identify the causative genes, which are regulated by these SNPs and are associated with BMD. We performed a Bonferroni test to filter the SNPs we obtained for the SMR method. After all, we identified 12,477 SNPs, and 564 genes regulated by these SNPs are associated with BMD. It is clear from the result that most of the causative genes are regulated by multiple SNPs, which means detecting the disease-related genes merely depending on GWAS datasets is not reliable. The workflow is shown in Figure 1.
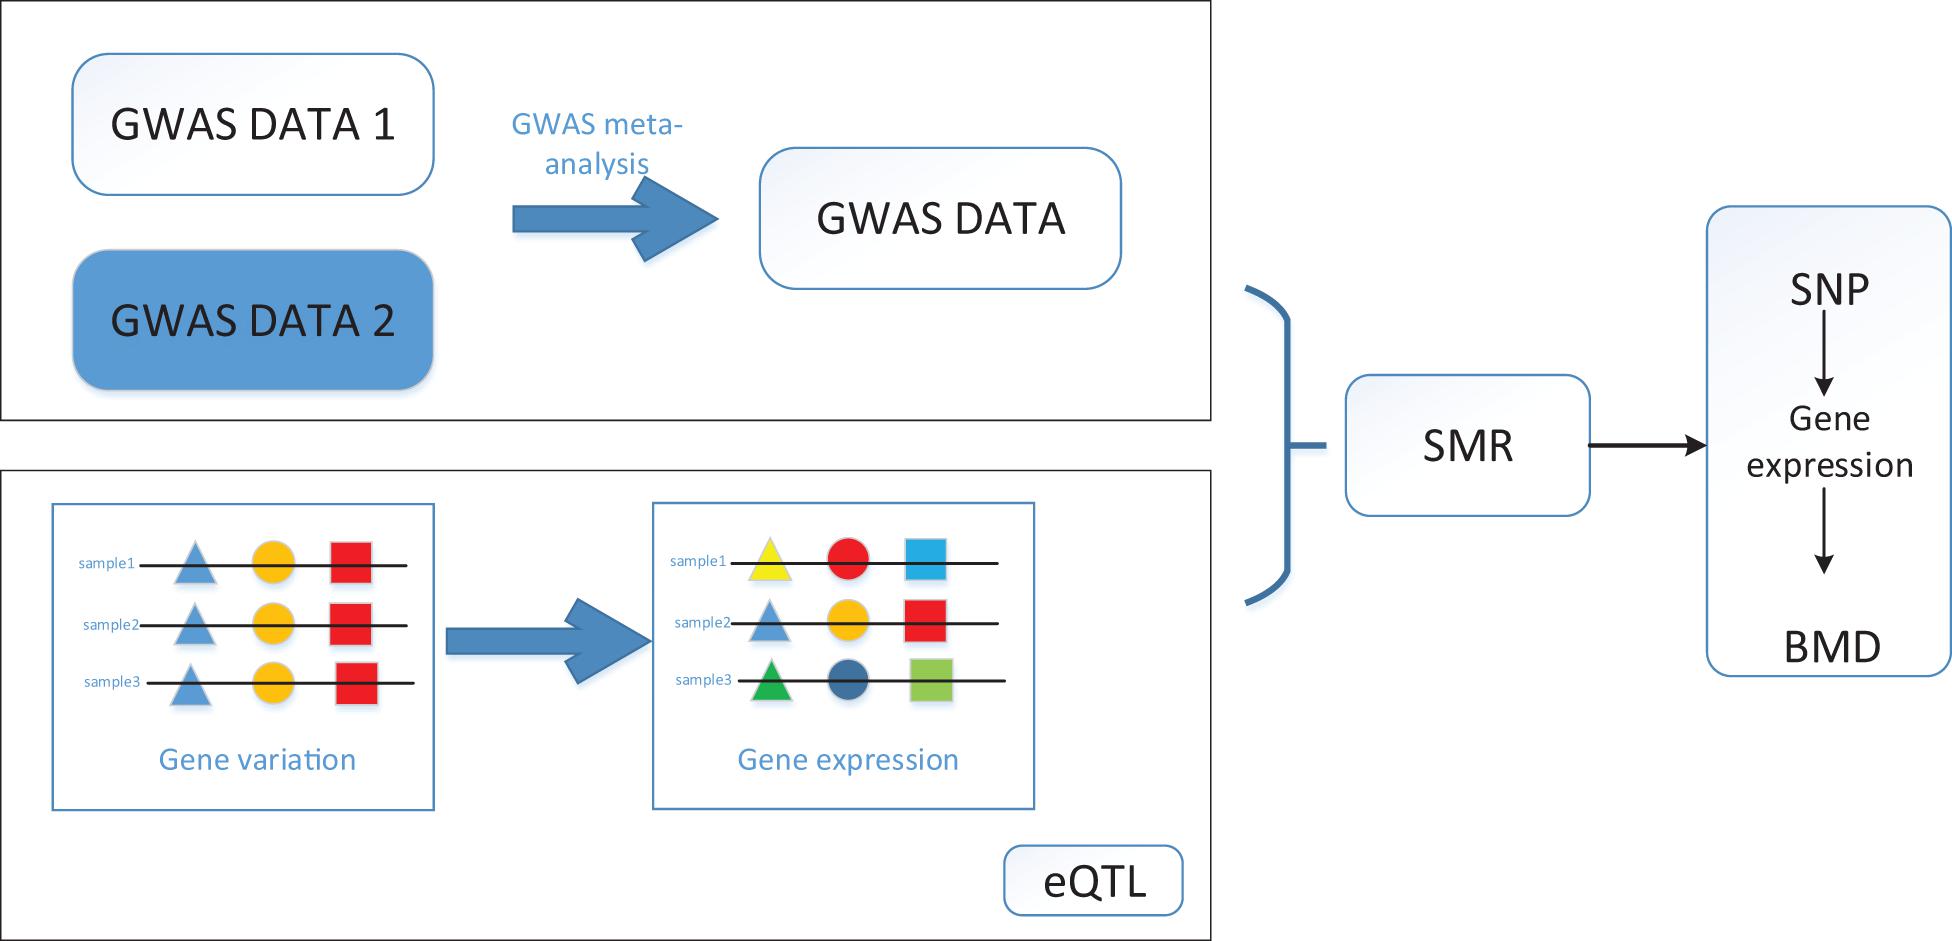
Figure 1. Workflow of SMR on bone mineral density (BMD) based on genome-wide association studies (GWAS), and expression quantitative trait loci (eQTL) datasets.
The result of the GWAS meta-analysis is shown in Figure 2. It is apparent that the original datasets from former studies are not consistent. After integration, we obtained a more precise GWAS dataset for BMD. Since there are many overlapping SNPs in the GWAS dataset and eQTL dataset, we have to filter these SNPs to find out whether the genes regulated by these SNPs are associated with BMD. Thus, the SMR method is utilized to examine latent associations between gene expression and BMD. The results of BMD-related genes based on GWAS and eQTL to test for the integrated data are shown in Figure 3. We identified, in total, 12,477 SNPs regulating 564 genes associated with BMD. This indicates that multiple SNPs may cooperate and effect the expression of a single gene. For example, gene FDFT1 is regulated by 451 SNPs, and most SNPs can regulate multiple genes as well, such as rs10085549, rs1073, and so on. They can regulate seven genes. Supplementary Material indicates the significant genes and SNPs related to BMD.
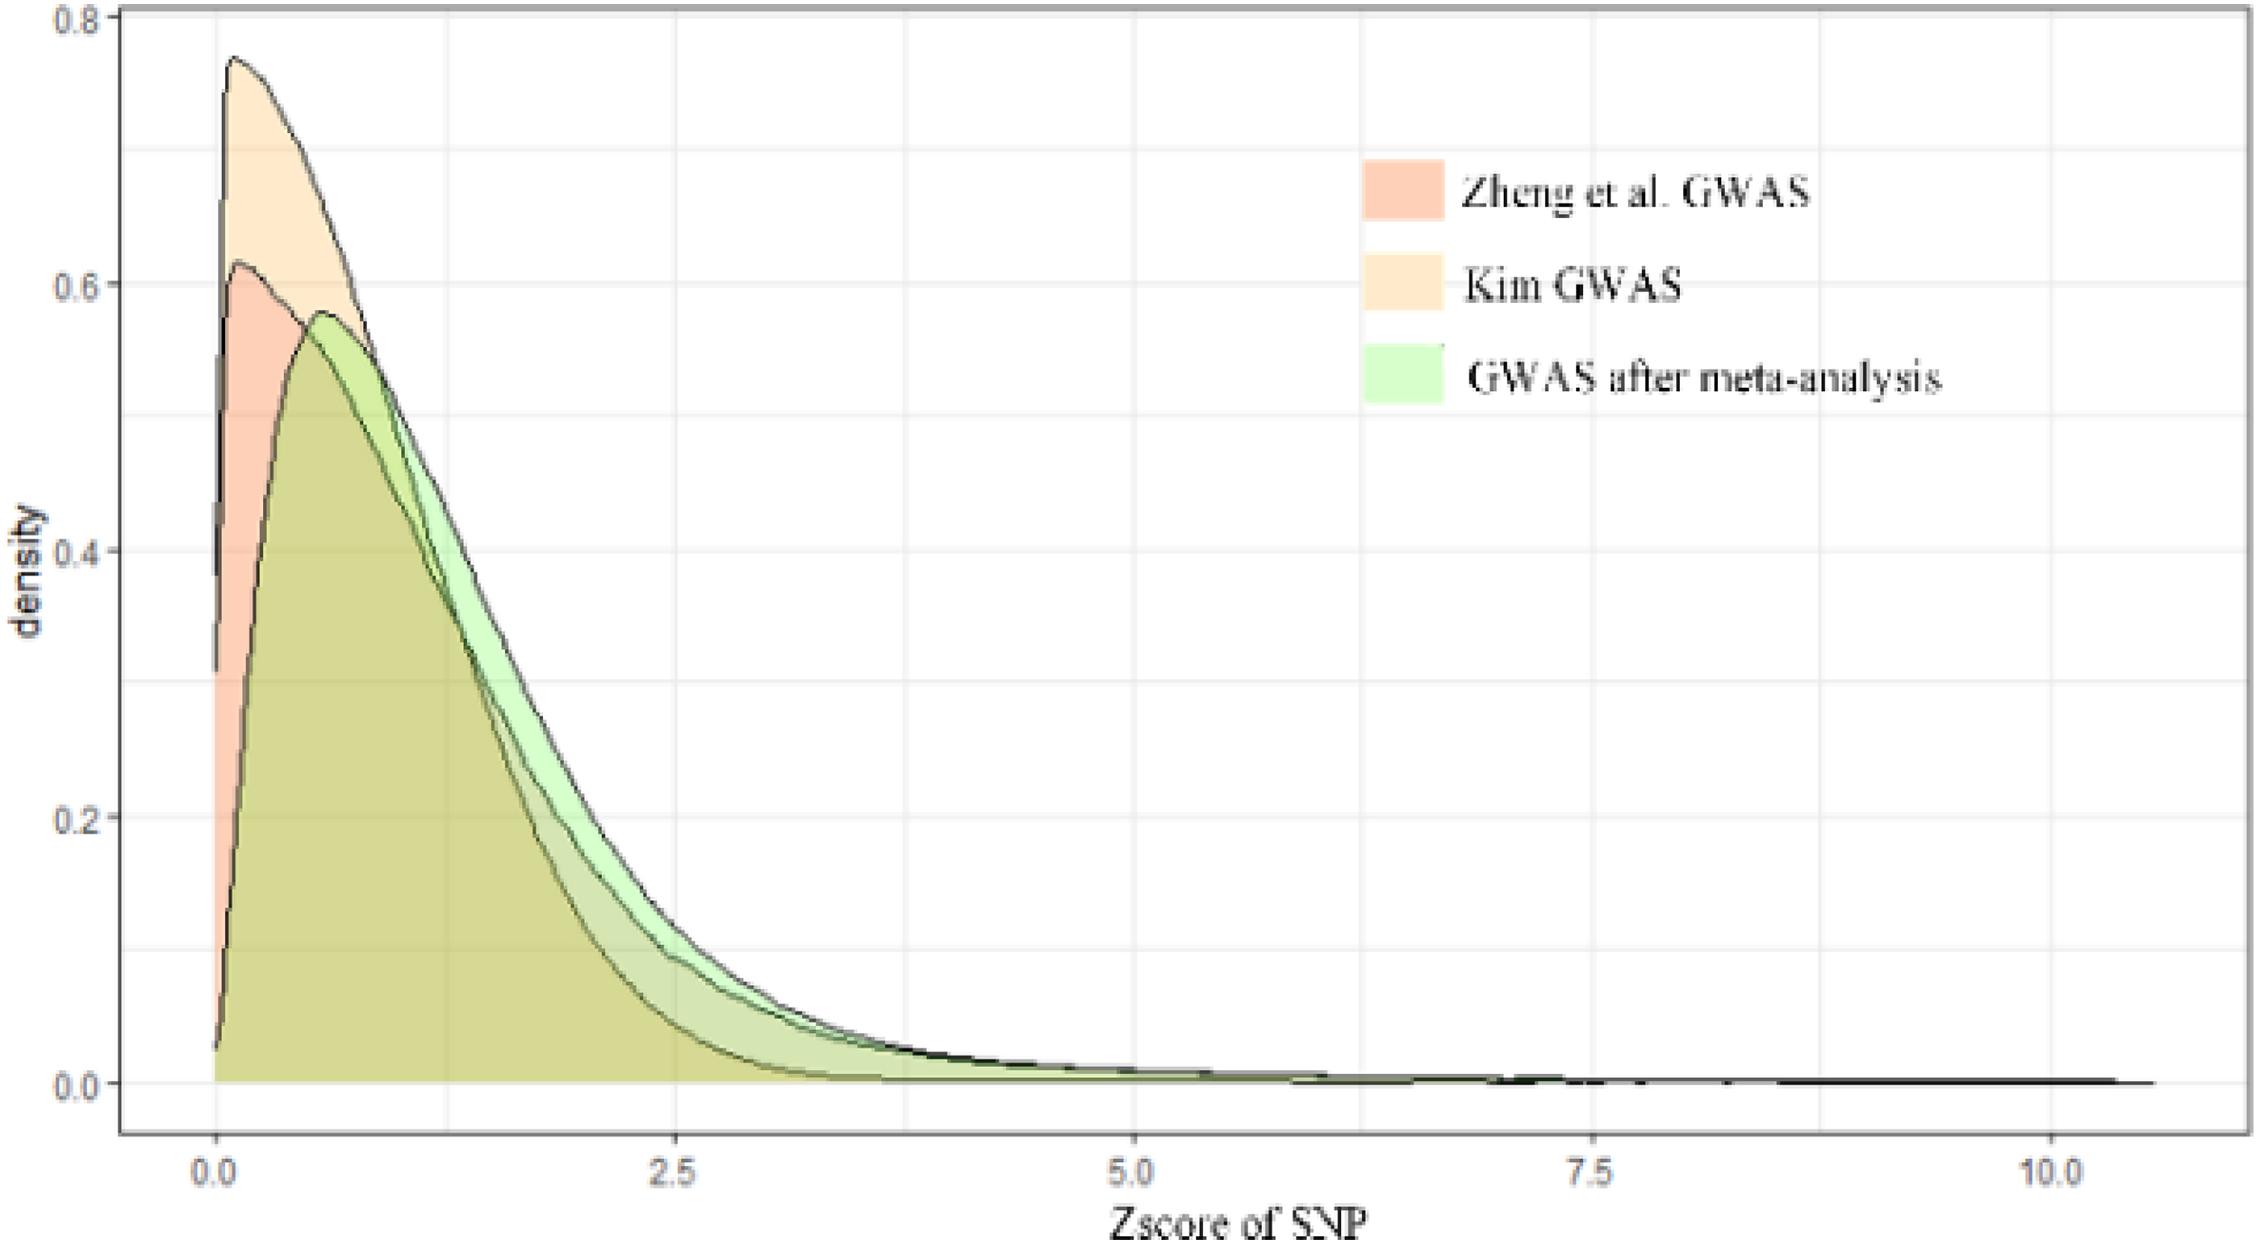
Figure 2. The result of GWAS meta-analysis on BMD.
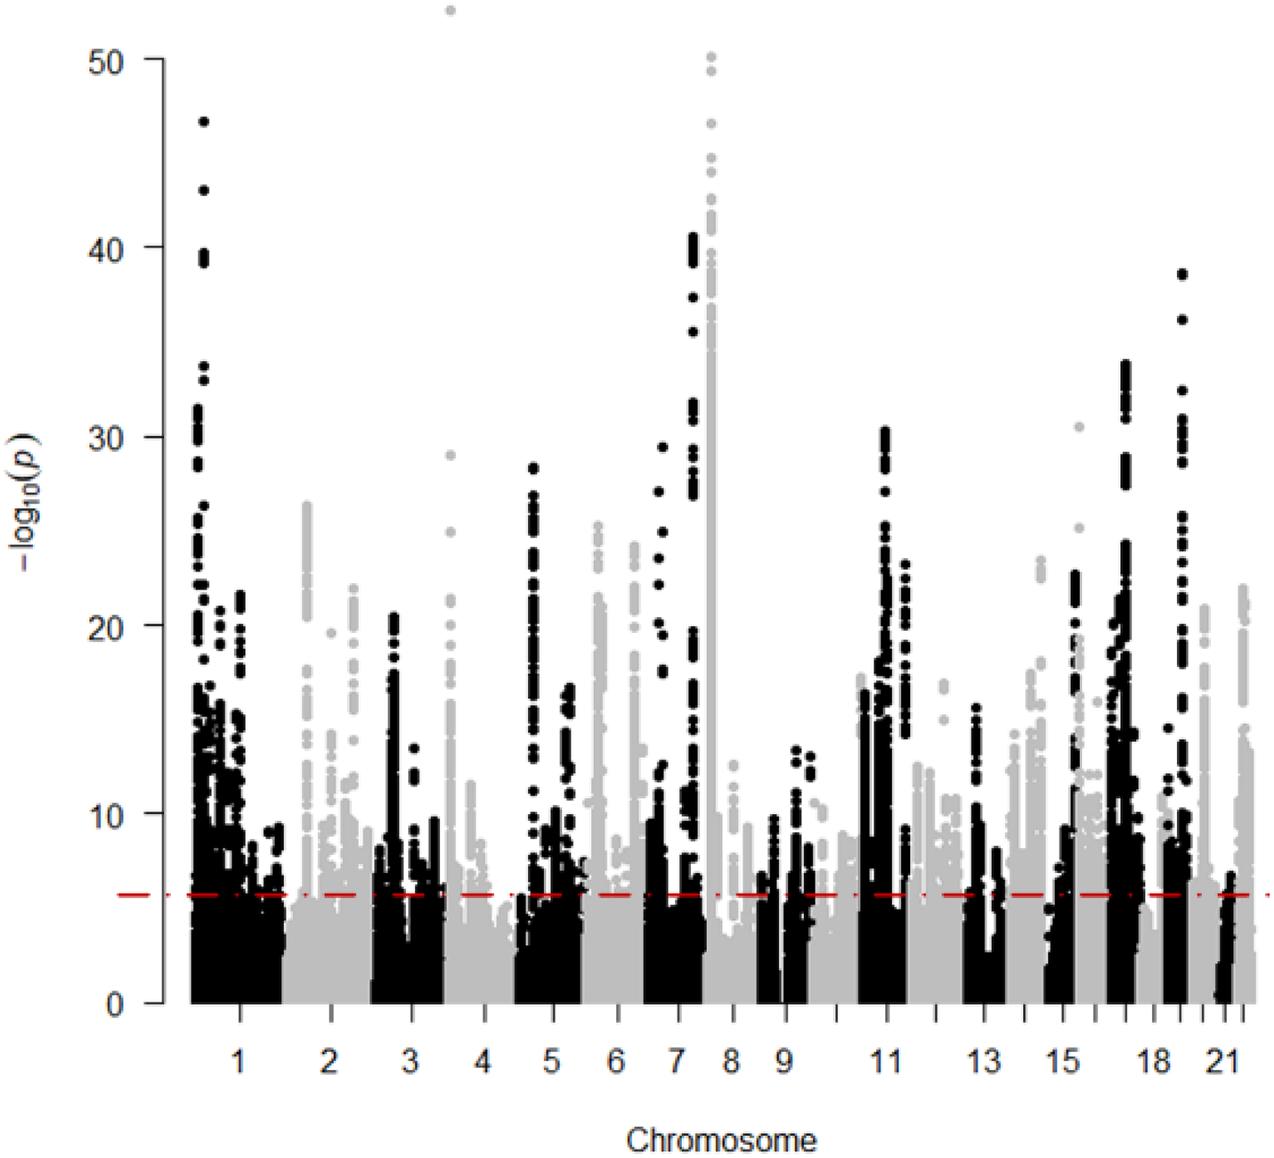
Figure 3. The results of BMD-related genes based on SMR. The red line means “Significant threshold”.
As a result of the SMR method, we identified 12,477 significant SNPs and 564 significant genes associated with BMD. Several significant genes of the results have been reported in recent studies. In the study of Kim (2008), they identified that gene DGKQ is associated with heel BMD. In the study of Wang et al. (2015) they have found the association between FDFT1 and the therapeutic response among Chinese postmenopausal women suffering from osteopenia or osteoporosis. Cdc42 is identified to be strongly related to bone deterioration in experimental osteoarthritis according to the study of Hu et al. (2018). LRP3, TMUB2 has also been reported as a risk factor for BMD of the lumbar spine (LS-BMD) (Zhu et al., 2016). RERE is reported to be a novel suspective gene associated with BMD from a group of Caucasian-origin families (Zhang et al., 2009). In total, there are 10 out of the top 20 significant genes in our results that have been reported to be related with BMD according to previous studies. Table 1 shows these 10 genes and related GWAS studies published previously.
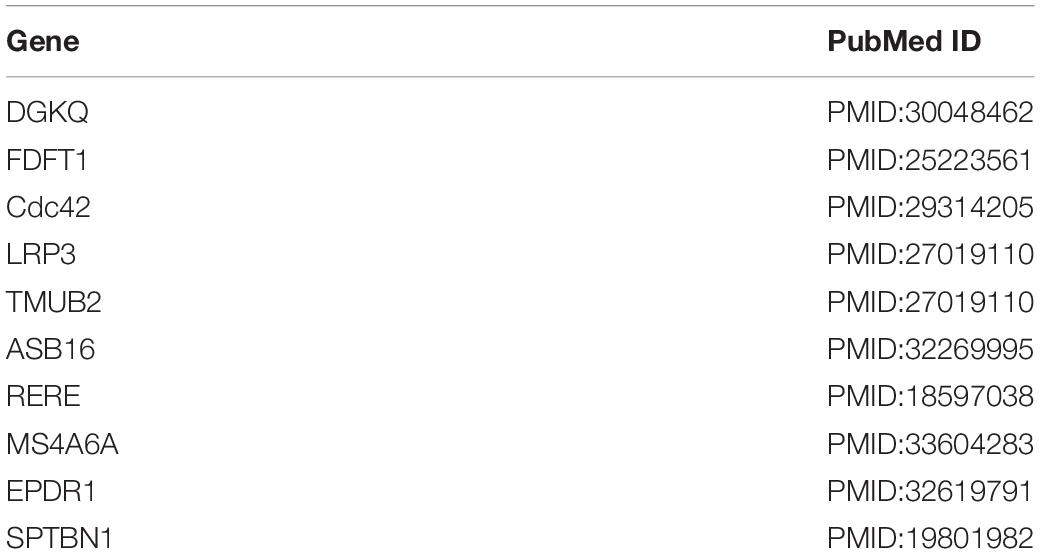
Table 1. Ten of the top 20 significant genes and related study.
Figure 4 shows the top 100 gene interaction networks derived from the results of the SMR method on BMD. Figure 5 shows the gene interaction network from all significant genes derived from the SMR method. Based on the top 100 gene interaction networks, Cdc42 and CTNNB1 are intensively interacted and significantly associated with BMD. It is known that the process of bone (re)modeling is based on the distinct actions of osteoclasts and osteoblasts, which are achieved by the organization of osteoclast cytoskeleton. Cdc42 belongs to the Rho GTPase subfamily, which is considered to be major regulators of cytoskeleton, and it has been reported to be a prospective therapeutic target for preventing osteoporosis (Ito et al., 2010). CTNNB1 has been reported to be related to BMD in the spine and hips (Estrada et al., 2012).
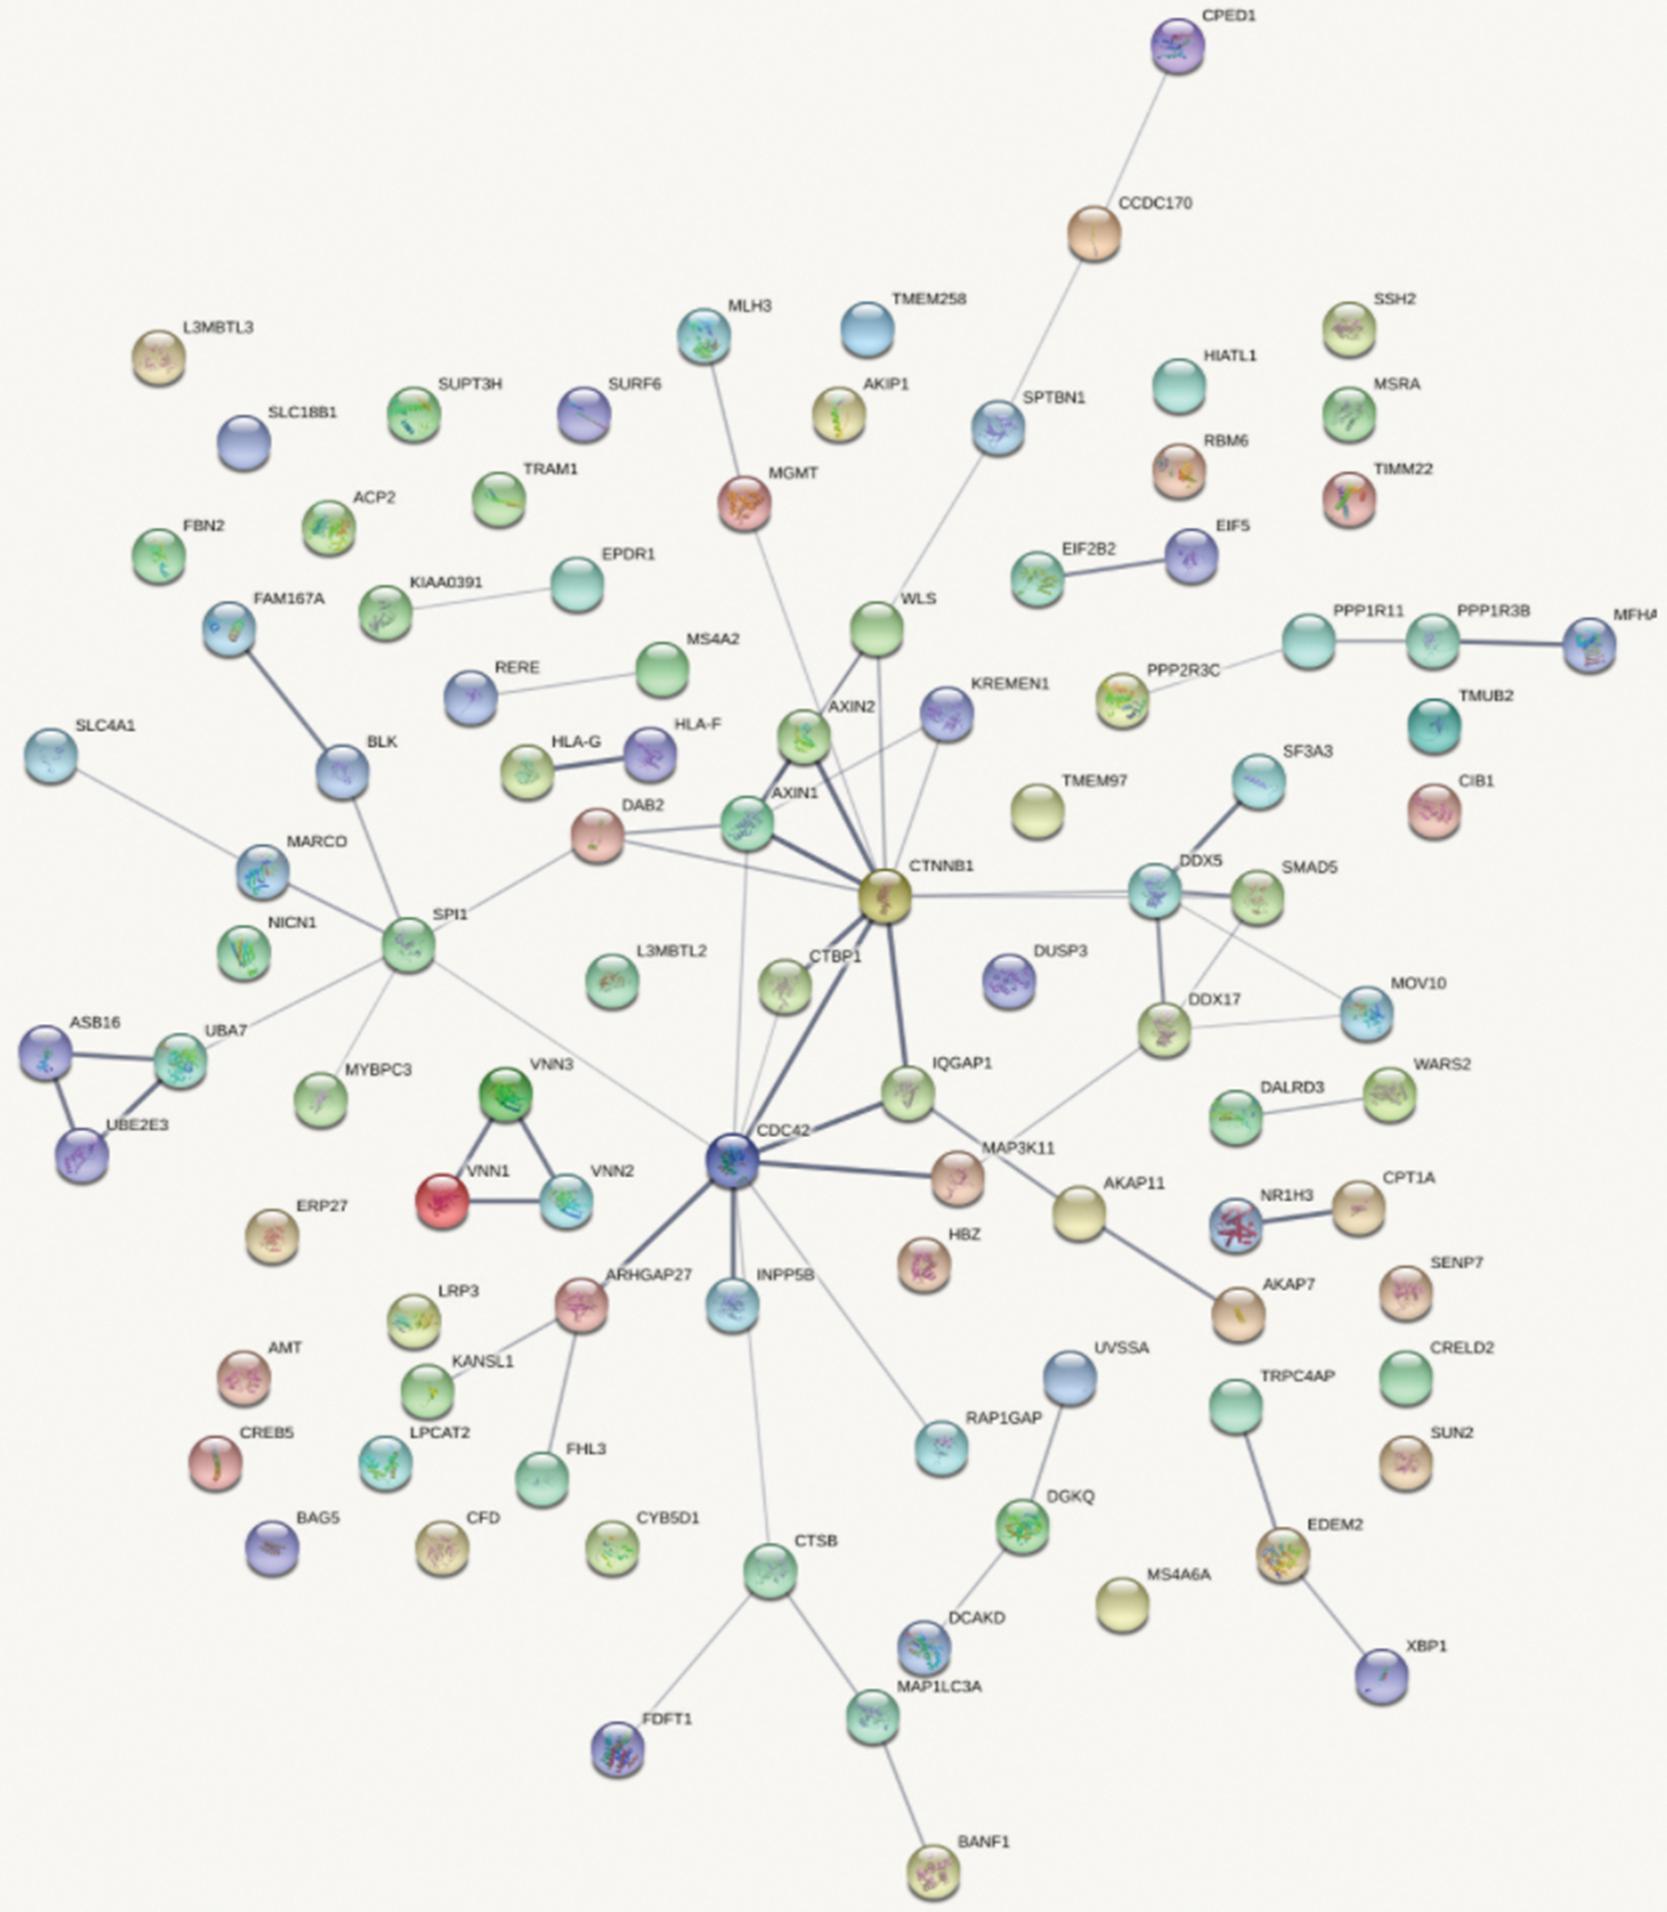
Figure 4. Gene interaction network obtained from the top 100 genes.
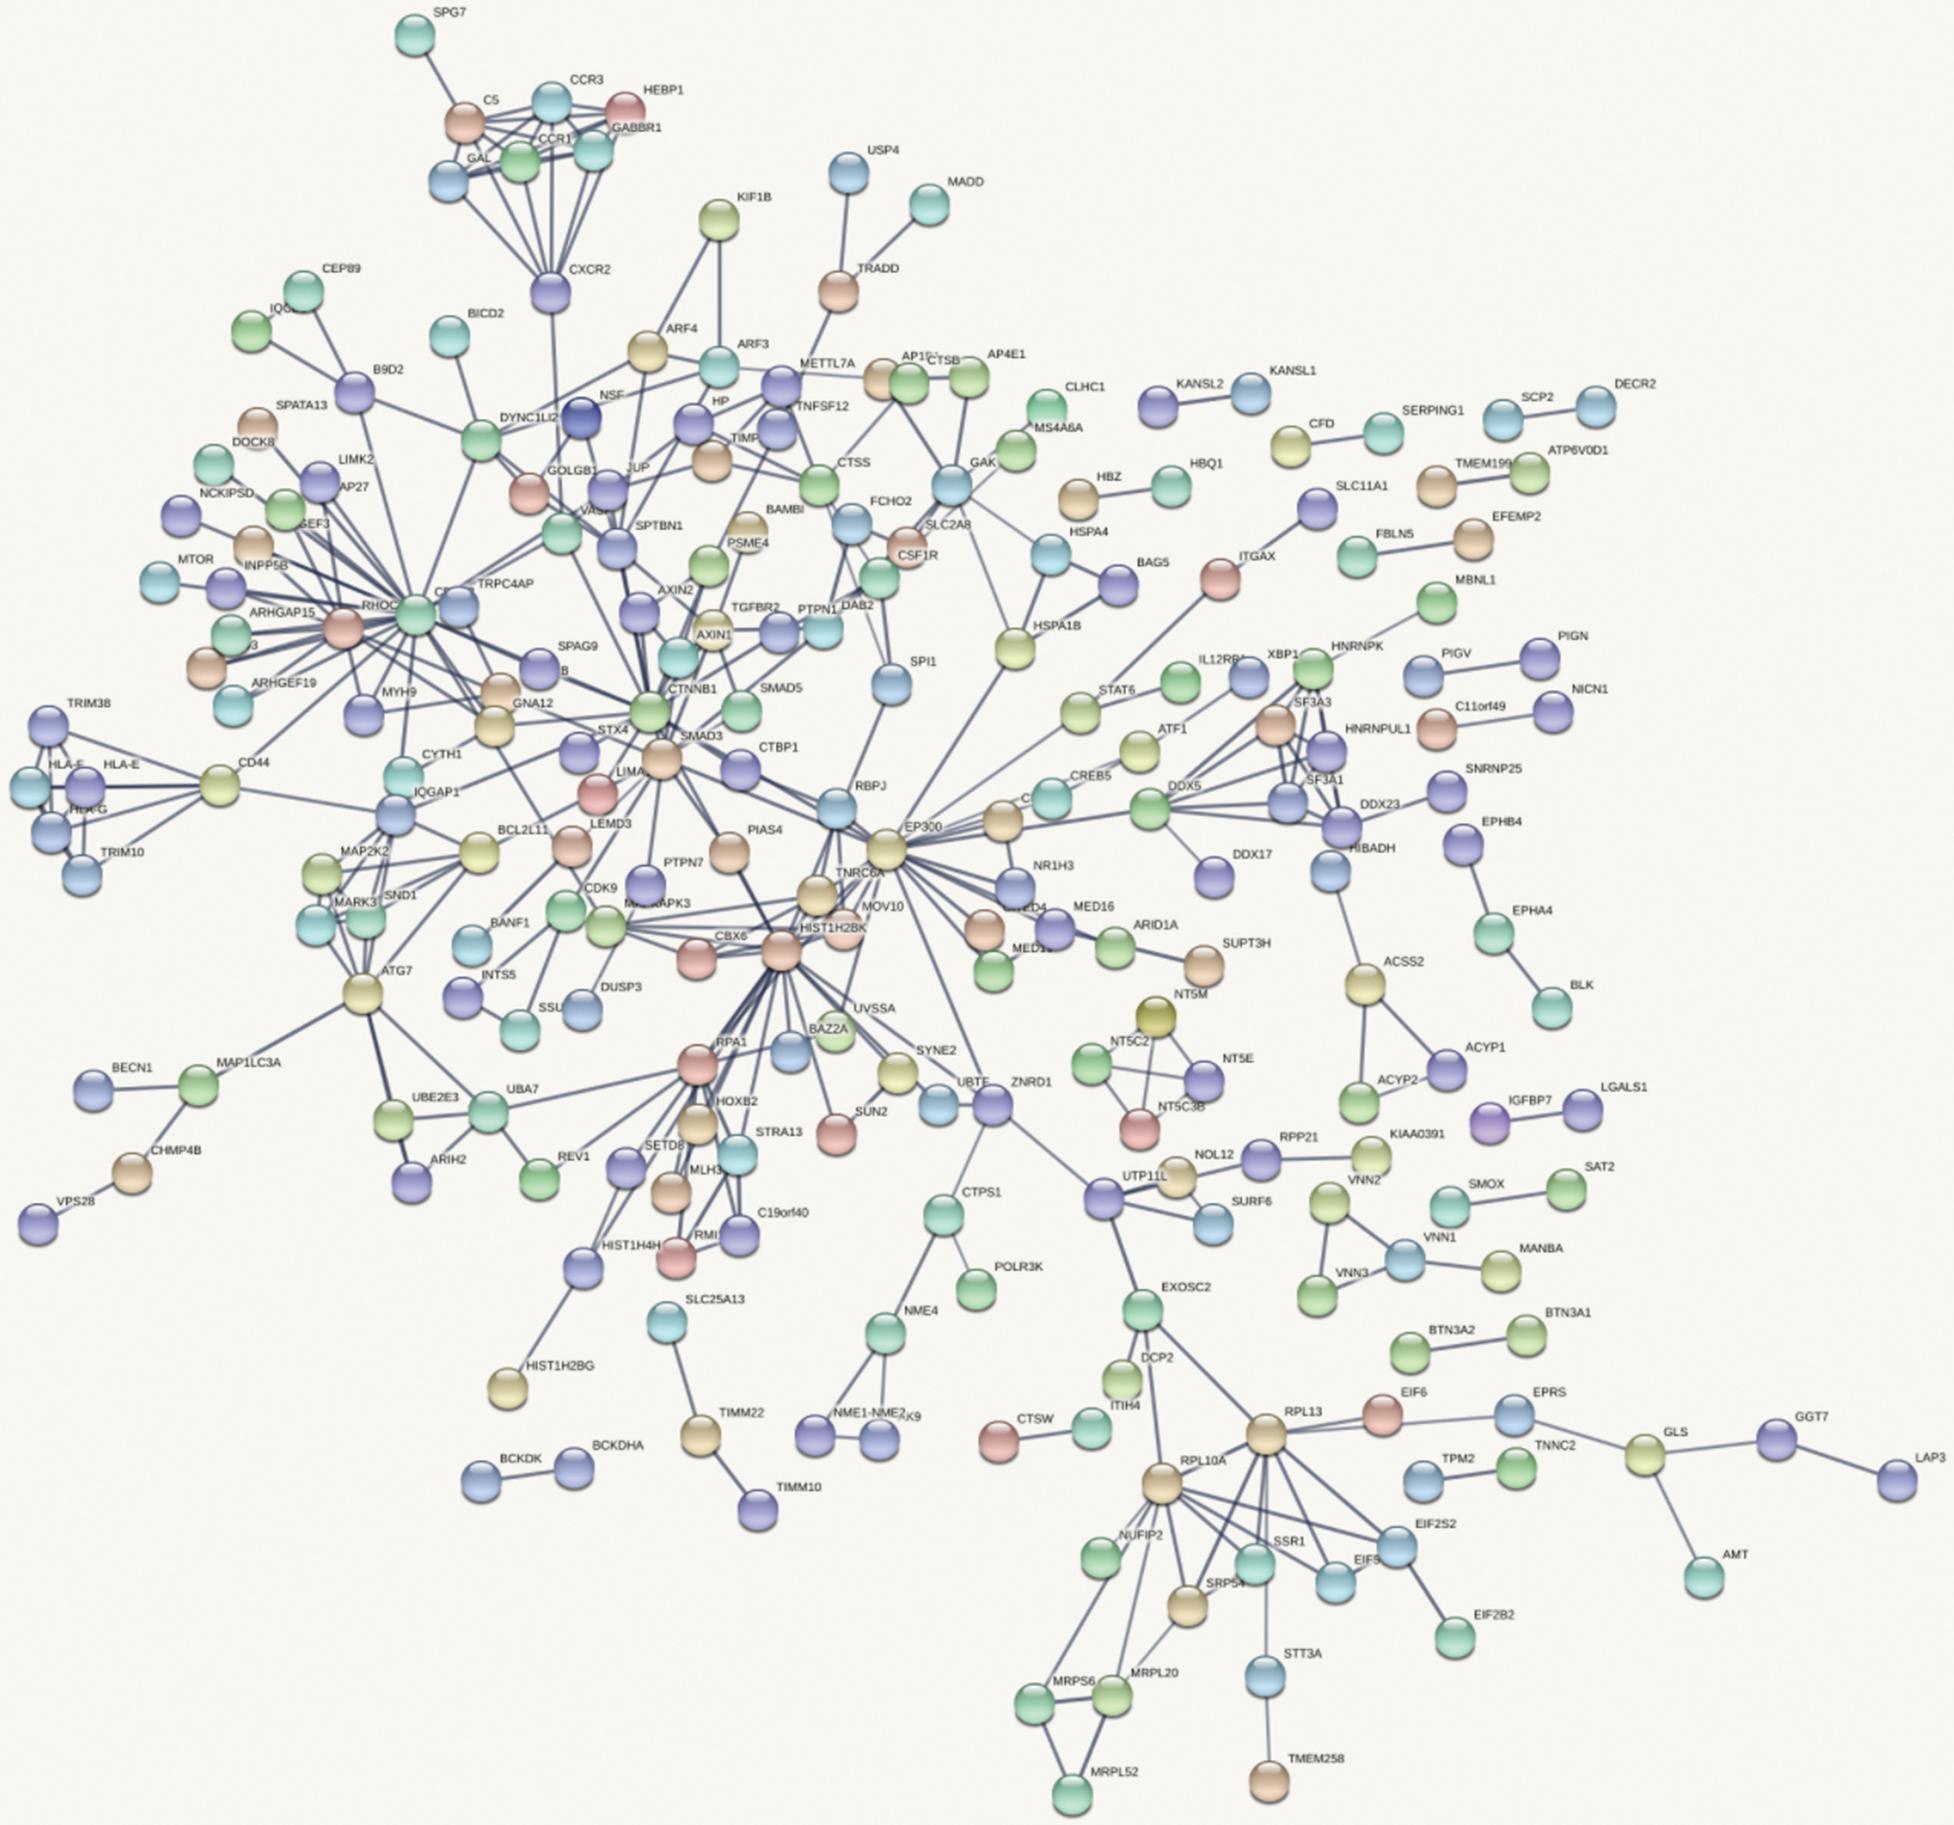
Figure 5. Gene interaction network obtained from all significant genes.
In total, we identified 12,477 SNPs and 564 genes related to BMD by the SMR method. Then we performed the case study of the identified genes to prove the effectiveness of our BMD-related gene identification method based on multiple omics data integration.
We use the SMR method to integrate omics data to identify BMD–gene associations. First, we integrated two independent GWAS data sets by adjusting the weights of SNPs to overcome that different GWAS datasets have different sample sizes. Then we reduced the impact of linkage disequilibrium and identified the impact of SNPs on BMD based on GWAS data and eQTL data. Through the Bonferroni test, we obtained 12,477 SNPs and 564 genes significantly related to BMD. Among these genes, 10 of the top 20 risk genes have been previously reported to be associated with BMD, which proves the validity of our method and the correctness of the results, but further biological experiments are needed to verify our results. Our results indicate that BMD is a highly inherited polygenic trait and is significantly associated with osteoporosis. These findings help us reveal the pathology of osteoporosis and determine the relevant pathways and therapeutic drugs.
The datasets presented in this study can be found in online repositories. The names of the repository/repositories and accession number(s) can be found in the article/Supplementary Material.
Ethical review and approval was not required for the study on human participants in accordance with the Local Legislation and Institutional Requirements. Written informed consent for participation was not required for this study in accordance with the National Legislation and the Institutional Requirements.
YL, GJ, and XW wrote the manuscript and did the experiments. FD provided ideas of this work. YL, GJ, and YD analyzed the data. All authors approved the submitted version.
The authors declare that the research was conducted in the absence of any commercial or financial relationships that could be construed as a potential conflict of interest.
All claims expressed in this article are solely those of the authors and do not necessarily represent those of their affiliated organizations, or those of the publisher, the editors and the reviewers. Any product that may be evaluated in this article, or claim that may be made by its manufacturer, is not guaranteed or endorsed by the publisher.
The Supplementary Material for this article can be found online at: https://www.frontiersin.org/articles/10.3389/fgene.2021.728563/full#supplementary-material
Supplementary Table 1 | Predicted genes.
Supplementary Table 2 | Predicted SNPs.
Arden, N., Baker, J., Hogg, C., Baan, K., and Spector, T. (1996). The heritability of bone mineral density, ultrasound of the calcaneus and hip axis length: a study of postmenopausal twins. J. Bone Min. Res. 11, 530–534. doi: 10.1002/jbmr.5650110414
Bauer, D., Ewing, S., Cauley, J., Ensrud, K., Cummings, S. R., and Orwoll, E. (2007). Quantitative ultrasound predicts hip and non-spine fracture in men: the MrOS study. Osteop. Int. 18, 771–777. doi: 10.1007/s00198-006-0317-5
Cauley, J. A., Hochberg, M. C., Lui, L.-Y., Palermo, L., Ensrud, K. E., Hillier, T. A., et al. (2007). Long-term risk of incident vertebral fractures. JAMA 298, 2761–2767. doi: 10.1001/jama.298.23.2761
Chalmers, T. C., Smith, H. Jr., Blackburn, B., Silverman, B., Schroeder, B., Reitman, D., et al. (1981). A method for assessing the quality of a randomized control trial. Control. Clin. Trials 2, 31–49. doi: 10.1016/0197-2456(81)90056-8
Deng, F.-Y., Lei, S.-F., Zhang, Y., Zhang, Y.-L., Zheng, Y.-P., Zhang, L.-S., et al. (2011). Peripheral blood monocyte-expressed ANXA2 gene is involved in pathogenesis of osteoporosis in humans. Mol. Cell. Proteomics 10:M111.011700. doi: 10.1074/mcp.M111.011700
Dubois, P. C., Trynka, G., Franke, L., Hunt, K. A., Romanos, J., Curtotti, A., et al. (2010). Multiple common variants for celiac disease influencing immune gene expression. Nat. Genet. 42, 295–302. doi: 10.1038/ng.543
Estrada, K., Styrkarsdottir, U., Evangelou, E., Hsu, Y.-H., Duncan, E. L., Ntzani, E. E., et al. (2012). Genome-wide meta-analysis identifies 56 bone mineral density loci and reveals 14 loci associated with risk of fracture. Nat. Genet. 44, 491–501. doi: 10.1038/ng.2249
Farber, C. R. (2012). Systems genetics: a novel approach to dissect the genetic basis of osteoporosis,”. Curr. Osteopor. Rep. 10, 228–235. doi: 10.1007/s11914-012-0112-5
Farber, C. R., and Lusis, A. J. (2008). Integrating global gene expression analysis and genetics. Adv. Genet. 60, 571–601. doi: 10.1016/s0065-2660(07)00420-8
Fehrmann, R. S., Jansen, R. C., Veldink, J. H., Westra, H.-J., Arends, D., Bonder, M. J., et al. (2011). Trans-eQTLs reveal that independent genetic variants associated with a complex phenotype converge on intermediate genes, with a major role for the HLA. PLoS Genet. 7:e1002197. doi: 10.1371/journal.pgen.1002197
Geissmann, F., Manz, M. G., Jung, S., Sieweke, M. H., Merad, M., and Ley, K. (2010). Development of monocytes, macrophages, and dendritic cells. Science 327, 656–661. doi: 10.1126/science.1178331
Glüer, C. C., Eastell, R., Reid, D. M., Felsenberg, D., Roux, C., Barkmann, R., et al. (2004). Association of five quantitative ultrasound devices and bone densitometry with osteoporotic vertebral fractures in a population-based sample: the OPUS Study. J. Bone Min. Res. 19, 782–793. doi: 10.1359/jbmr.040304
Gonnelli, S., Cepollaro, C., Gennari, L., Montagnani, A., Caffarelli, C., Merlotti, D., et al. (2005). Quantitative ultrasound and dual-energy X-ray absorptiometry in the prediction of fragility fracture in men. Osteop. Int. 16, 963–968. doi: 10.1007/s00198-004-1771-6
Grundberg, E., Kwan, T., Ge, B., Lam, K. C., Koka, V., Kindmark, A., et al. (2009). Population genomics in a disease targeted primary cell model. Genome Res. 19, 1942–1952. doi: 10.1101/gr.095224.109
Grundberg, E., Small, K. S., Hedman, ÅK., Nica, A. C., Buil, A., Keildson, S., et al. (2012). Mapping cis-and trans-regulatory effects across multiple tissues in twins. Nat. Genet. 44, 1084–1089. doi: 10.1038/ng.2394
Hu, X., Ji, X., Yang, M., Fan, S., Wang, J., Lu, M., et al. (2018). Cdc42 is essential for both articular cartilage degeneration and subchondral bone deterioration in experimental osteoarthritis. J. Bone Min. Res. 33, 945–958. doi: 10.1002/jbmr.3380
Innocenti, F., Cooper, G. M., Stanaway, I. B., Gamazon, E. R., Smith, J. D., Mirkov, S., et al. (2011). Identification, replication, and functional fine-mapping of expression quantitative trait loci in primary human liver tissue. PLoS Genet. 7:e1002078. doi: 10.1371/journal.pgen.1002078
Ito, Y., Teitelbaum, S. L., Zou, W., Zheng, Y., Johnson, J. F., Chappel, J., et al. (2010). Cdc42 regulates bone modeling and remodeling in mice by modulating RANKL/M-CSF signaling and osteoclast polarization. J. Clin. Invest. 120, 1981–1993. doi: 10.1172/JCI39650
Kemp, J. P., Morris, J. A., Medina-Gomez, C., Forgetta, V., Warrington, N. M., Youlten, S. E., et al. (2017). Identification of 153 new loci associated with heel bone mineral density and functional involvement of GPC6 in osteoporosis. Nat. Genet. 49, 1468–1475. doi: 10.1038/ng.3949
Kim, S. K. (2018). Identification of 613 new loci associated with heel bone mineral density and a polygenic risk score for bone mineral density, osteoporosis and fracture. PLoS One 13:e0200785. doi: 10.1371/journal.pone.0213962
Kwan, T., Grundberg, E., Koka, V., Ge, B., Lam, K. C., Dias, C., et al. (2009). Tissue effect on genetic control of transcript isoform variation. PLoS Genet. 5:e1000608. doi: 10.1371/journal.pgen.1000608
Lee, M., Czerwinski, S., Choh, A., Demerath, E., Sun, S., Chumlea, W., et al. (2006). Unique and common genetic effects between bone mineral density and calcaneal quantitative ultrasound measures: the fels longitudinal study. Osteopor. Int. 17, 865–871. doi: 10.1007/s00198-006-0075-4
Liu, Y.-Z., Dvornyk, V., Lu, Y., Shen, H., Lappe, J. M., Recker, R. R., et al. (2005). A novel pathophysiological mechanism for osteoporosis suggested by an in vivo gene expression study of circulating monocytes. J. Biol. Chem. 280, 29011–29016. doi: 10.1074/jbc.M501164200
Lynch, M., and Walsh, B. (1998). Genetics and Analysis of Quantitative Traits. Sunderland, MA: Sinauer.
Manabe, N., Kawaguchi, H., Chikuda, H., Miyaura, C., Inada, M., Nagai, R., et al. (2001). Connection between B lymphocyte and osteoclast differentiation pathways. J. Immunol. 167, 2625–2631. doi: 10.4049/jimmunol.167.5.2625
Moayyeri, A., Hsu, Y.-H., Karasik, D., Estrada, K., Xiao, S.-M., Nielson, C., et al. (2014). Genetic determinants of heel bone properties: genome-wide association meta-analysis and replication in the GEFOS/GENOMOS consortium. Hum. Mol. Genet. 23, 3054–3068. doi: 10.1093/hmg/ddt675
Nattiv, A. (2000). Stress fractures and bone health in track and field athletes. J. Sci. Med. Sport 3, 268–279. doi: 10.1016/S1440-2440(00)80036-5
Nicolae, D. L., Gamazon, E., Zhang, W., Duan, S., Dolan, M. E., and Cox, N. J. (2010). Trait-associated SNPs are more likely to be eQTLs: annotation to enhance discovery from GWAS. PLoS Genet. 6:e1000888. doi: 10.1371/journal.pgen.1000888
Peng, J., and Zhao, T. (2020). Reduction in TOM1 expression exacerbates Alzheimer’s disease. Proc. Natl. Acad. Sci. U.S.A. 117, 3915–3916. doi: 10.1073/pnas.1917589117
Schadt, E. E. (2009). Molecular networks as sensors and drivers of common human diseases. Nature 461, 218–223. doi: 10.1038/nature08454
Smith, G. D., and Ebrahim, S. (2008). “Mendelian randomization: genetic variants as instruments for strengthening causal inference in observational studies. in Biosocial Surveys,” in National Research Council (US) Committee on Advances in Collecting and Utilizing Biological Indicators and Genetic Information in Social Science Surveys, eds M. Weinstein, J. W. Vaupel, and K. W. Wachter (Washington, DC: National Academies Press), 336–366.
Tarwadi, T., Jazayeri, J. A., Pambudi, S., Arbianto, A. D., Rachmawati, H., Kartasasmita, R. E., et al. (2020). In-silico molecular interaction of short synthetic lipopeptide/importin-alpha and in-vitro evaluation of transgene expression mediated by liposome-based gene carrier. Curr. Gene Ther. 20, 383–394. doi: 10.2174/1566523220666201005104224
Tianyi, Z., Yang, H., Valsdottir, L. R., Tianyi, Z., and Jiajie, P. (2021). Identifying drug–target interactions based on graph convolutional network and deep neural network. Brief. Bioinform. 22, 2141–2150. doi: 10.1093/bib/bbaa044
Wang, C., Zheng, H., He, J., Zhang, H., Yue, H., Hu, W., et al. (2015). Genetic polymorphisms in the mevalonate pathway affect the therapeutic response to alendronate treatment in postmenopausal Chinese women with low bone mineral density. Pharmacogenom. J. 15, 158–164. doi: 10.1038/tpj.2014.52
Westra, H.-J., Peters, M. J., Esko, T., Yaghootkar, H., Schurmann, C., Kettunen, J., et al. (2013). Systematic identification of trans eQTLs as putative drivers of known disease associations. Nat. Genet. 45, 1238–1243. doi: 10.1038/ng.2756
Wu, Q., Nasoz, F., Jung, J., Bhattarai, B., Han, M. V., Greenes, R. A., et al. (2021). Machine learning approaches for the prediction of bone mineral density by using genomic and phenotypic data of 5130 older men. Sci. Rep. 11, 4482. doi: 10.1038/s41598-021-83828-3
Zhang, H., Sol-Church, K., Rydbeck, H., Stabley, D., Spotila, L., and Devoto, M. (2009). High resolution linkage and linkage disequilibrium analyses of chromosome 1p36 SNPs identify new positional candidate genes for low bone mineral density. Osteopor. Int. 20, 341–346. doi: 10.1007/s00198-008-0668-1
Zhao, T., Hu, Y., and Cheng, L. (2020a). Deep-DRM: a computational method for identifying disease-related metabolites based on graph deep learning approaches. Brief. Bioinform. 22:bbaa212. doi: 10.1093/bib/bbaa212
Zhao, T., Hu, Y., Peng, J., and Cheng, L. (2020b). DeepLGP: a novel deep learning method for prioritizing lncRNA target genes. Bioinformatics 36, 4466–4472. doi: 10.1093/bioinformatics/btaa428
Zhao, T., Hu, Y., Zang, T., and Cheng, L. (2020c). MRTFB regulates the expression of NOMO1 in colon. Proc. Natl. Acad. Sci. 117, 7568–7569. doi: 10.1073/pnas.2000499117
Zhao, T., Hu, Y., Zang, T., and Wang, Y. (2019). Integrate GWAS, eQTL, and mQTL data to identify Alzheimer’s disease-related genes. Front. Genet. 10:1021. doi: 10.3389/fgene.2019.01021
Zhao, T., Liu, J., Zeng, X., Wang, W., Li, S., Zang, T., et al. (2021a). Prediction and collection of protein–metabolite interactions. Brief. Bioinform. 2021:bbab014. doi: 10.1093/bib/bbab014
Zhao, T., Lyu, S., Lu, G., Juan, L., Zeng, X., Wei, Z., et al. (2021b). SC2disease: a manually curated database of single-cell transcriptome for human diseases. Nucleic Acids Res. 49, D1413–D1419. doi: 10.1093/nar/gkaa838
Zheng, H. F., Forgetta, V., Hsu, Y. H., Estrada, K., Rosello-Diez, A., Leo, P. J., et al. (2015). Whole-genome sequencing identifies EN1 as a determinant of bone density and fracture. Nature 526, 112–117. doi: 10.1038/nature14878
Zhu, Z., Zhang, F., Hu, H., Bakshi, A., Robinson, M. R., Powell, J. E., et al. (2016). Integration of summary data from GWAS and eQTL studies predicts complex trait gene targets. Nat. Genet. 48, 481–487. doi: 10.1038/ng.3538
Keywords: BMD, GWAS, eQTL, causative gene, disease susceptibility, SMR
Citation: Liu Y, Jin G, Wang X, Dong Y and Ding F (2021) Identification of New Genes and Loci Associated With Bone Mineral Density Based on Mendelian Randomization. Front. Genet. 12:728563. doi: 10.3389/fgene.2021.728563
Received: 21 June 2021; Accepted: 02 August 2021;
Published: 08 September 2021.
Edited by:
Lei Deng, Central South University, ChinaReviewed by:
Hui Ding, University of Electronic Science and Technology of China, ChinaCopyright © 2021 Liu, Jin, Wang, Dong and Ding. This is an open-access article distributed under the terms of the Creative Commons Attribution License (CC BY). The use, distribution or reproduction in other forums is permitted, provided the original author(s) and the copyright owner(s) are credited and that the original publication in this journal is cited, in accordance with accepted academic practice. No use, distribution or reproduction is permitted which does not comply with these terms.
*Correspondence: Fupeng Ding, bGl1eWlqQGpsdS5lZHUuY24=
Disclaimer: All claims expressed in this article are solely those of the authors and do not necessarily represent those of their affiliated organizations, or those of the publisher, the editors and the reviewers. Any product that may be evaluated in this article or claim that may be made by its manufacturer is not guaranteed or endorsed by the publisher.
Research integrity at Frontiers
Learn more about the work of our research integrity team to safeguard the quality of each article we publish.