 Ruoyu Yang1†‡
 Feng Jin1‡
 Liyan Wang1Xunzhang Shen1,2Qi Guo1Haihan Song3Jingyun Hu3Qiang Zhao4*Jian Wan5*
 Ming Cai6*†
- 1College of Rehabilitation Sciences, Shanghai University of Medicine and Health Sciences, Shanghai, China
- 2Department of Talent Identification and Development, Shanghai Research Institute of Sports Science (Shanghai Anti-Doping Center), Shanghai, China
- 3Central Lab, Shanghai Pudong New Area People’s Hospital, Shanghai, China
- 4National Center for Gene Research, CAS Center for Excellence in Molecular Plant Sciences, Chinese Academy of Sciences, Shanghai, China
- 5Department of Emergency and Critical Care Medicine, Shanghai Pudong New Area People’s Hospital, Shanghai, China
- 6Shanghai University of Medicine and Health Sciences Affiliated Zhoupu Hospital, Shanghai, China
Objective: The manuscript aims to explore the relationship between power performance and SNPs of Chinese elite athletes and to create polygenic models.
Methods: One hundred three Chinese elite athletes were divided into the power group (n = 60) and endurance group (n = 43) by their sports event. Best standing long jump (SLJ) and standing vertical jump (SVJ) were collected. Twenty SNPs were genotyped by SNaPshot. Genotype distribution and allele frequency were compared between groups. Additional genotype data of 125 Chinese elite athletes were used to verify the screened SNPs. Predictive and identifying models were established by multivariate logistic regression analysis.
Results: ACTN3 (rs1815739), ADRB3 (rs4994), CNTFR (rs2070802), and PPARGC1A (rs8192678) were significantly different in genotype distribution or allele frequency between groups (p < 0.05). The predictive model consisted of ACTN3 (rs1815739), ADRB3 (rs4994), and PPARGC1A (rs8192678), the area under curve (AUC) of which was 0.736. The identifying model consisted of body mass index (BMI), standing vertical jump (SVJ), ACTN3, ADRB3, and PPARGC1A, the area under curve (AUC) of which was 0.854. Based on the two models, nomograms were created to visualize the results.
Conclusion: Two models can be used for talent identification in Chinese athletes, among which the predictive model can be used in adolescent athletes to predict development potential of power performance and the identifying one can be used in elite athletes to evaluate power athletic status. These can be applied quickly and visually by using nomograms. When the score is more than the 130 or 148 cutoff, it suggests that the athlete has a good development potential or a high level for power performance.
Introduction
The physical performance and athletic capacity of elite athletes, such as endurance, power, speed, flexibility, and sensitivity, are influenced by many factors, among which genetic factors are important (Puthucheary et al., 2011; Ahmetov et al., 2016; Peplonska et al., 2017). It is a major task and research direction to use genetic factors to predict the development potential of physical performance and athletic capacity in adolescent athletes and to evaluate and identify the level of elite athletes (Breitbach et al., 2014; Webborn et al., 2015; Pickering et al., 2019).
In physical performance and athletic capacity, power performance has a relatively high heritability (Maciejewska-Skrendo et al., 2019), which is particularly important for the power-orient sports and critical in talent identification (Yang et al., 2017). It has been reported that the estimated heritability of muscle strength and mass varies from approximately 30–80% with large differences of muscle groups, contraction velocities, and muscle lengths (Peeters et al., 2009). Therefore, these genetic variants may contribute to elite athletic performance such as power. Using these genetic variants, it is possible to identify future elite athletes. Single nucleotide polymorphism (SNP) is a form of genetic variants, which is often used to study and investigate the genetic factors of physical performance (Sarzynski et al., 2016). SNP mainly refers to the DNA sequence polymorphism caused by single nucleotide variation at the genomic level. It is one of the most common human heritable variations, accounting for more than 90% of all known polymorphisms. SNPs exist widely in the human genome, with an average of one in every 300 base pairs. It is estimated that the total number of SNPs can reach 3 million or more. SNP can result from the transition or transversion of a single base, or from the insertion or deletion of a base (Brookes, 1999). For example, a SNP of R577X (rs1815739) in the ACTN3 gene modifies the attainment of elite power-oriented athletic performance status (Yang et al., 2017; Tharabenjasin et al., 2019). In this SNP, common C-to-T base substitution results in the transformation of an arginine base (R) to a premature stop codon (X). X allele homozygotes are deficient in the protein encoded by ACTN3, α-actinin-3, which is expressed exclusively in fast-twitch muscle fibers. As a result, XX genotypes tend to have lower proportions of fast-twitch muscle fibers (Vincent et al., 2007), and decreased power performance, because fast-twitch muscle fiber is an important component of power-oriented performance (Pickering et al., 2019). In fact, physical performance may be influenced by hundreds of related SNPs (Ben-Zaken et al., 2015; Grealy et al., 2015). Previous polygenic studies did not differentiate the role of SNPs in prediction and identification; it is therefore hard to be applied in talent identification (Ruiz et al., 2010; Buxens et al., 2011).
Based on the above, we recruited Chinese elite athletes to explore the relationship between polygenic profiles and elite power performance. We then attempted to establish the predictive and identifying models, based on which nomograms were also created for talent identification in adolescent and elite athletes.
Material and Methods
Ethics Approval
This study was conducted on the basis of the Declaration of Helsinki and approved by the ethics committee of the School of Life Sciences Fudan University (Shanghai, China). Before the study, written informed consent was obtained from all participants.
Participants
A total of 103 elite Chinese athletes of Han origin (age = 24.3 ± 3.2 years, male = 24.5 ± 3.5 years, female = 24.1 ± 2.8 years; height = 179.3 ± 9.3 cm, male = 183.3 ± 7.6 cm, female = 172.6 ± 7.8 cm; weight = 75.8 ± 15.4 kg, male = 81.2 ± 15.2 kg, female = 66.8 ± 11.2 kg; body mass index (BMI) = 23.4 ± 3.5 kg/m2, male = 24.1 ± 3.7 kg/m2, female = 22.4 ± 3.0 kg/m2) were recruited and categorized into the power group (n = 60) and endurance group (n = 43) as determined by the distance, duration, and energy requirements of their sports event. Athletes in the power group included 100-m and 200-m sprinters (n = 27), jumpers (n = 14), shot putters (n = 7), discus throwers (n = 4), javelin throwers (n = 2), weightlifters (n = 2), and 500-m track sprint cyclists (n = 4), while the endurance group included 5,000-m runners (n = 19), 10,000-m runners (n = 20), and marathon runners (n = 4) whose events demand predominantly aerobic energy production. These elite athletes were all national-master and international-master athletes with certification by national specialized departments of China.
An additional 125 elite athletes were selected to repeat significant SNPs and validate models crossly. These athletes were also from the high-level sports team in Shanghai. Seventy-three power athletes (age = 21.2 ± 1.9 years, male = 21.3 ± 1.8 years, female = 21.1 ± 2.1 years; body mass index (BMI) = 20.9 ± 1.5 kg/m2, male = 21.3 ± 1.3 kg/m2, female = 20.1 ± 1.5 kg/m2) were from sprinting, throwing and jumping events and 52 endurance athletes (age = 20.1 ± 1.5 years, male = 20.2 ± 1.7 years, female = 20.0 ± 1.4 years; body mass index (BMI) = 19.7 ± 1.2 kg/m2, male = 20.1 ± 1.3 kg/m2, female = 19.2 ± 1.0 kg/m2) were from middle and long distance running, who were also all Chinese Han origin.
Standing Long Jump and Standing Vertical Jump Data Collection
The athletes’ best standing long jump (SLJ) and standing vertical jump (SVJ) results were collected retrospectively in the Oriental Land Training Base (Shanghai, China). All tests were conducted with a standardized protocol employed at the training base. Specifically, the SLJ was assessed on the test pad special for standing long jump. Subjects started the test with their toes behind the test line; the distance from the rearmost heel strike to the starting line was used for measurement. Three trials were allowed for each subject to achieve their maximal jump performance. The SVJ results were recorded by a standardized electronic vertical jump tester (Jianmin, Beijing, China). Subjects stood on the test board with the location marked and attempted to reach the maximum height vertically, with a landing point within 10 cm from the starting point. The examiner recorded the height displayed from the electronic screen, and the highest two of the three jumps were used. Before all testing, subjects completed a supervised warm-up of running and dynamic stretching, and more specific, submaximal jump warm-up protocol (Ahmetov et al., 2016).
Selection of Genetic Polymorphisms
Some reviews revealed that more than 40 SNPs (Ahmetov and Fedotovskaya, 2015) and 69 SNPs (Naureen et al., 2020) are associated with power performance. These reports of SNPs are generally in European ancestry populations and fewer in the Chinese Han population. On the basis of these SNPs, we retained the ones with frequency distribution differences reported in the general population or disease population of Chinese Han nationality and removed the ones without frequency distribution differences or unreported in Chinese Han population as candidate gene markers in this study. Finally, 20 gene polymorphisms (within 17 different genes) were considered to be associated with physical performance and exercise-related phenotypes because the HIF1A (rs28708675) genotype didn’t have a frequency distribution in the power or endurance athletes (all subjects were AA genotype). Sixteen genes and 19 polymorphisms were analyzed and listed in Table 1.
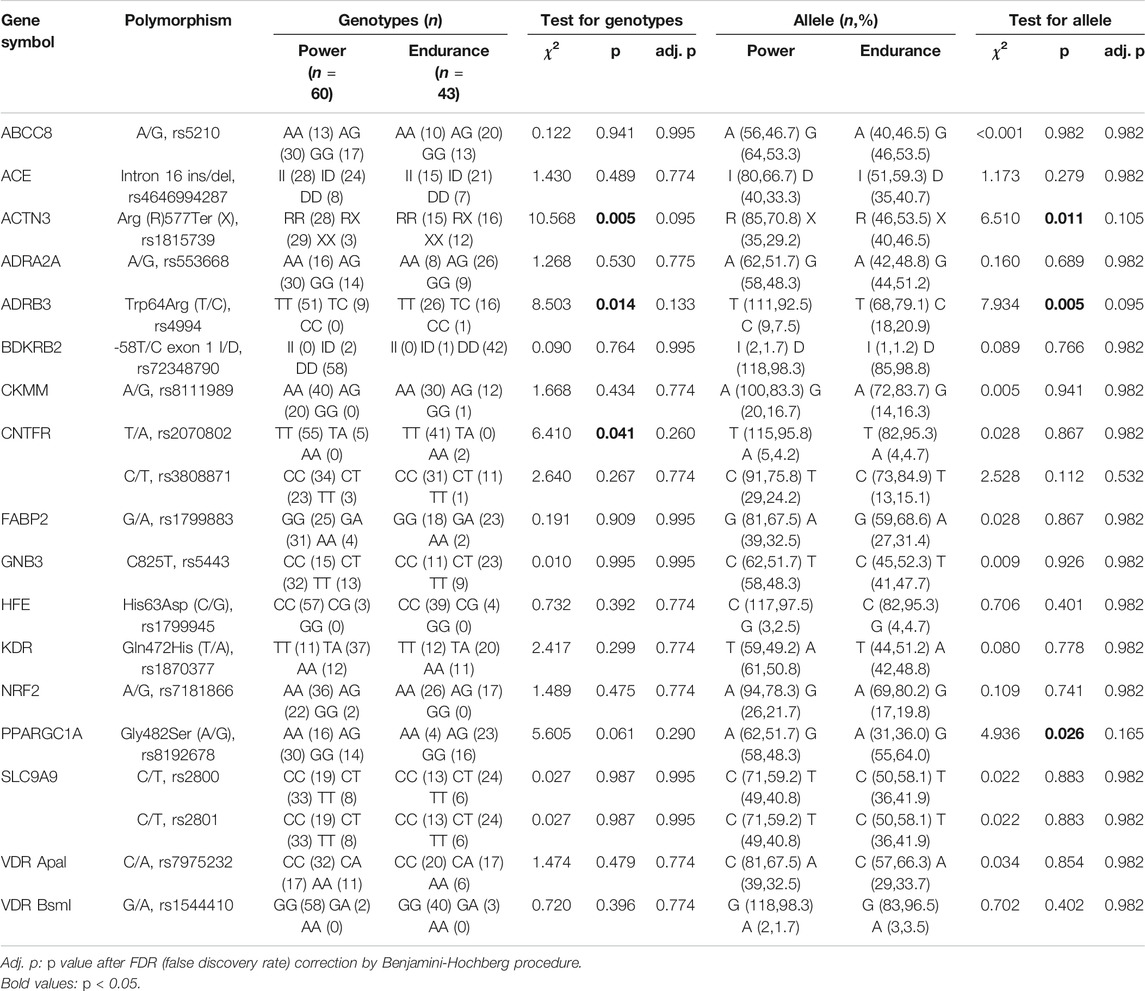
TABLE 1. Genotypes and allele frequencies in Chinese elite power and endurance athletes.
Genotyping
Saliva samples were collected via the bio-sample collection kit (Applied Halo Biomat Tech, Suzhou, China) and stored in a −20°C freezer until further use. DNA was extracted from saliva by QIAGEN silica gel adsorption kit (Qiagen Inc., Valencia, CA, United States). Genotyping was conducted by multiplex SNaPshot technology using an ABI fluorescence-based assay allelic discrimination method (Applied Biosystems, Foster City, CA, United States) as described previously (Ahmetov et al., 2016). Briefly, multiplexed PCR and multiplexed single-base extension reactions were first conducted, followed by capillary electrophoresis. PCR multiplexes were conducted in a 10-µl reaction, including 5 µl of SNaPshot Multiplex Kit solution (Applied Biosystems), 2 µl of purified PCR product, 1 µl of the extension primer, and 2 µl of high-purity water. The products of the SNaPshot were processed with ABI3730XL (Applied Biosystems) and data from 20 gene loci variants were analyzed with Gene Mapper Analysis Software, version 4.1 (Applied Biosystems). Genotypes were assessed independently by two investigators blinded to the study. As a quality control measure, 10% of randomly selected DNA samples were analyzed at least twice, and the results were 100% concordant.
Data Analysis
Chi-Squared (
Results
Determination of Single-Nucleotide Polymorphisms Related to Power Performance
All the gene variants were in Hardy–Weinberg equilibrium (p > 0.05). There were significant differences in genotype distribution or allele frequency of four SNPs: ACTN3 (rs1815739), ADRB3 (rs4994), CNTFR (rs2070802), and PPARGC1A (rs8192678) (p < 0.05); however, there was no significant difference in all SNPs with the correction of multiple comparison test based on the method of Benjamini and Hochberg (Benjamini and Hochberg, 1995) (adj. p > 0.05) (Table 1). To exclude false positives, the screened SNPs would be repeatedly verified by using additional data.
Validating Candidate Single-Nucleotide Polymorphisms
As external validation data set, the genotype data of 125 elite athletes were used to verify the candidate SNPs: ACTN3 (rs1815739), ADRB3 (rs4994), CNTFR (rs2070802), and PPARGC1A (rs8192678). Figure 1 showed the results of genotype distribution and allele frequencies of the candidate SNPs in the validation. The genotype distribution was significant in ACTN3 (rs1815739) [Power: RR (37) RX (26) XX (10); Endurance: RR (14) RX (24) XX (14),
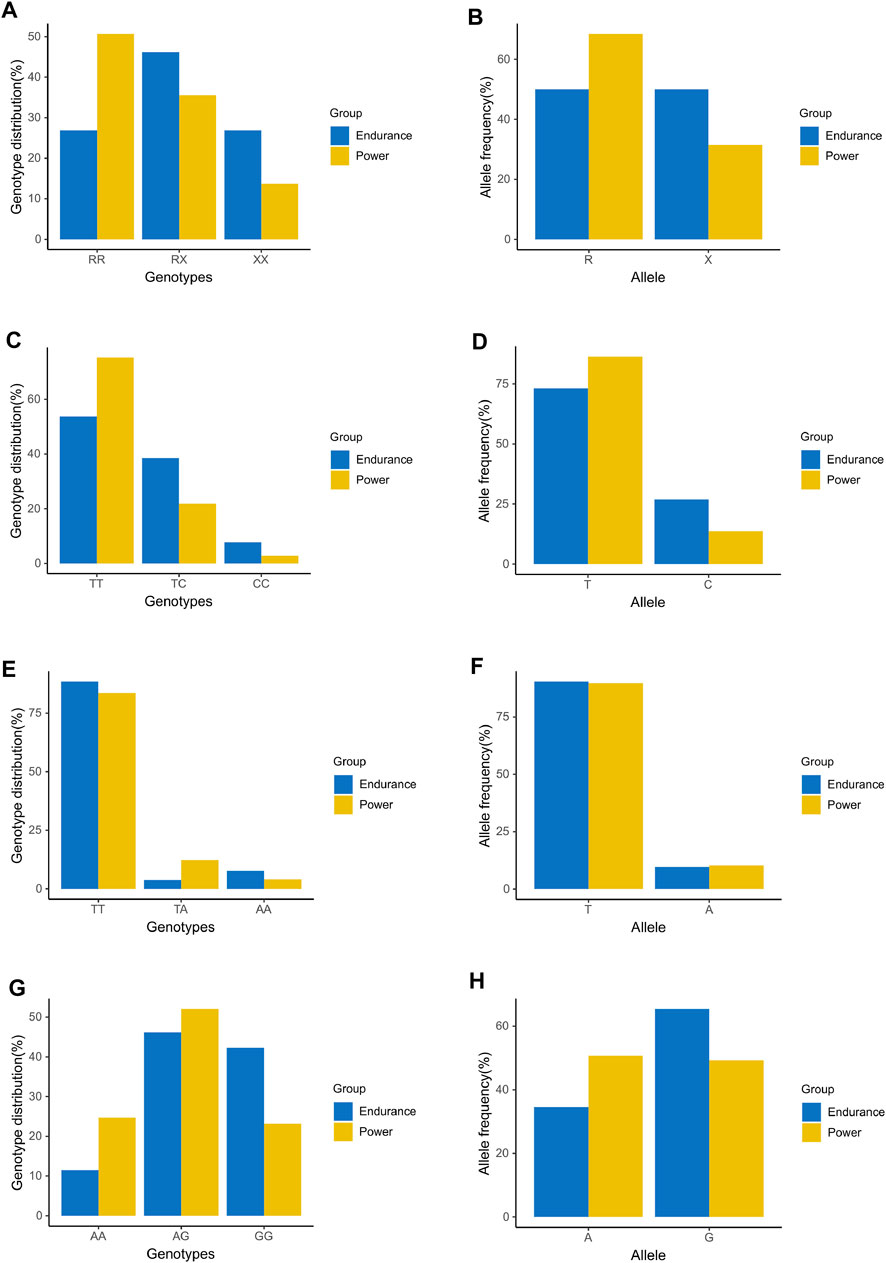
FIGURE 1. Comparison analysis of genotype distribution and allele frequencies between additional power and endurance athletes in candidate SNPs for validation. (A) Genotype distribution of ACTN3 (rs1815739). (B) Allele frequency of ACTN3 (rs1815739). (C) Genotype distribution of ADRB3 (rs4994). (D) Allele frequency of ADRB3 (rs4994). (E) Genotype distribution of CNTFR (rs2070802). (F) Allele frequency of CNTFR (rs2070802). (G) Genotype distribution of PPARGC1A (rs8192678). (H) Allele frequency of PPARGC1A (rs8192678).
Polygenic Models Predict and Identify Power Performance
All variables including candidate SNPs were used for univariate logistic regression in all participants (Table 2). SNPs and phenotypes including gender, age, BMI, SLJ, and SVJ were used for multivariate logistic regression analysis with five models (Table 3). According to the fitted and adjusted effect of the models and the different purposes of talent identification in athletes, model 1 (only three SNPs), model 4 (BMI, SLJ, and three SNPs), and model 5 (BMI, SVJ, and three SNPs) were determined (Table 3). The predictive model contained only three SNPs of ACTN3 (rs1815739), ADRB3 (rs4994), and PPARGC1A (rs8192678), while the identifying model had both three SNPs and phenotypic index.
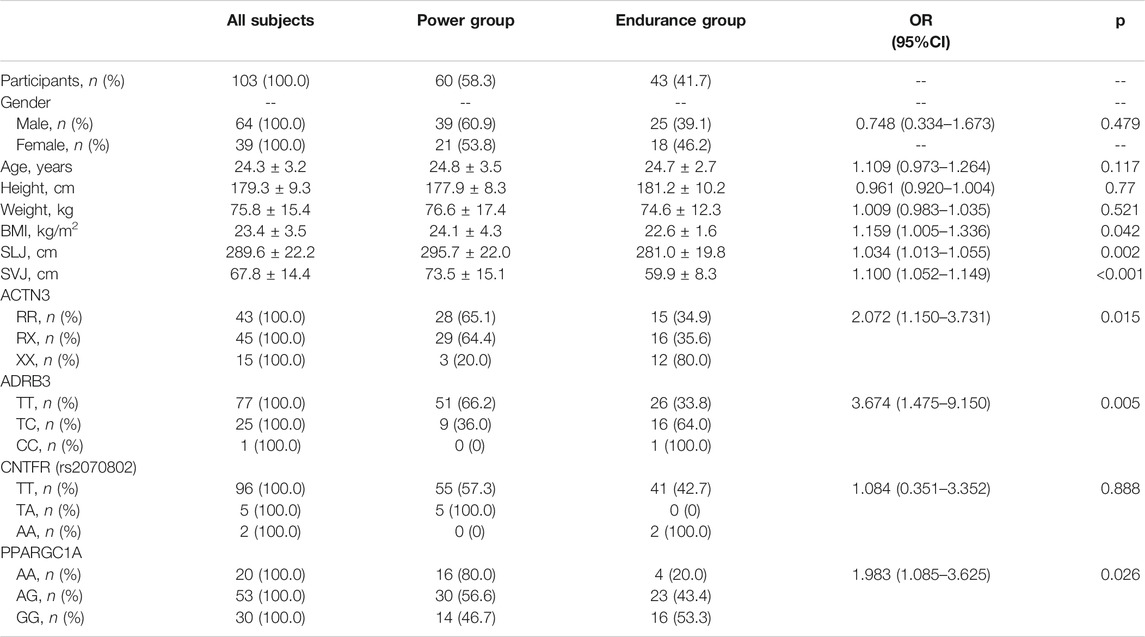
TABLE 2. Univariate logistic regression analysis for power performance.
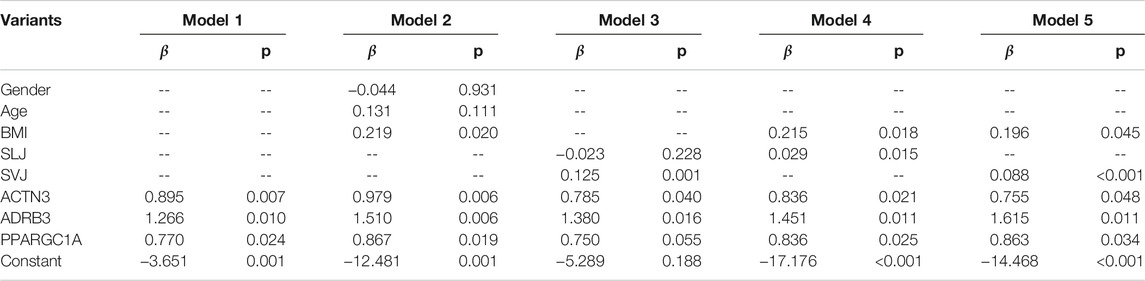
TABLE 3. Multivariate logistic regression analysis for power performance.
On multivariate analysis, the predictive model consisted of ACTN3 (rs1815739) (OR = 2.448, 95% CI: 1.277–4.693), ADRB3 (rs4994) (OR = 3.546, 95% CI: 1.360–9.245), and PPARGC1A (rs8192678) (OR = 2.159, 95% CI: 1.109–4.207) (Figure 2A). The predictive model based on the three SNPs fitted the data well (Hosmer–Lemeshow test p = 0.873) with a bootstrap-corrected AUC of 0.736 (95% CI: 0.637–0.834) (Figure 2B).
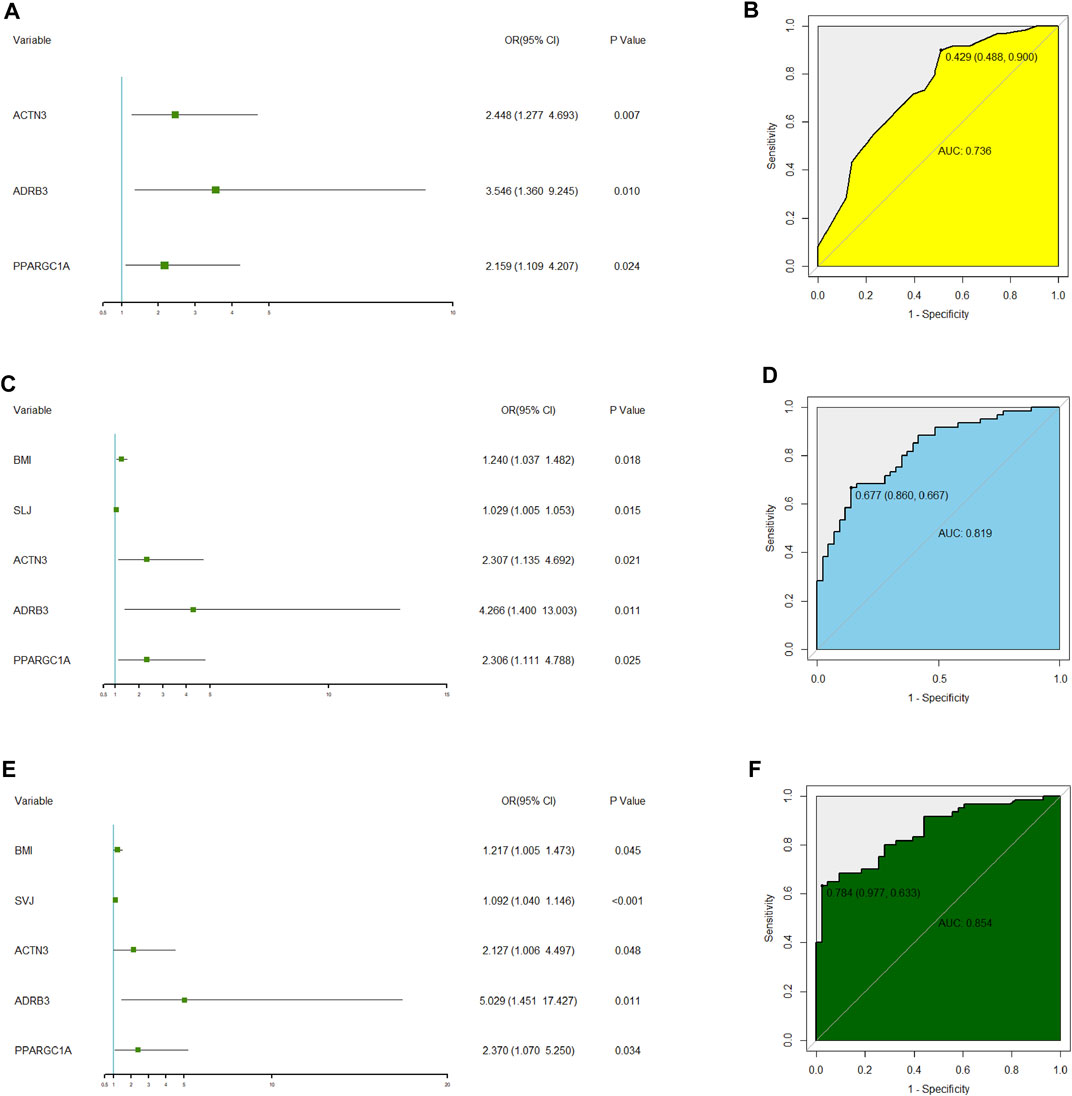
FIGURE 2. Multivariate logistic regression analysis of three polygenic models related to elite power performance and their ROC analysis. (A) Forest plot of multivariate logistic regression analysis for the model1 only including three SNPs. (B) Receiver operating characteristic (ROC) curve analysis to summarize the ability of the model1 to predict potential elite power performance from elite endurance performance. AUC: area under the curve. (C) Forest plot of multivariate logistic regression analysis for the model 4 including three SNPs, BMI and SLJ. (D) Receiver operating characteristic (ROC) curve analysis to summarize the ability of the model4 to identify elite power performance from elite endurance performance. AUC: area under the curve. (E) Forest plot of multivariate logistic regression analysis for the model 5 including three SNPs, BMI and SVJ. (F) Receiver operating characteristic (ROC) curve analysis to summarize the ability of the model 5 to identify elite power performance from elite endurance performance. AUC: area under the curve.
After multiple regression analysis by using SNPs and other phenotypes, two identifying models were obtained (Figure 2C and Figure 2E). The difference between the two models was that one included standing long jump (SLJ) index and the other included standing vertical jump (SVJ) index. Both models had fine goodness of fit (SLJ: Hosmer-Lemeshow test p = 0.627; SVJ: Hosmer-Lemeshow test p = 0.462). Internally bootstrap-corrected ROC analysis of the two models showed that the AUC value of the model with SVJ (AUC = 0.854, 95% CI: 0.784–0.925, Figure 2F) was higher than that of the model with SLJ (AUC = 0.819, 95% CI: 0.740–0.899, Figure 2D). Therefore, the model including SVJ was selected as the polygenic identifying model of power performance.
To verify the external reliability of the models, genotyping data, BMI, and SVJ of another 125 elite athletes were used to crossly validate the predictive and identifying models. After ROC analysis, the AUC of predictive and identifying models were 0.701 (95% CI: 0.609–0.794) and 0.766 (95% CI: 0.683–0.849) (Figure 3). The AUC values of two models were both greater than 0.7, which indicated that the two models had quite good prediction and recognition ability for external data.
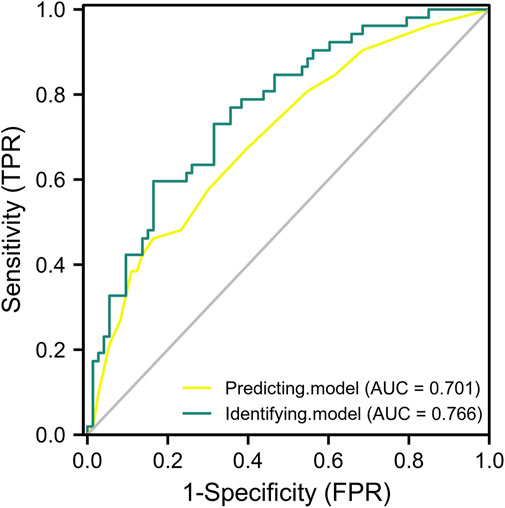
FIGURE 3. The ROC analysis of predictive and identifying models for cross validation. The yellow curve: the ROC curve of predictive model only including three SNPs. The green curve: the ROC curve of identifying model including three SNPs, BMI, and SVJ.
Nomograms of Predictive and Identifying Polygenic Models for Power Performance
Factors in Figure 2A, including three SNPs of ACTN3 (rs1815739), ADRB3 (rs4994), and PPARGC1A (rs8192678), were used to create an estimation nomogram for predicting power performance. In the receiver operating characteristic (ROC) curve (Figure 2B), the threshold value was 0.429, according to which the cutoff score could be determined in the Nomogram (Figure 4A). Furthermore, a calibration curve graphically showed a good agreement on power performance between nomogram predicting and athletic status (Figure 4B).
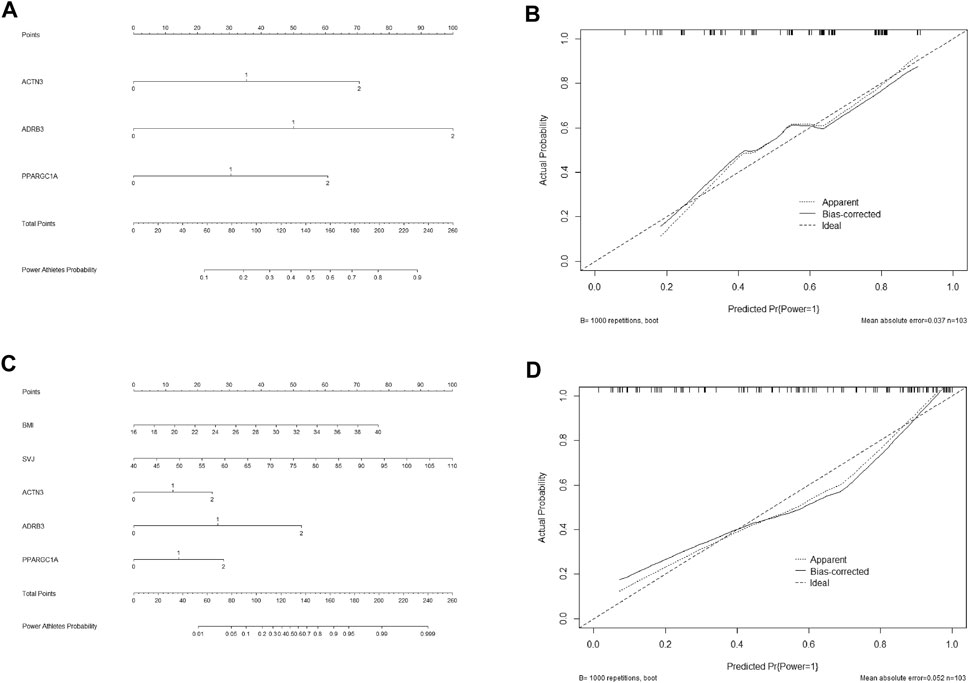
FIGURE 4. Nomograms of predictive and identifying models for elite power performance and their calibration curves. Genotype value of three SNPs in nomograms: ACTN3, RR = 2 RX = 1 XX = 0; ADRB3, TT = 2 TC = 1 CC = 0; PPARGC1A, AA = 2 AG = 1 GG = 0. (A) Nomogram of predictive model (model1 only including three SNPs) for elite power performance. (B) Calibration curve of predictive model. (C) Nomogram of identifying model (model 5 including three SNPs, BMI and SVJ) for elite power performance. (D) Calibration curve of identifying model.
The identifying model containing the three SNPs, BMI, and SVJ (Figure 2E), which was also used to develop a nomogram for identifying power performance. The threshold value of ROC curve (Figure 2F) was 0.784, according to which the cutoff score could also be determined in the Nomogram of identifying model (Figure 4C) according to threshold value that was 0.784. The calibration curve also showed a good agreement between nomogram identifying and athletic status (Figure 4D).
Scores of Two Nomograms
An ROC curve is a plot of the sensitivity versus 1-specificity of a diagnostic test. The different points on the curve correspond to the different cutoff value used to determine whether the results of the test are positive. An ROC curve can be considered the average value of the sensitivity for a test over all possible values of specificity or vice versa (Mandrekar, 2010).
The optimal cutoff value of two nomogram scores were determined to be 130 and 148 by ROC threshold values (0.429 and 0.784) for predicting and identifying power status. The specificity, sensitivity, positive predictive value, negative predictive value, positive likelihood ratio, and negative likelihood ratio were 48.8%, 90.0%, 71.1%, 77.8%, 1.76, and 0.20 in the predictive model, and 97.7%, 63.3%, 97.4%, 65.6%, 27.23, and 0.38 in the identifying model, respectively (Table 4).

TABLE 4. Accuracy of two nomograms for predicting and identifying power status.
Discussion
The research on the relationship between gene variants and physical performance started from a single gene and a single SNP. With the expansion of SNP research on candidate genes related to physical performance, an increasing number of SNPs was put into the candidate gene pool. At regular intervals, researchers summarize the progress of such research and new genes (Macarthur and North, 2005; Hagberg et al., 2011; Roth et al., 2012; Perusse et al., 2013; Ahmetov et al., 2016; Sarzynski et al., 2016). However, with the deepening of research, researchers found that single SNP has an insignificant impact on certain physical performance or athletic status. For example, the contribution of ACTN3 R577X polymorphism, which has been studied the most, was estimated to be only 2.5% (Moran et al., 2007). It suggested that it was inadequate to rely on the variant of a single SNP to reflect the impact on a certain performance. The probability of becoming an elite athlete is based on having a set of alleles related to physical performance (Ahmetov et al., 2009; Ruiz et al., 2009). Therefore, it is more appropriate to use the variants of multiple genes or SNPs to reflect the impact on a certain physical performance. Starting from the research of single candidate genes, this study screened several SNPs that may be related to power performance through statistical tests. On this basis, polygenic models were established to reflect the impact on power performance by using multivariate logistic regression. It is more effective to quantify the effect of multiple genes through mathematical methods than that of a single gene alone. Many researchers also use this method to explore the effect of polygenic profiles on physical performance and athletic status (Ruiz et al., 2010; Buxens et al., 2011; Massidda et al., 2014). However, there were some potential problems in these studies, such as the use of the total genotype score (TGS) to reflect the polygenic profiles, but the weight of each SNP in the TGS was equal, without considering the difference of contribution. Additionally, the operability of the predictive/identifying model was relatively poor, which was difficult to be popularized in practice. In our current study, multivariate logistic regression was used to fully consider the contribution weighting of each SNP and nomogram was used to visualize the model and improve the operability, which was more rigorous and feasible than the above-mentioned studies.
ACTN3 R577X gene polymorphism had been repeatedly proven to be associated with elite power performance in many ethnic populations. It is a SNP recognized by most researchers and scholars so far (Tharabenjasin et al., 2019). It was also proven in the East Asian population (Yang et al., 2016; Yang et al., 2017). Compared with ACTN3 R577X, ADRB3 (rs4994) and PPARGC1A (rs8192678) polymorphisms were less reported, especially in the East Asian population.
Beta-Adrenergic receptors are a subgroup of G protein-coupled receptors involved in the regulation of energy metabolism. As a member of the beta-adrenergic receptor family, the ADRB3 (adrenoceptor beta 3) gene locates at 8p11.23 region of the human genome and modulates catecholamine-induced stimulation of adenylate cyclase via the action of G proteins (Yang and Tao, 2019). It is generally believed that ADRB3 is mainly expressed in adipocytes and functions to mediate lipolysis and thermogenesis (Collins and Surwit, 2001). The levels of ADRB3 mRNA and protein in the adipose tissue of obese patients and overweight individuals are significantly decreased (Kurylowicz et al., 2015; Cao et al., 2018). Xie et al. (2020) reported that the ADRB3 (rs4994) polymorphism was associated with obesity/overweight during childhood and adolescence in the East Asian population by an evidence-based meta-analysis. They found that children and adolescents with the C allele had an increasing risk of leading to obesity and overweight (Xie et al., 2020). There are few reports on the relationship between ADRB3 (rs4994) polymorphism and elite athletic performance. Santiago et al. (2011) reported that the ADRB3 (rs4994) polymorphism was associated with elite endurance performance in Spanish male athletes. They selected 53 elite power athletes and 100 endurance athletes in Spain as the research objects, and 100 people without sports training experience as the control group. After genotyping the rs4994 locus of ADRB3 gene, they found that the ADRB3 gene was significantly different in the distribution of genotypes among the three groups. Compared with pairs, there was only a significant difference between the endurance group and control group, yet no significance between the power group and endurance group. It was concluded that ADRB3 (rs4994) polymorphism was associated with elite endurance performance (Santiago et al., 2011). Based on the results of statistical analysis, the results of this study were inconsistent with our study, but from the distribution of genotypes in the power group and endurance group, the trend of the two studies was consistent. The inconsistency of the results may be related to ethnic differences (European ancestry populations and East Asian populations) and the sample size.
PPARGC1A (peroxisome proliferator-activated receptor gamma co-activator-1-alpha) is an inducible transcription coactivator, which can participate in many life activities by promoting mitochondrial energy metabolism, such as adaptive thermogenesis, skeletal muscle fiber type conversion, glucose/fatty acid metabolism, and cardiac development (Fontecha-Barriuso et al., 2020). Some studies showed that PPARGC1A gene controls the expression of several genes encoding key enzymes involved in fatty acid oxidation and mainly regulates the induction of muscle adaptation training (Ahmetov et al., 2006). Endurance training can increase PPARGC1A mRNA expression (Franks et al., 2003). In European ancestry populations, carrying A allele was beneficial to the improvement of cardiopulmonary function (Mathai et al., 2008); however, PPARGC1A (rs8192678) polymorphism was not associated with cardiopulmonary function and VO2max in German, Dutch (Stumvoll et al., 2004), and Northern Chinese populations (He et al., 2008), indicating that the relationship between PPARGC1A (rs8192678) gene polymorphism and physical performance was not reproducible in different races and populations, and there was a large ethnic difference. Eynon et al. (2010) studied 155 Israeli athletes and found that the A allele frequency of endurance athletes was low, and GG genotype was conducive to the increase in aerobic capacity. Maciejewska et al. (2012) reported that the frequency of G allele in PPARGC1A gene polymorphism of Polish and Russian athletes was higher than that of the A allele, and concluded that the G allele was the dominant allele and the GG genotype was the dominant genotype for the Polish and Russian endurance athletes. On the surface, the results of the above two studies were opposite to the results of our study on PPARGC1A (rs8192678) polymorphism. The result of this study was that PPARGC1A (rs8192678) polymorphism was associated with power performance, while the other two studies were associated with endurance performance. However, from the detailed data of PPARGC1A (rs8192678) genotype distribution and allele frequency reported in several studies, there was still some consistency. The frequency of the A allele and G allele in the endurance group was 36 and 64%, which was consistent with the results reported by Eynon et al. (2010). If the data of power and endurance groups in our study were combined, the G allele of all athletes would be higher than the A allele, which would be consistent with the results reported by Polish and Russian athletes. Because of the different emphases of research and analysis, the opposite conclusion had been obtained. According to the results of our study, it can also be understood that the G allele of PPARGC1A (rs8192678) polymorphism is associated with endurance performance, while the A allele is associated with power performance.
Most of the candidate SNPs involved in this study were selected from the results reported in English literature, and most of the people were European ancestry populations in Europe and the United States (Ahmetov and Fedotovskaya, 2015; Naureen et al., 2020). The three SNPs in our results have been reported in the Caucasus populations. If the results of this study were directly applied to the Caucasus populations, they should be feasible in theory, but the data of the Caucasus populations should be used for validation. In addition to European ancestry populations, other non-Chinese Han population should be used with caution because there are no relevant research results reported to support it. Due to the large number and complexity of Chinese nationalities and races, it should also be used with caution. The Chinese Han population can use it, while other ethnic minorities should use it with caution before validation.
The purpose of the studies on the multiple genes was applied to predict physical performance development in adolescent athletes and identify sports ability and athletic status in adult athletes, which focused on the relationship between SNP and physical performance and athletic status to create models to apply in talent identification. Only SNP content was involved in the model, so it can only predict the development trend of physical performance in adolescents, but identification power from sports ability and athletic status in adult athletes was insufficient. Our study considered that there was a difference between adolescents and adult athletes in the development potential of physical performance. Adolescent athletes are constantly improving and growing in ability, yet adult athletes, especially elite adult athletes have reached or nearly reached the peak, so the models of two groups should also be different. The model only containing SNPs can be used in adolescent and the other including SNP information and phenotype indicators related to power performance can identify the current situation of sports ability and athletic status in adult athletes. According to the above application objectives, the models in our study were divided into predicting and identifying. BMI and standing vertical jump (SVJ) were added to the identifying model, whose AUC value was improved from 0.736 to 0.854. It showed that the identification power from power performance was improved after phenotypes were added. Compared with previous similar studies (Ruiz et al., 2009; Ruiz et al., 2010; Buxens et al., 2011; Massidda et al., 2014; Ben-Zaken et al., 2015), this study considered the different requirements of the target population for the models, which were more scientific and feasible. The target population includes adolescent and elite athletes. The characteristics of the adolescent population are not obvious before or just upon contact with a sports event, so it is hard to tell which type of sports event is suitable because, at this time, the coaches may need some suggestions about the development trend of power performance to determine the engagement in power-oriented events or not. For the elite athletes engaged in power-oriented events, coaches and scientific research personnel can identify the power status by using the model, so that they can better understand the physical state of athletes and make suitable training and competition plans.
The results of this study can provide insights for research that cannot afford to use sports genomics methods (e.g., GWAS), which is a relatively new scientific discipline focusing on the organization and functioning of the genome of elite athletes (Ahmetov and Fedotovskaya, 2015). Authoritative databases, such as PubMed and Web of Science, can be used to search the genes related to a phenotypic trait and retrieve several SNPs that meet the requirements. If the population to be studied is roughly the same as the population retrieved, SNPs can be directly used as candidates for subsequent research. If the study population is inconsistent with the population retrieved, it can be further screened to eliminate the SNPs that have not been reported or reported no frequency distribution difference, to narrow the range and reduce the cost of research. For example, if a gene is found in the literature, five SNPs of this gene may be associated with phenotypic traits. Further, if it is found that two SNPs have a frequency difference distribution in the study population, and the other three have no frequency difference or no reports, then the two SNPs will be included. From the results of our study, the choice criteria are feasible.
Three SNPs can be tested, genotyped, and given a score on athletes for predicting and identifying power performance. By using two models, the coach can judge athletes’ power performance potential in talent identification and distinguish power performance status in adult athletes to provide a reference for talent identification and sports training. Scores of the three SNPs can be put into predictive model (nomogram) for adolescent athletes. It shows that the athlete has a good development potential of power performance if the total score of the nomogram is more than the 130 cutoff. The measured value of BMI, SVJ, and scores of the three SNPs can be put into the identifying model (nomogram) for adult athletes. It shows that the athlete may have a high level of power performance if the total score of the nomogram is more than the 148 cutoff.
The application of the models will contribute to the fields of talent identification and sports training to a certain extent. Using the cutoff values of 130 and 148, the work of coaches will become intuitive and simple. Coaches can intuitively choose adolescents with a good power performance development potential to engage in power-oriented events when the total score from the nomogram of the predictive model is greater than 130 points. When the total score from the nomogram of the identifying model is greater than 148, it shows that athletes have high level athletic status of power performance, and coaches can reasonably plan sports training programs according to the results.
In conclusion, our results suggest that elite power performance can be predicted and identified by using polygenic profiles in Chinese athletes, according to which, two models have been created and used for talent identification in Chinese athletes. Out of the two models, the predictive one can be used in adolescent athletes to predict the development potential of power performance and the identifying one can be used in elite athletes to distinguish and evaluate power athletic status. They can be applied quickly and visually by using the method of nomogram.
Data Availability Statement
The original contributions presented in the study are included in the article/Supplementary Materials, further inquiries can be directed to the corresponding authors.
Ethics Statement
The studies involving human participants were reviewed and approved by the ethics committee of the School of Life Sciences Fudan University (Shanghai, China). The patients/participants provided their written informed consent to participate in this study.
Author Contributions
RY and FJ: writing the manuscript, data analysis and interpretation; LW and XS: data analysis and interpretation, reviewing a draft of the manuscript; QG, HS and JH: manuscript revision; QZ and JW: research concept and study design, reviewing a draft of the manuscript; MC: statistical analyses, editing a draft of the manuscript.
Funding
This study was supported by the Scientific Research Foundation of SUMHS, Grant No. SSF-21-03-004; the “Hundred Talents Pool of Teachers” project of Shanghai University of Medicine and Health Sciences (A3-0200-21-311007); the key basic research grants from Science and Technology Commission of Shanghai Municipality, Grant No. 16JC1400500; Shanghai Sports Science and Technology Plan: “Eaglet Project”, Grant No. 20C008; Project of Clinical Outstanding Clinical Discipline Construction in Shanghai Pudong New Area (No. PWYgy 2018-07); Project of Shanghai Municipality Key Medical Specialties Construction (No. ZK 2019C08); and Leading Talent Training in Shanghai Pudong New Area Health System (No. PWRl 2018-08).
Conflict of Interest
The authors declare that the research was conducted in the absence of any commercial or financial relationships that could be construed as a potential conflict of interest.
Publisher’s Note
All claims expressed in this article are solely those of the authors and do not necessarily represent those of their affiliated organizations, or those of the publisher, the editors and the reviewers. Any product that may be evaluated in this article, or claim that may be made by its manufacturer, is not guaranteed or endorsed by the publisher.
References
Ahmetov, I. I., Egorova, E. S., Gabdrakhmanova, L. J., and Fedotovskaya, O. N. (2016). Genes and Athletic Performance: An Update. Med. Sport Sci. 61, 41–54. doi:10.1159/000445240
Ahmetov, I. I., and Fedotovskaya, O. N. (2015). Current Progress in Sports Genomics. Adv. Clin. Chem. 70, 247–314. doi:10.1016/bs.acc.2015.03.003
Ahmetov, I. I., Mozhayskaya, I. A., Flavell, D. M., Astratenkova, I. V., Komkova, A. I., Lyubaeva, E. V., et al. (2006). PPARα Gene Variation and Physical Performance in Russian Athletes. Eur. J. Appl. Physiol. 97, 103–108. doi:10.1007/s00421-006-0154-4
Ahmetov, I. I., Williams, A. G., Popov, D. V., Lyubaeva, E. V., Hakimullina, A. M., Fedotovskaya, O. N., et al. (2009). The Combined Impact of Metabolic Gene Polymorphisms on Elite Endurance Athlete Status and Related Phenotypes. Hum. Genet. 126, 751–761. doi:10.1007/s00439-009-0728-4
Ben-Zaken, S., Meckel, Y., Nemet, D., and Eliakim, A. (2015). Genetic Score of Power-Speed and Endurance Track and Field Athletes. Scand. J. Med. Sci. Sports 25, 166–174. doi:10.1111/sms.12141
Benjamini, Y., and Hochberg, Y. (1995). Controlling the False Discovery Rate: a Practical and Powerful Approach to Multiple Testing. J. R. Stat. Soc. Ser. B (Methodological) 57, 289–300. doi:10.1111/j.2517-6161.1995.tb02031.x
Breitbach, S., Tug, S., and Simon, P. (2014). Conventional and Genetic talent Identification in Sports: Will Recent Developments Trace talent? Sports Med. 44, 1489–1503. doi:10.1007/s40279-014-0221-7
Buxens, A., Ruiz, J. R., Arteta, D., Artieda, M., Santiago, C., González-Freire, M., et al. (2011). Can We Predict Top-Level Sports Performance in Power vs Endurance Events? A Genetic Approach. Scand. J. Med. Sci. Sports 21, 570–579. doi:10.1111/j.1600-0838.2009.01079.x
Cao, W.-Y., Liu, Z., Guo, F., Yu, J., Li, H., and Yin, X. (2018). Adipocyte ADRB3 Down-Regulated in Chinese Overweight Individuals Adipocyte ADRB3 in Overweight. Obes. Facts 11, 524–533. doi:10.1159/000495116
Collins, S., and Surwit, R. S. (2001). The -Adrenergic Receptors and the Control of Adipose Tissue Metabolism and Thermogenesis. Recent Prog. Horm. Res. 56, 309–328. doi:10.1210/rp.56.1.309
Eynon, N., Meckel, Y., Sagiv, M., Yamin, C., Amir, R., Sagiv, M., et al. (2010). DoPPARGC1AandPPARαpolymorphisms Influence Sprint or Endurance Phenotypes? Scand. J. Med. Sci. Sports 20, e145–e150. doi:10.1111/j.1600-0838.2009.00930.x
Fontecha-Barriuso, M., Martin-Sanchez, D., Martinez-Moreno, J., Monsalve, M., Ramos, A., Sanchez-Niño, M., et al. (2020). The Role of PGC-1α and Mitochondrial Biogenesis in Kidney Diseases. Biomolecules 10, 347. doi:10.3390/biom10020347
Franks, P. W., Barroso, I. S., Luan, J. A., Ekelund, U., Crowley, V. E. F., Brage, S. R., et al. (2003). PGC-1?? Genotype Modifies the Association of Volitional Energy Expenditure with &OV0312;O2max. Med. Sci. Sports Exerc. 35, 1998–2004. doi:10.1249/01.MSS.0000099109.73351.81
Grealy, R., Herruer, J., Smith, C. L. E., Hiller, D., Haseler, L. J., and Griffiths, L. R. (2015). Evaluation of a 7-Gene Genetic Profile for Athletic Endurance Phenotype in Ironman Championship Triathletes. PLoS One 10, e0145171. doi:10.1371/journal.pone.0145171
Hagberg, J. M., Rankinen, T., Loos, R. J. F., Pérusse, L., Roth, S. M., Wolfarth, B., et al. (2011). Advances in Exercise, Fitness, and Performance Genomics in 2010. Med. Sci. Sports Exerc. 43, 743–752. doi:10.1249/MSS.0b013e3182155d21
He, Z., Hu, Y., Feng, L., Bao, D., Wang, L., Li, Y., et al. (2008). Is There an Association between PPARGC1A Genotypes and Endurance Capacity in Chinese Men? Scand. J. Med. Sci. Sports 18, 195–204. doi:10.1111/j.1600-0838.2007.00648.x
Kurylowicz, A., Jonas, M., Lisik, W., Jonas, M., Wicik, Z., Wierzbicki, Z., et al. (2015). Obesity Is Associated with a Decrease in Expression but Not with the Hypermethylation of Thermogenesis-Related Genes in Adipose Tissues. J. Translational Med. 13, 31. doi:10.1186/s12967-015-0395-2
Macarthur, D. G., and North, K. N. (2005). Genes and Human Elite Athletic Performance. Hum. Genet. 116, 331–339. doi:10.1007/s00439-005-1261-8
Maciejewska, A., Sawczuk, M., Cieszczyk, P., Mozhayskaya, I. A., and Ahmetov, I. I. (2012). ThePPARGC1Agene Gly482Ser in Polish and Russian Athletes. J. Sports Sci. 30, 101–113. doi:10.1080/02640414.2011.623709
Maciejewska-Skrendo, A., Cięszczyk, P., Chycki, J., Sawczuk, M., and Smółka, W. (2019). Genetic Markers Associated with Power Athlete Status. J. Hum. Kinet 68, 17–36. doi:10.2478/hukin-2019-0053
Mandrekar, J. N. (2010). Receiver Operating Characteristic Curve in Diagnostic Test Assessment. J. Thorac. Oncol. 5, 1315–1316. doi:10.1097/JTO.0b013e3181ec173d
Massidda, M., Scorcu, M., and Calò, C. M. (2014). New Genetic Model for Predicting Phenotype Traits in Sports. Int. J. Sports Physiol. Perform. 9, 554–560. doi:10.1123/ijspp.2012-0339
Mathai, A. S., Bonen, A., Benton, C. R., Robinson, D. L., and Graham, T. E. (2008). Rapid Exercise-Induced Changes in PGC-1α mRNA and Protein in Human Skeletal Muscle. J. Appl. Physiol. (1985) 105, 1098–1105. doi:10.1152/japplphysiol.00847.2007
Moran, C. N., Yang, N., Bailey, M. E. S., Tsiokanos, A., Jamurtas, A., MacArthur, D. G., et al. (2007). Association Analysis of the ACTN3 R577X Polymorphism and Complex Quantitative Body Composition and Performance Phenotypes in Adolescent Greeks. Eur. J. Hum. Genet. 15, 88–93. doi:10.1038/sj.ejhg.5201724
Naureen, Z., Perrone, M., Paolacci, S., Maltese, P. E., Dhuli, K., Kurti, D., et al. (2020). Genetic Test for the Personalization of Sport Training. Acta Biomed. 91 (13-S), e2020012. doi:10.23750/abm.v91i13-S.10593
Peeters, M. W., Thomis, M. A. I., Beunen, G. P., and Malina, R. M. (2009). Genetics and Sports: an Overview of the Pre-molecular Biology Era. Med. Sport Sci. 54, 28–42. doi:10.1159/000235695
Peplonska, B., Adamczyk, J. G., Siewierski, M., Safranow, K., Maruszak, A., Sozanski, H., et al. (2017). Genetic Variants Associated with Physical and Mental Characteristics of the Elite Athletes in the Polish Population. Scand. J. Med. Sci. Sports 27, 788–800. doi:10.1111/sms.12687
Pérusse, L., Rankinen, T., Hagberg, J. M., Loos, R. J. F., Roth, S. M., Sarzynski, M. A., et al. (2013). Advances in Exercise, Fitness, and Performance Genomics in 2012. Med. Sci. Sports Exerc. 45, 824–831. doi:10.1249/MSS.0b013e31828b28a3
Pickering, C., Kiely, J., Grgic, J., Lucia, A., and Del Coso, J. (2019). Can Genetic Testing Identify Talent for Sport? Genes 10, 972. doi:10.3390/genes10120972
Puthucheary, Z., Skipworth, J. R. A., Rawal, J., Loosemore, M., Van Someren, K., and Montgomery, H. E. (2011). Genetic Influences in Sport and Physical Performance. Sports Med. 41, 845–859. doi:10.2165/11593200-000000000-00000
Roth, S. M., Rankinen, T., Hagberg, J. M., Loos, R. J. F., Pérusse, L., Sarzynski, M. A., et al. (2012). Advances in Exercise, Fitness, and Performance Genomics in 2011. Med. Sci. Sports Exerc. 44, 809–817. doi:10.1249/MSS.0b013e31824f28b6
Ruiz, J. R., Arteta, D., Buxens, A., Artieda, M., Gómez-Gallego, F., Santiago, C., et al. (2010). Can We Identify a Power-Oriented Polygenic Profile? J. Appl. Physiol. (1985) 108, 561–566. doi:10.1152/japplphysiol.01242.2009
Ruiz, J. R., Gómez-Gallego, F., Santiago, C., González-Freire, M., Verde, Z., Foster, C., et al. (2009). Is There an Optimum Endurance Polygenic Profile? J. Physiol. 587, 1527–1534. doi:10.1113/jphysiol.2008.166645
Santiago, C., Ruiz, J. R., Buxens, A., Artieda, M., Arteta, D., González-Freire, M., et al. (2011). Trp64Arg Polymorphism in ADRB3 Gene Is Associated with Elite Endurance Performance. Br. J. Sports Med. 45, 147–149. doi:10.1136/bjsm.2009.061366
Sarzynski, M. A., Loos, R. J. F., Lucia, A., Pérusse, L., Roth, S. M., Wolfarth, B., et al. (2016). Advances in Exercise, Fitness, and Performance Genomics in 2015. Med. Sci. Sports Exerc. 48, 1906–1916. doi:10.1249/MSS.0000000000000982
Stumvoll, M., Fritsche, A., t'Hart, L., Machann, J., Thamer, C., Tschritter, O., et al. (2004). The Gly482Ser Variant in the Peroxisome Proliferator-Activated Receptor γ Coactivator-1 Is Not Associated with Diabetes-Related Traits in Non-diabetic German and Dutch Populations. Exp. Clin. Endocrinol. Diabetes 112, 253–257. doi:10.1055/s-2004-817972
Tharabenjasin, P., Pabalan, N., and Jarjanazi, H. (2019). Association of the ACTN3 R577X (Rs1815739) Polymorphism with Elite Power Sports: A Meta-Analysis. PLoS One 14, e0217390. doi:10.1371/journal.pone.0217390
Vincent, B., De Bock, K., Ramaekers, M., Van den Eede, E., Van Leemputte, M., Hespel, P., et al. (2007). ACTN3 (R577X) Genotype Is Associated with Fiber Type Distribution. Physiol. Genomics 32, 58–63. doi:10.1152/physiolgenomics.00173.2007
Webborn, N., Williams, A., McNamee, M., Bouchard, C., Pitsiladis, Y., Ahmetov, I., et al. (2015). Direct-to-consumer Genetic Testing for Predicting Sports Performance and talent Identification: Consensus Statement. Br. J. Sports Med. 49, 1486–1491. doi:10.1136/bjsports-2015-095343
Xie, C., Hua, W., Zhao, Y., Rui, J., Feng, J., Chen, Y., et al. (2020). The ADRB3 Rs4994 Polymorphism Increases Risk of Childhood and Adolescent Overweight/obesity for East Asia's Population: an Evidence-Based Meta-Analysis. Adipocyte 9, 77–86. doi:10.1080/21623945.2020.1722549
Yang, L.-K., and Tao, Y.-X. (2019). Physiology and Pathophysiology of the β3-adrenergic Receptor. Prog. Mol. Biol. Transl Sci. 161, 91–112. doi:10.1016/bs.pmbts.2018.09.003
Yang, R., Shen, X., Wang, Y., Cai, G., Fu, Y., and Xu, W. (2016). Genotype Distribution and Allele Frequencies of the ACTN3 R577X Gene Polymorphism in China. Med. Sport 69, 230–248.
Keywords: gene polymorphism, talent identification, athletic status, physical performance, nomogram
Citation: Yang R, Jin F, Wang L, Shen X, Guo Q, Song H, Hu J, Zhao Q, Wan J and Cai M (2021) Prediction and Identification of Power Performance Using Polygenic Models of Three Single-Nucleotide Polymorphisms in Chinese Elite Athletes. Front. Genet. 12:726552. doi: 10.3389/fgene.2021.726552
Received: 17 June 2021; Accepted: 09 September 2021;
Published: 08 October 2021.
Edited by:
Lindsay Fernandez-Rhodes, The Pennsylvania State University (PSU), United StatesReviewed by:
Rui Medeiros, Portuguese Oncology Institute, PortugalWei-Dong Li, Tianjin Medical University, China
Copyright © 2021 Yang, Jin, Wang, Shen, Guo, Song, Hu, Zhao, Wan and Cai. This is an open-access article distributed under the terms of the Creative Commons Attribution License (CC BY). The use, distribution or reproduction in other forums is permitted, provided the original author(s) and the copyright owner(s) are credited and that the original publication in this journal is cited, in accordance with accepted academic practice. No use, distribution or reproduction is permitted which does not comply with these terms.
*Correspondence: Qiang Zhao, enFpYW5nQG5jZ3IuYWMuY24=; Jian Wan, ZHJqaWFuQHllYWgubmV0; Ming Cai, ZXRoYW4zMjFAMTI2LmNvbQ==
†ORCID:Ruoyu Yangorcid.org/0000-0002-8815-4439Ming Caiorcid.org/0000-0002-8851-3382
‡These authors have contributed equally to this work and share first authorship.