 Linzhuo Fan
 Jinhong Hou
 Guimin Qin
- School of Computer Science and Technology, Xidian University, Xi’an, China
Breast cancer is one of the most common malignant tumors in women, which seriously endangers women’s health. Great advances have been made over the last decades, however, most studies predict driver genes of breast cancer using biological experiments and/or computational methods, regardless of stage information. In this study, we propose a computational framework to predict the disease genes of breast cancer based on stage-specific gene regulatory networks. Firstly, we screen out differentially expressed genes and hypomethylated/hypermethylated genes by comparing tumor samples with corresponding normal samples. Secondly, we construct three stage-specific gene regulatory networks by integrating RNA-seq profiles and TF-target pairs, and apply WGCNA to detect modules from these networks. Subsequently, we perform network topological analysis and gene set enrichment analysis. Finally, the key genes of specific modules for each stage are screened as candidate disease genes. We obtain seven stage-specific modules, and identify 20, 12, and 22 key genes for three stages, respectively. Furthermore, 55%, 83%, and 64% of the genes are associated with breast cancer, for example E2F2, E2F8, TPX2, BUB1, and CKAP2L. So it may be of great importance for further verification by cancer experts.
Introduction
Breast cancer is one of the most common malignant tumors in women, and it is the main disease factor that causes cancer deaths in women worldwide. According to statistics (Siegel et al., 2021), breast cancer accounts for 30% of female cancers. In China, breast cancer incidence has two peaks: one is 45–55 years old, and the other is 70–74 years old. From the perspective of age distribution, the incidence of breast cancer gradually increases from the age of 30, and reaches a peak at the age of 55. About 40% of female patients are under 50 (Wild et al., 2020). The symptoms of early breast cancer are unobvious and easy to be overlooked. In the late, cancer cells would metastasize far away, which causes multiple organ diseases, which seriously threatens the lives of patients. However, the current disease genes for breast cancer diagnosis and treatment are far from enough, and it is particularly important to find new candidate disease genes.
Epigenetics is currently a promising field in cancer research. As an important part of epigenetics, DNA methylation has received increasing attention, which is the process of adding methyl groups to DNA molecules and essential for cell development. The functional epigenetic module (FEM) algorithm (Jiao et al., 2014) has verified the inverse correlation between DNA methylation and gene expression, and a large number of researchers have studied the effect of DNA methylation on breast cancer. Bediaga et al. (2010) analyzed the DNA methylation of cancer-related gene regulatory regions in breast cancer paired samples, and effectively identified 15 individual CpG loci that were differentially methylated in breast cancer tumor subtypes, which provides evidence that DNA methylation profile can predict breast cancer subtypes. Based on DNA methylation in whole blood and specific genes, Tang et al. (2016) studied the level of DNA methylation in the blood of breast cancer patients and healthy controls, and found that epigenome-wide blood DNA of breast cancer patients is hypomethylated, and the frequency of BRCA1 and RASSF1A methylation is higher. Lu et al. (2017) explored the relationship between RUNX3 gene methylation and breast cancer, and the results showed that the hypermethylation of RUNX3 plays a significant role in the pathological stage and prognosis of breast cancer, which has great potential as a molecular marker for early diagnosis of breast cancer. De Almeida et al. (2019) analyzed the correlation between genome-wide methylation and gene expression by matching breast cancer DNA methylation with normal tissues in the TCGA, and identified new DNA methylation markers, including PRAC2, TDRD10, TMEM132C, etc., are expected to become diagnostic and prognostic markers of breast cancer.
There are also bioinformatics experts who study breast cancer based on biological molecular networks. Cai et al. (2019) used WCGNA to screen out the gene modules related to the risk of breast cancer metastasis, combined with the PPI network to screen out five key genes related to breast cancer progression and verified them. Lin et al. (2020) constructed a PPI network to screen hub genes, used modular analysis and survival analysis to identify potential target genes and pathways that may affect the occurrence and development of HER-2 positive breast cancer. Tang J. N. et al. (2018) identified five candidate biomarkers by analyzing the co-expression network, and used candidates in the basic and clinical research of breast cancer. Xi et al. (2018a) detected that TP53 and PNRM1 driver genes play an important role in breast cancer through matrix tri-factorization framework with pairwise similarity constraints. Guo et al. (2017) explained the mechanism of breast cancer development by identifying key pathways in breast cancer tissue and constructing the network of transcription factors (TFs) and microRNA (miRNA). Qiu et al. (2019) established the gene co-expression network for identifying modules related to breast cancer development, and discovered hub genes that may be used as markers of invasive breast cancer. Xi et al. (2018b) discovered mutated driver genes by using a robust and sparse co-regularized matrix factorization framework with prior information from mRNA expression patterns and interaction network. By combining the subspace learning framework, Xi et al. (2020) proposed the DriverSub algorithm to infer specific driver genes from heterogeneous breast cancer samples.
In this article, we propose a computational framework to predict candidate stage-specific disease genes of breast cancer based on the stage-specific gene regulatory networks. Firstly, we screen out differentially expressed genes and hypermethylated/hypomethylated genes by comparing tumor samples and normal samples. Secondly, we construct and analyze three stage-specific gene regulatory networks by taking stage information into account. Thirdly, we identify stage-specific modules by module division. Finally, we predict candidate stage-specific disease genes.
Our contributions consist of two points:
(1) We integrate stage information and DNA methylation information to construct a stage-specific gene regulatory network for breast cancer, which may help doctors identify patient’s disease stage more quickly and design better treatment strategy.
(2) The proposed computational framework is effective in predicting breast cancer related genes, which will help experts to explore the molecular mechanisms of breast cancer.
Materials and Methods
Our computational framework for predicting candidate disease genes includes four parts: Stage-specific gene regulatory networks construction, Module division, Topological properties analysis and gene set enrichment analysis, Candidate disease genes prediction (Figure 1).
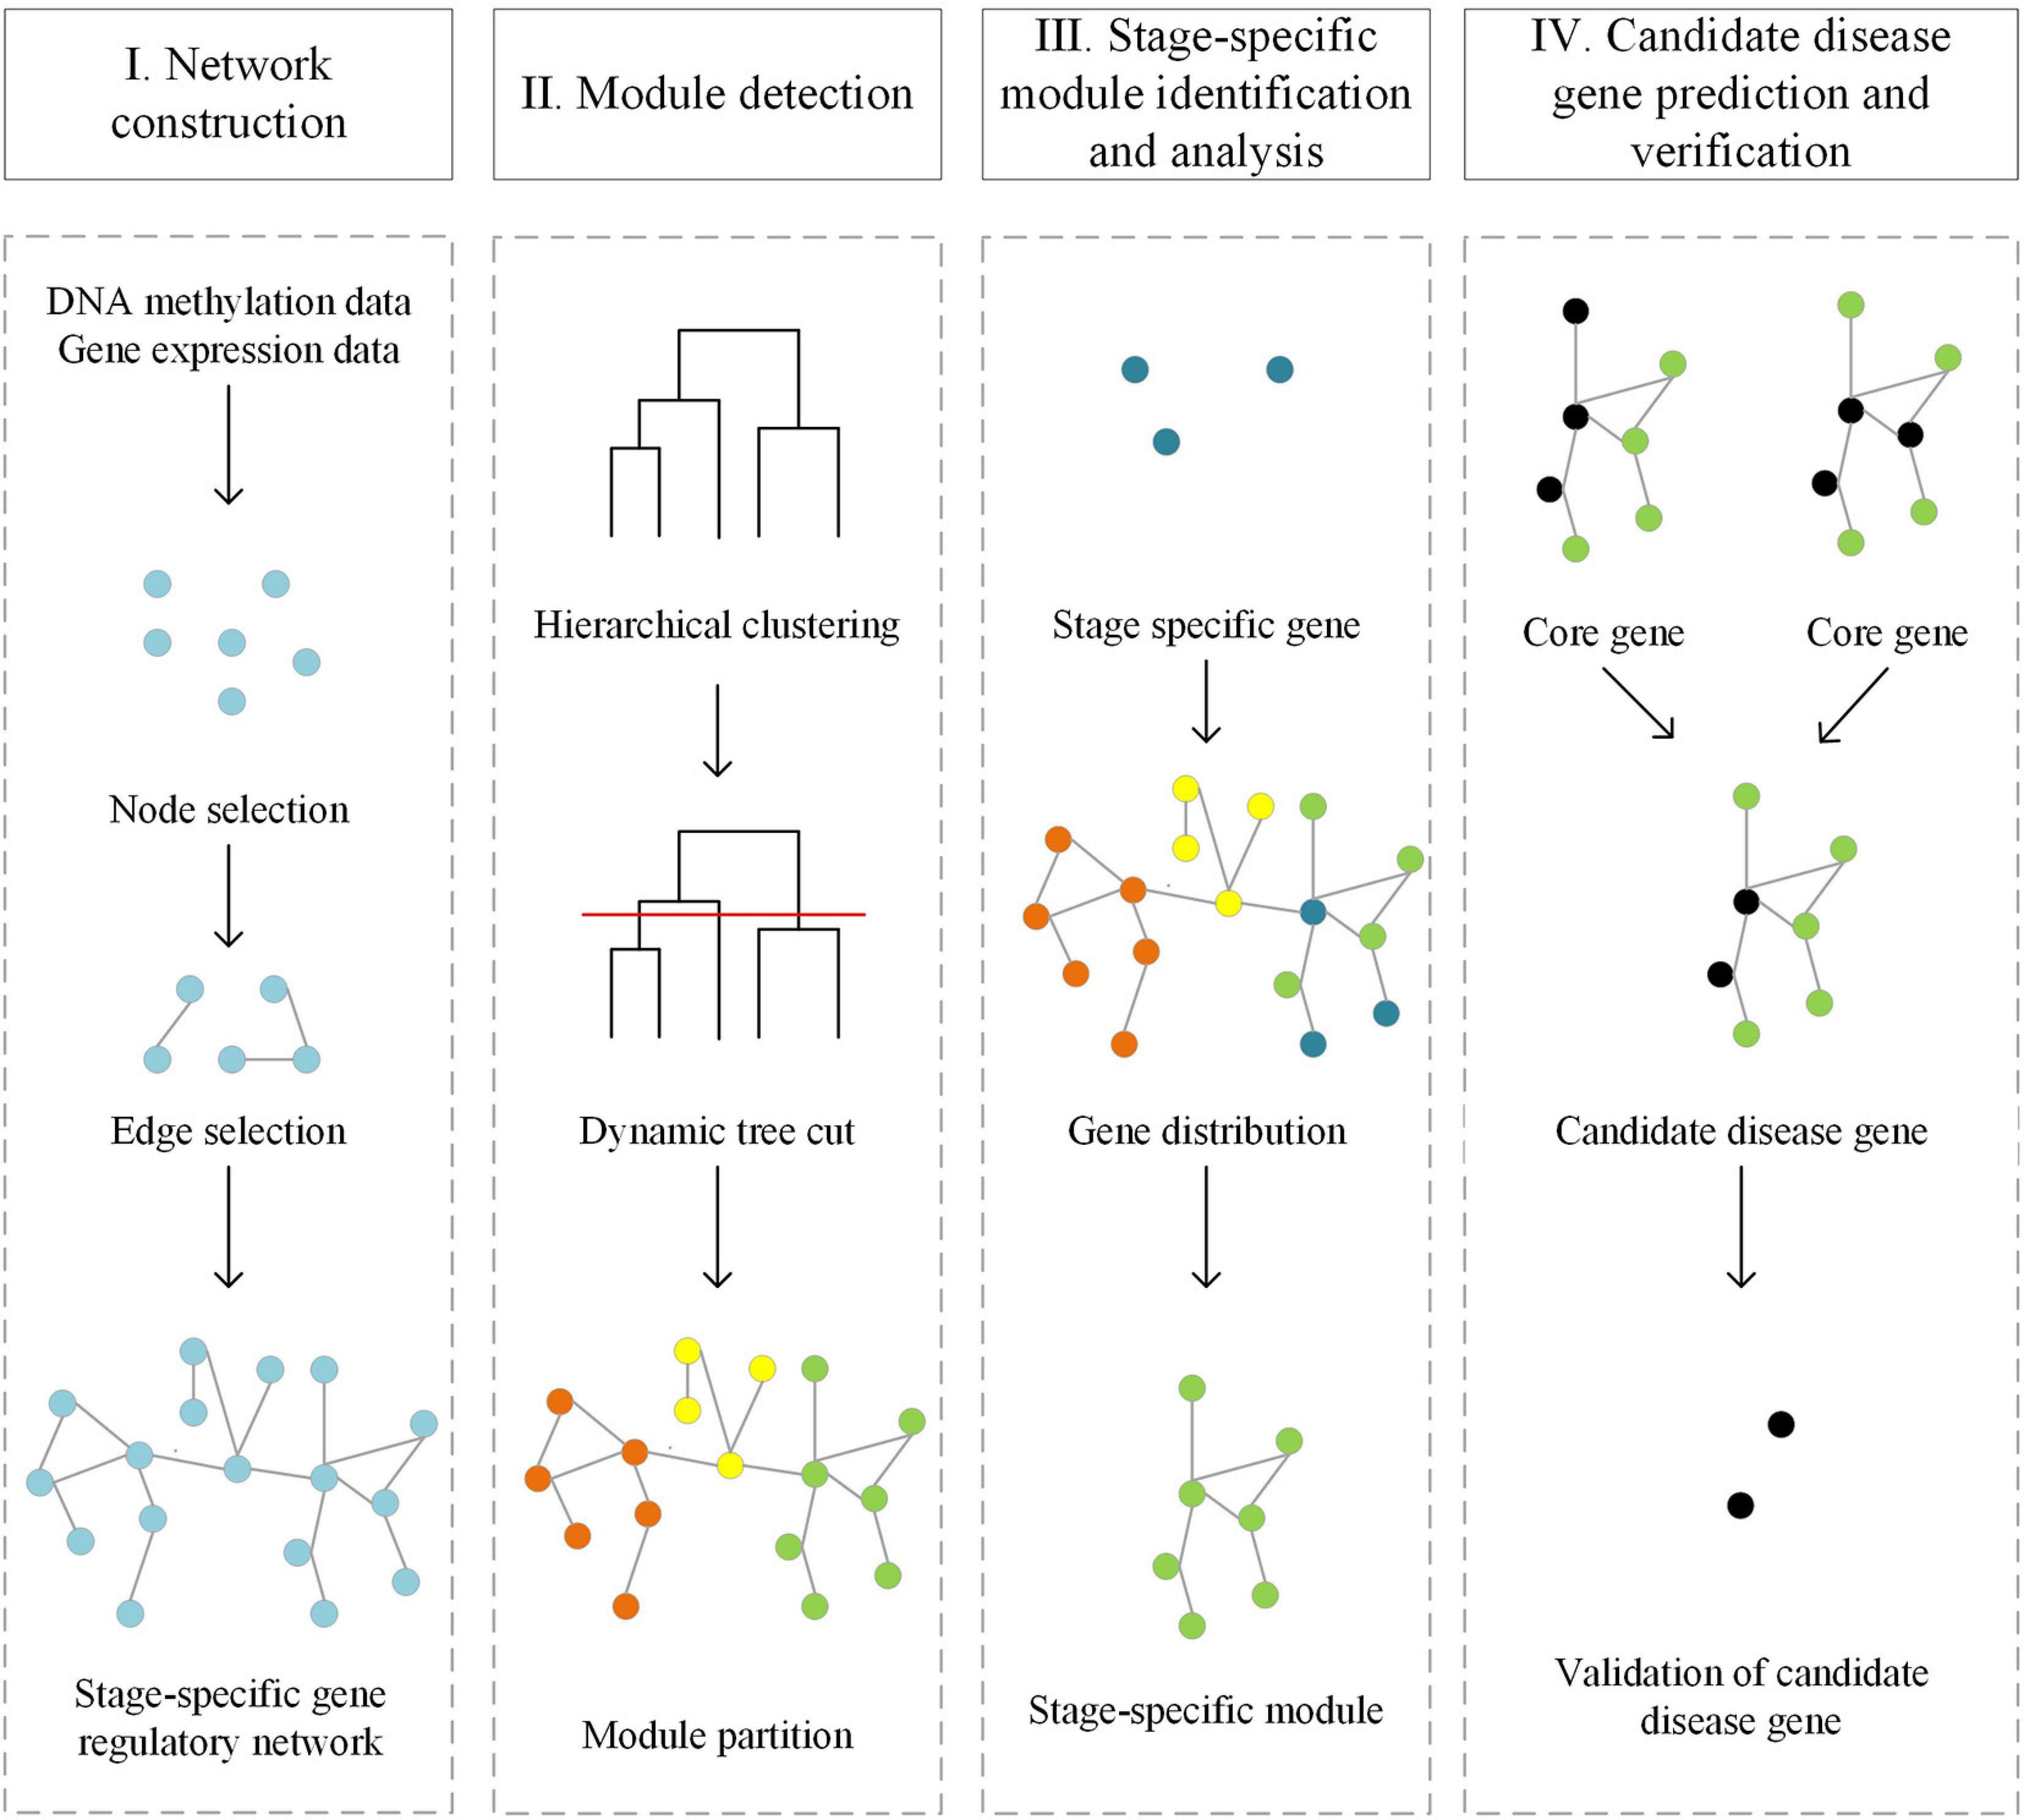
Figure 1. Workflow of the computational framework for predicting disease genes based on stage-specific gene regulatory network.
Data Preprocessing
We download breast cancer phenotype data, gene expression profile and DNA methylation data from TCGA (Tomczak et al., 2015) (The Cancer Genome Atlas), which is currently the largest public cancer database, containing nearly 40 common cancer types and tens of thousands of samples. There are 60,484 genes and 1,217 samples in the gene expression profile, and 485,578 CpG sites and 890 samples in the DNA methylation data, respectively. We only retain the sample pairs, i.e., each tumor sample has a corresponding normal sample. Then, we divide the samples according to the stage information, and obtain 29 pairs, 94 pairs, 32 pairs of samples in stage I, stage II, and stage III, respectively. There are only two pairs of samples in stage IV that meet the experimental standards, which is not convincing. Therefore, we exclude samples in stage IV. For the DNA methylation data, we first convert the CpG site into the gene. As there are many CpG sites in a gene, we just use their mean β value to represent the DNA methylation level of the gene. For the gene expression profile, we download normalized FPKM data and filter out 15% genes with missing values. Then we select samples that have both cancer tissue and normal tissue.
The Gene Expression Omnibus (GEO) (Barrett et al., 2005) database includes a large amount of sequencing data and omics data, which is comprehensive and free. We download the GSE15852 and GSE69914 datasets from GEO (Liu et al., 2017). GSE15852 is the raw gene expression data from 43 human breast cancers and their corresponding normal tissues. GSE69914 is DNA methylation profiling of 50 normal samples from healthy women, 42 matched normal-adjacent breast cancer pairs (84 samples), 263 unmatched breast cancers, seven normal samples from BRCA1 carriers and four BRCA1 breast cancers. We only use 42 matched pairs of normal-adjacent breast cancer.
Differentially Expressed Genes and Hypomethylated/Hypermethylated Genes Identification
For the gene expression profile, we use Limma (Ritchie et al., 2015) in the R package to screen the differentially expressed genes, and use p-value less than 0.05 and |log FC| less than 0.5 as the threshold. For the DNA methylation data, we define β value greater than 0.8 as hypermethylated genes and β value less than 0.2 as hypomethylated genes. Then we take the intersection of the differentially expressed genes and the hypermethylated/hypomethylated genes and obtain 1,027 genes, 1,012 genes, and 1,220 genes in stage I, stage II, and stage III, respectively. Then we compare the relationship between the DNA methylation profile and gene expression profile, and find that the higher the gene methylation level, the lower the gene expression. And the results are shown in Figure 2.
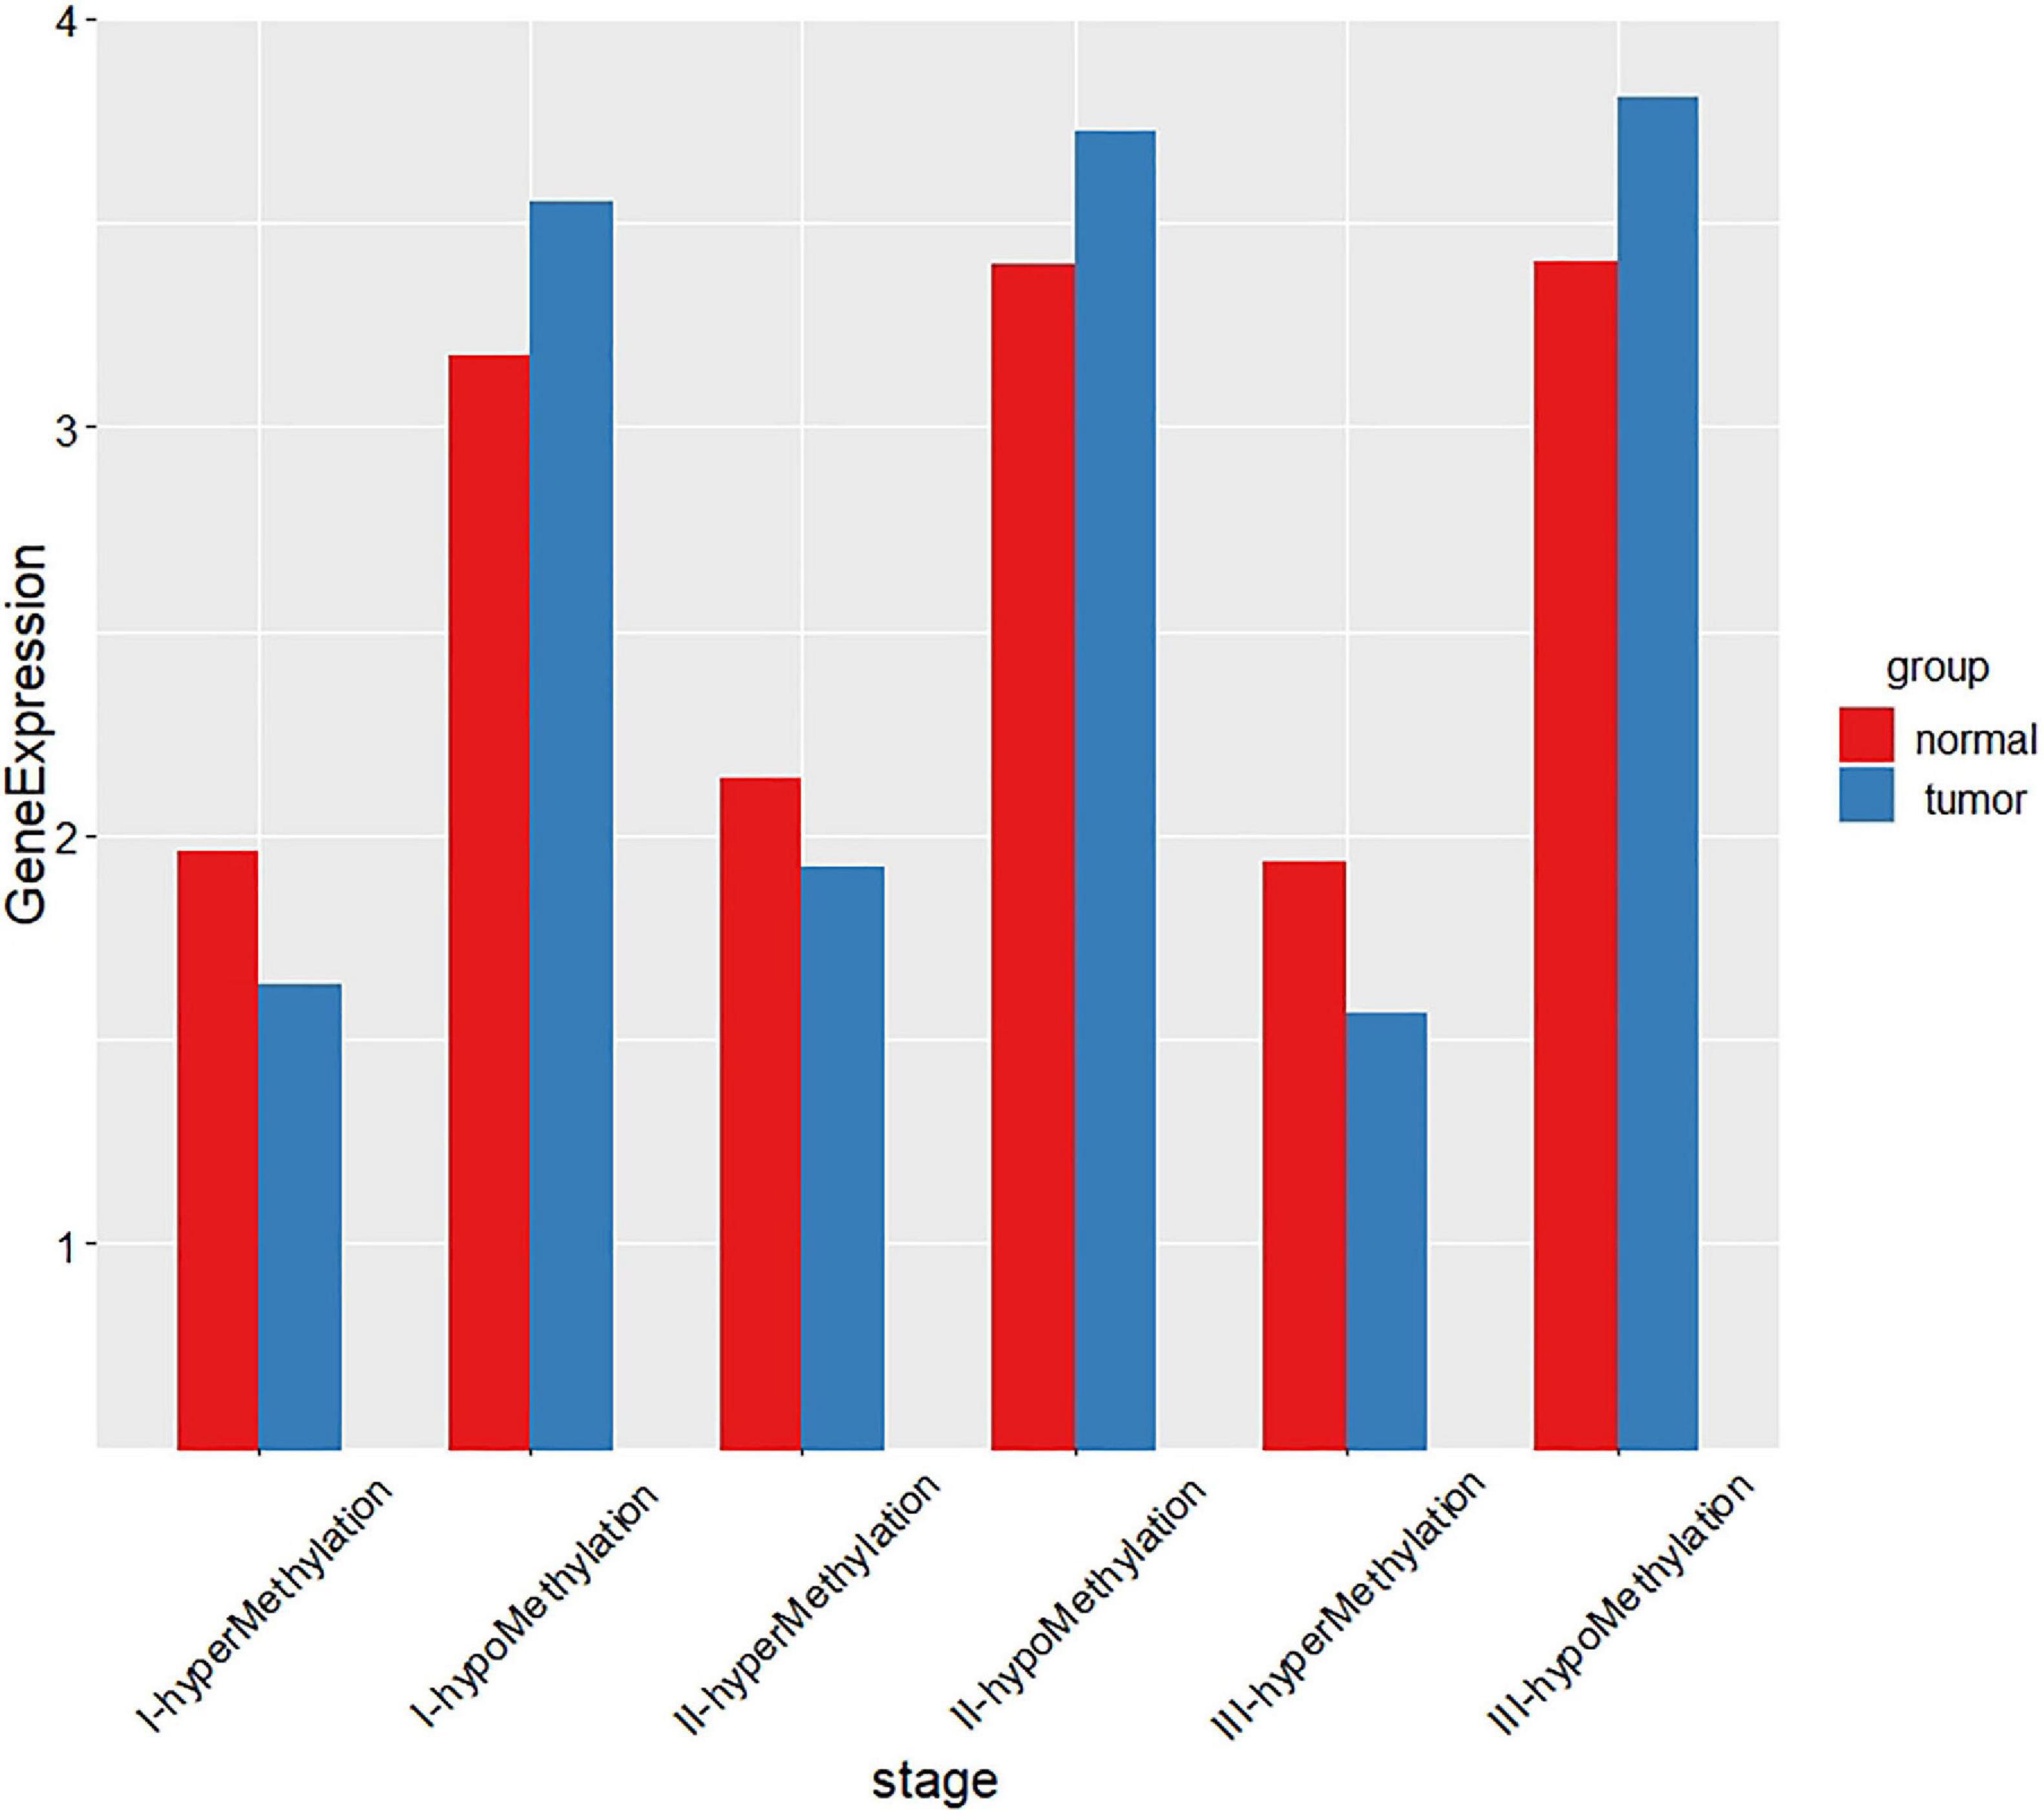
Figure 2. The relationship between DNA methylation and gene expression of each stage.
Stage-Specific Gene Regulatory Networks Construction
Gene Regulatory Network database (GRNdb) (Fang et al., 2020) is a gene regulatory network database, which includes a large number of human and mouse transcription factor and target gene pairs. We download the TF-target gene pairs from the GRNdb, and filter out the pairs in which the target genes are differentially expressed genes and hypermethylated/hypomethylated genes (Qin et al., 2019). Then we calculate the Pearson Correlation Coefficient (PCC) for each TF-target gene pair based on their expression level, and the cut-off is set as 0.5 and construct stage-specific gene regulatory networks.
Module Division
We use WGCNA (Langfelder and Horvath, 2008) to divide the stage-specific gene regulatory network into modules. Firstly, we perform hierarchical clustering on the three stage-specific gene regulatory networks to generate a hierarchical clustering tree. Then, we use the Dynamic Tree Cut algorithm (Langfelder et al., 2008) to divide the above-generated hierarchical clustering tree and ensure that the number of molecules in each module is at least 30.
Topological Properties Analysis and Gene Set Enrichment Analysis
Hub genes are important for biological processes. We identify and compare hub genes for each gene regulatory network. We perform topological analysis of stage-specific gene regulatory networks using Cytoscape (Shannon et al., 2003), including degree distribution, centrality distribution, and so on. Then, we perform gene set enrichment analysis using Metascape (Zhou et al., 2019).
Candidate Disease Gene Prediction
We filter out candidate disease genes from the above modules and network topological information. Then, we checked them by known disease-related genes from OMIM, COSMIC, and DAVID. Online Mendelian Inheritance in Man (OMIM) (Hamosh et al., 2005) mainly covers the relationship of genes and diseases, the relationship of genes and phenotypes, and some clinical features. Catalog of Somatic Mutations in Cancer (COSMIC) (Sondka et al., 2018) integrates cancer somatic mutations and provides cancer gene mutation map data information. DAVID (Huang et al., 2009) integrates biological data and analysis tools and provides systematic and comprehensive biological function annotation information for large-scale gene or protein lists. Furthermore, we check the association of the rest of the candidate disease genes and breast cancer in PubMed (Shashikiran, 2016).
Results
Stage-Specific Gene Regulatory Network Construction
We filter out the TF-target gene pairs whose target genes are not differentially expressed genes and hypermethylated/hypomethylated genes, and use the PCC cut-off 0.5 to construct stage-specific gene regulatory networks. There are 1,129, 1,066, and 1,339 nodes and 4,429, 4,879, and 6,461 edges, respectively.
Module Division
We use WGCNA to divide three gene regulatory networks into modules and the results are shown in Figure 3. We find that the first-stage network is divided into 11 modules, of which the turquoise module contains up to 270 genes. The number of genes in the remaining modules ranges from 40 to 149. The second-stage network is divided into 10 modules, of which the turquoise module contains 337 genes. The number of genes in the remaining modules ranges from 40 to 125. The third-stage network is divided into 13 modules, of which the turquoise module contains 337 genes. The number of genes in the remaining modules ranges from 30 to 142. In particular, the gray modules contain genes that are not classified into any module and discarded. The detailed information of the number of genes in each module is shown in Table 1.
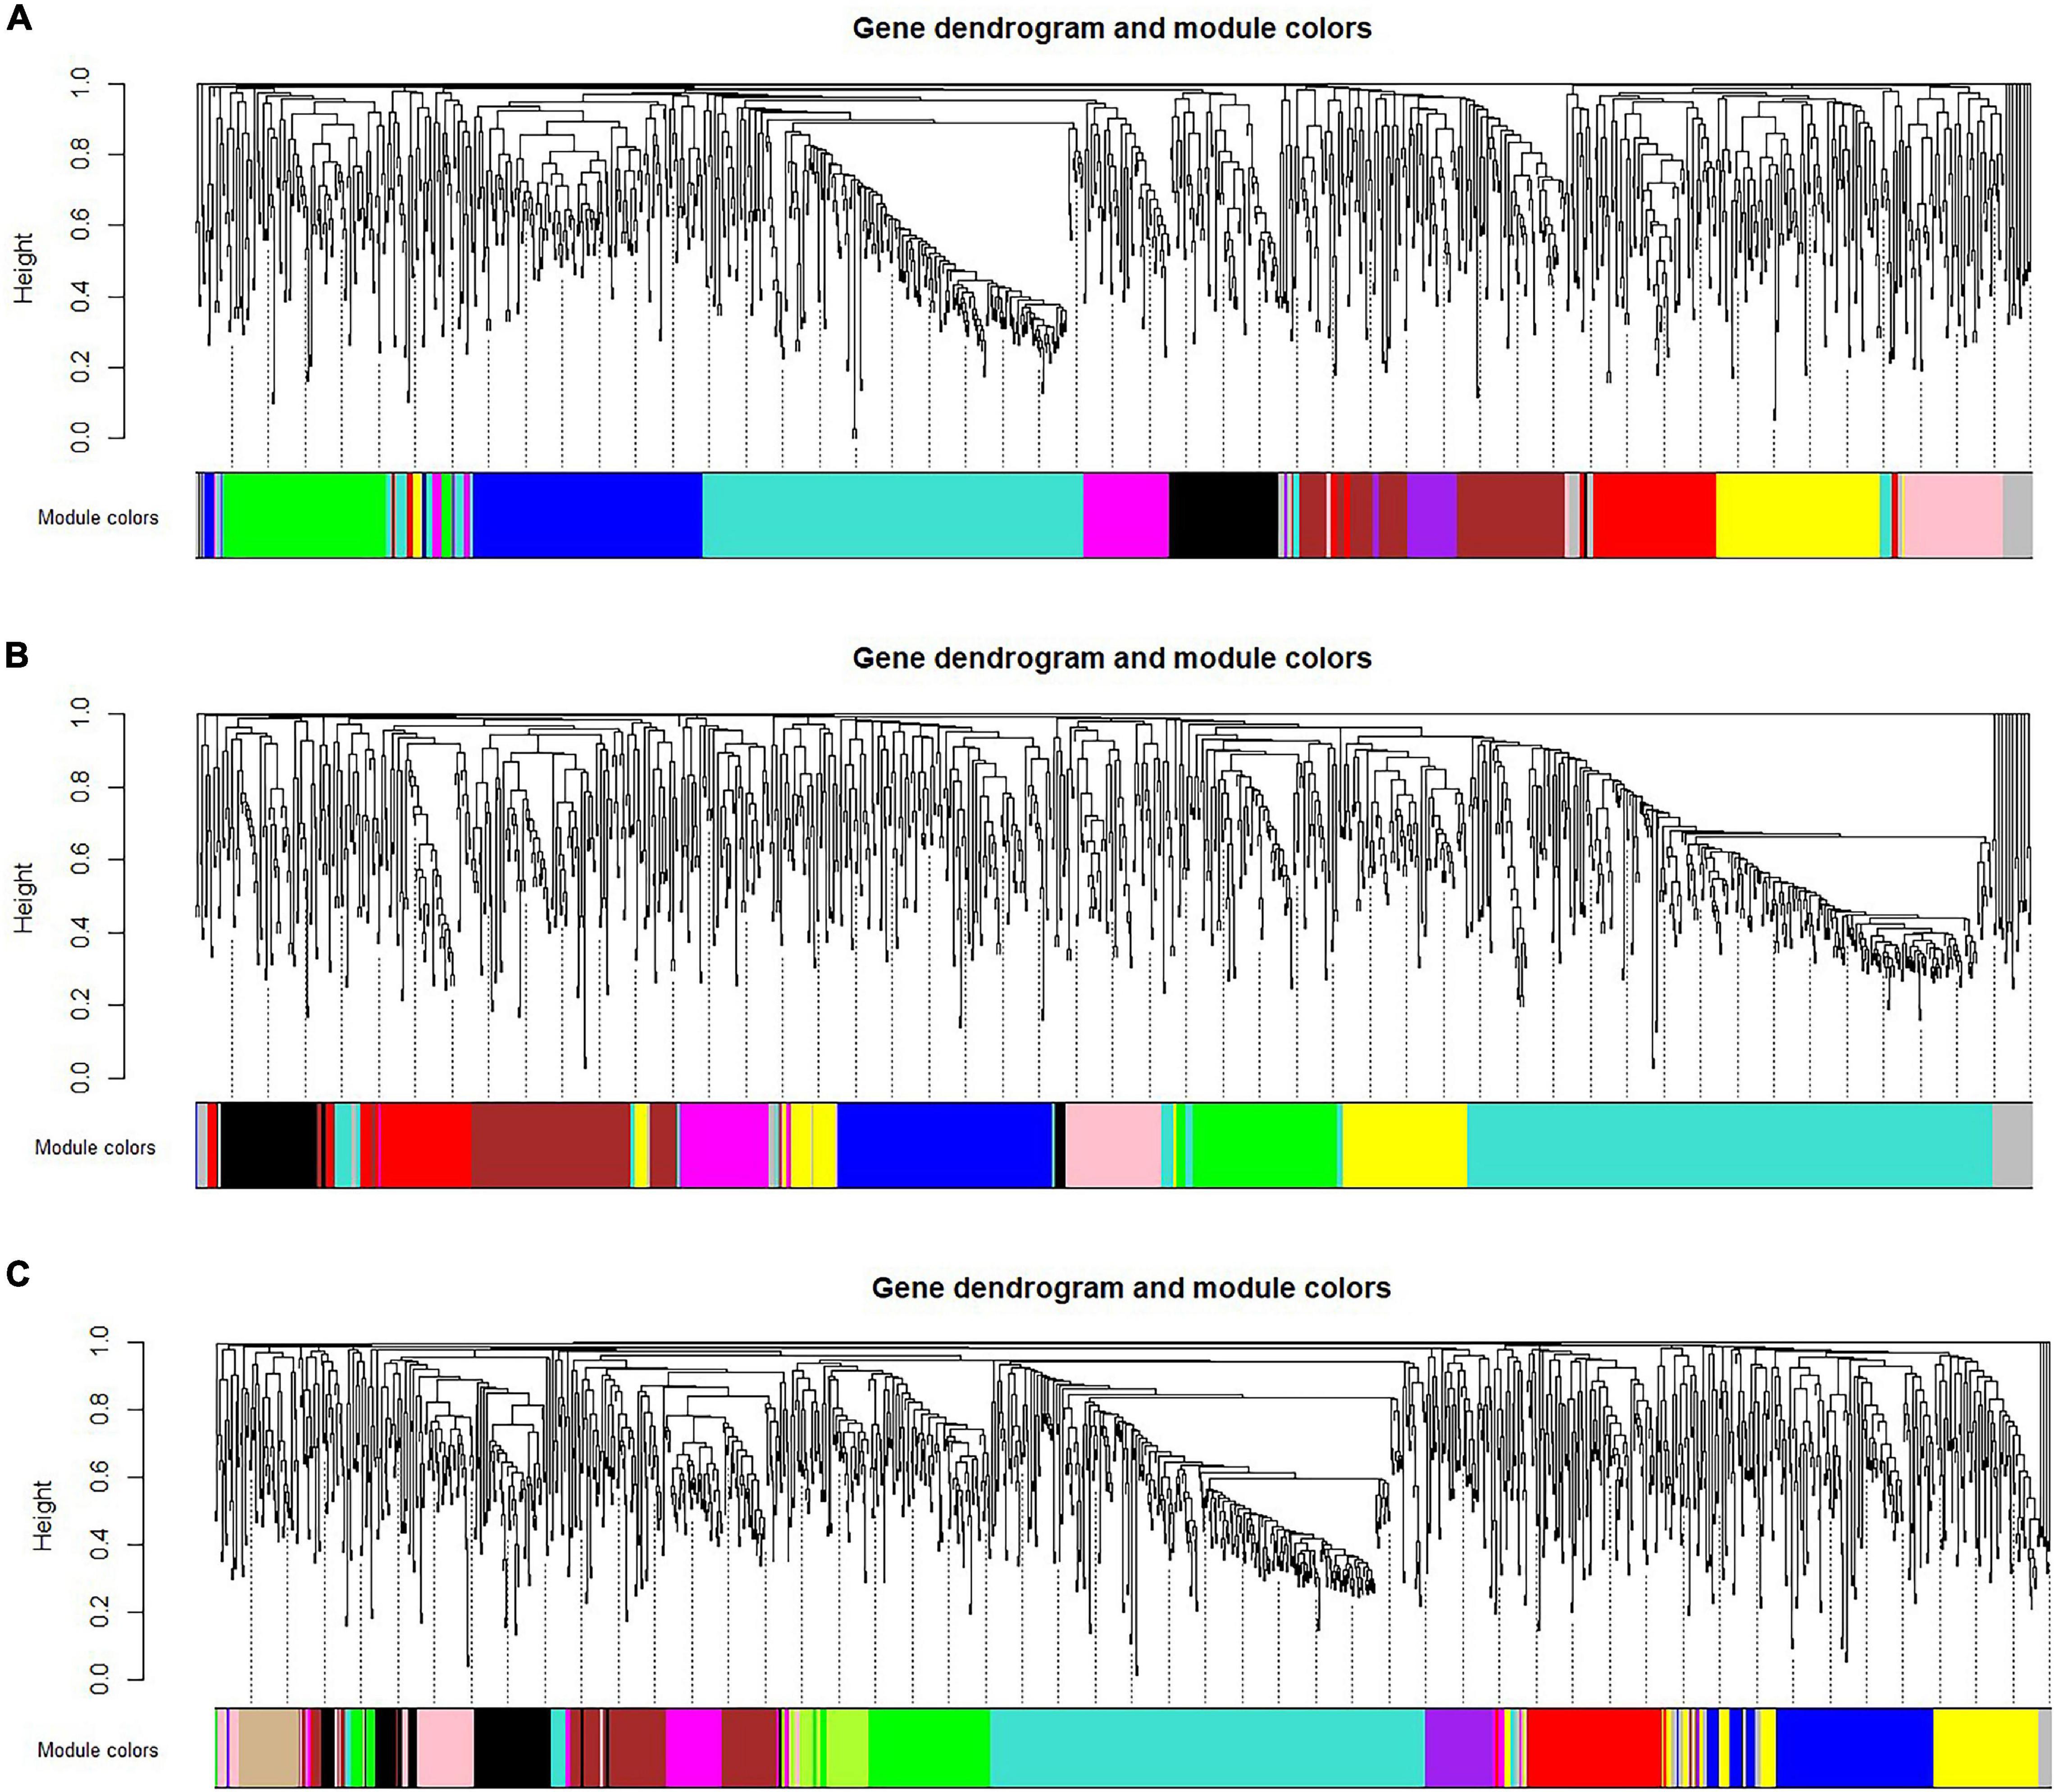
Figure 3. Module division results of each stage. (A) Stage I, (B) Stage II, (C) Stage III.
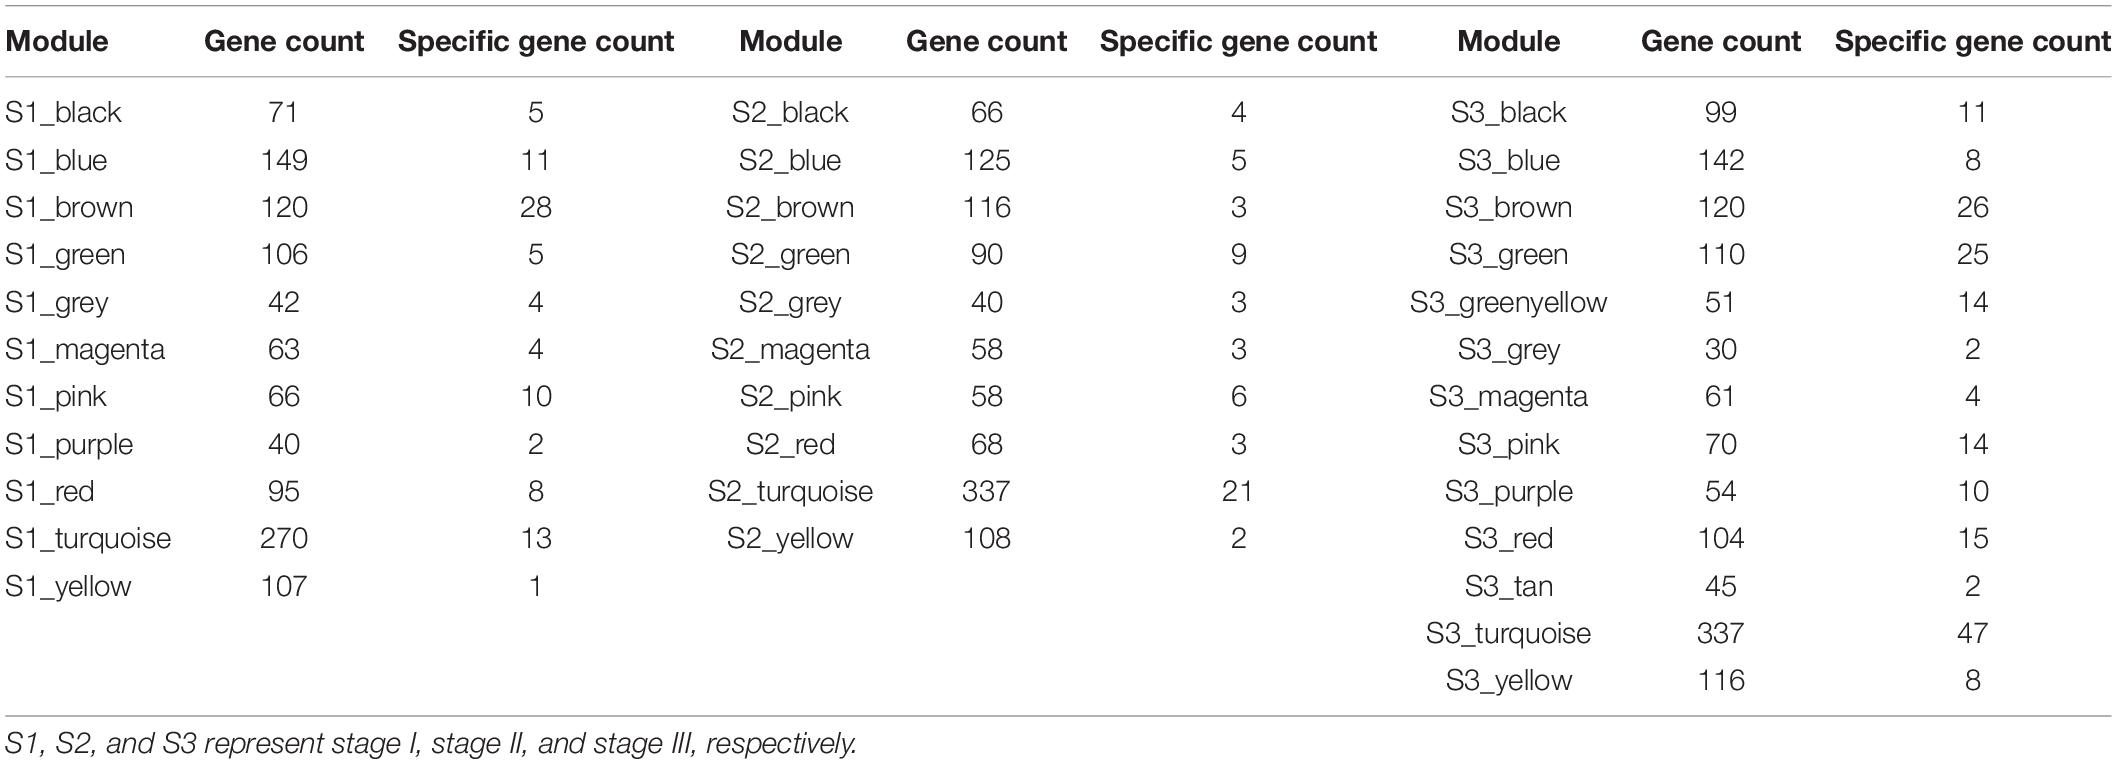
Table 1. Gene distribution of each module.
We identify differentially expressed genes that only exist in one stage as the stage-specific genes and obtain 92 genes, 60 genes, and 187 genes in stage I, stage II, and stage III, respectively. Then we count the distribution of these genes in each module, as shown in Table 1. We find that the specific genes in stage I are mainly distributed in the S1_brown module, S1_turquoise module and S1_blue module, the specific genes in stage II are mainly distributed in the S2_turquoise module, and the specific genes in stage III are mainly distributed in the S3_turquoise module, S3_brown module and S3_green module. Therefore, we regard these seven modules as the specific modules of corresponding stage.
Topological Properties Analysis and Gene Set Enrichment Analysis
We perform network topological analysis for seven specific modules using Cytoscape. For the degree distribution, the degrees of S1_turquoise module, S2_turquoise module, and S3_turquoise module are mainly distributed between 100 and 400, and the degrees of S1_brown module, S1_blue module, S3_brown module, and S3_green module are mainly distributed between 50 and 100, respectively. And the degree distribution of each module conforms to the power law distribution. The betweenness centrality of most nodes in each module is at a high level. The closeness centrality of most nodes in each module ranges from 0.5 to 0.9. These values indicate that the network corresponding to each module is a dense graph, so the hub genes screened by these three parameters are all core genes.
We use Metascape to perform the joint enrichment analysis on the genes in the seven specific modules, and set p-value cut-off 0.01. The joint enrichment results are shown in Figure 4. The most significant enrichment item for each module is shown in Table 2. According to Figure 4 and Table 2, S1_turquoise, S2_turquoise, and S3_turquoise modules are roughly identical, and these significant pathways are all related to cell transcription and cycle regulation. S3_green, S1_brown, S1_blue, and S3_brown modules are closely related to each other, and these significant pathways are mainly related to gene transcription. In addition, transcription regulation complex (GO:0005667) and chromatin binding (GO:0003682) are the common enrichment items of the seven specific modules. The results show that the stage-specific modules have strong functionality and the genes within the modules are highly correlated.
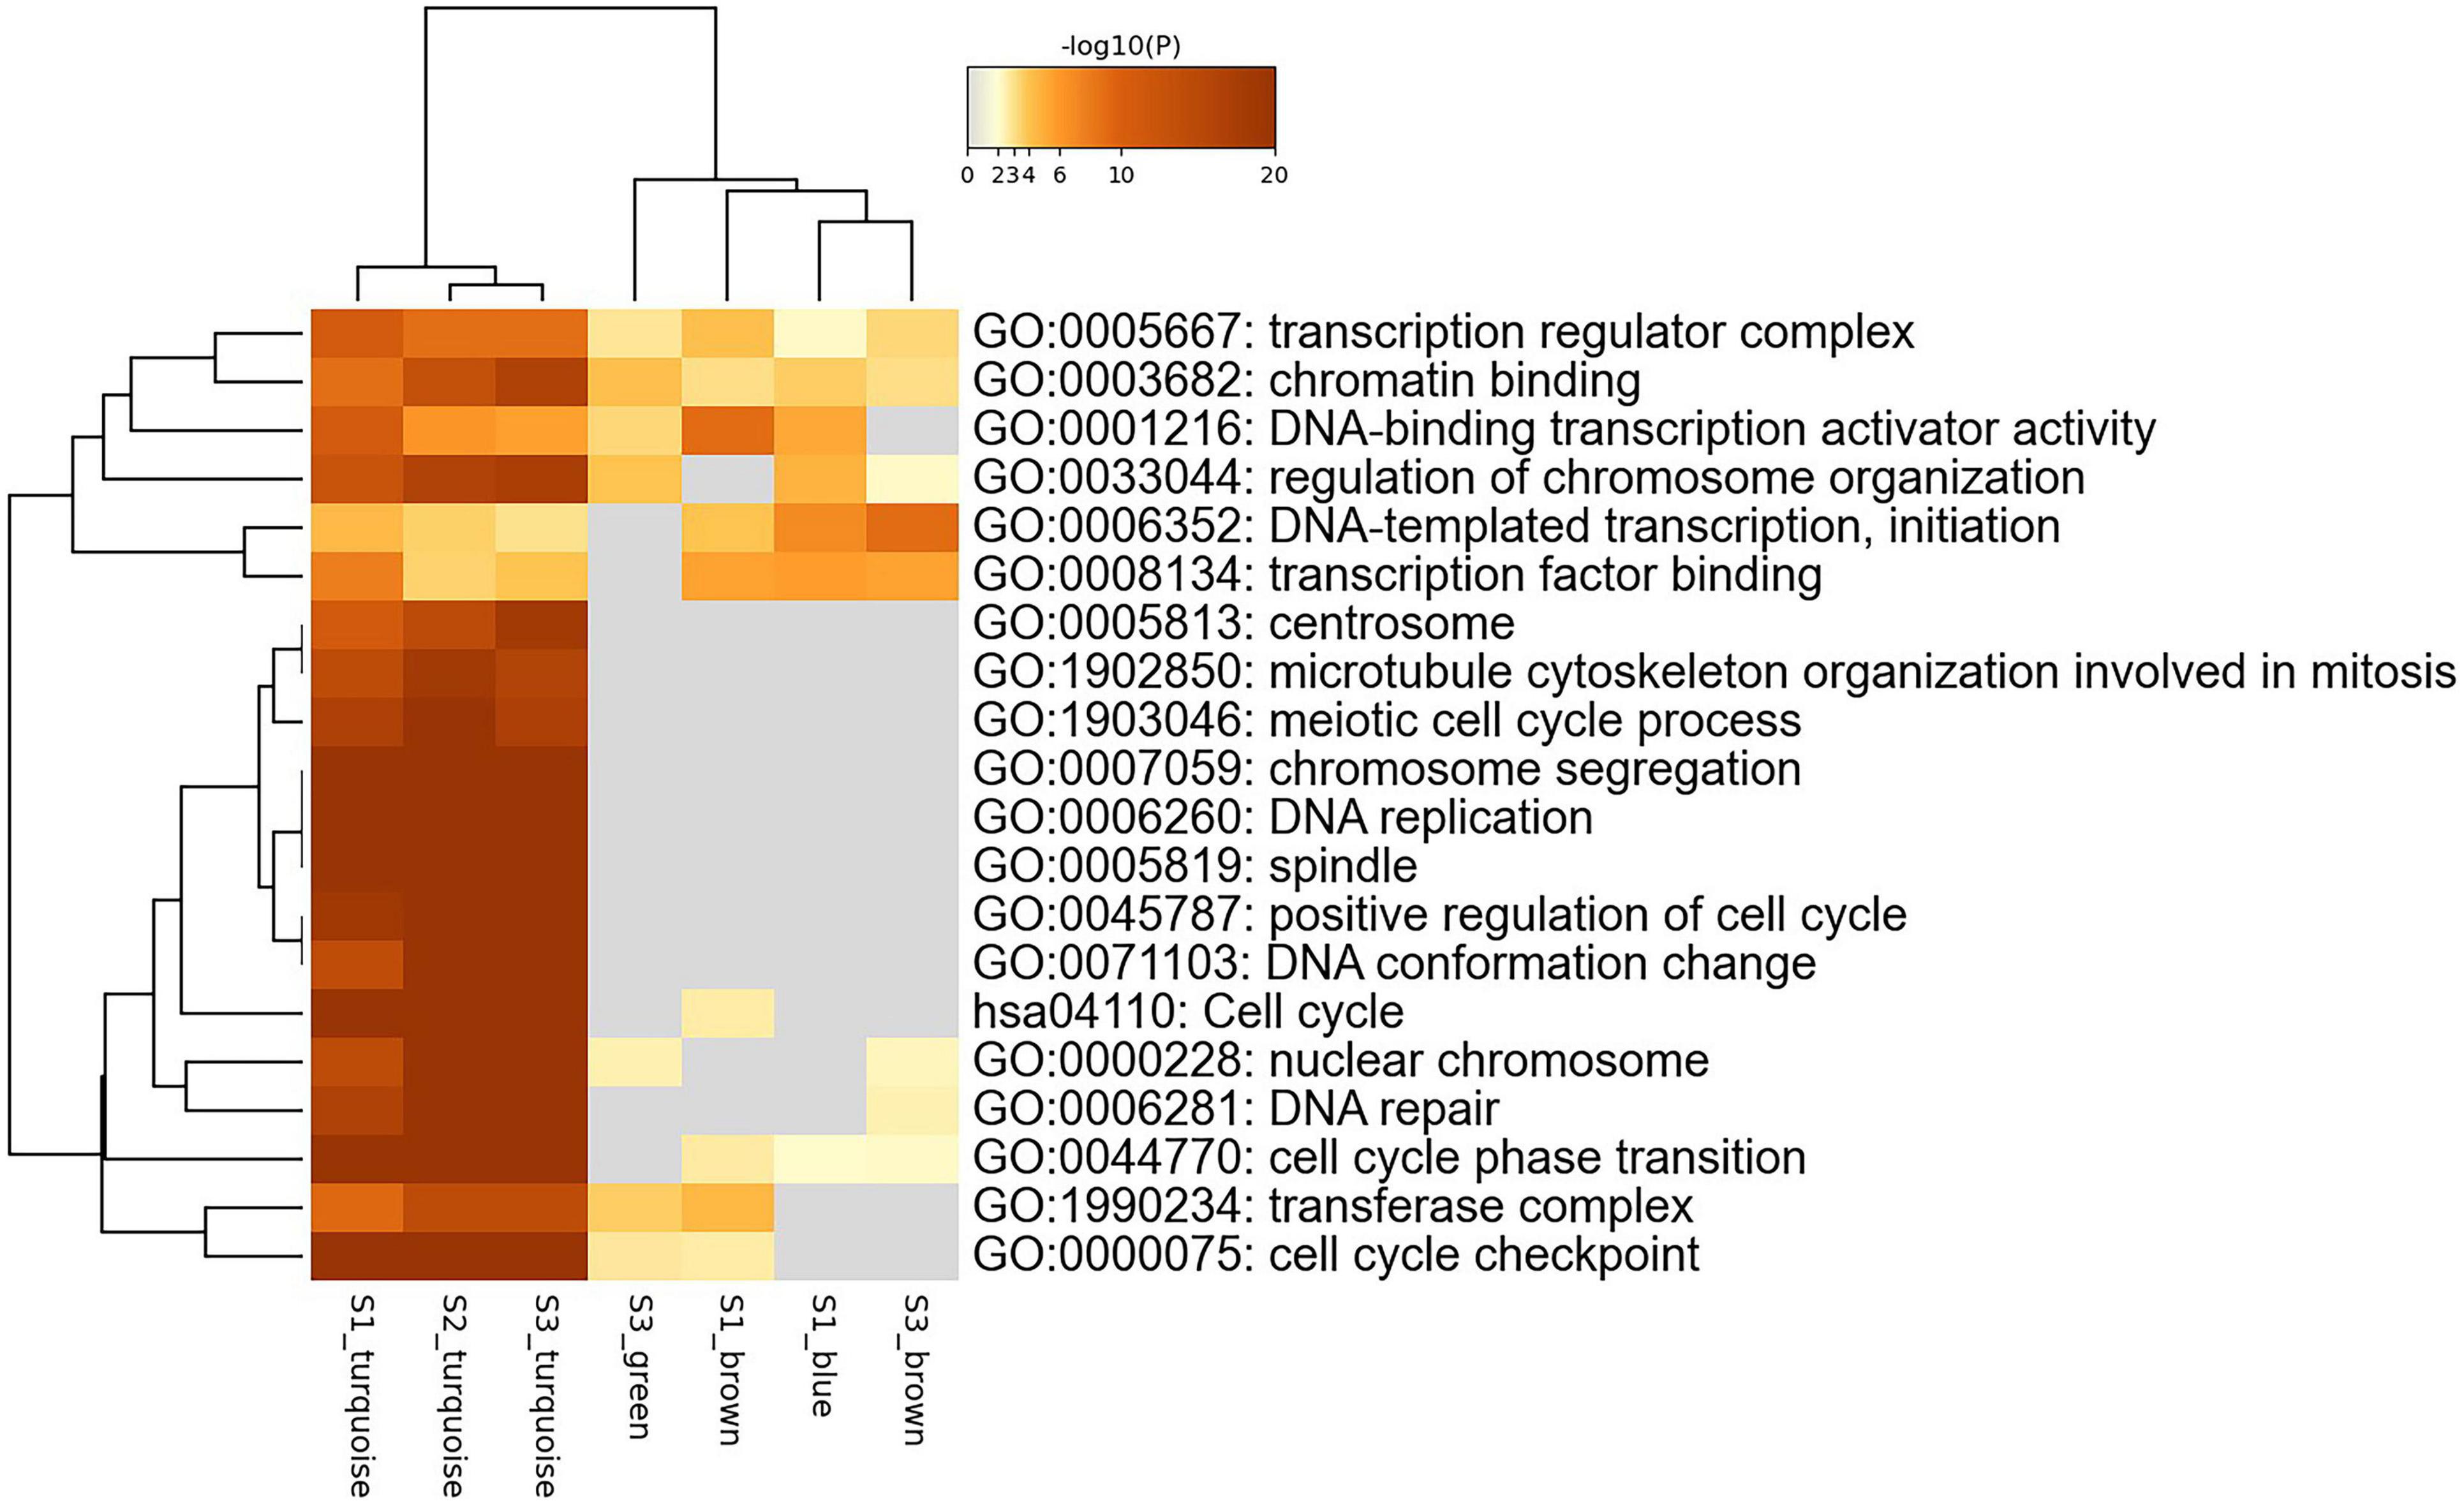
Figure 4. Joint enrichment analysis of seven specific modules.
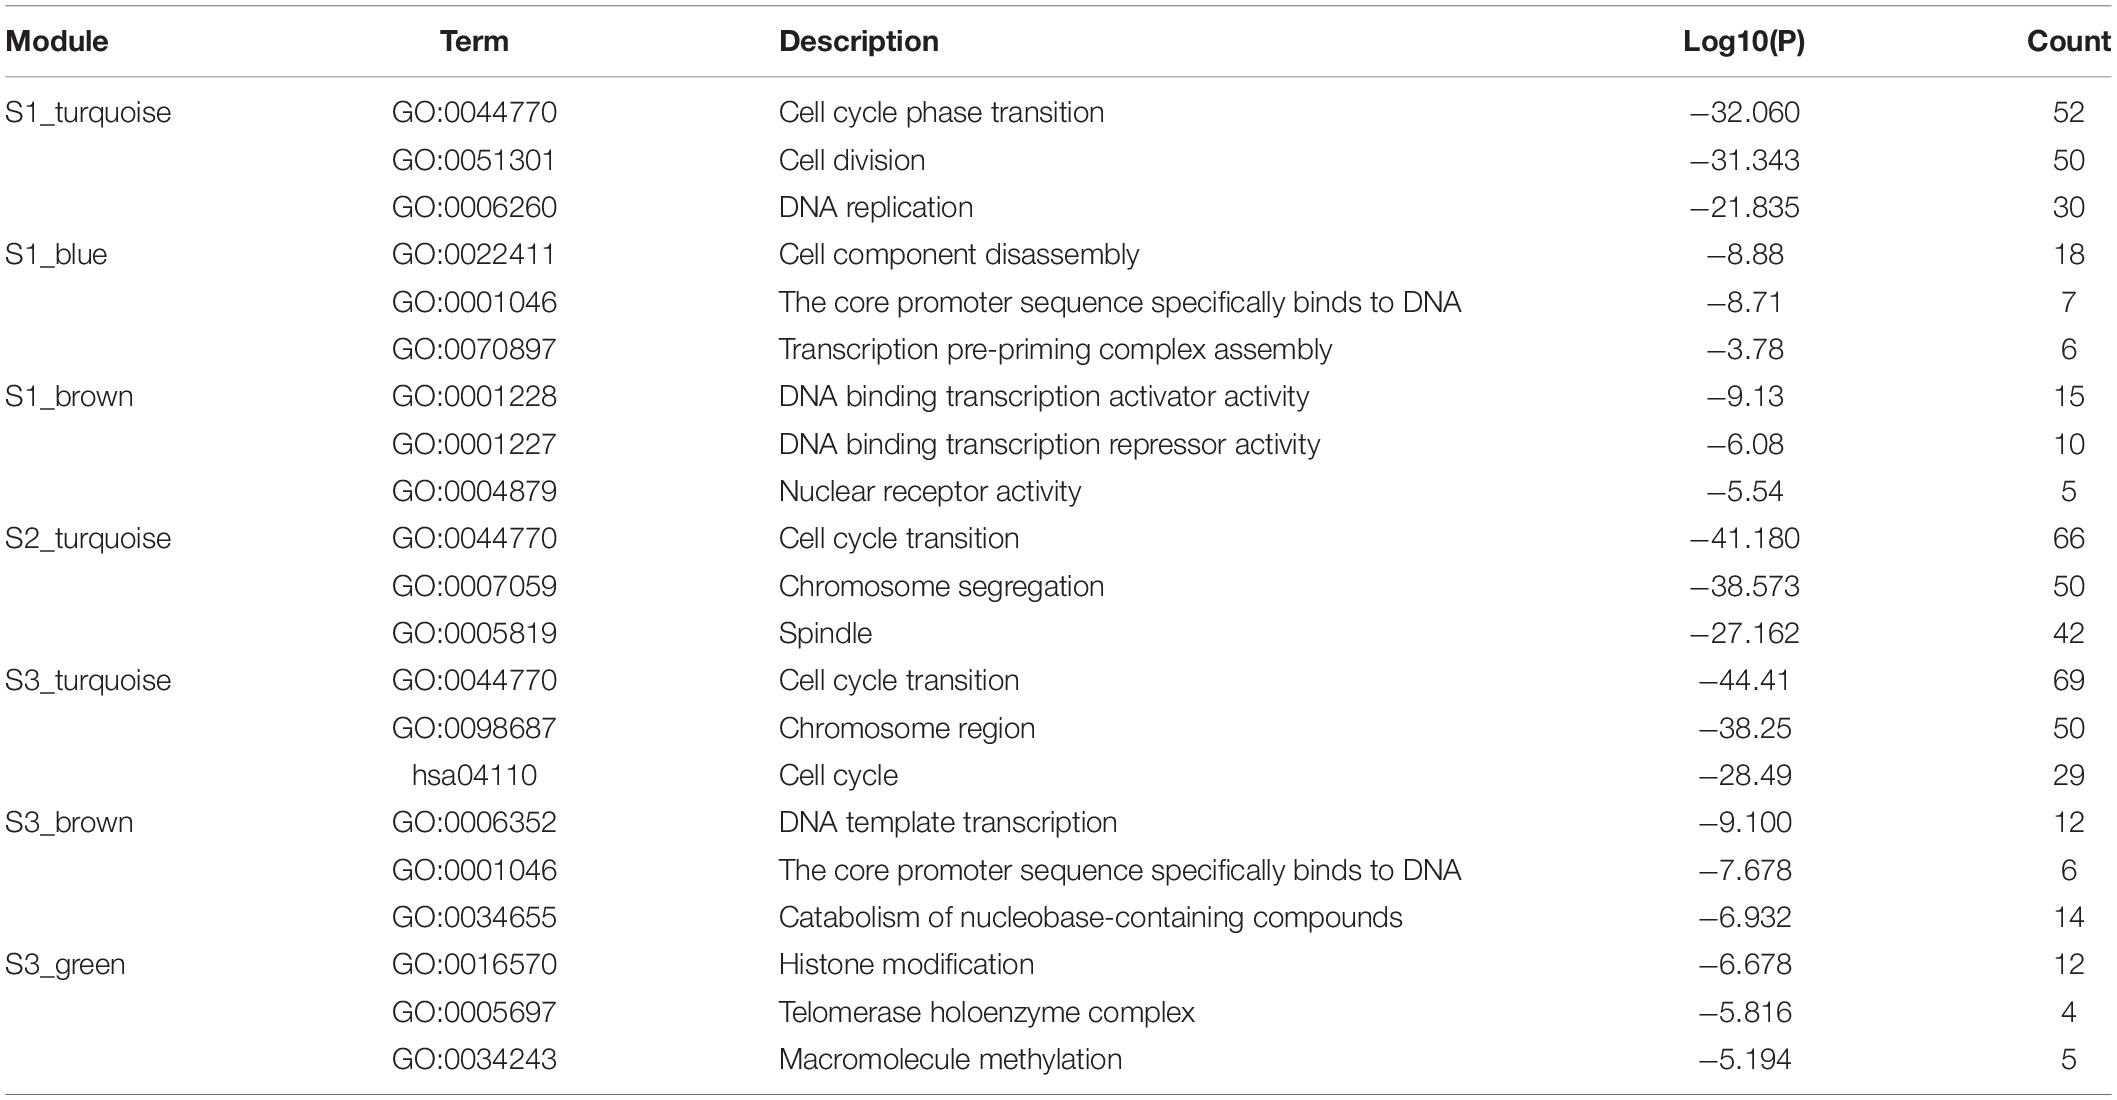
Table 2. Functional enrichment analysis.
Candidate Disease Gene Prediction
We predict disease genes based on correlation matrix and network topological properties. Firstly, we calculate the correlation matrix of genes at each specific module, and select genes with correlation cut-off 0.8 and p-value cut-off 0.05 as the core genes of each module. Then, we sort the degree distribution, betweenness centrality and closeness centrality of each gene in the seven modules, and select the top 5% as the core gene of each module. The intersection of core genes selected by these two methods are considered as candidate disease genes.
We obtain 20 candidate disease genes in stage I, such as E2F2, E2F8, TPX2, etc., 12 genes in stage II, such as KPNA2, CKAP2L, CBX3, etc., and 22 genes in stage III, such as RAD21, FBXO5, CCNE2, etc. A complete gene list of each stage is shown in Table 3. E2F2, CKAP2L and CBX3 are genes shared by three stages. For the remaining candidate genes at different stages, we compare their gene expression data and find that they are indeed different at different stages. And the results are shown in the Supplementary Figures 1∼2.
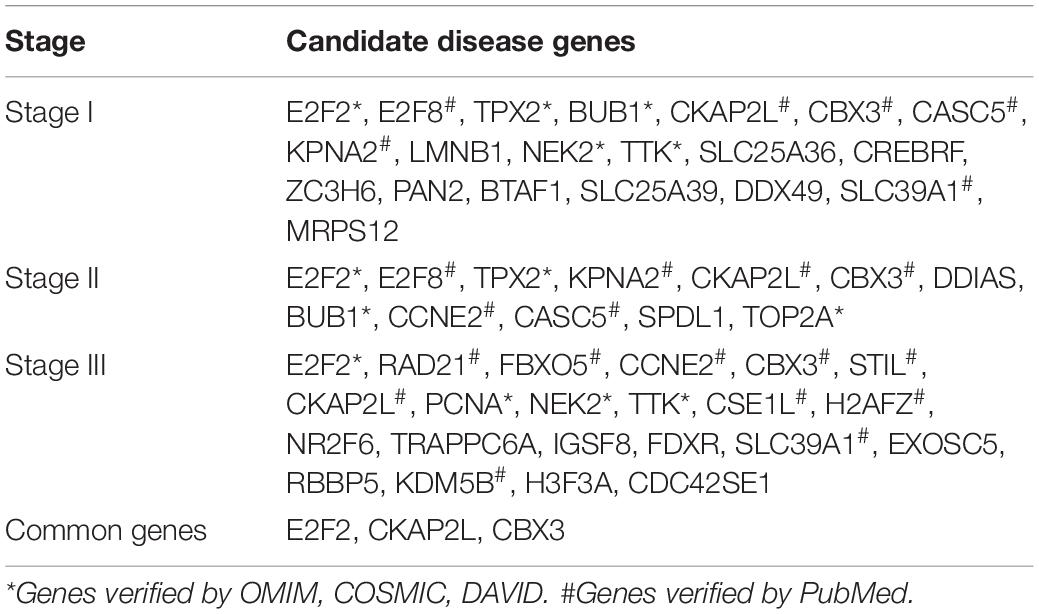
Table 3. Candidate disease genes at each stage.
Candidate Disease Gene Verification
In order to determine whether the selected candidate disease genes are effective in the diagnosis and treatment of breast cancer, we use OMIM, COSMIC, and DAVID to verify the candidate genes, and obtain seven genes related to breast cancer. BUB1 is mitotic checkpoint serine, E2F2 is a transcription activator, NEK2 is a serine/threonine-protein kinase, TPX2 is the target protein for Xklp2, TTK is essential for spindle establishment and centrosome replication, PCNA is the proliferating cell nuclear antigen, and TOP2A is DNA topoisomerase 2-alpha. Most of these genes are related to cell proliferation and transcription.
We search the rest candidate disease genes related to the genes in PubMed, and verify whether the genes are related to breast cancer. Kos et al. (2020) found STIL is an important prognostic and predictive biomarker for triple-negative breast cancer and HER2-positive breast cancer. At present, there have been studies on pathological assessment of breast cancer based on STIL, which is a key step for molecular markers to move toward clinical treatment. Based on the study of differentially expressed hub genes, Qi et al. (2019) proposed that the overexpression of CCNE2, H2AFZ, TOP2A is closely related to the diagnosis and poor prognosis of breast cancer. Yuksel et al. (2015) found the overexpression of CSE1L has a certain relationship with the distant metastasis of breast cancer and may be a valuable prognostic tool. Tang J. et al. (2018) used WGCNA to construct a co-expression network and found FBXO5 and TPX2 are related to the poor prognosis of breast cancer. Liang et al. (2017) found CBX family proteins have epigenetic regulatory functions, among which the high expression of CBX3 is related to the worsening of recurrence-free survival rate of breast cancer patients. Liu et al. (2018) found E2Fs are transcription factors that affect cell proliferation, differentiation and apoptosis, and the high expression of E2F8 is also related to the deterioration of patients’ recurrence-free survival rate, and can be used as a potential target for individualized treatment of breast cancer patients. Zhang et al. (2019) showed that KDM5B is up-regulated in breast cancer and many other cancers and its expression is positively correlated with breast cancer metastasis. Duan et al. (2020) and Liu et al. (2020) showed the expression of KPNA2 and SLC39A1 in breast cancer tissues is significantly up-regulated, which can regulate the development of breast cancer and provide new targets for breast cancer treatment. NEK2 is a kind of serine, which plays an important role in mitosis. Cappello et al. (2014) and Chen et al. (2020) have proven NEK2 is a target for breast cancer. Atienza et al. (2005) has shown through experiments that RAD21 can enhance the anti-tumor activity of chemotherapeutics by inducing DNA damage and is a new target for cancer drugs. Based on survival analysis and mutation analysis, Fu et al. (2019) found that the high expression of CKAP2L and CASC5 is closely related to the poor prognosis of breast cancer patients. These verified genes are shown in Table 3.
In summary, we detect 20, 12, and 22 candidate disease genes for three stages, respectively. Through PubMed search, 11, 10, and 14 genes are verified, respectively. That is 55%, 83%, and 64% of the candidate disease genes are proved to be related to the diagnosis and treatment of breast cancer, respectively, such as E2F2, E2F8, TPX2, BUB1, CKAP2L, etc. The results show the effectiveness of our computational framework for predicting disease genes.
We also use GSE15852 gene expression profile and GSE69914 DNA methylation profile to verify the validity of the proposed computational framework. Firstly, we screen out 79 differentially expressed genes and hypermethylated/hypomethylated genes. Secondly, we combine with the TF-target gene pairs and construct a gene regulatory network with 195 nodes and 313 edges. Thirdly, we divide the gene regulatory network into four modules: 76 genes in turquoise module, 68 genes in blue module, 18 genes in gray module, and 33 genes in brown module, respectively. In particular, the gray module contains genes that are not classified into any module and discarded. Finally, we screen the candidate disease genes of each module based on correlation matrix and network topological properties, and obtain four genes in turquoise module, four genes in blue module, and two genes in brown module, respectively. In detail, these genes are H2AFZ, NPM1, MAF, NR3C1, PTGER3, TCF4, IRF1, RARB, CHD2, and SMAD4. Except PTGER3 and CHD2, other genes have been verified. This means that our method is effective, and it may help experts explore breast cancer related genes.
Discussion
At present, the proposed computational framework has only been tested on breast cancer, and satisfactory results have been obtained. In the future, we will try to apply this framework to other types of diseases for discovering more disease-related genes.
Conclusion
We propose a computational framework to predict candidate stage-specific disease genes for breast cancer based on stage-specific gene regulatory networks. And we conduct experiments using two breast cancer data sets and find that most predicted genes are related to breast cancer, which shows that our method is effective. We also predict some candidate disease genes that need to be further verified. Nevertheless, our research has some limitations. Our proposed computational framework is based on the public TCGA and GEO datasets, and the noise affects the analysis results. Another limitation is that we should integrate more omics data so that more disease genes may be predicted more accurately.
Data Availability Statement
The original contributions presented in the study are included in the article/Supplementary Material, further inquiries can be directed to the corresponding author.
Ethics Statement
Ethical review and approval was not required for the study on human participants in accordance with the Local Legislation and Institutional Requirements. Written informed consent for participation was not required for this study in accordance with the National Legislation and the Institutional Requirements.
Author Contributions
JH and LF conceived and developed the computational framework for predicting disease genes and wrote the manuscript. GQ provided important feedback in the framework process and edited the manuscript. All authors have made significant contributions to the completion and writing of the manuscript and read and approved the final manuscript.
Funding
This study was supported by the Natural Science Foundation of Shaanxi Province (No. 2017JM6038) and National Key Research and Development Program of China (2018YFC0116500).
Conflict of Interest
The authors declare that the research was conducted in the absence of any commercial or financial relationships that could be construed as a potential conflict of interest.
Supplementary Material
The Supplementary Material for this article can be found online at: https://www.frontiersin.org/articles/10.3389/fgene.2021.717557/full#supplementary-material
Supplementary Figures 1∼2 | The gene expression boxplot of different candidate disease genes at different stages.
References
Atienza, J. M., Roth, R. B., Rosette, C., Smylie, K. J., Kammerer, S., Rehbock, J., et al. (2005). Suppression of RAD21 gene expression decreases cell growth and enhances cytotoxicity of etoposide and bleomycin in human breast cancer cells. Mol. Cancer Ther. 4, 361–368. doi: 10.1158/1535-7163.mct-04-0241
Barrett, T., Suzek, T. O., Troup, D. B., Wilhite, S. E., Ngau, W. C., Ledoux, P., et al. (2005). NCBI GEO: mining millions of expression profiles–database and tools. Nucleic Acids Res. 33, D562–D566. doi: 10.1093/nar/gki022
Bediaga, N. G., Acha-Sagredo, A., Guerra, I., Viguri, A., Albaina, C., Ruiz Diaz, I., et al. (2010). DNA methylation epigenotypes in breast cancer molecular subtypes. Breast Cancer Res. 12:R77. doi: 10.1186/bcr2721
Cai, Y., Mei, J., Xiao, Z., Xu, B. J., Jiang, X. Z., Zhang, Y. J., et al. (2019). Identification of five hub genes as monitoring biomarkers for breast cancer metastasis in silico. Hereditas 156:20.
Cappello, P., Blaser, H., Gorrini, C., Lin, D. C., Elia, A. J., Wakeham, A., et al. (2014). Role of Nek2 on centrosome duplication and aneuploidy in breast cancer cells. Oncogene 33, 2375–2384. doi: 10.1038/onc.2013.183
Chen, Y. W., Wu, N., Liu, L., Dong, H. Y., and Liu, X. A. (2020). microRNA-128-3p overexpression inhibits breast cancer stem cell characteristics through suppression of Wnt signalling pathway by down-regulating NEK2. J. Cell. Mol. Med. 24, 7353–7369. doi: 10.1111/jcmm.15317
De Almeida, B. P., Apolonio, J. D., Binnie, A., and Castelo-Branco, P. (2019). Roadmap of DNA methylation in breast cancer identifies novel prognostic biomarkers. BMC Cancer 19:219. doi: 10.1186/s12885-019-5403-0
Duan, M., Hu, F., Li, D., Wu, S., and Peng, N. (2020). Silencing KPNA2 inhibits IL-6-induced breast cancer exacerbation by blocking NF-kappaB signaling and c-Myc nuclear translocation in vitro. Life Sci. 253:117736. doi: 10.1016/j.lfs.2020.117736
Fang, L., Li, Y., Ma, L., Xu, Q., Tan, F., Chen, G., et al. (2020). GRNdb: decoding the gene regulatory networks in diverse human and mouse conditions. Nucleic Acids Res. 49, D97–D103. doi: 10.1093/nar/gkaa995
Fu, Y., Zhou, Q. Z., Zhang, X. L., Wang, Z. Z., and Wang, P. (2019). Identification of hub genes using co-expression network analysis in breast cancer as a tool to predict different stages. Med. Sci. Monit. 25, 8873–8890. doi: 10.12659/Msm.919046
Guo, X., Xiao, H., Guo, S., Dong, L., and Chen, J. (2017). Identification of breast cancer mechanism based on weighted gene coexpression network analysis. Cancer Gene Ther. 24, 333–341. doi: 10.1038/cgt.2017.23
Hamosh, A., Scott, A. F., Amberger, J. S., Bocchini, C. A., and McKusick, V. A. (2005). Online mendelian inheritance in man (OMIM), a knowledgebase of human genes and genetic disorders. Nucleic Acids Res. 33, D514–D517. doi: 10.1093/nar/gki033
Huang, D. W., Sherman, B. T., and Lempicki, R. A. (2009). Systematic and integrative analysis of large gene lists using DAVID bioinformatics resources. Nat. Protoc. 4, 44–57. doi: 10.1038/nprot.2008.211
Jiao, Y., Widschwendter, M., and Teschendorff, A. E. (2014). A systems-level integrative framework for genome-wide DNA methylation and gene expression data identifies differential gene expression modules under epigenetic control. Bioinformatics 30, 2360–2366. doi: 10.1093/bioinformatics/btu316
Kos, Z., Roblin, E., Kim, R. S., Michiels, S., Gallas, B. D., Chen, W. J., et al. (2020). Pitfalls in assessing stromal tumor infiltrating lymphocytes (sTILs) in breast cancer. NPJ Breast Cancer 6:17. doi: 10.1038/s41523-020-0156-0
Langfelder, P., and Horvath, S. (2008). WGCNA: an R package for weighted correlation network analysis. BMC Bioinformatics 9:559. doi: 10.1186/1471-2105-9-559
Langfelder, P., Zhang, B., and Horvath, S. (2008). Defining clusters from a hierarchical cluster tree: the dynamic tree cut package for R. Bioinformatics 24, 719–720. doi: 10.1093/bioinformatics/btm563
Liang, Y. K., Lin, H. Y., Chen, C. F., and Zeng, D. (2017). Prognostic values of distinct CBX family members in breast cancer. Oncotarget 8, 92375–92387. doi: 10.18632/oncotarget.21325
Lin, Y. X., Fu, F. M., Lv, J. X., Wang, M. C., Li, Y., Zhang, J., et al. (2020). Identification of potential key genes for HER-2 positive breast cancer based on bioinformatics analysis. Medicine 99:e18445. doi: 10.1097/md.0000000000018445
Liu, J., Li, H., Sun, L., Wang, Z., Xing, C., and Yuan, Y. (2017). Aberrantly methylated-differentially expressed genes and pathways in colorectal cancer. Cancer Cell Int. 17:75.
Liu, L., Yang, J., and Wang, C. (2020). Analysis of the prognostic significance of solute carrier (SLC) family 39 genes in breast cancer. Biosci. Rep. 40:BSR20200764. doi: 10.1042/BSR20200764
Liu, Z. L., Bi, X. W., Liu, P. P., Lei, D. X., Wang, Y., Li, Z. M., et al. (2018). Expressions and prognostic values of the E2F transcription factors in human breast carcinoma. Cancer Manag. Res. 10, 3521–3532. doi: 10.2147/CMAR.S172332
Lu, D. G., Ma, Y. M., Zhu, A. J., and Han, Y. W. (2017). An early biomarker and potential therapeutic target of RUNX 3 hypermethylation in breast cancer, a system review and meta-analysis. Oncotarget 8, 22166–22174. doi: 10.18632/oncotarget.13125
Qi, L. N., Zhou, B. T., Chen, J. N., Hu, W. X., Bai, R., Ye, C. Y., et al. (2019). Significant prognostic values of differentially expressed-aberrantly methylated hub genes in breast cancer. J. Cancer 10, 6618–6634. doi: 10.7150/jca.33433
Qin, G., Yang, L., Ma, Y., Liu, J., and Huo, Q. (2019). The exploration of disease-specific gene regulatory networks in esophageal carcinoma and stomach adenocarcinoma. BMC Bioinformatics 20(Suppl. 22):717. doi: 10.1186/s12859-019-3230-6
Qiu, J., Du, Z., Wang, Y., Zhou, Y., Zhang, Y., Xie, Y., et al. (2019). Weighted gene co-expression network analysis reveals modules and hub genes associated with the development of breast cancer. Medicine 98:e14345. doi: 10.1097/MD.0000000000014345
Ritchie, M. E., Phipson, B., Wu, D., Hu, Y. F., Law, C. W., Shi, W., et al. (2015). limma powers differential expression analyses for RNA-sequencing and microarray studies. Nucleic Acids Res. 43:e47. doi: 10.1093/nar/gkv007
Shannon, P., Markiel, A., Ozier, O., Baliga, N. S., Wang, J. T., Ramage, D., et al. (2003). Cytoscape: a software environment for integrated models of biomolecular interaction networks. Genome Res. 13, 2498–2504. doi: 10.1101/gr.1239303
Shashikiran, N. D. (2016). Medline, pubmed, and pubmed central ((R)): analogous or dissimilar. J. Indian Soc. Pedod. Prev. Dent. 34, 197–198. doi: 10.4103/0970-4388.186748
Siegel, R. L., Miller, K. D., Fuchs, H. E., and Jemal, A. (2021). Cancer statistics, 2021. CA Cancer J. Clin. 71, 7–33. doi: 10.3322/caac.21654
Sondka, Z., Bamford, S., Cole, C. G., Ward, S. A., Dunham, I., and Forbes, S. A. (2018). The COSMIC cancer gene census: describing genetic dysfunction across all human cancers. Nat. Rev. Cancer 18, 696–705. doi: 10.1038/s41568-018-0060-1
Tang, J. N., Kong, D. G., Cui, Q. X., Wang, K., Zhang, D., Gong, Y., et al. (2018). Prognostic genes of breast cancer identified by gene co-expression network analysis. Front. Oncol. 8:374. doi: 10.3389/fonc.2018.00374
Tang, J., Kong, D., Cui, Q., Wang, K., Zhang, D., Gong, Y., et al. (2018). Prognostic genes of breast cancer identified by gene co-expression network analysis. Front. Oncol. 8:374.
Tang, Q. Q., Cheng, J., Cao, X., Surowy, H., and Burwinkel, B. (2016). Blood-based DNA methylation as biomarker for breast cancer: a systematic review. Clin. Epigenet. 8:115.
Tomczak, K., Czerwinska, P., and Wiznerowicz, M. (2015). The Cancer Genome Atlas (TCGA): an immeasurable source of knowledge. Contemp. Oncol. 19, A68–A77. doi: 10.5114/wo.2014.47136
Wild, C. P., Weiderpass, E., and Stewart, B. W. (2020). World Cancer Report: Cancer Research for Cancer Prevention. Lyon: International Agency for Research on Cancer.
Xi, J., Li, A., and Wang, M. (2018a). A novel unsupervised learning model for detecting driver genes from pan-cancer data through matrix tri-factorization framework with pairwise similarities constraints. Neurocomputing 296, 61–73.
Xi, J., Wang, M., and Li, A. (2018b). Discovering mutated driver genes through a robust and sparse co-regularized matrix factorization framework with prior information from mRNA expression patterns and interaction network. BMC Bioinformatics 19:214. doi: 10.1186/s12859-018-2218-y
Xi, J., Yuan, X., Wang, M., Li, A., Li, X., and Huang, Q. (2020). Inferring subgroup-specific driver genes from heterogeneous cancer samples via subspace learning with subgroup indication. Bioinformatics 36, 1855–1863. doi: 10.1093/bioinformatics/btz793
Yuksel, U. M., Turker, I., Dilek, G., Dogan, L., Gulcelik, M. A., and Oksuzoglu, B. (2015). Does CSE1L overexpression affect distant metastasis development in breast cancer? Oncol. Res. Treat. 38, 431–434. doi: 10.1159/000438501
Zhang, Z. G., Zhang, H. S., Sun, H. L., Liu, H. Y., Liu, M. Y., and Zhou, Z. (2019). KDM5B promotes breast cancer cell proliferation and migration via AMPK-mediated lipid metabolism reprogramming. Exp. Cell Res. 379, 182–190. doi: 10.1016/j.yexcr.2019.04.006
Keywords: breast cancer, DNA methylation, differentially expressed genes, stage-specific gene regulatory networks, WGCNA
Citation: Fan L, Hou J and Qin G (2021) Prediction of Disease Genes Based on Stage-Specific Gene Regulatory Networks in Breast Cancer. Front. Genet. 12:717557. doi: 10.3389/fgene.2021.717557
Received: 31 May 2021; Accepted: 24 June 2021;
Published: 15 July 2021.
Edited by:
Jianing Xi, Northwestern Polytechnical University, ChinaReviewed by:
Wenbin Liu, Guangzhou University, ChinaJunyi Li, Harbin Institute of Technology, China
Henry Han, Fordham University, United States
Copyright © 2021 Fan, Hou and Qin. This is an open-access article distributed under the terms of the Creative Commons Attribution License (CC BY). The use, distribution or reproduction in other forums is permitted, provided the original author(s) and the copyright owner(s) are credited and that the original publication in this journal is cited, in accordance with accepted academic practice. No use, distribution or reproduction is permitted which does not comply with these terms.
*Correspondence: Guimin Qin, Z21xaW5AbWFpbC54aWRpYW4uZWR1LmNu