 Dawei Wang1,2
 Guangxin Wang
94% of researchers rate our articles as excellent or good
Learn more about the work of our research integrity team to safeguard the quality of each article we publish.
Find out more
ORIGINAL RESEARCH article
Front. Genet. , 06 September 2021
Sec. Computational Genomics
Volume 12 - 2021 | https://doi.org/10.3389/fgene.2021.709666
Background: Low-grade glioma (LGG) is a heterogeneous tumor that might develop into high-grade malignant glioma, which markedly reduces patient survival time. Endocytosis is a cellular process responsible for the internalization of cell surface proteins or external materials into the cytosol. Dysregulated endocytic pathways have been linked to all steps of oncogenesis, from initial transformation to late invasion and metastasis. However, endocytosis-related gene (ERG) signatures have not been used to study the correlations between endocytosis and prognosis in cancer. Therefore, it is essential to develop a prognostic model for LGG based on the expression profiles of ERGs.
Methods: The Cancer Genome Atlas and the Genotype-Tissue Expression database were used to identify differentially expressed ERGs in LGG patients. Gene ontology, Kyoto Encyclopedia of Genes and Genomes, and Gene set enrichment analysis methodologies were adopted for functional analysis. A protein-protein interaction (PPI) network was constructed and hub genes were identified based on the Search Tool for the Retrieval of Interacting Proteins database. Univariate and multivariate Cox regression analyses were used to develop an ERG signature to predict the overall survival (OS) of LGG patients. Finally, the association between the ERG signature and gene mutation status was further analyzed.
Results: Sixty-two ERGs showed distinct mRNA expression patterns between normal brain tissues and LGG tissues. Functional analysis indicated that these ERGs were strikingly enriched in endosomal trafficking pathways. The PPI network indicated that EGFR was the most central protein. We then built a 29-gene signature, dividing patients into high-risk and low-risk groups with significantly different OS times. The prognostic performance of the 29-gene signature was validated in another LGG cohort. Additionally, we found that the mutation scores calculated based on the TTN, PIK3CA, NF1, and IDH1 mutation status were significantly correlated with the endocytosis-related prognostic signature. Finally, a clinical nomogram with a concordance index of 0.881 predicted the survival probability of LGG patients by integrating clinicopathologic features and ERG signatures.
Conclusion: Our ERG-based prediction models could serve as an independent prognostic tool to accurately predict the outcomes of LGG.
Glioma is the most common malignant tumor in the central nervous system among histological subtypes of brain tumors (Louis et al., 2007). Gliomas are classified into four grades based on their clinical and histopathological characteristics (Louis et al., 2016; Barnholtz-Sloan et al., 2018). Grade I and Grade II gliomas are regarded as low-grade gliomas (LGGs) and include pilocytic astrocytomas, diffuse astrocytomas, and oligodendrogliomas; Grade III and Grade VI gliomas are considered as high-grade gliomas and include anaplastic astrocytomas, anaplastic oligodendrogliomas, and glioblastoma multiforme (GBM). GBM is the most frequent cancer in the adult brain, with a 5-year survival rate of less than 10% (Preusser et al., 2011; Ostrom et al., 2018). LGG is considered a comparatively benign tumor. It has a 5-year survival rate of 59.9% (Claus and Black, 2006). However, 70% of LGG patients are likely to develop GBM within 5–10 years (Furnari et al., 2007). Currently, gliomas are primarily detected based on pathological features or by imaging-based methods such as CT, MRI, and PET, etc., the reliability of which is mainly dependent on the surgeon’s experience (Mörén et al., 2015; Yang et al., 2019). These tests or examinations may not detect gliomas initially; thus, the chance to use surgical treatment strategies is missed, leading to more patient deaths. At the molecular level, O-6-methylguanine- DNA methyltransferase promoter methylation, EGFR alterations, IDHI or IDH2 mutation, and 1p19q codeletion are tested to diagnose gliomas (Rodriguez et al., 2016). However, these markers are less sensitive and specific for detecting gliomas at an early stage. Thus, it is imperative to discover effective diagnostic and prognostic models to detect and predict the prognosis of LGG.
Endocytosis is an evolutionarily conserved cellular process by which molecules are actively transported into the cell via engulfment with the membrane (Doherty and McMahon, 2009). Endocytic cargo, including extracellular molecules, plasma membrane proteins, or membrane lipids, can be internalized through the eukaryotic cell surface by a clathrin-dependent or clathrin-independent process (Mayor and Pagano, 2007; McMahon and Boucrot, 2011). The endosomal trafficking system comprises a series of dynamically interconnected membrane-enclosed vesicular structures, including early endosomes, recycling endosomes, and late endosomes, which are vital for maintaining cellular homeostasis and energy recycling (Di Fiore and von Zastrow, 2014; Scott et al., 2014). Once inside cells, these vesicles are subjected to various homotypic fusion events to form early endosomes, which can act as the primary sorting hub. For example, essential receptors can be recycled back from early endosomes to the plasma membrane, whereas others can be transported to the trans-Golgi network or late endosomes; late endosomes would fuse with lysosomes to form endolysosomes where most of the endosomal cargoes are degraded (Di Fiore and von Zastrow, 2014; Scott et al., 2014). The maturation, sorting, and trafficking events of these vesicles are precisely controlled by RAB small GTPases and their effectors and membrane tethering complexes, as well as by phosphatidylinositol phospholipids and their catalyzing enzymes (Pfeffer, 2017; Wallroth and Haucke, 2018; Ungermann and Kümmel, 2019). However, dysfunction of these regulators results in a dysregulated endocytosis phenotype, which has emerged as a multifaceted cancer cell hallmark (Mosesson et al., 2008). In addition, cancer cells undergo constitutive endocytosis more rapidly than the paired noncancerous cells, thereby providing more nutrients and signaling support (Mellman and Yarden, 2013). For example, cancer cell growth is regulated by growth hormone receptors, whose amounts are controlled by endocytosis (Mellman and Yarden, 2013); activated receptor tyrosine kinases (RTK)-ligand complexes, e.g., EGFR-EGF, could activate its downstream targets, such as MEK–ERK pathway, to promote cell growth (Roberts and Der, 2007). Interestingly, their internalization from the cell surface and degradation in the lysosomes are controlled by endocytosis (Goh and Sorkin, 2013); therefore, abnormal endocytosis could influence cell survival and proliferation via affecting the initiation and termination of the RTK related signal cascades.
There are many signaling pathways, such as autophagy, immune microenvironment, and epigenetic modifications, involved in tumorigenesis and development. Several papers had already established the association of those signalings with the LGG prognosis (Tu et al., 2020; Zhang et al., 2020; Chen et al., 2021). Although numerous studies have reported the relationship of endocytosis with cancer development, prognostic models for endocytosis-related genes (ERGs) in cancer have not been investigated. Since the dysregulation of the endocytosis pathway or its regulatory genes has been observed in LGG (Zhou et al., 2017; Liu et al., 2020), and some ERGs have exhibited their potential to predict the OS of LGG patients (An et al., 2020); therefore, it is reasonable to suppose that ERGs hold great promise for predicting the prognosis of LGG. In this work, we identified the differential ERGs between LGG samples and matched normal brain samples by analyzing high-throughput mRNA data downloaded from The Cancer Genome Atlas (TCGA) and the Genotype-Tissue Expression (GTEx) database. Gene ontology (GO) functional and Kyoto Encyclopedia of Genes and Genomes (KEGG) pathway analyses, as well as PPI network analysis, were performed with the differential ERGs. Additionally, we established an endocytosis-related risk signature that contains 29 ERGs, which can be used to evaluate the prognosis of LGG patients. Moreover, we identified the ten most frequently mutated genes identified in LGG patients and found that TTN, PIK3CA, NF1, and IDH1 based mutation scores could predict prognosis and were positively correlated with the endocytosis-related prognostic signature. Finally, a clinical nomogram with a concordance index of 0.881 was constructed by combining clinicopathologic features and ERG signatures to predict the survival probability of LGG patients.
Endocytosis-related genes were retrieved by searching the GeneCards website1 with the term “endosome.” A relevance score ranging from 0 to 100 was used to indicate the correlation between genes and endosomal activity. Higher scores indicated stronger associations. Genes with an association score >1 were collected; after manual filtering, 676 genes were finally included in the ERGs set.
The GTEx and TCGA gene expression data, which contain 1,152 normal tissue samples and 523 tumor samples, respectively, were downloaded from UCSC Toil RNAseq Recompute Compendium2, in which all raw RNA-Seq data are re-computed based on a uniform pipeline (Vivian et al., 2017; Goldman et al., 2020). The mRNA-array_301 dataset, which comprises 156 LGG patients’ samples, was obtained from the Chinese Glioma Genome Atlas (CGGA)3 for validation studies.
The differential expression of ERGs between LGG and normal brain tissues was analyzed using the limma package in R, with the following thresholds: |log2 fold change (FC)| > 1 and adjusted P-value < 0.05. Then, GO enrichment analysis was performed to identify the significant biological attributes of differentially expressed ERGs (DEERGs) by using the “ggplot2” and “enrichplot” packages in R.
The Search Tool for the Retrieval of Interacting Proteins (STRING) online database4 and Cytoscape software5 were used to identify hub genes and visualize the protein-protein interactions (PPIs) of the DEERGs, respectively.
Gene set enrichment analysis (GSEA) was performed using GSEA software version 3.06. Single-gene GSEA was performed to identify the significant pathways between the low EGFR expression and high EGFR expression groups of TCGA-LGG patients, containing 529 samples. The FPKM data was downloaded from GDC Xena Hub7. GSEA was also used to predict differences in the biological processes between the high-risk and low-risk LGG patient groups.
The mutation status and survival outcome of interesting genes were searched on the cBioportal database8. The cBioportal is an open-access resource to analyze and visualize cancer genomics data integrated from different studies, e.g., TCGA. Specifically, we selected the Firehose Legacy, Pan Cancer Atlas, and UCSF cohorts in the CNS/Brain category, which totally contains 1,105 samples, to analyze genes of interest in LGG patients.
Univariate Cox regression analysis was used to select candidate prognostic DEERGs that were significantly correlated with OS. Multivariate Cox regression analysis was performed to fit the DEERGs. The risk score for each patient was calculated with the estimated regression coefficient as the weight. The risk score for each patient was calculated as follows: risk score = × (multiply) EXP gene(i), with Coef i indicating the Cox regression coefficient of genei and EXP gene(i) representing the relative expression level of each ERG. The median risk score was chosen as the cutoff value to dichotomize the TCGA-LGG cohort. The sensitivity and specificity of the risk score-based prediction models were compared using time-dependent receiver operating characteristic (ROC) curves. Kaplan–Meier survival analysis and log-rank tests were performed to compare survival differences. Multivariate analyses were performed using Cox proportional hazards regression analyses to assess whether the endocytosis gene signature was independent of other clinicopathological factors. The prognostic gene signature was verified mRNA-array_301 cohort, which the same formula used for the TCGA dataset was applied.
The nomogram was plotted based on age, gene mutation status, and risk score with the survival and RMS packages in R. Calibration curves were then generated to compare the predicted survival and actual outcomes. Moreover, the concordance index (C-index), ranging from 0.5 to 1.0, was computed to assess the prognostic model’s performance. Values of 0.5 and 1.0 represent a random guess and perfect prediction, respectively, for predicting survival with the model.
All statistical analyses were done with R and GraphPad Prism software. We provided R code in GitHub9 to reproduce our study. A P-value of less than 0.05 was considered to be statistically significant for all analyses.
In the present study, a total of 1,675 samples, comprising 1,152 normal patient samples, and 523 tumor samples, were included. Then, a total of 676 ERGs were obtained after manually filtering the genes with a relevance score > 1 (Supplementary Table 1). We identified 62 differential ERGs—32 up-regulated and 30 down-regulated ERGs—with the thresholds of |log2 fold change (FC)| > 1 (Figure 1A). Then, the expression patterns of DEERGs between LGG and nontumor tissues were visualized in a volcano plot and box plot (Figures 1B,C).

Figure 1. Identification of differentially expressed endocytosis-related genes (DEERGs) between LGG and normal brain tissue. (A) 62 DEERGs were plotted in the heatmap. Columns represent the different samples, and rows represent genes. The gene marked with red color indicates upregulation, whereas the green color indicates downregulation. (B) The volcano plot of the differential expression of 676 endocytosis-related genes (ERGs) between LGG and normal brain tissue. The red and green colors showed highly expressed or low expressed genes, respectively. (C) The expression levels of 62 DEERGs were shown in the boxplot. N, normal brain tissue; T, LGG. The DEERGs were filtered with the threshold of |log2 fold change (FC)| > 1 and FDR < 0.05.
To gain more biological insight into these DEERGs, GO enrichment analysis was performed. The DEERGs were classified into three functional groups: biological process (BP), cellular component (CC), and molecular function (MF). As shown in Figure 2A and Supplementary Table 2, the top enriched GO terms for BP were protein localization to the cell periphery, regulation of GTPase activity, and vesicle organization; in the CC category, the DEERGs were potentially localized at the endosome membrane, early endosome, and late endosome; and in the MF category, GTP binding, and purine ribonucleoside binding, and purine nucleotide binding were the most significantly enriched terms. Interestingly, after removing the common GO terms from over-, under-, and non-differentially expressed genes, we can obtain several specific GO terms of DEERGs, e.g., positive regulation of intracellular protein transport in BP, lateral plasma membrane in CC, and structural constituent of myelin sheath in MF (Supplementary Figure 1). Further KEGG analysis showed that the DEERGs were significantly associated with endocytosis, non-small cell lung cancer, and focal adhesion pathways (Figure 2B and Supplementary Table 3). Similarly, after removing the common enriched pathways in over-, under-, and non-differentially expressed genes, we found that non-small cell lung cancer, and focal adhesion, and T cell receptor signaling pathways could be specifically enriched by DEERGs.
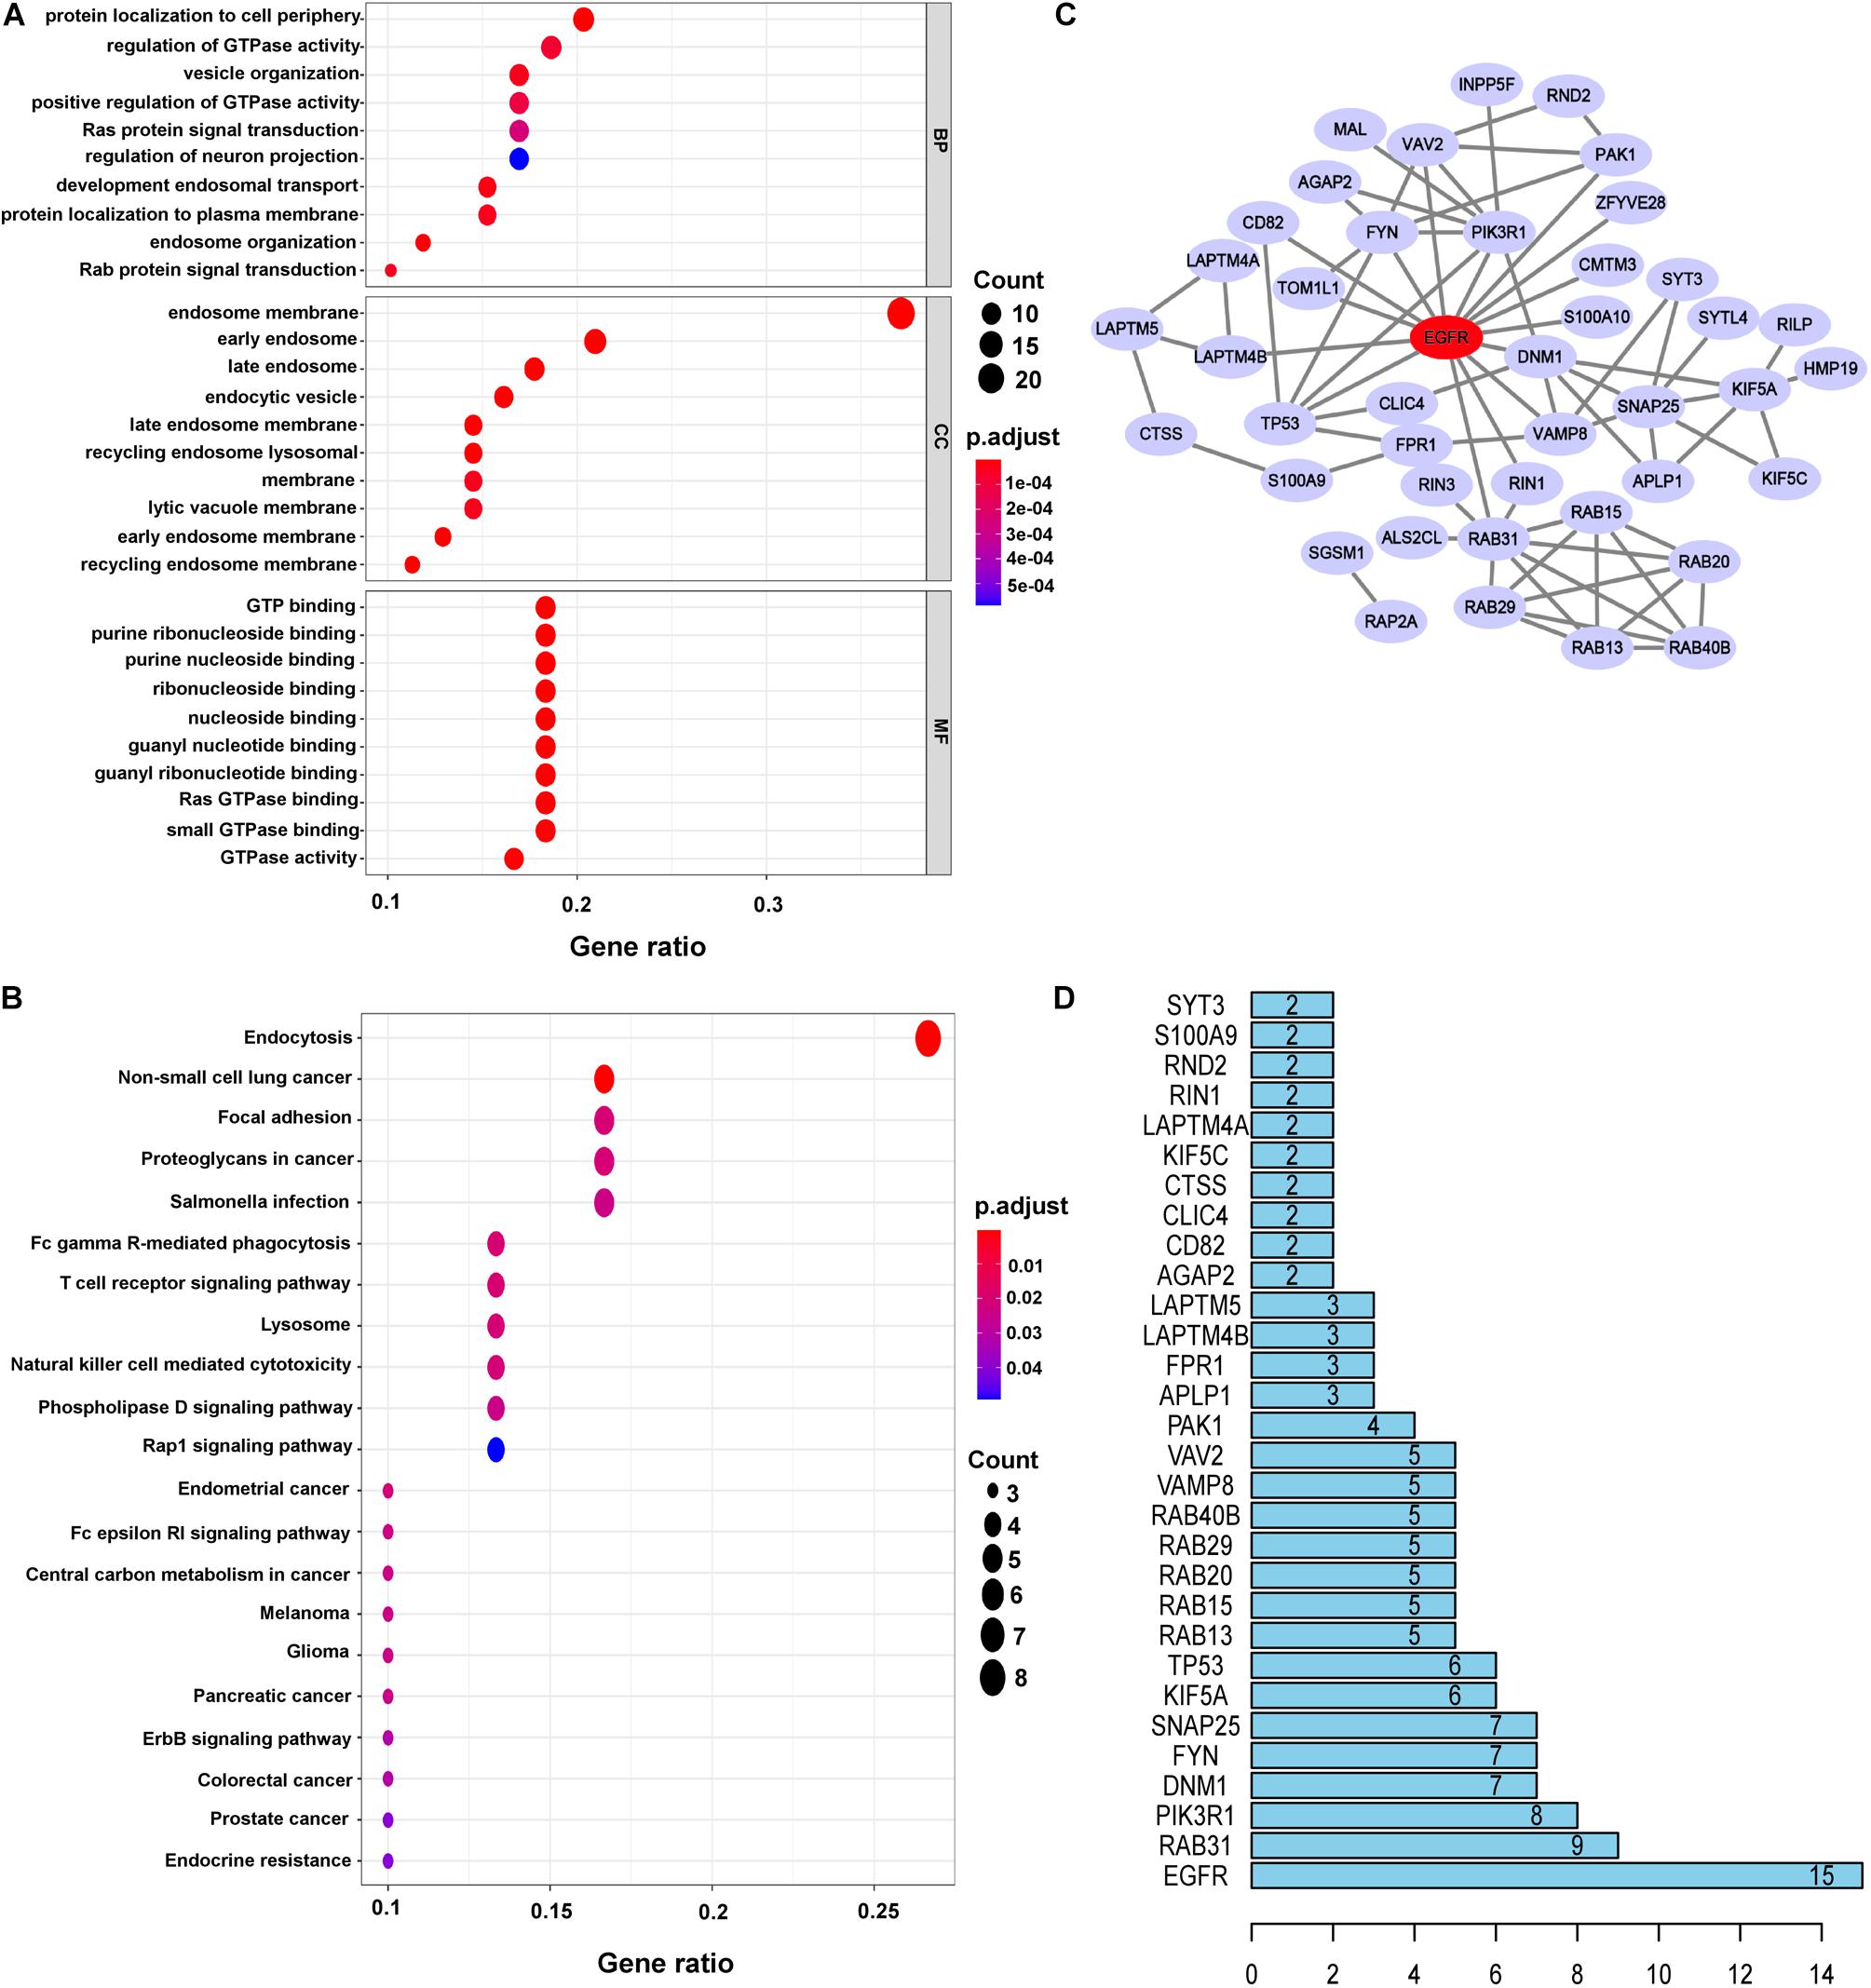
Figure 2. Functional enrichment analysis and construction PPI networks of DEERGs. (A) GO analysis of DEERGs. (B) KEGG analysis of DEERGs. (C) Cytoscape constructed PPI networks of DEERGs. (D) Identification of EGFR as the central protein.
The PPI network of the DEERGs was constructed and visualized via the STRING online database and Cytoscape software, respectively. Based on the results shown in Figures 2C,D, EGFR was considered a central hub protein connected to fifteen nodes. To better understand the biological contribution of EGFR, single-gene GSEA was performed. As shown in Figure 3A, EGFR was significantly positively related to six KEGG pathways: the Jak-STAT signaling, insulin signaling, regulation of actin cytoskeleton, focal adhesion, lysosome, and apoptosis pathways. Furthermore, we found that there were many EGFR mutation types in LGG patients (Figure 3B), and most of these mutations were oncogenic. More significantly, the expression levels of these EGFR mutant forms were higher than that of wild-type EGFR in LGG tissues, and patients harboring those EGFR mutations showed much lower OS rates (Figures 3C,D).
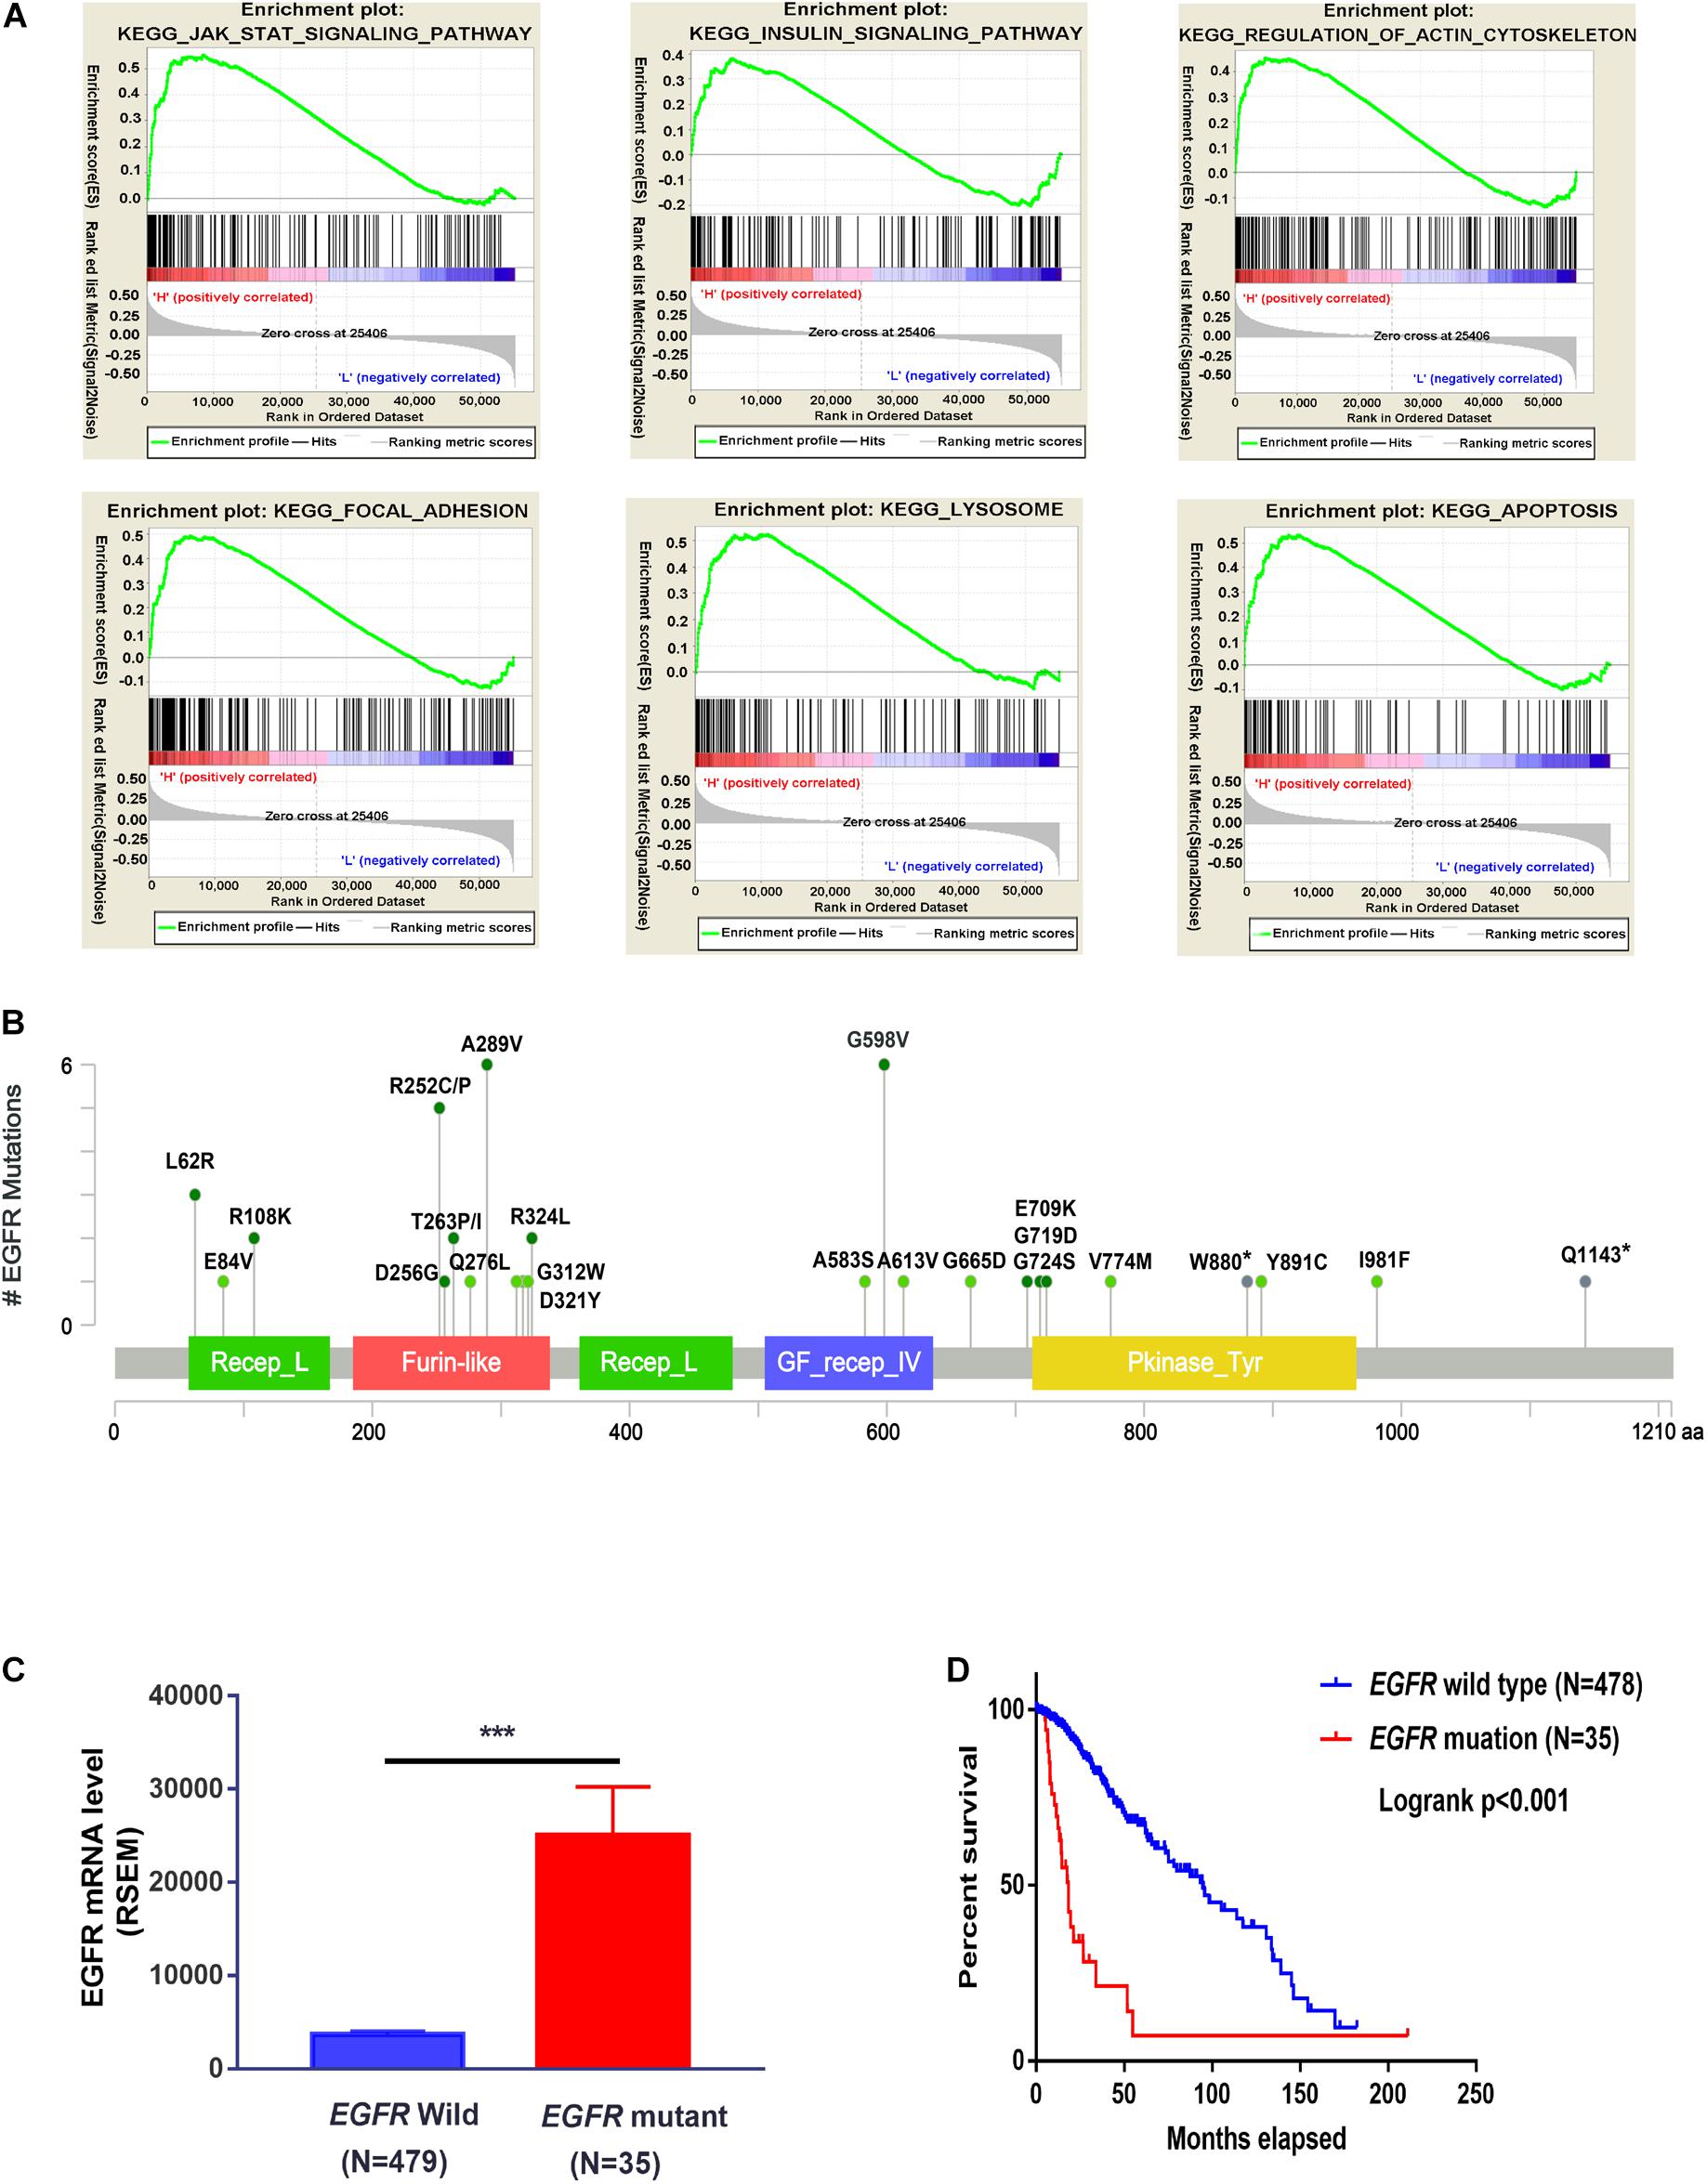
Figure 3. Functional analysis of EGFR in LGG cohorts. (A) GSEA analysis of EGFR in the TCGA-LGG cohort. (B) EGFR mutation sites were analyzed three LGG cohorts from cBioportal. (C) The expression difference of wild-type EGFR and mutated EGFR in TCGA-LGG patients (TCGA, PanCancer Atlas). (D) The survival probability of LGG patients with or without EGFR mutation (TCGA, PanCancer Atlas). ***P < 0.001.
To investigate whether the DEERGs could be used for prognosis prediction in LGG patients, univariate Cox proportional hazards regression analysis was performed with each DEERG using the expression profiles in the TCGA-LGG cohort. As shown in Figures 4A,B, a total of 30 genes were significantly associated with survival in the TCGA-LGG cohort, with 14 down-regulated and the other 16 up-regulated. To examine whether the genomic alterations in these risk-associated genes in LGG contribute to brain carcinogenesis, 1,105 LGG patient samples in cBioportal database, including both mutation and copy number alteration data, were analyzed. As shown in Figure 4C, genes of interest were altered in 533 (51%) of the 1,105 queried patients/samples, and this high genetic alteration rate indicated the crucial roles of these genes in the development of LGG.
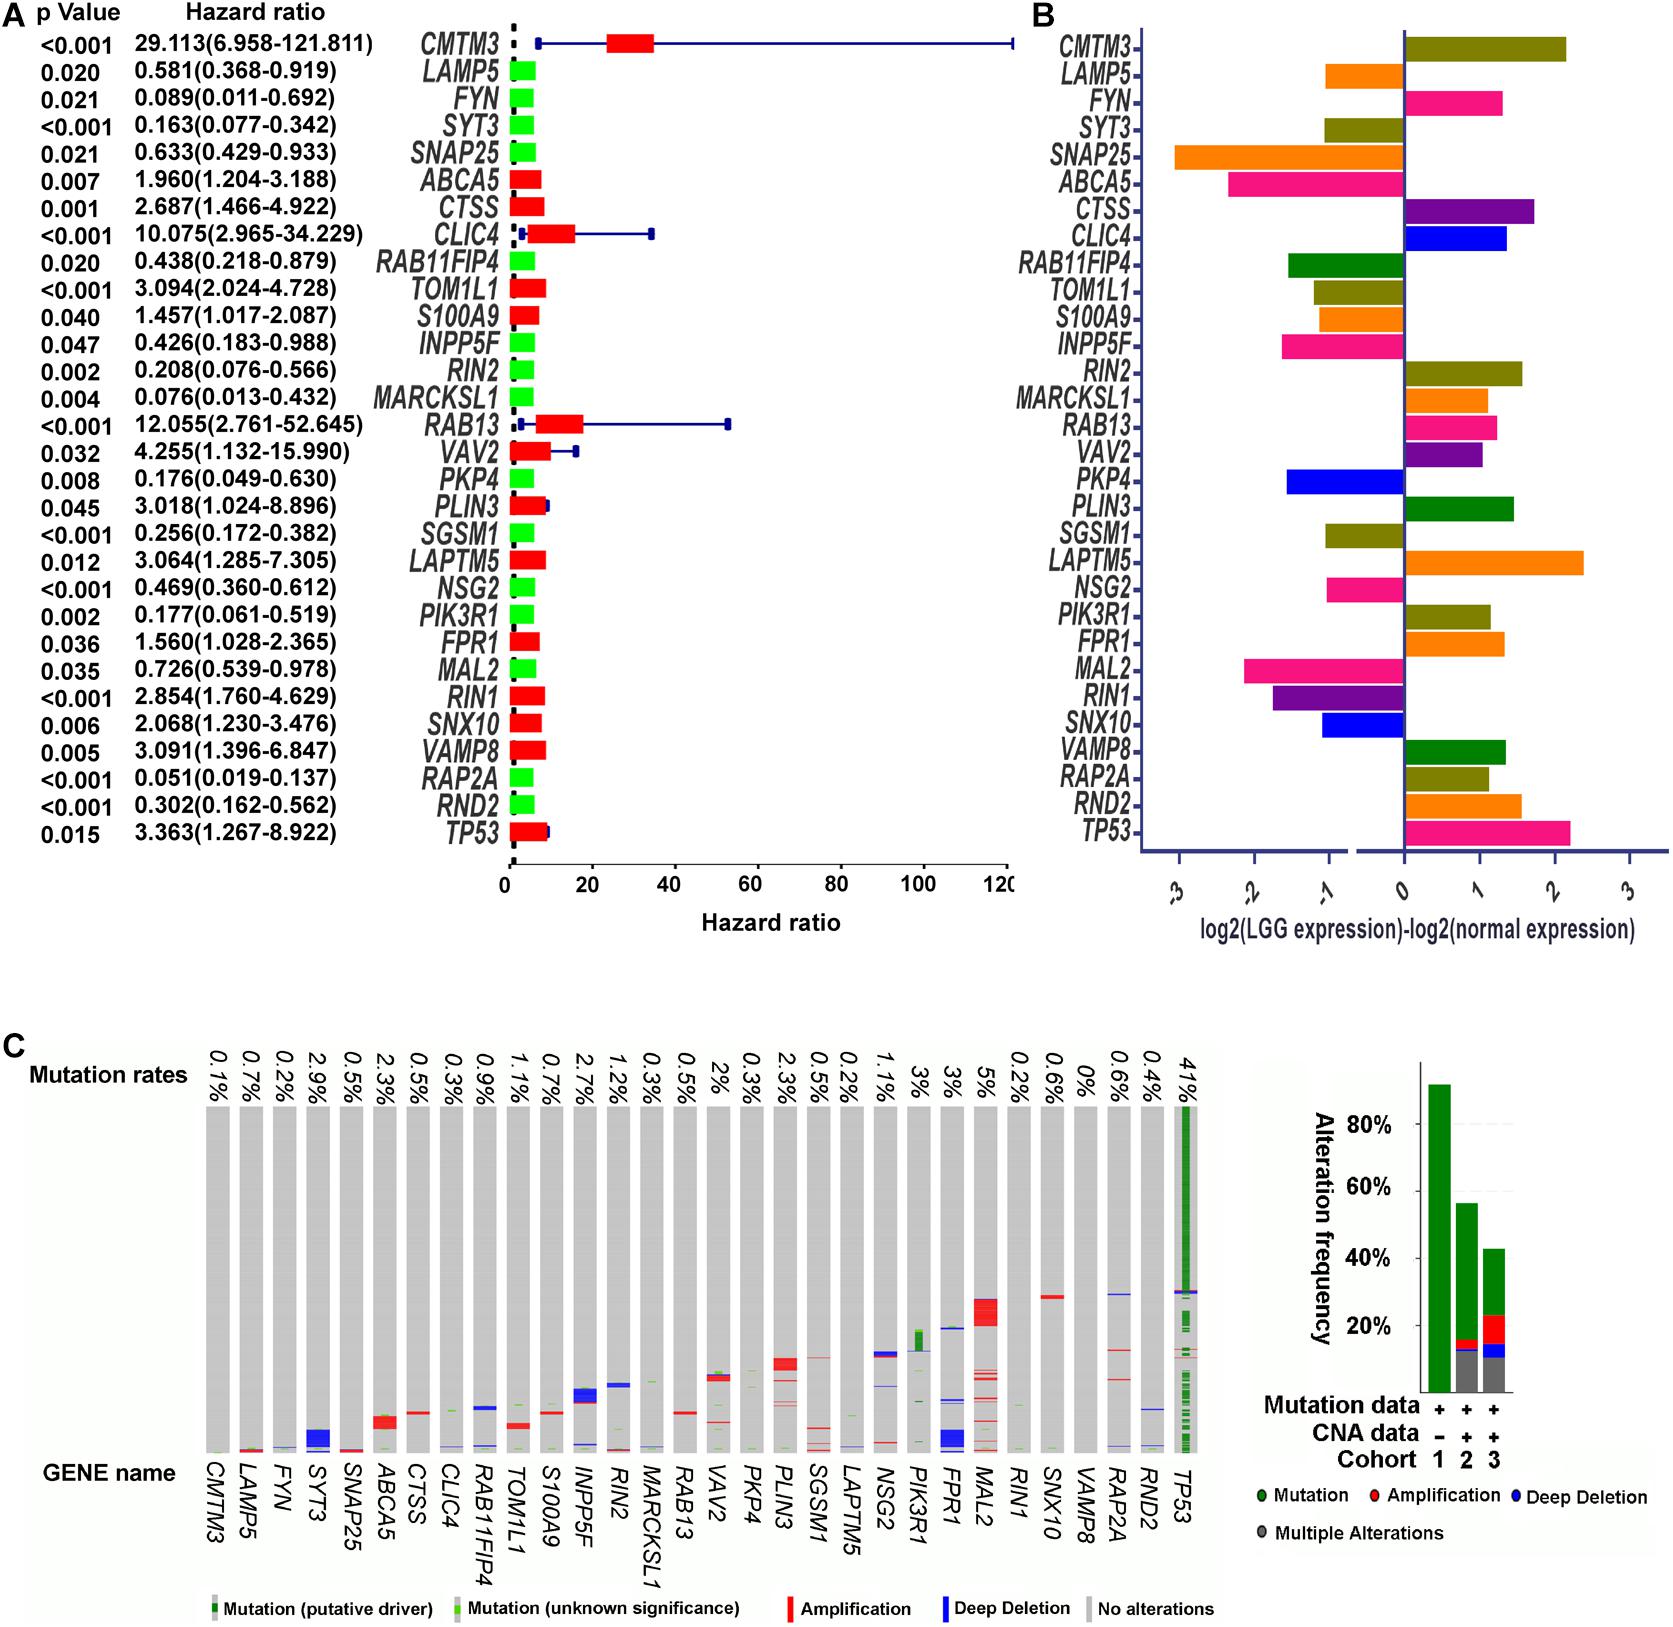
Figure 4. Identification of prognosis-related DEERGs. (A) Univariate Cox proportional hazard regression analysis of DEERGs. (B) Comparison of prognosis-related DEERGs mRNA expression between normal brain tissues and TCGA-LGG tissues. (C) Genetic alteration of prognosis-related DEERGs in LGG sample. Cohort 1: Low-Grade Gliomas (Johnson et al., 2014); Cohort 2: Brain Lower Grade Glioma (TCGA, PanCancer Atlas); and Cohort 3: Brain Lower Grade Glioma (TCGA, Firehose Legacy). Hazard ratio estimates the ratio of the hazard rate under two levels of an explanatory variable, such as female VS male. The hazard rate is the probability of an event occurring per unit of time.
To identify the best model for predicting patient prognosis, multivariate Cox proportional hazards regression analysis was further carried out on all 62 DEERGs, which finally identified 29 genes. The risk score to predict OS for each patient was calculated as described in the materials and methods section. Based on the risk score, 471 LGG patients from the TCGA database were classified into a low-risk and a high-risk group. Kaplan–Meier survival curves indicated that the OS time of low-risk patients was significantly longer than that of high-risk patients (Figure 5A). As shown in Figure 5B, among the above 29 genes, CTSS, S100A9, CMTM3, S100A10, CLIC4, RIN1, RAB13, TOM1L1, and VAV2 were significantly up-regulated in the high-risk group, whereas INPP5F, RAB15, RAB11FIP4, APLP1, ARL4A, RAP2A, and SGSM1 were significantly down-regulated. The distributions of risk score and survival status in each patient were also analyzed, as illustrated in Figures 5C,D. In addition, GSEA was performed based on each patient’s risk score; as presented in Figure 5E and Supplementary Table 4, the lysosome pathway was one of the highest enriched pathways in patients with high-risk scores, indicating that the dysregulation of lysosomes might affect LGG progression.

Figure 5. Identification of 29-ERGs signature for the prognosis of TCGA-LGG cohort. (A) Kaplan–Meier analysis of the overall survival of low-risk and high-risk LGG patients stratified by the median risk score. (B) The expression of 16- DEERGs in low-risk and high-risk LGG patients. (C,D) The distribution of risk score and patients’ survival status between low- and high-risk groups. (E) GSEA analysis of KEGG pathway enriched in the high-risk groups. (F) Univariate Cox regression analysis (G) Multivariate Cox regression analysis. (H) Muti-index of ROC curve.
Univariate and multivariate models were built to analyze the independent prognostic value of different factors, such as age, sex, grade, and risk score, in LGG. The results suggested that age, grade, and risk score were independent prognostic indicators (Figures 5F,G). Further ROC curve analysis demonstrated that the risk score, with the highest area under the curve (AUC) value (0.89), had the best prognostic performance among the prognostic indicators (Figure 5H).
We next assessed the prognostic gene signature’s predictive power in another LGG cohort (mRNA-array_301) from the CGGA database. In each cohort, patients were divided into a low-risk and a high-risk group based on the calculated risk score before comparing OS between the two groups. As expected, the survival curves in Figure 6A indicate that in the dataset mRNA-array_301, which included 157 patients, the OS time was much lower in the high-risk group than in the low-risk group (median OS time = 3.65 years vs. 8.58 years, P < 0.001). Univariate and multivariate Cox regression analyses indicated that the risk score could be an independent prognostic indicator in the LGG cohort (Figures 6B,C). More significantly, as shown in Figure 6D, the AUC of the risk score was higher than that of age, sex, and grade in the LGG cohort, further confirming the excellent power of this 29-endocytosis-related-gene signature as an independent prognostic predictor for LGG.
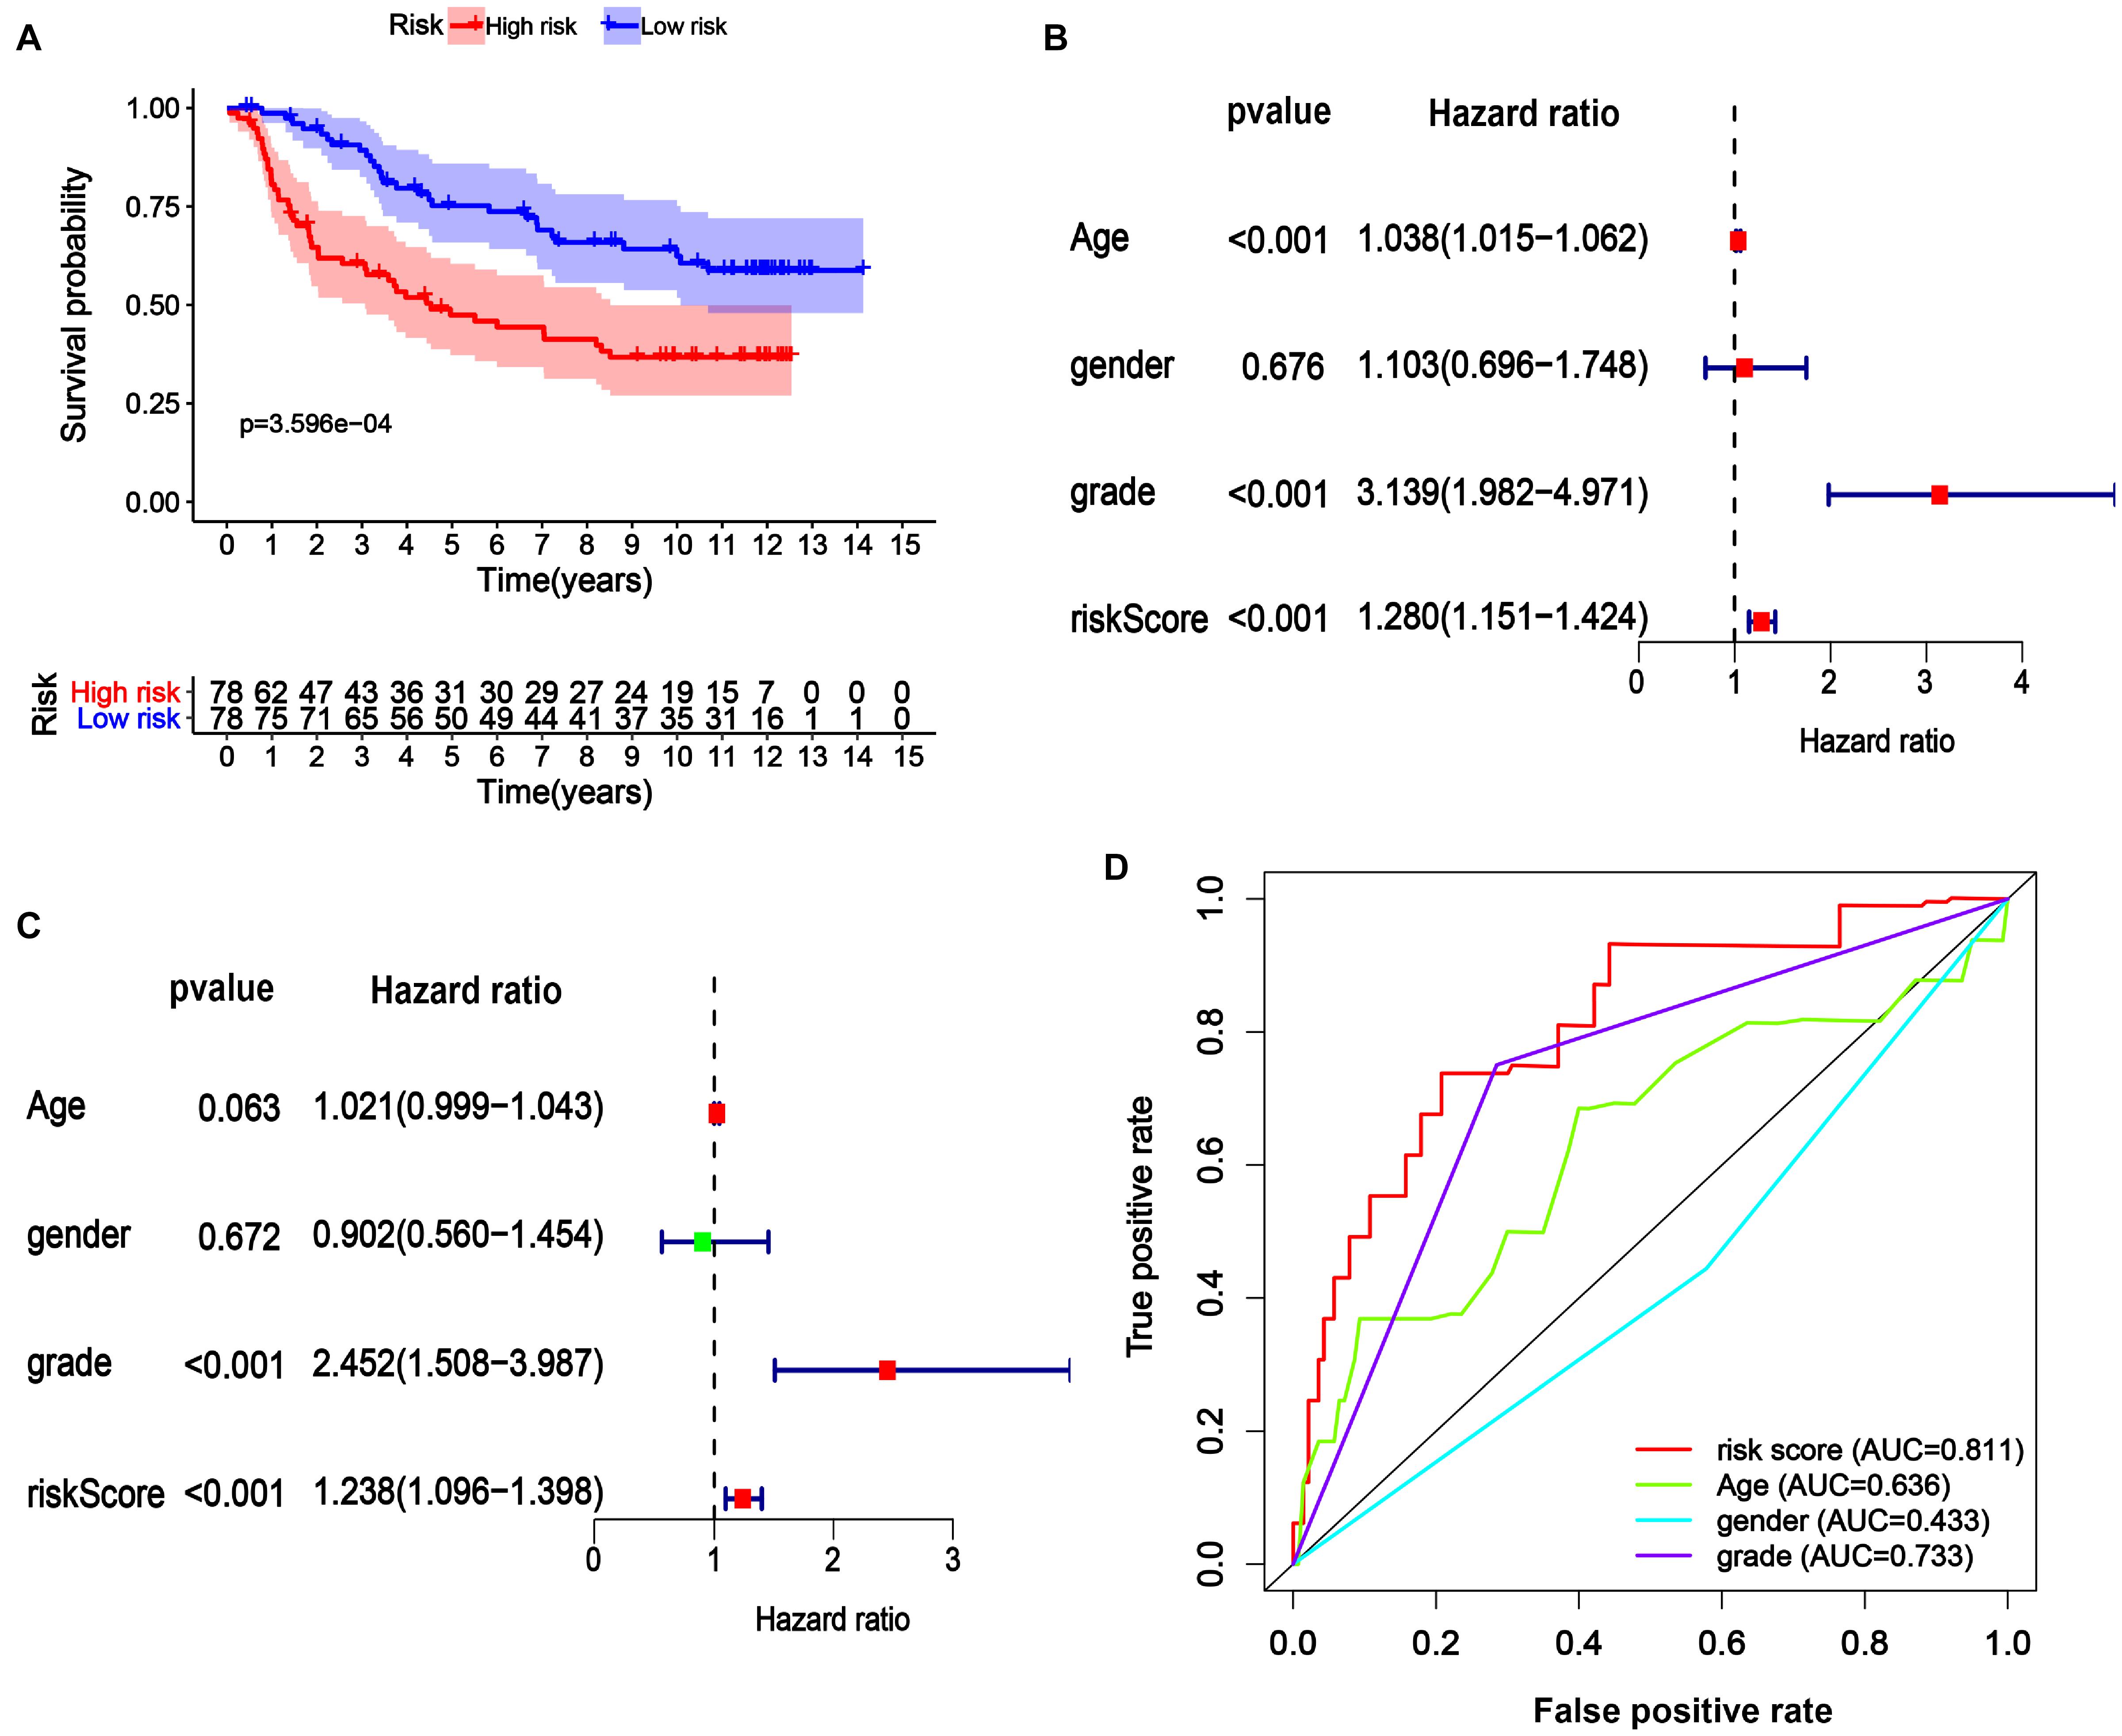
Figure 6. Verification of 29-ERGs signature for the prognosis of a CGGA-LGG cohort. The Kaplan-Meier analysis (A), Univariate Cox regression analysis (B), and Multivariate Cox regression analysis (C), and Muti-index of ROC curve (D) for the mRNA-array_301 cohort.
In addition to age and grade, genetic mutations are also tightly associated with brain cancer development and malignant progression (Barnholtz-Sloan et al., 2008; Weller et al., 2015). In LGG, the ten genes (IDH1, CIC, FUBP1, NOTCH1, MUC16, TP53, ATRX, PIK3C1, TTN, and NF1) with the highest mutation rates in the LGG patients obtained from cBioPortal were selected for further study (Figure 7A). Interestingly, as illustrated in Figure 7B, we found that the gene mutation status of these ten genes was closely associated with the risk score of ERGs, indicating that the gene mutation status might act as an OS predictor in LGG patients. Further univariate Cox proportional hazards regression analysis suggested that PIK3C1 and NF1 mutations were two hazardous factors, whereas IDH1 mutation was an advantageous factor for the survival of LGG patients (Figure 7C). To better integrate the ten gene mutation status with the OS of LGG patients, we assigned a score of 1 to a gene with mutations while assigning a score of 0 to a gene without any mutations in an LGG sample and then perform multivariate Cox regression analysis. Finally, a mutation signature for the OS of LGG patients was established, which was composed of TTN, PIK3CA, NF1, and IDH1 (Figure 7D). The mutation score to predict OS for each patient was calculated as follows: Mutation score = 0.88 × (multiply) mutation status (0 or 1) of TTN +1.12 × mutation status of PIK3CA +1.33 × mutation status of NF1-0.6 × mutation status of IDH1. Based on the mutation score, 505 LGG patients from the TCGA cohort were stratified into low and high score groups. Further, Kaplan–Meier survival analysis showed that the OS time in the low mutation score group was much longer than the high mutation score group (Figure 7E), which indicated the high mutation score was hazardous for extending the survival of LGG patients. Therefore, it could be expected that a high mutation score was positively correlated with the ERG risk score (P < 0.01; Figure 7F).
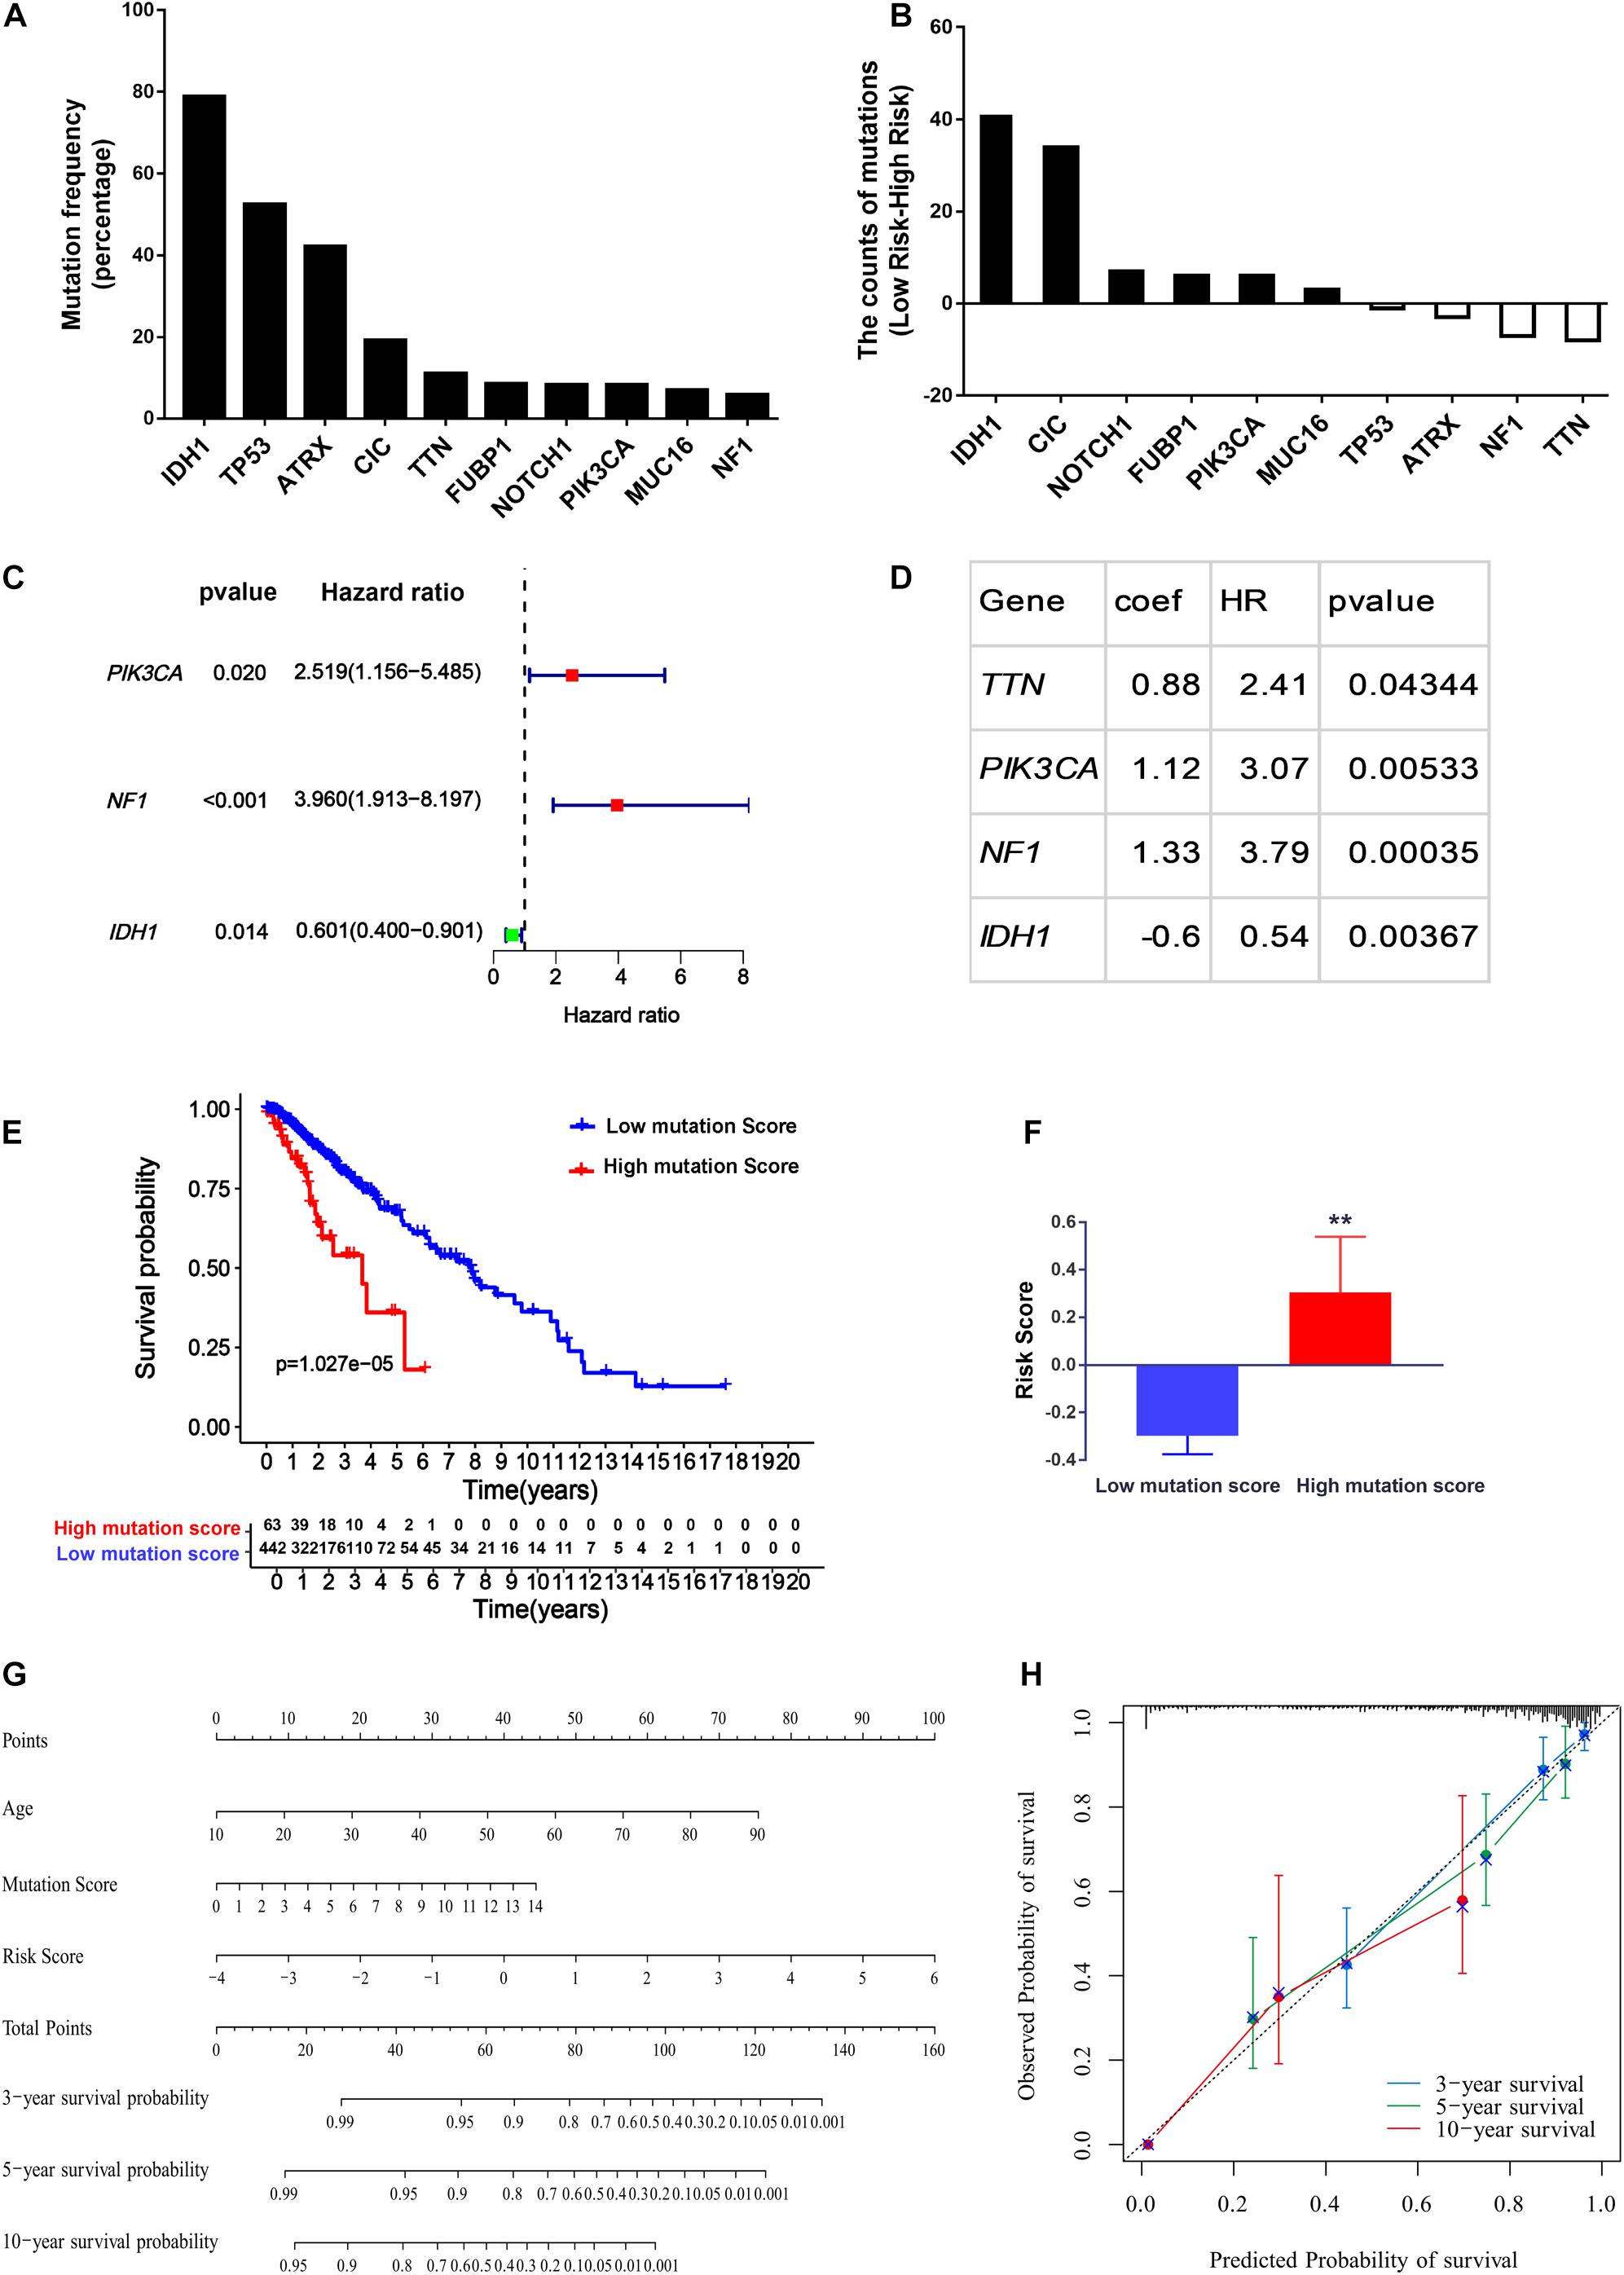
Figure 7. Construction of the nomogram for predicting the overall survival of LGG patients. (A) Top ten genes with the highest mutation rates in the LGG patients obtained from cBioPortal. (B) The difference of mutation numbers between high-risk and low-risk groups. (C,D) Univariate Cox regression hazard analysis (C) and Multivariate Cox regression model (D) for top ten mutated genes in LGG. (E,F) The association of mutation score with the overall survival (E) and the ERG risk signature in LGG patients (F). (G) Calibration plots for the nomogram. (H) Prognostic nomogram for LGG patients. **P < 0.01.
To provide clinicians with a quantitative approach for predicting LGG survival, a nomogram was developed to predict the probability of 3- and 5-year OS based on the 29-endocytosis-related-gene signature, age, and mutation score, which were significant factors for OS after multivariate Cox analysis (Supplementary Figure 2). As shown in Figure 7G, each factor was assigned a score in proportion to its risk contribution to survival. The calibration curves showed good consistency between actual and predicted survival, especially 3- and 5-year survival (Figure 7H).
Much evidence has indicated the implications of endocytic pathways for cancer progression. Dysregulated endocytosis, caused by altered expression levels of endocytic machinery components, is regarded as an emerging feature of cancer cells; however, prognostic studies of differential endocytosis-related genes (DERGs) in cancer are lacking. Here, we use LGG as a model to investigate their predictive power to prognose the survival of patients with tumors.
This study mined the mRNA expression of 676 ERGs in the TCGA-LGG cohort. Then, 62 genes were identified to be differentially expressed between LGG and nontumor brain tissues. All of these genes were found to be involved in endocytic signaling by GO term analysis. Among these genes, EGFR was further revealed as the hub gene. EGFR, a tyrosine kinase receptor, is highly expressed in many cancers, such as glioblastoma, colorectal cancer, and lung cancer (Yarden and Pines, 2012). EGFR-activating mutations are involved in cancer development and resistance to cancer therapies, such as EGFR inhibitor treatment and chemotherapy (Juchum et al., 2015; Sigismund et al., 2018). In LGG patients, we also observed high expression of EGFR in tumor tissues compared to the corresponding normal brain tissues. Despite its relative prevalence in high-grade gliomas such as GMB, EGFRvIII, a constitutively activating mutation with intragenic deletion of exons 2 to 7, is not often found in LGG (Newman et al., 2017; Huang et al., 2018); however, some oncogenic mutations of EGFR, such as A289V, R108K, and G598V, are found in LGG patients. In addition, the expression of mutated EGFR appears to be higher than that of wild-type EGFR in LGG patients; moreover, the OS of LGG patients harboring mutated EGFR is much shorter than that of patients with wild-type EGFR. During endocytosis, EGFR can upregulate RAB5 activity by inhibiting the activity of its GAP protein, RN-tre (Lanzetti et al., 2000). RAB5 is the primary regulator of early-stage endosomal trafficking, and its high activity is required for the homotypic fusion and subsequent maturation of endosomes in vitro. Since the formation of mature endosomes is necessary for the transduction of signals and transport of materials from the extracellular space to the intracellular environment (Murphy et al., 2009; Scita and Di Fiore, 2010), activated EGFR signaling caused by its high expression or constitutively activating mutation is expected to accelerate the endocytic process, which provides survival signals or nutrition for the growth and proliferation of cancer cells.
Next, we established a prognostic signature with 29 genes for predicting survival in the LGG cohorts. The 29 proteins are involved in different stages of the endocytosis pathway. For example, APLP1, DNM1, and PAK1 regulate the endocytic uptake of extracellular materials (Gammie et al., 1995; Neumann et al., 2006; Karjalainen et al., 2008; Grassart et al., 2010); INPP5F, CMTM3, RIN1, and RIN3 participate in early endosome maturation (Tall et al., 2001; Kajiho et al., 2003; Yoshikawa et al., 2008; Galvis et al., 2009; Yuan et al., 2017; Taefehshokr et al., 2021); CLIC4, CTSS, LAPTM4B, SYTL4, TMEM106B, S100A9, and TOM1L1 maintain the normal function of late endosomes (Munger et al., 1995; Puertollano, 2005; Ostrowski et al., 2010; Brady et al., 2013; Blom et al., 2015; Tsai et al., 2015; Hsu et al., 2019); NSG1, RAB11FIP4, RAB15, S100A10, RAB13, and RAP2A might mediate endosome recycling back to the cell surface (Zuk and Elferink, 2000; Wallace et al., 2002; Zobiack et al., 2003; Morimoto et al., 2005; Taguchi and Misaki, 2011; Parkinson and Hanley, 2018); GOLIM4, RAB29, SGSM1, and ARL4A are involved in endosome to Golgi trafficking (Natarajan and Linstedt, 2004; Lin et al., 2011; Nottingham et al., 2012; Inoshita and Imai, 2015); CORO1C and KIF5A regulate endosome fission and endosome transport in the cytosol, respectively, (Schmidt et al., 2009; Hoyer et al., 2018); VAV2 and ZFYVE28 are able to divert EGFR endosomal trafficking and lysosomal degradation, although the detailed molecular mechanisms are elusive (Mosesson et al., 2009; Thalappilly et al., 2010). The risk score was calculated for each patient based on the mRNA expression levels and risk coefficients of the 29 selected genes. The risk scores meaningfully classified patient outcomes in LGG cohorts. More particularly, the prognostic power of the 29-gene signature was verified in another LGG cohort. ROC curve analysis indicated that the risk score is a better predictor than other clinical characteristics, e.g., grade and age. Collectively, these results suggest that our gene signature could provide an accurate index for predicting LGG prognosis.
It is well known that gene mutation status plays an important role in oncogenesis and patient prognosis, indicating the potential application of characteristic gene signatures in cancer diagnosis and prognosis. For example, BRCA mutations are associated with unfavorable prognosis in breast cancer patients (Brekelmans et al., 2006; Zhong et al., 2015); in addition, a higher MUC16 gene mutation rate indicates a more favorable prognosis in patients with stomach adenocarcinomas (Li et al., 2018). After analyzing the top ten mutated genes in LGG, we found that mutation of the IDH1 had a favorable effect for LGG patients, whereas PIK3CA or NF1 mutation could lead to an adverse impact on the survival of these patients. To better correlate the gene mutation information with the OS, we performed the multivariate Cox regression. It was found that the mutation status of TTN, PIK3CA, NF1, and IDH1 could be used to establish a model predict the OS in LGG patients. IDH1 is a dimeric cytosolic NADP-dependent isocitrate dehydrogenase that catalyzes the decarboxylation of isocitrate into alpha-ketoglutarate (Al-Khallaf, 2017). Consistent with our results, IDH1/2 mutations have been shown to be factors indicating a favorable prognosis in all types of gliomas (Yan et al., 2009; Cancer Genome Atlas Research Network et al., 2015; Aibaidula et al., 2017). TNN was the most frequently mutated gene across different cancer types, and its mutation frequency could act as an independent marker for tumor mutation burden (TMB) in multiple cancer types (Oh et al., 2020). The clinical outcome of TNN mutation in different cancer types is conflicted, indicating the role of mutated TNN in cancer is context-based (Cheng et al., 2019; Jia et al., 2019). PIK3CA encodes p110α, the catalytic subunit of PI3K; the mutation of PIK3CA stimulates the PI3K-AKT signaling pathway and promotes cell growth in various cancers (Madsen et al., 2018). NF1 acts as a tumor suppressor through inactivating Ras activity; therefore, when NF1 is mutated, Ras-related signal pathways, e.g., MEK–ERK, and PI3K-AKT pathways, are hyperactivated, which results in poor clinical outcomes for cancer patients (Malone et al., 2014; Redig et al., 2016). After integration of the TTN, PIK3CA, NF1, and IDH1 mutation status with age and the ERG risk score, a nomogram was developed and exhibited excellent performance, especially for predicting the 3- and 5-year survival probabilities of LGG patients.
In short, we first developed an ERGs expression model that could act as an independent prognostic indicator for LGG. A nomogram developed based on the gene signature and clinicopathological features accurately predicted the 3- and 5-year survival probabilities for individual LGG patients. Our findings suggest that the 29-endocytosis-gene signature may help facilitate personalized and precision medicine in clinical practice.
The original contributions presented in the study are included in the article/Supplementary Material, further inquiries can be directed to the corresponding author/s.
GW and DW contributed to the conception and design of the study. DW organized the database and wrote the first draft of the manuscript. DW and SL performed the statistical analysis. DW, SL, and GW wrote the manuscript. All authors contributed to manuscript revision, read, and approved the submitted version.
This work was supported by the Natural Science Foundation of Shandong Province, China (Grant Number: ZR2019MH043).
The authors declare that the research was conducted in the absence of any commercial or financial relationships that could be construed as a potential conflict of interest.
All claims expressed in this article are solely those of the authors and do not necessarily represent those of their affiliated organizations, or those of the publisher, the editors and the reviewers. Any product that may be evaluated in this article, or claim that may be made by its manufacturer, is not guaranteed or endorsed by the publisher.
The Supplementary Material for this article can be found online at: https://www.frontiersin.org/articles/10.3389/fgene.2021.709666/full#supplementary-material
Supplementary Figure 1 | Specific GO and KEGG enriched by the DEERGs. (A) Differentially, over-, under-, and non-differentially expressed ERG genes in LGG were performed GO analysis, after which the common GO terms obtained from another three gene lists were removed from the GO results of DEERGs. (B) Differentially, over-, under-, and non-differentially expressed ERG genes in LGG were performed KEGG analysis, after which the common pathways obtained from another three gene lists were removed from the KEGG results of DEERGs.
Supplementary Figure 2 | Multivariate regression analysis of risk score and mutation score with different clinical parameters.
Supplementary Table 1 | The list of endocytosis-related genes (ERGs).
Supplementary Table 2 | GO analysis of the DEERGs.
Supplementary Table 3 | KEGG analysis of the DEERGs.
Supplementary Table 4 | KEGG pathways significantly enriched in the high-risk score LGG patients via GSEA analysis.
LGG, Low-grade glioma; ERG, endocytosis-related gene; TCGA, the cancer genome atlas; GBM, glioblastoma multiforme; GO, gene ontology; KEGG, Kyoto encyclopedia of genes and genomes; GTEx, the genotype-tissue expression database.
Aibaidula, A., Chan, A. K., Shi, Z., Li, Y., Zhang, R., Yang, R., et al. (2017). Adult IDH wild-type lower-grade gliomas should be further stratified. Neuro Oncol. 19, 1327–1337. doi: 10.1093/neuonc/nox078
Al-Khallaf, H. (2017). Isocitrate dehydrogenases in physiology and cancer: biochemical and molecular insight. Cell Biosci. 7:37.
An, Y., Wang, Q., Zhang, L., Sun, F., Zhang, G., Dong, H., et al. (2020). OSlgg: an online prognostic biomarker analysis tool for low-grade glioma. Front. Oncol. 10:1097. doi: 10.3389/fonc.2020.01097
Barnholtz-Sloan, J., Sloan, A. E., Land, S., Kupsky, W., and Monteiro, A. N. (2008). Somatic alterations in brain tumors. Oncol. Rep. 20, 203–210.
Barnholtz-Sloan, J. S., Ostrom, Q. T., and Cote, D. (2018). Epidemiology of brain tumors. Neurol. Clin. 36, 395–419. doi: 10.1016/j.ncl.2018.04.001
Blom, T., Li, S., Dichlberger, A., Back, N., Kim, Y. A., Loizides-Mangold, U., et al. (2015). LAPTM4B facilitates late endosomal ceramide export to control cell death pathways. Nat. Chem. Biol. 11, 799–806. doi: 10.1038/nchembio.1889
Brady, O. A., Zheng, Y., Murphy, K., Huang, M., and Hu, F. (2013). The frontotemporal lobar degeneration risk factor, TMEM106B, regulates lysosomal morphology and function. Hum. Mol. Genet. 22, 685–695. doi: 10.1093/hmg/dds475
Brekelmans, C. T., Seynaeve, C., Menke-Pluymers, M., Brüggenwirth, H. T., Tilanus-Linthorst, M. M., Bartels, C. C., et al. (2006). Survival and prognostic factors in BRCA1-associated breast cancer. Ann. Oncol. 17, 391–400. doi: 10.1093/annonc/mdj095
Cancer Genome Atlas Research Network, Brat, D. J., Verhaak, R. G., Aldape, K. D., Yung, W. K., Salama, S. R., et al. (2015). Comprehensive, integrative genomic analysis of diffuse lower-grade gliomas. N. Engl. J. Med. 372, 2481–2498. doi: 10.1056/NEJMoa1402121
Chen, J., Li, Y., Han, X., Pan, Y., and Qian, X. (2021). An autophagic gene-based signature to predict the survival of patients with low-grade gliomas. Cancer Med. 10, 1848–1859.
Cheng, X., Yin, H., Fu, J., Chen, C., An, J., Guan, J., et al. (2019). Aggregate analysis based on TCGA: TTN missense mutation correlates with favorable prognosis in lung squamous cell carcinoma. J. Cancer Res. Clin. Oncol. 145, 1027–1035. doi: 10.1007/s00432-019-02861-y
Claus, E. B., and Black, P. M. (2006). Survival rates and patterns of care for patients diagnosed with supratentorial low-grade gliomas: data from the SEER program, 1973-2001. Cancer 106, 1358–1363. doi: 10.1002/cncr.21733
Di Fiore, P. P., and von Zastrow, M. (2014). Endocytosis, signaling, and beyond. Cold Spring Harb. Perspect. Biol. 6:a016865. doi: 10.1101/cshperspect.a016865
Doherty, G. J., and McMahon, H. T. (2009). Mechanisms of endocytosis. Annu. Rev. Biochem. 78, 857–902. doi: 10.1146/annurev.biochem.78.081307.110540
Furnari, F. B., Fenton, T., Bachoo, R. M., Mukasa, A., Stommel, J. M., Stegh, A., et al. (2007). Malignant astrocytic glioma: genetics, biology, and paths to treatment. Genes Dev. 21, 2683–2710. doi: 10.1101/gad.1596707
Galvis, A., Balmaceda, V., Giambini, H., Conde, A., Villasana, Z., Fornes, M. W., et al. (2009). Inhibition of early endosome fusion by Rab5-binding defective Ras interference 1 mutants. Arch. Biochem. Biophys. 482, 83–95. doi: 10.1016/j.abb.2008.11.009
Gammie, A. E., Kurihara, L. J., Vallee, R. B., and Rose, M. D. (1995). DNM1, a dynamin-related gene, participates in endosomal trafficking in yeast. J. Cell Biol. 130, 553–566. doi: 10.1083/jcb.130.3.553
Goh, L. K., and Sorkin, A. (2013). Endocytosis of receptor tyrosine kinases. Cold Spring Harb. Perspect. Biol. 5:a017459. doi: 10.1101/cshperspect.a017459
Goldman, M. J., Craft, B., Hastie, M., Repecka, K., McDade, F., Kamath, A., et al. (2020). Visualizing and interpreting cancer genomics data via the Xena platform. Nat. Biotechnol. 38, 675–678. doi: 10.1038/s41587-020-0546-8
Grassart, A., Meas-Yedid, V., Dufour, A., Olivo-Marin, J. C., Dautry-Varsat, A., and Sauvonnet, N. (2010). Pak1 phosphorylation enhances cortactin-N-WASP interaction in clathrin-caveolin-independent endocytosis. Traffic 11, 1079–1091. doi: 10.1111/j.1600-0854.2010.01075.x
Hoyer, M. J., Chitwood, P. J., Ebmeier, C. C., Striepen, J. F., Qi, R. Z., Old, W. M., et al. (2018). A novel class of ER membrane proteins regulates ER-associated endosome fission. Cell 175, 254–265. doi: 10.1016/j.cell.2018.08.030
Hsu, K.-S., Otsu, W., Li, Y., Wang, H.-C., Chen, S., Tsang, S. H., et al. (2019). CLIC4 regulates late endosomal trafficking and matrix degradation activity of MMP14 at focal adhesions in RPE cells. Sci. Rep. 9, 1–17. doi: 10.1038/s41598-019-48438-0
Huang, K., Fang, C., Yi, K., Liu, X., Qi, H., Tan, Y., et al. (2018). The role of PTRF/Cavin1 as a biomarker in both glioma and serum exosomes. Theranostics 8, 1540–1557. doi: 10.7150/thno.22952
Inoshita, T., and Imai, Y. (2015). Regulation of vesicular trafficking by Parkinson’s disease-associated genes. AIMS Mol. Sci. 2, 461–475. doi: 10.3934/molsci.2015.4.461
Jia, Q., Wang, J., He, N., He, J., and Zhu, B. (2019). Titin mutation associated with responsiveness to checkpoint blockades in solid tumors. JCI Insight 4:e127901. doi: 10.1172/jci.insight.127901
Johnson, B. E., Mazor, T., Hong, C., Barnes, M., Aihara, K., McLean, C. Y., et al. (2014). Mutational analysis reveals the origin and therapy-driven evolution of recurrent glioma. Science 343, 189–193. doi: 10.1126/science.1239947
Juchum, M., Günther, M., and Laufer, S. A. (2015). Fighting cancer drug resistance: opportunities and challenges for mutation-specific EGFR inhibitors. Drug. Resist. Updat. 20, 12–28. doi: 10.1016/j.drup.2015.05.002
Kajiho, H., Saito, K., Tsujita, K., Kontani, K., Araki, Y., Kurosu, H., et al. (2003). RIN3: a novel Rab5 GEF interacting with amphiphysin II involved in the early endocytic pathway. J. Cell Sci. 116(Pt 20), 4159–4168. doi: 10.1242/jcs.00718
Karjalainen, M., Kakkonen, E., Upla, P., Paloranta, H., Kankaanpaa, P., Liberali, P., et al. (2008). A Raft-derived, Pak1-regulated entry participates in alpha2beta1 integrin-dependent sorting to caveosomes. Mol. Biol. Cell 19, 2857–2869. doi: 10.1091/mbc.E07-10-1094
Lanzetti, L., Rybin, V., Malabarba, M. G., Christoforidis, S., Scita, G., Zerial, M., et al. (2000). The Eps8 protein coordinates EGF receptor signalling through Rac and trafficking through Rab5. Nature 408, 374–377. doi: 10.1038/35042605
Li, X., Pasche, B., Zhang, W., and Chen, K. (2018). Association of MUC16 mutation with tumor mutation load and outcomes in patients with gastric cancer. JAMA Oncol. 4, 1691–1698. doi: 10.1001/jamaoncol.2018.2805
Lin, Y. C., Chiang, T. C., Liu, Y. T., Tsai, Y. T., Jang, L. T., and Lee, F. J. (2011). ARL4A acts with GCC185 to modulate Golgi complex organization. J. Cell Sci. 124(Pt 23), 4014–4026. doi: 10.1242/jcs.086892
Liu, Y., Lu, Y., Li, A., Celiku, O., Han, S., Qian, M., et al. (2020). mTORC2/Rac1 pathway predisposes cancer aggressiveness in IDH1-mutated glioma. Cancers (Basel) 12:787. doi: 10.3390/cancers12040787
Louis, D. N., Ohgaki, H., Wiestler, O. D., Cavenee, W. K., Burger, P. C., Jouvet, A., et al. (2007). The 2007 WHO classification of tumours of the central nervous system. Acta Neuropathol. 114, 97–109. doi: 10.1007/s00401-007-0243-4
Louis, D. N., Perry, A., Reifenberger, G., von Deimling, A., Figarella-Branger, D., Cavenee, W. K., et al. (2016). The 2016 world health organization classification of tumors of the central nervous system: a summary. Acta Neuropathol. 131, 803–820. doi: 10.1007/s00401-016-1545-1
Madsen, R. R., Vanhaesebroeck, B., and Semple, R. K. (2018). Cancer-associated PIK3CA mutations in overgrowth disorders. Trends Mol. Med. 24, 856–870. doi: 10.1016/j.molmed.2018.08.003
Malone, C. F., Fromm, J. A., Maertens, O., DeRaedt, T., Ingraham, R., and Cichowski, K. (2014). Defining key signaling nodes and therapeutic biomarkers in NF1-mutant cancers. Cancer Discov. 4, 1062–1073. doi: 10.1158/2159-8290.CD-14-0159
Mayor, S., and Pagano, R. E. (2007). Pathways of clathrin-independent endocytosis. Nat. Rev. Mol. Cell Biol. 8, 603–612. doi: 10.1038/nrm2216
McMahon, H. T., and Boucrot, E. (2011). Molecular mechanism and physiological functions of clathrin-mediated endocytosis. Nat. Rev. Mol. Cell Biol. 12, 517–533. doi: 10.1038/nrm3151
Mellman, I., and Yarden, Y. (2013). Endocytosis and cancer. Cold Spring Harb. Perspect. Biol. 5:a016949. doi: 10.1101/cshperspect.a016949
Mörén, L., Bergenheim, A. T., Ghasimi, S., Brännström, T., Johansson, M., and Antti, H. (2015). Metabolomic screening of tumor tissue and serum in glioma patients reveals diagnostic and prognostic information. Metabolites 5, 502–520. doi: 10.3390/metabo5030502
Morimoto, S., Nishimura, N., Terai, T., Manabe, S., Yamamoto, Y., Shinahara, W., et al. (2005). Rab13 mediates the continuous endocytic recycling of occludin to the cell surface. J. Biol. Chem. 280, 2220–2228. doi: 10.1074/jbc.M406906200
Mosesson, Y., Chetrit, D., Schley, L., Berghoff, J., Ziv, T., Carvalho, S., et al. (2009). Monoubiquitinylation regulates endosomal localization of Lst2, a negative regulator of EGF receptor signaling. Dev. Cell 16, 687–698. doi: 10.1016/j.devcel.2009.03.015
Mosesson, Y., Mills, G. B., and Yarden, Y. (2008). Derailed endocytosis: an emerging feature of cancer. Nat. Rev. Cancer 8, 835–850. doi: 10.1038/nrc2521
Munger, J. S., Haass, C., Lemere, C. A., Shi, G. P., Wong, W. S., Teplow, D. B., et al. (1995). Lysosomal processing of amyloid precursor protein to A beta peptides: a distinct role for cathepsin S. Biochem. J. 311 (Pt 1), 299–305. doi: 10.1042/bj3110299
Murphy, J. E., Padilla, B. E., Hasdemir, B., Cottrell, G. S., and Bunnett, N. W. (2009). Endosomes: a legitimate platform for the signaling train. Proc. Natl. Acad. Sci. U. S. A. 106, 17615–17622. doi: 10.1073/pnas.0906541106
Natarajan, R., and Linstedt, A. D. (2004). A cycling cis-Golgi protein mediates endosome-to-Golgi traffic. Mol. Biol. Cell 15, 4798–4806. doi: 10.1091/mbc.e04-05-0366
Neumann, S., Schobel, S., Jager, S., Trautwein, A., Haass, C., Pietrzik, C. U., et al. (2006). Amyloid precursor-like protein 1 influences endocytosis and proteolytic processing of the amyloid precursor protein. J. Biol. Chem. 281, 7583–7594. doi: 10.1074/jbc.M508340200
Newman, J. P., Wang, G. Y., Arima, K., Guan, S. P., Waters, M. R., Cavenee, W. K., et al. (2017). Interleukin-13 receptor alpha 2 cooperates with EGFRvIII signaling to promote glioblastoma multiforme. Nat. Commun. 8:1913.
Nottingham, R. M., Pusapati, G. V., Ganley, I. G., Barr, F. A., Lambright, D. G., and Pfeffer, S. R. (2012). RUTBC2 protein, a Rab9A effector and GTPase-activating protein for Rab36. J. Biol. Chem. 287, 22740–22748. doi: 10.1074/jbc.M112.362558
Oh, J. H., Jang, S. J., Kim, J., Sohn, I., Lee, J. Y., Cho, E. J., et al. (2020). Spontaneous mutations in the single TTN gene represent high tumor mutation burden. NPJ Genom. Med. 5:33. doi: 10.1038/s41525-019-0107-6
Ostrom, Q. T., Gittleman, H., Truitt, G., Boscia, A., Kruchko, C., and Barnholtz-Sloan, J. S. (2018). CBTRUS statistical report: primary brain and other central nervous system tumors diagnosed in the United States in 2011–2015. Neuro. Oncol. 20 Suppl 4, iv1–iv86. doi: 10.1093/neuonc/noy131
Ostrowski, M., Carmo, N. B., Krumeich, S., Fanget, I., Raposo, G., Savina, A., et al. (2010). Rab27a and Rab27b control different steps of the exosome secretion pathway. Nat. Cell Biol. 12, 19–30. doi: 10.1038/ncb2000 sup pp 11-13,
Parkinson, G. T., and Hanley, J. G. (2018). Mechanisms of AMPA receptor endosomal sorting. Front. Mol. Neurosci. 11:440. doi: 10.3389/fnmol.2018.00440
Pfeffer, S. R. (2017). Rab GTPases: master regulators that establish the secretory and endocytic pathways. Mol. Biol. Cell 28, 712–715. doi: 10.1091/mbc.E16-10-0737
Preusser, M., de Ribaupierre, S., Wöhrer, A., Erridge, S. C., Hegi, M., Weller, M., et al. (2011). Current concepts and management of glioblastoma. Ann. Neurol. 70, 9–21. doi: 10.1002/ana.22425
Puertollano, R. (2005). Interactions of TOM1L1 with the multivesicular body sorting machinery. J. Biol. Chem. 280, 9258–9264. doi: 10.1074/jbc.M412481200
Redig, A. J., Capelletti, M., Dahlberg, S. E., Sholl, L. M., Mach, S., Fontes, C., et al. (2016). Clinical and molecular characteristics of NF1-mutant lung cancer. Clin. Cancer Res. 22, 3148–3156. doi: 10.1158/1078-0432.CCR-15-2377
Roberts, P. J., and Der, C. J. (2007). Targeting the Raf-MEK-ERK mitogen-activated protein kinase cascade for the treatment of cancer. Oncogene 26, 3291–3310. doi: 10.1038/sj.onc.1210422
Rodriguez, F. J., Vizcaino, M. A., and Lin, M. T. (2016). Recent advances on the molecular pathology of glial neoplasms in children and adults. J. Mol. Diagn. 18, 620–634. doi: 10.1016/j.jmoldx.2016.05.005
Schmidt, M. R., Maritzen, T., Kukhtina, V., Higman, V. A., Doglio, L., Barak, N. N., et al. (2009). Regulation of endosomal membrane traffic by a Gadkin/AP-1/kinesin KIF5 complex. Proc. Natl. Acad. Sci. U. S. A. 106, 15344–15349. doi: 10.1073/pnas.0904268106
Scita, G., and Di Fiore, P. P. (2010). The endocytic matrix. Nature 463, 464–473. doi: 10.1038/nature08910
Scott, C. C., Vacca, F., and Gruenberg, J. (2014). Endosome maturation, transport and functions. Semin. Cell Dev. Biol. 31, 2–10. doi: 10.1016/j.semcdb.2014.03.03
Sigismund, S., Avanzato, D., and Lanzetti, L. (2018). Emerging functions of the EGFR in cancer. Mol. Oncol. 12, 3–20. doi: 10.1002/1878-0261.12155
Taefehshokr, N., Yin, C., and Heit, B. (2021). Rab GTPases in the differential processing of phagocytosed pathogens versus efferocytosed apoptotic cells. Histol. Histopathol. 36, 123–135. doi: 10.14670/HH-18-252
Taguchi, T., and Misaki, R. (2011). Palmitoylation pilots ras to recycling endosomes. Small GTPases 2, 82–84. doi: 10.4161/sgtp.2.2.15245
Tall, G. G., Barbieri, M. A., Stahl, P. D., and Horazdovsky, B. F. (2001). Ras-activated endocytosis is mediated by the Rab5 guanine nucleotide exchange activity of RIN1. Dev. Cell 1, 73–82. doi: 10.1016/s1534-5807(01)00008-9
Thalappilly, S., Soubeyran, P., Iovanna, J. L., and Dusetti, N. J. (2010). VAV2 regulates epidermal growth factor receptor endocytosis and degradation. Oncogene 29, 2528–2539. doi: 10.1038/onc.2010.1
Tsai, S. Y., Segovia, J. A., Chang, T. H., Shil, N. K., Pokharel, S. M., Kannan, T. R., et al. (2015). Regulation of TLR3 Activation by S100A9. J. Immunol. 195, 4426–4437. doi: 10.4049/jimmunol.1500378
Tu, Z., Wu, L., Wang, P., Hu, Q., Tao, C., Li, K., et al. (2020). N6-Methylandenosine-related lncRNAs are potential biomarkers for predicting the overall survival of lower-grade glioma patients. Front. Cell Dev. Biol. 8:642. doi: 10.3389/fcell.2020.00642
Ungermann, C., and Kümmel, D. (2019). Structure of membrane tethers and their role in fusion. Traffic 20, 479–490. doi: 10.1111/tra.12655
Vivian, J., Rao, A. A., Nothaft, F. A., Ketchum, C., Armstrong, J., Novak, A., et al. (2017). Toil enables reproducible, open source, big biomedical data analyses. Nat. Biotechnol. 35, 314–316. doi: 10.1038/nbt.3772
Wallace, D. M., Lindsay, A. J., Hendrick, A. G., and McCaffrey, M. W. (2002). Rab11-FIP4 interacts with Rab11 in a GTP-dependent manner and its overexpression condenses the Rab11 positive compartment in HeLa cells. Biochem. Biophys. Res. Commun. 299, 770–779. doi: 10.1016/s0006-291x(02)02720-1
Wallroth, A., and Haucke, V. (2018). Phosphoinositide conversion in endocytosis and the endolysosomal system. J. Biol. Chem. 293, 1526–1535.
Weller, M., Wick, W., Aldape, K., Brada, M., Berger, M., Pfister, S. M., et al. (2015). Glioma. Nat. Rev. Dis. Primers 1:15017. doi: 10.1038/nrdp.2015.17
Yan, H., Parsons, D. W., Jin, G., McLendon, R., Rasheed, B. A., Yuan, W., et al. (2009). IDH1 and IDH2 mutations in gliomas. N. Engl. J. Med. 360, 765–773. doi: 10.1056/NEJMoa0808710
Yang, Y., He, M. Z., Li, T., and Yang, X. (2019). MRI combined with PET-CT of different tracers to improve the accuracy of glioma diagnosis: a systematic review and meta-analysis. Neurosurg. Rev. 42, 185–195. doi: 10.1007/s10143-017-0906-0
Yarden, Y., and Pines, G. (2012). The ERBB network: at last, cancer therapy meets systems biology. Nat. Rev. Cancer 12, 553–563. doi: 10.1038/nrc3309
Yoshikawa, M., Kajiho, H., Sakurai, K., Minoda, T., Nakagawa, S., Kontani, K., et al. (2008). Tyr-phosphorylation signals translocate RIN3, the small GTPase Rab5-GEF, to early endocytic vesicles. Biochem. Biophys. Res. Commun. 372, 168–172. doi: 10.1016/j.bbrc.2008.05.027
Yuan, W., Liu, B., Wang, X., Li, T., Xue, H., Mo, X., et al. (2017). CMTM3 decreases EGFR expression and EGF-mediated tumorigenicity by promoting Rab5 activity in gastric cancer. Cancer Lett. 386, 77–86. doi: 10.1016/j.canlet.2016.11.015
Zhang, M., Wang, X., Chen, X., Zhang, Q., and Hong, J. (2020). Novel immune-related gene signature for risk stratification and prognosis of survival in lower-grade glioma. Front. Genet. 11:363. doi: 10.3389/fgene.2020.00363
Zhong, Q., Peng, H. L., Zhao, X., Zhang, L., and Hwang, W. T. (2015). Effects of BRCA1-and BRCA2-related mutations on ovarian and breast cancer survival: a meta-analysis. Clin. Cancer Res. 21, 211–220.
Zhou, X., Xie, S., Wu, S., Qi, Y., Wang, Z., Zhang, H., et al. (2017). Golgi phosphoprotein 3 promotes glioma progression via inhibiting Rab5-mediated endocytosis and degradation of epidermal growth factor receptor. Neuro. Oncol. 19, 1628–1639. doi: 10.1093/neuonc/nox104
Zobiack, N., Rescher, U., Ludwig, C., Zeuschner, D., and Gerke, V. (2003). The annexin 2/S100A10 complex controls the distribution of transferrin receptor-containing recycling endosomes. Mol. Biol. Cell 14, 4896–4908. doi: 10.1091/mbc.e03-06-0387
Keywords: low-grade glioma, biomarker, endocytosis-related gene, model, prognostic signature
Citation: Wang D, Liu S and Wang G (2021) Establishment of an Endocytosis-Related Prognostic Signature for Patients With Low-Grade Glioma. Front. Genet. 12:709666. doi: 10.3389/fgene.2021.709666
Received: 14 May 2021; Accepted: 09 August 2021;
Published: 06 September 2021.
Edited by:
Marcelo R. S. Briones, Federal University of São Paulo, BrazilReviewed by:
Jinting Guan, Xiamen University, ChinaCopyright © 2021 Wang, Liu and Wang. This is an open-access article distributed under the terms of the Creative Commons Attribution License (CC BY). The use, distribution or reproduction in other forums is permitted, provided the original author(s) and the copyright owner(s) are credited and that the original publication in this journal is cited, in accordance with accepted academic practice. No use, distribution or reproduction is permitted which does not comply with these terms.
*Correspondence: Guangxin Wang, MjI4MDg4NzM4NUBxcS5jb20=
Disclaimer: All claims expressed in this article are solely those of the authors and do not necessarily represent those of their affiliated organizations, or those of the publisher, the editors and the reviewers. Any product that may be evaluated in this article or claim that may be made by its manufacturer is not guaranteed or endorsed by the publisher.
Research integrity at Frontiers
Learn more about the work of our research integrity team to safeguard the quality of each article we publish.