 Tianyu Deng
 Pengfei Zhang1†
 Dorian Garrick
 Huijiang Gao
 Fuping Zhao
95% of researchers rate our articles as excellent or good
Learn more about the work of our research integrity team to safeguard the quality of each article we publish.
Find out more
ORIGINAL RESEARCH article
Front. Genet. , 03 January 2022
Sec. Livestock Genomics
Volume 12 - 2021 | https://doi.org/10.3389/fgene.2021.704118
This article is part of the Research Topic Multi-Layered Genome-Wide Association/Prediction in Animals View all 10 articles
Genotype imputation is the term used to describe the process of inferring unobserved genotypes in a sample of individuals. It is a key step prior to a genome-wide association study (GWAS) or genomic prediction. The imputation accuracy will directly influence the results from subsequent analyses. In this simulation-based study, we investigate the accuracy of genotype imputation in relation to some factors characterizing SNP chip or low-coverage whole-genome sequencing (LCWGS) data. The factors included the imputation reference population size, the proportion of target markers /SNP density, the genetic relationship (distance) between the target population and the reference population, and the imputation method. Simulations of genotypes were based on coalescence theory accounting for the demographic history of pigs. A population of simulated founders diverged to produce four separate but related populations of descendants. The genomic data of 20,000 individuals were simulated for a 10-Mb chromosome fragment. Our results showed that the proportion of target markers or SNP density was the most critical factor affecting imputation accuracy under all imputation situations. Compared with Minimac4, Beagle5.1 reproduced higher-accuracy imputed data in most cases, more notably when imputing from the LCWGS data. Compared with SNP chip data, LCWGS provided more accurate genotype imputation. Our findings provided a relatively comprehensive insight into the accuracy of genotype imputation in a realistic population of domestic animals.
The availability of next-generation sequencing technologies has made it possible to take account of whole-genome sequencing (WGS) data for genome-wide association studies (GWASs) or genomic prediction (GP) (Koboldt et al., 2013; Ni et al., 2017). However, whole genome resequencing is typically more expensive than SNP chip genotyping in most species, precluding deep sequencing of every individual in a population. Accordingly, over the past decade, the application of GWAS and GP has mainly been based on SNP chip data. The content of SNP arrays have typically been chosen from a database comprising relatively small numbers of sequenced individuals, which can result in ascertain bias (Lachance and Tishkoff, 2013). Although SNP chips tend to be cost-effective compared to sequencing, they cannot capitalize on all the genomic information if the SNPs on the chip array have incomplete linkage disequilibrium with the causal mutations. Furthermore, they do not provide the understanding of the causal mutation that can be obtained by annotation of highly significant sequence variants. One option is to impute SNP array genotypes to sequence resolution based on a reference population of a small number of deeply sequenced relatives. Another option is imputation from a large number of sparsely sequenced individuals, obtained from low-coverage whole-genome sequencing (LCWGS). Compared to SNP chip data, LCWGS can expose the segregating sequence variants and mitigate the ascertainment bias from SNP array.
Regardless of whether SNP arrays or LCWGS are used to characterize genotypes, imputation is an essential step in a GWAS or as a precursor to genomic prediction (Li et al., 2009; Al Kalaldeh et al., 2019). Imputation can infer unobserved genotypes in a sample of individuals that have higher genotyping density from an SNP array, LCWGS, or WGS. Since WGS data should contain all genomic variants including causal mutations, it can increase the probability that causal variants can be directly identified. Accordingly, imputation can boost the power of GWAS analyses, improve the accuracy of GEBV in genomic prediction, be the basis for fine mapping, and facilitate meta-analysis that combines multiple studies based on different types of marker sets (Druet et al., 2014; Al-Tassan et al., 2015; Song et al., 2019).
Orho-Melander et al. (2008) imputed untyped HapMap SNPs to carry out fine-mapping and consequently found that GCKR rs780094 was associated with opposite effects on fasting plasma triglyceride concentrations. Many novel loci that increased the risk of type 2 diabetes were identified using high-density imputation (Mahajan et al., 2018). Association statistics obtained using imputed data from ultra low-coverage (0.24x) sequencing data attained similar p-values at known associated variants to those which had been obtained using an SNP chip (Pasaniuc et al., 2012). Huang et al. (2015) used imputation to construct a genome map for 1,495 elite hybrid rice varieties and their inbred parental lines and investigated 38 agronomic traits. They identified 130 associated loci which proved that the accumulation of numerous rare superior alleles with positive dominance was an important contributor to the heterotic phenomena.
The advent of low-cost next-generation sequencing has led to a rapid increase in the size of publicly available reference data sets. For example, the 1,000 Bull Genomes Project (http://www.1000bullgenomes.com/) has now sequenced thousands of animals and obtained about 155 million genetic variants representing many of the world’s cattle breeds, providing a high-quality reference population (Georges, 2014; Hayes and Daetwyler, 2019). Many studies have used the variants in that reference population for imputation to new datasets to improve the accuracy of genomic prediction or to identify new candidate genes (Ibeagha-Awemu et al., 2016; Aliloo et al., 2018).
However, using low-quality imputed data may not lead to reliable GWAS or higher accuracy in genomic predictions (van Binsbergen et al., 2014). Multiple factors can affect the imputation accuracy, including size of the imputation reference panel, the imputation method, the minor allele frequency of the variant being imputed, the accuracy of phasing that constructs haplotypes in the reference and the study samples, and the sequencing coverage of the reference panel (Das et al., 2018). Although some of the effects of these factors have been analyzed separately, a comprehensive analysis that jointly considered these factors would help users design more powerful datasets for GWAS or genomic prediction.
In this study, we employed simulations based on coalescence theory using msprime software to simulate sequence resolution data that are compatible with our knowledge of the demographic history of pigs (Pérez-Enciso, 2014). Pig populations experienced genetic mutation, migration, and bottleneck effects (Giuffra et al., 2000; Kim et al., 2002; Frantz et al., 2015), and the detailed parameters used are shown in Table 1. Following 58,000 simulated generations, four separate but related populations were simulated, which we refer to as P1, P2, P3, or P4 according to their genetic distance (Figure 1). In these four populations, there were a total of 20,000 diploid samples with 10 Mb of simulated sequence data. The P1 population included 11,000 individuals, while each of the other three populations had 3,000 samples. The first 1,000 individuals from P1 represented the target population for imputation. We randomly selected biallelic variants with MAF ≥ 0.01 in the target population to generate LCWGS data, and then selected evenly spaced markers at various densities to represent SNP chip data.
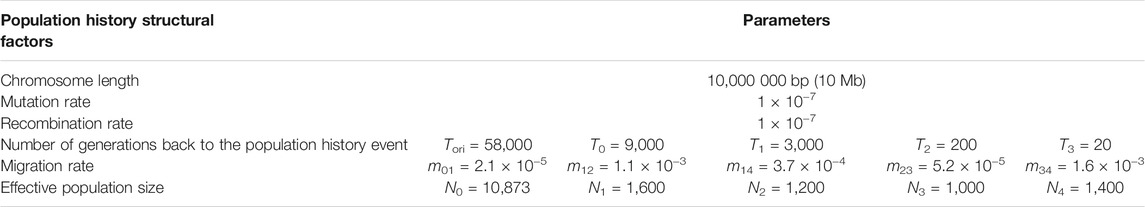
TABLE 1. Parameters used of the simulation with msprime.
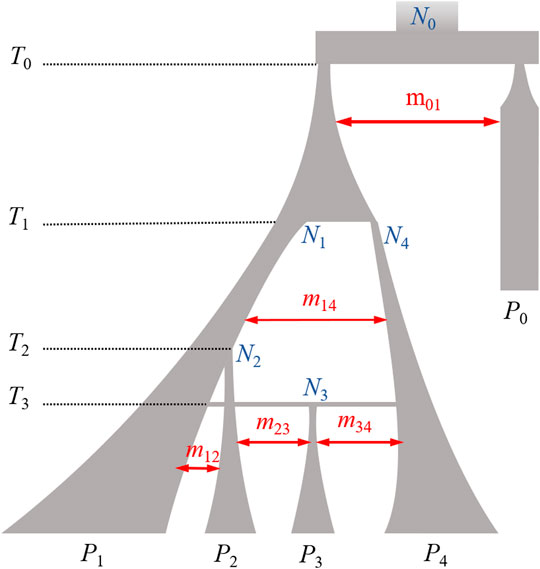
FIGURE 1. Illustration of the simulation demographic model. Branch width corresponding to population size and time flowing from the top to the bottom. The width of the double arrows is proportional to the migration intensity. Ti, number of generations back to the population history event; Nj, effective population size of Pj population; mxy, migration rate between Px and Py. Model details are provided in Table 1 and Supplementary Text S1.
We used the WGS data to calculate the average kinship coefficients in a pair-wise fashion between individuals in these populations, as in Table 2. The kinship coefficients between P1 and P2–P4 decrease successively, reflecting the increases in the genetic distances separating them.
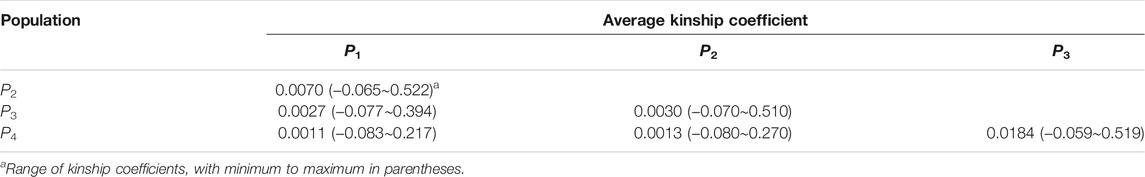
TABLE 2. Genetic relationship between pair-wise populations.
We took four factors affecting imputation accuracy for LCWGS and SNP chip data into account. These were the proportion of SNP markers relative to target sequence variants (i.e., SNP chip density), imputation reference population size, genetic distance between target and imputation reference population, and the methods of imputation. Table 3 lists the levels of each factor considered. A total of 336 scenarios representing all the factorial combinations of these levels were analyzed. In terms of SNP density, we set six levels where 1, 5, 10, 30, 50, or 90% of genomic biallelic variants were present on the SNP chip or LCWGS, the target marker number or density in reference populations are shown in Table 4. In the P1 population, we selected 100, 1 k, 3 k, 5 k, or 10 k simulated individuals to represent the imputation reference population but did not include any of the target individuals. For each of the other three populations, we set three levels of 100, 1 k, and 3 k of imputation reference samples.
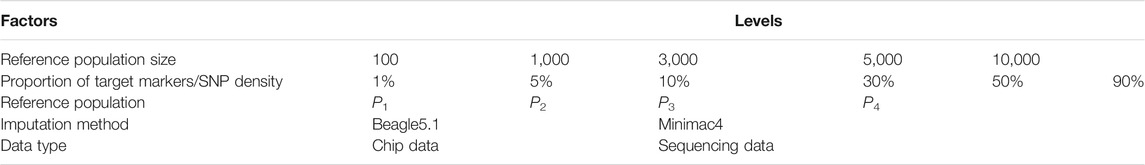
TABLE 3. Levels of each factor to define the imputation scenarios.
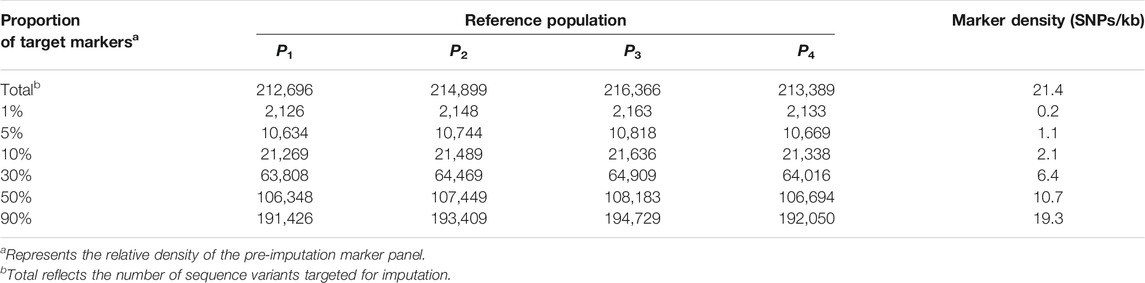
TABLE 4. Number of segregating genetic variants in four simulated populations.
Imputation for every scenario was undertaken using Beagle5.1 (20Nov19.573) in comparison to Minimac4 v1.0.0, both with default parameter settings. Each program was run using its specific formats for reference panel data (bref3 for Beagle5.1 and m3vcf for Minimac4). We used Minimac3 to construct the m3vcf files. All imputation analyses were run on a dedicated 24-core 2.1-GHz workstation with an Intel Xeon Silver 4116 CPU and 128 GB of memory, and we evaluated one program at a time using five computational threads.
Imputation reliability and the error rate were used as the two criteria to assess imputation accuracy. The imputation reliability is the squared Pearson correlation coefficient between the imputed genotypes and the true genotypes at a specific locus. The genotypes were coded as 0, 1, or 2, corresponding to the homozygous reference allele, heterozygous alternative allele, or homozygous alternative allele. The equation can be written as follows:
where
The error rate refers to the percentage of loci that have wrongly imputed alleles:
where
We allocated the markers into several bins according to their MAFs and reported the average values of the imputation reliability and the error rate for all the markers within each bin. Furthermore, we calculated the regression of the imputation reliability or the error rate on the levels of each factor to determine if the factor had a significant effect (p < 0.05). We also report the correlation between the levels of each factor with the imputation reliability or the error rate. We used coefficients of variation (CVs) of the imputation reliability and the error rate to characterize imputation accuracy. The imputation computing time taken is reported for each scenario.
Significant differences in imputation reliabilities when imputing the sequence data were observed with regard to reference population size. Beagle5.1 typically outperformed Minimac4 with regression coefficients for reliability on reference population size being
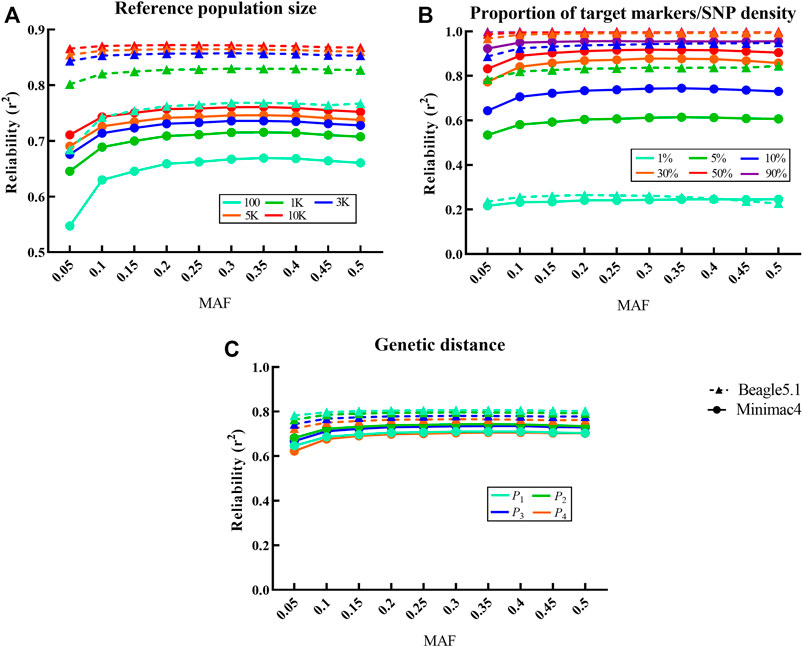
FIGURE 2. Influence of different factors on imputation reliability in LCWGS data. For each fixed level of the factors under each scenarios, the average at different levels of all other factors is taken as the reliability. Imputed alleles are binned according to their MAF count in each scenarios. Dotted line with a triangle sign represents Beagle5.1, while the solid line with a round sign represents Minimac4. Different colored signs represent different levels. (A) Influence of reference population size on imputation reliability. (B) Influence of the proportion of target markers or SNP density on imputation reliability. (C) Influence of genetic distance between reference population and target population on imputation reliability.
Changes in SNP density in the target population significantly affect the reliability of Beagle5.1 and Minimac4 (p < 10−4,
The genetic distance between the target population and the reference population had a very significant impact on the reliability for Beagle5.1 (p < 10−4,
CVs of imputation reliability varied at different levels for the above factors. For Beagle5.1, the CV of reference population size, proportion of target markers/SNP density, and genetic distance were 0.051, 0.320, and 0.021, respectively, while the CV of reference population size and proportion of target markers/SNP density in Minimac4 were 0.051 and 0.340. These indicate that proportion of target markers/SNP density is the most important factor affecting the imputation reliability in both methods.
The imputation reliabilities (Table 5) of Beagle5.1 ranged from 0.21 to 1.00 under different levels of SNP density and reference population size, while the imputation reliabilities of Minimac4 ranged from 0.14 to 0.95. In most cases, the reliabilities of Beagle5.1 were higher than those of Minimac4, except when SNP density was 1% and the reference population size was greater than 5,000. To obtain r2 ≥ 0.8 with at least 100 individuals in a reference population, Beagle5.1 required an SNP density of 10%, but Minimac4 required an SNP density of around 30%. Minimac4 could not achieve imputation accuracies of 100%. The performance of Beagle5.1 in reliability was better than that of Minimac4.
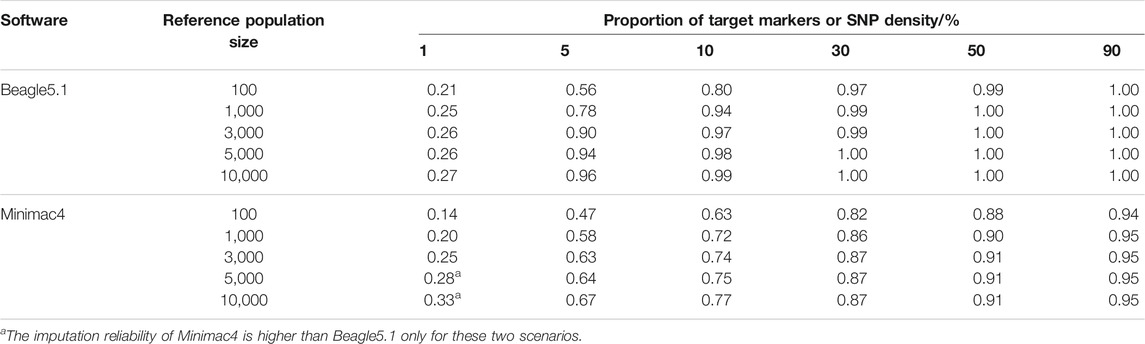
TABLE 5. Imputation reliability for different levels of imputation reference population size and SNP density.
The reference population size (Figure 3) had a very significant effect on the imputation error rate of Beagle5.1 with a negative correlation (
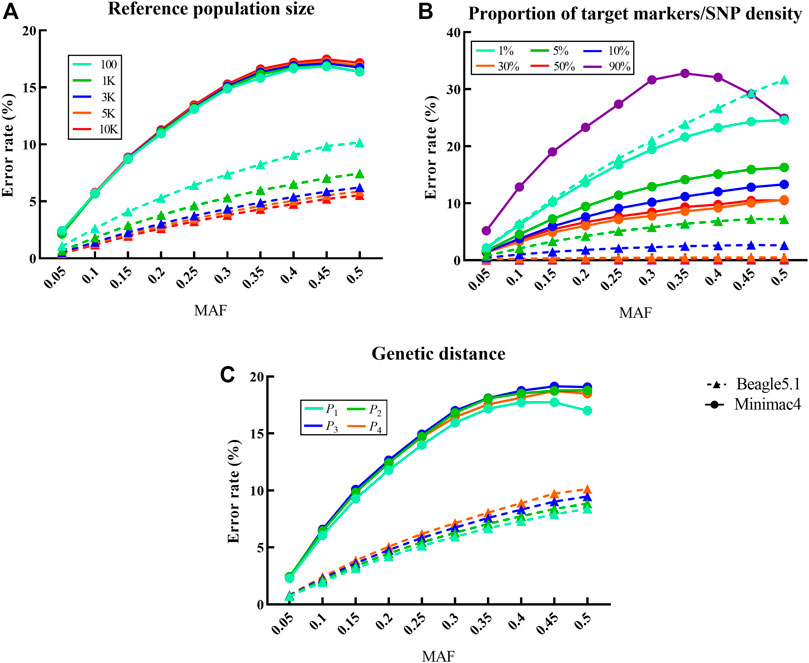
FIGURE 3. Influence of different factors on the imputation error rate in LCWGS data. For each fixed level of the factors under each scenarios, the average at different levels of all other factors is taken as the error rate. Imputed alleles are binned according to their MAF count in each scenarios. Dotted line with a triangle sign represents Beagle5.1, while the solid line with a round sign represents Minimac4. Different colored signs represent different levels. (A) Influence of reference population size on the imputation error rate. (B) Influence of proportion of target markers or SNP density on the imputation error rate. (C) Influence of genetic distance between reference population and target population on the imputation error rate.
In Beagle5.1, the CVs of the imputation error rate for reference population size and SNP density were 0.262 and 1.508, respectively, while the CV of the imputation error rate affected by the SNP density in Minimac4 is 0.339. This indicated that SNP density was the most important factor affecting the error rate in both imputation methods. In addition, the uncontrollable factor MAF also has a considerable impact on the error rate.
As seen in Table 6, the imputation error rate ranges of Beagle5.1 and Minimac4 were 0.02–19.15% and 6.79–17.25%, respectively. Only when the SNP density was at the extreme low of 1% did Minimac4 exhibit its advantage. In order to achieve an imputation error rate <10%, the imputation of Beagle required SNP density over 5% or to appropriately reduce the SNP density when increasing reference population size, while Minimac4 required the SNP density above 10% but was less dependent on the size of the reference panel. When the reference sample size was 100 and SNP density was slightly higher than 10%, the error rate was less than 5% for Beagle5.1 but not for Minimac4. The performance of Beagle5.1 was better than that of Minimac4 in most cases in terms of the error rate.
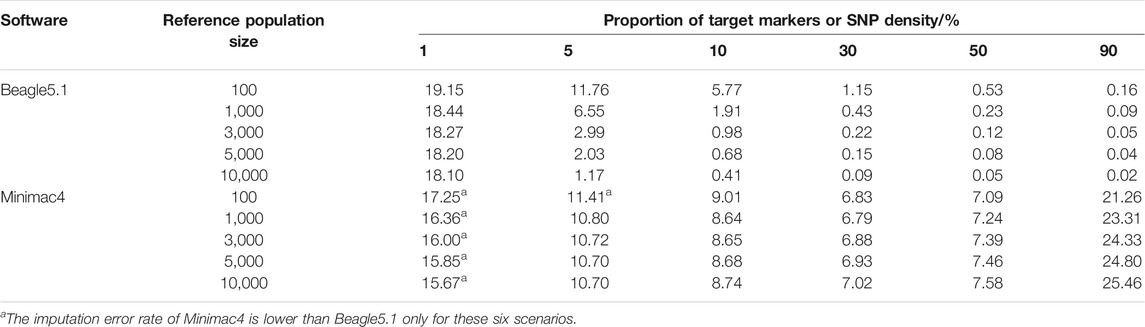
TABLE 6. Imputation error rate (%) in the different levels of reference population size and SNP density.
The runtimes to impute to the sequence level taken by the two methods in the 1,000-target sample under all scenarios are summarized in Table 7. As seen in Table 7, both the reference population size and SNP density affected the imputation times. Minimac4 was always faster than Beagle5.1. Reference population size and SNP density hardly affected the imputation times taken for Beagle5.1 (Supplementary Table S3). The imputation time of Beagle5.1 only increased with an increase in the proportion of target markers. Beagle5.1 was only faster than Minimac4 when the percentage of target markers was 1% and the reference population sample was more than 1,000 individuals or when the proportion of target markers was 5% and the reference population sample was 10,000. However, considering the trend that the size of the reference population has little effect on time consumed in Beagle5.1, it is likely that Beagle5.1 will eventually be faster than Minimac4 as the reference population size continues to increase.
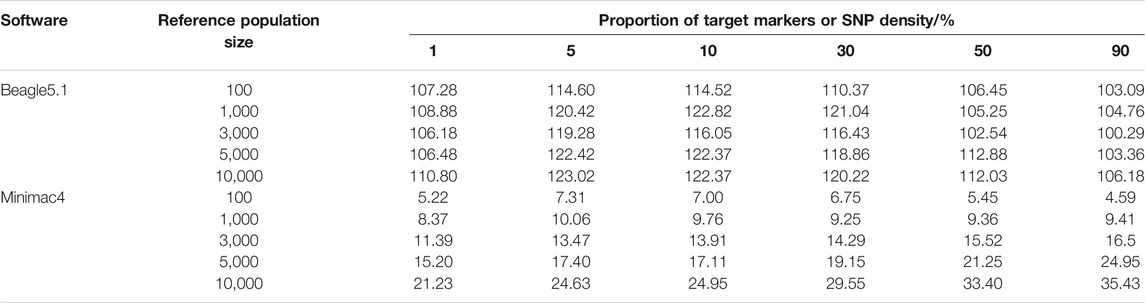
TABLE 7. Runtime (min) to impute 10 Mb low-coverage whole-genome sequencing data with regard to software, reference population size, and proportion of target markers/SNP density.
We have calculated the CV of the two imputation accuracy standards in all scenarios. The CV is defined as the ratio of the standard deviation to the mean, and it can indicate the extent of the impact of factors considered on the imputation accuracy. Each row in Table 8 represents a different imputation scenario with the asterisked ones being the most important factor affecting imputation in each situation. It can be seen that the SNP density (the proportion of target markers) was the most important in most scenarios. Compared to Minimac4, the imputation accuracies of Beagle5.1 were affected by more factors under the same condition.
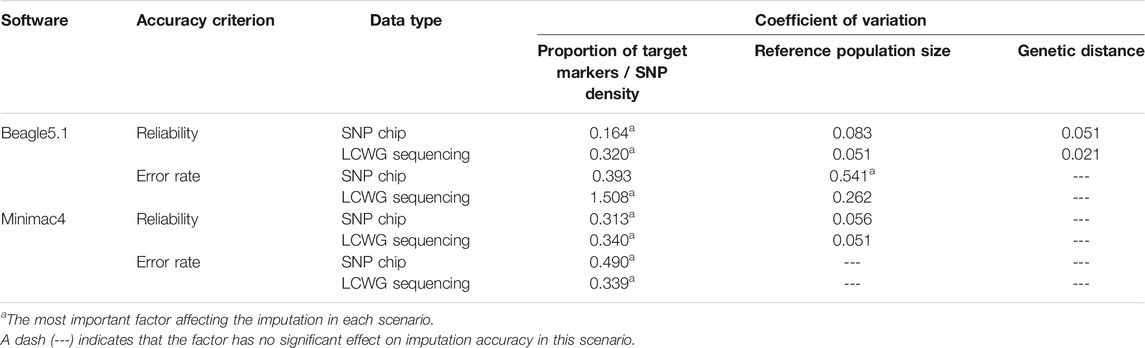
TABLE 8. Coefficient of variation of imputation reliability and imputation error rates.
Although the changes of various factors in this study have almost the same influence on imputation of either LCWGS or chip data, when the level of each factor is the same, there is a difference in imputation between chip data and LCWGS data. Therefore, we directly compared the imputation of the two methods based on the two types of data. The imputation reliability of the two types of data in Beagle5.1 is shown in Figure 4A. When the proportion of target markers is 1%, the average imputation reliability using chip data is 0.51, which is higher than the 0.25 using sequencing data. When the proportion of target markers is greater than 5% (the reliability of the two data types is equal to 0.83), the imputation reliability of LCWGS data completely surpasses that of chip data, and when the proportion of target makers is 30%, the average reliability using LCWGS data can reach the extremely high level of 0.99. Using the Minimac4 method, the reliability with chip data is not less than that with LCWGS data except when the proportion of target markers is 1% and both are 0.24. At other levels, higher imputation reliability can be obtained with LCWGS data (Figure 4B).
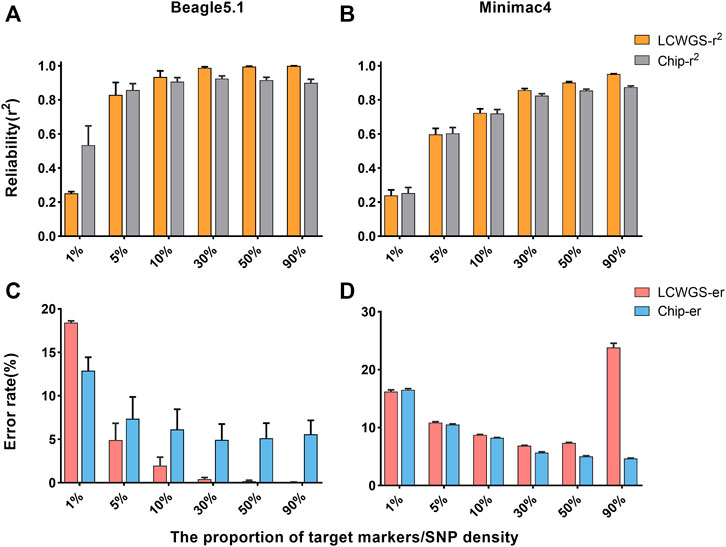
FIGURE 4. Comparison of imputation accuracy using two types of data. (A) Comparison of reliability in Beagle5.1. (B) Comparison of reliability in Minimac4. (C) Comparison of the error rate in Beagle5.1. (D) Comparison of the error rate in Minimac4. LCWGS-r2, imputation reliability use LCWG sequence data; Chip-r2, imputation reliability use chip data; LCWGS-er, imputation error rate use LCWG sequence data; Chip-er, imputation error rate use chip data.
Figure 4C shows the error rate of imputation with two types of data in Beagle5.1. When the target marker proportion is ≥5%, the error rate with LCWGS data was lower than that with chip data and can reach at best 4.9%. In contrast, when imputation was with chip data, the error rate in all cases was higher. In Minimac4 (Figure 4D), there was no significant difference in the error rate between imputation with the two types of data, but neither reached the best achieved by Beagle5.1. These showed that in most cases, compared to imputation with chip data, imputation with LCWGS data can achieve higher accuracy imputation, especially in terms of the imputation error rate.
In previous studies (van Binsbergen et al., 2014; Kreiner-Møller et al., 2015; Schurz et al., 2019), the imputation reliability and the imputation error rate were used to assess imputation accuracy. Imputation reliability appears to be a more useful measure with respect to genomic prediction because the nature of imputation reliability coincides with the definition of reliability used for breeding values, and it does not depend on minor allele frequency (MAF). The imputation error rate depends on MAF, which makes it difficult to select the imputed SNPs used for subsequent predictions (Calus et al., 2014).
Imputation accuracy is more problematic for rare variants. Rare variants mean that the locus is almost mono-allelic. The correlation is not defined when one or other of the vectors of true and imputed variants are mono-allelic. Many rare variants will be excluded in subsequent analyses (Pook et al., 2020). Therefore, both imputation reliability and error rate were used to evaluate the accuracy of imputation in this study to consider different applications of the imputed data.
With the development of sequencing technology and the reduction of sequencing costs, choosing SNP chip or LCWGS data has become blurred. In this study, the imputation accuracies of two types of genomic data were different, but under the same scenario, these two types of genetic data have similar influences on significance for each factor considered. That is, the imputation process was not affected by the data type to impute. In the case of the SNP density or proportion of target markers being ≥5%, the imputation performance of Beagle5.1 for the LCWGS data was better than that for the SNP array data, especially in terms of the error rate. This was consistent with findings by Rubinacci et al. (2021), who reported that the reliability of imputation of human sequencing data was the highest in ultrahigh-density chip data, sequencing data, and chip data. Moreover, VanRaden et al. (2015) compared the imputation of low- or medium-density chip data with low-coverage sequencing data with similar costs and found that 1× and 2× deep sequencing data performed better than 10 and 60 K chip data in terms of the imputation error rate and reliability. All these results suggest that low-coverage whole-genome sequencing data has great potential for imputing to whole-genome sequencing resolution. It should be noted that in the case of the proportion of target marker/SNP density being ≤1%, the imputation accuracy of Minimac4 for LCWGS was better than that of Beagle5.1. This might be because SNP markers evenly distributed in the genome can capture more genetic information than LWGS data with a limited number of genetic variants.
Apart from the choice of imputation reference panel, the software used affects the imputation accuracy. In this study, we only compared two software products including Beagle5.1 and Minimac4. Both packages are based on a ‘state-space reduction’ of the hidden Markov models (HMMs) describing haplotype sharing, but the specific simplification methods are different. In Beagle5.1, genotype imputation is based on identity by descent (IBD) and uses the genotypes at the target markers to identify long IBD segments that a target haplotype shares with the reference haplotypes before imputation. It integrates the identified IBD fragments of different lengths into a subset that contains almost the same information as the complete reference haplotypes (Browning et al., 2018). While Minimac4’s model first divides the whole genome into consecutive blocks and iterates only over the unique haplotypes in each genomic block (for imputation with a fixed chromosome length, the length of these blocks is fixed). It uses a reversible mapping function that can reconstruct exactly the state space used by Minimac4 (Das et al., 2016). This will also change the length and number of IBDs in the subset. This is the reason why Beagle5.1 is more sensitive to reference population size. The flexible and computationally intensive method makes Beagle5.1 more suitable for imputing sequencing data in a large reference population size. Under most scenarios, the imputation accuracies of Beagle5.1 were better than those of Minimac4. When the reference population was small, Minimac4 had better performance in the error rate than Beagle5.1. This was consistent with the results of Korkuć et al. (2019). It should be mentioned that when the proportion of target markers was 90%, the imputation error rate of Minimac4 increased abnormally. This was due to the over-correction that caused the error rate of some alleles to be greater than 100% during imputation. To further explain this phenomenon, we rerun our script using Minimac4 when proportions of target markers were 70 and 80%. We still found that the results were similar to that of the density of 90%, and the numbers of alleles with over-correction increased with the increase in density (Supplementary Table S4). This may be a bug of Minimac4.
In the present study, increasing the reference population size led to more accurate imputation, which agreed with other studies (Delaneau et al., 2013; García-Ruiz et al., 2015). A larger reference population can provide more reference haplotypes and the target markers can be more easily matched to the haplotypes, making the reliability higher. Our results are similar to the findings of Hozé et al. (2013), that is, changes of reference population size in Beagle5.1 has a significant impact on the error rate. However, Zhang and Druet (2010) reported that compared with the number of SNPs and genetic distance between populations, the size of the reference population had a relatively small effect on the imputation error rate, which is similar to our findings for Minimac4. This also reflects the differences in calculations between the methods.
In order to obtain high reliability and low error rate imputation, in addition to choosing target markers that more easily match reference haplotypes, we can increase the proportion of target markers or SNP density or select individuals closely related to the target population as the reference population. Another factor that affected the imputation error rate was the difference in MAF, which at first sight may be an unexpected indicator for imputation, especially since haplotypes are used for imputation. However, as shown in other studies (Huang et al., 2009; Oliveira Júnior et al., 2017), since the process of imputation first calculated correlation between reference and target haplotypes and then considered the consistency between the haplotypes, when imputing markers with a higher allele frequency can maintain high correlations, if the frequency between the two genotypes were similar, the marker may not be imputed correctly.
In general, SNP density/the proportion of target markers should be considered first. In this study, when the proportion of target markers was less than 1%, the imputation results in all cases were very poor except that the reliability of imputing chip data with Beagle5.1 could be more than 0.5. An alternative method was a two-step method that has been proven to improve imputation reliability which first imputed the target marker with low-density to a medium-density chip or high-density chip data and then further imputed to sequence resolution (Kreiner-Møller et al., 2015; Wang et al., 2015). A large number of high-coverage sequencing individuals as the reference population data will significantly increase the cost. When the total sequencing depth is fixed (e.g., constrained by budget), balancing the number and depth of sequencing individuals can effectively improve the imputation accuracy, such as using 1,000 individuals with depths of 8× as a reference population have higher imputation reliability than a reference population composed of 500 individuals with 16× (VanRaden et al., 2015). On the other hand, the development and progress of the network database and cloud server technologies also provide opportunities for solving this issue (Das et al., 2018). For instance, the 1,000 Genomes Project and Haplotype Reference Consortium (HRC) public dataset in human research greatly facilitates the application of genotype imputation (Rubinacci et al., 2021). However, in the animal domain, except for the 1,000 Bull Genomes Project (Hayes and Daetwyler, 2019), data sharing channels are still very limited. The use of multiple populations to form a mixed reference population can effectively reduce genetic distance and improve imputation accuracy (Schurz et al., 2019).
In this study, we have comprehensively analyzed the influence of several factors on the accuracy of genotype imputation. The proportion of target marker/SNP density has a very significant impact on the imputation reliability and the error rate under all imputation situations, which indicate that it is the most important factor in genotype imputation. The imputation performance of Beagle5.1 was better than Minimac4 in most cases, but when the reference population was small, SNP density was low, or genetic distance was large; the imputation accuracy of Beagle5.1 was more easily affected than that of Minimac4. Compared with Minimac4, Beagle5.1 can achieve better imputation performance with relatively relaxed conditions, which was more obvious when the LCWG sequencing data was used to impute to sequence data. Except in the case of extremely low SNP density, the imputation accuracy based on sequencing data is usually better than that based on chip data. Our results provided a reference for the application of genotype imputation in domestic animals.
The raw data supporting the conclusion of this article will be made available by the authors, without undue reservation.
FZ and LW conceived this research and designed the experiments. TD and PZ conducted the research and drafted the manuscript. DG and HG participated in its design and participated in drafting the manuscript. All authors contributed to the article and approved the final manuscript.
This research was funded by the Natural Science Foundations of China (No. 31572357) to FZ, the China Agriculture Research System of MOF and MARA (CARS-35) and the Agricultural Science and Technology Innovation Program (ASTIP-IAS02) to LW, and the Science and Technology Project of the Inner Mongolia Autonomous Region (No. 2020GG0210) to HG.
The authors declare that the research was conducted in the absence of any commercial or financial relationships that could be construed as a potential conflict of interest.
All claims expressed in this article are solely those of the authors and do not necessarily represent those of their affiliated organizations, or those of the publisher, the editors, and the reviewers. Any product that may be evaluated in this article, or claim that may be made by its manufacturer, is not guaranteed or endorsed by the publisher.
The Supplementary Material for this article can be found online at: https://www.frontiersin.org/articles/10.3389/fgene.2021.704118/full#supplementary-material
Al Kalaldeh, M., Gibson, J., Duijvesteijn, N., Daetwyler, H. D., MacLeod, I., Moghaddar, N., et al. (2019). Using Imputed Whole-Genome Sequence Data to Improve the Accuracy of Genomic Prediction for Parasite Resistance in Australian Sheep. Genet. Sel Evol. 51 (1), 32. doi:10.1186/s12711-019-0476-4
Al-Tassan, N. A., Whiffin, N., Hosking, F. J., Palles, C., Farrington, S. M., Dobbins, S. E., et al. (2015). A New GWAS and Meta-Analysis with 1000Genomes Imputation Identifies Novel Risk Variants for Colorectal Cancer. Sci. Rep. 5 (1), 10442. doi:10.1038/srep10442
Aliloo, H., Mrode, R., Okeyo, A. M., Ni, G., Goddard, M. E., and Gibson, J. P. (2018). The Feasibility of Using Low-Density Marker Panels for Genotype Imputation and Genomic Prediction of Crossbred Dairy Cattle of East Africa. J. Dairy Sci. 101 (10), 9108–9127. doi:10.3168/jds.2018-14621
Browning, B. L., Zhou, Y., and Browning, S. R. (2018). A One-Penny Imputed Genome from Next-Generation Reference Panels. Am. J. Hum. Genet. 103 (3), 338–348. doi:10.1016/j.ajhg.2018.07.015
Calus, M. P. L., Bouwman, A. C., Hickey, J. M., Veerkamp, R. F., and Mulder, H. A. (2014). Evaluation of Measures of Correctness of Genotype Imputation in the Context of Genomic Prediction: a Review of Livestock Applications. Animal 8 (11), 1743–1753. doi:10.1017/s1751731114001803
Das, S., Abecasis, G. R., and Browning, B. L. (2018). Genotype Imputation from Large Reference Panels. Annu. Rev. Genom. Hum. Genet. 19, 73–96. doi:10.1146/annurev-genom-083117-021602
Das, S., Forer, L., Schönherr, S., Sidore, C., Locke, A. E., Kwong, A., et al. (2016). Next-generation Genotype Imputation Service and Methods. Nat. Genet. 48 (10), 1284–1287. doi:10.1038/ng.3656
Delaneau, O., Zagury, J.-F., and Marchini, J. (2013). Improved Whole-Chromosome Phasing for Disease and Population Genetic Studies. Nat. Methods 10 (1), 5–6. doi:10.1038/nmeth.2307
Druet, T., Macleod, I. M., and Hayes, B. J. (2014). Toward Genomic Prediction from Whole-Genome Sequence Data: Impact of Sequencing Design on Genotype Imputation and Accuracy of Predictions. Heredity 112 (1), 39–47. doi:10.1038/hdy.2013.13
Frantz, L. A. F., Schraiber, J. G., Madsen, O., Megens, H.-J., Cagan, A., Bosse, M., et al. (2015). Evidence of Long-Term Gene Flow and Selection during Domestication from Analyses of Eurasian Wild and Domestic Pig Genomes. Nat. Genet. 47 (10), 1141–1148. doi:10.1038/ng.3394
García-Ruiz, A., Ruiz-Lopez, F. J., Wiggans, G. R., Van Tassell, C. P., and Montaldo, H. H. (2015). Effect of Reference Population Size and Available Ancestor Genotypes on Imputation of Mexican Holstein Genotypes. J. Dairy Sci. 98 (5), 3478–3484. doi:10.3168/jds.2014-9132
Georges, M. (2014). Towards Sequence-Based Genomic Selection of Cattle. Nat. Genet. 46 (8), 807–809. doi:10.1038/ng.3048
Giuffra, E., Kijas, J. M. H., Amarger, V., Carlborg, Ö., Jeon, J.-T., and Andersson, L. (2000). The Origin of the Domestic Pig: Independent Domestication and Subsequent Introgression. Genetics 154 (4), 1785–1791. doi:10.1093/genetics/154.4.1785
Hayes, B. J., and Daetwyler, H. D. (2019). 1000 Bull Genomes Project to Map Simple and Complex Genetic Traits in Cattle: Applications and Outcomes. Annu. Rev. Anim. Biosci. 7 (1), 89–102. doi:10.1146/annurev-animal-020518-115024
Hozé, C., Fouilloux, M.-N., Venot, E., Guillaume, F., Dassonneville, R., Fritz, S., et al. (2013). High-density Marker Imputation Accuracy in Sixteen French Cattle Breeds. Genet. Sel Evol. 45 (1), 33. doi:10.1186/1297-9686-45-33
Huang, L., Wang, C., and Rosenberg, N. A. (2009). The Relationship between Imputation Error and Statistical Power in Genetic Association Studies in Diverse Populations. Am. J. Hum. Genet. 85 (5), 692–698. doi:10.1016/j.ajhg.2009.09.017
Huang, X., Yang, S., Gong, J., Zhao, Y., Feng, Q., Gong, H., et al. (2015). Genomic Analysis of Hybrid rice Varieties Reveals Numerous superior Alleles that Contribute to Heterosis. Nat. Commun. 6 (1), 6258. doi:10.1038/ncomms7258
Ibeagha-Awemu, E. M., Peters, S. O., Akwanji, K. A., Imumorin, I. G., and Zhao, X. (2016). High Density Genome Wide Genotyping-By-Sequencing and Association Identifies Common and Low Frequency SNPs, and Novel Candidate Genes Influencing Cow Milk Traits. Sci. Rep. 6 (1), 31109. doi:10.1038/srep31109
Kim, K.-I., Lee, J.-H., Li, K., Zhang, Y.-P., Lee, S.-S., Gongora, J., et al. (2002). Phylogenetic Relationships of Asian and European Pig Breeds Determined by Mitochondrial DNA D-Loop Sequence Polymorphism. Anim. Genet. 33 (1), 19–25. doi:10.1046/j.1365-2052.2002.00784.x
Koboldt, D. C., Steinberg, K. M., Larson, D. E., Wilson, R. K., and Mardis, E. R. (2013). The Next-Generation Sequencing Revolution and its Impact on Genomics. Cell 155 (1), 27–38. doi:10.1016/j.cell.2013.09.006
Korkuć, P., Arends, D., and Brockmann, G. A. (2019). Finding the Optimal Imputation Strategy for Small Cattle Populations. Front. Genet. 10, 52. doi:10.3389/fgene.2019.00052
Kreiner-Møller, E., Medina-Gomez, C., Uitterlinden, A. G., Rivadeneira, F., and Estrada, K. (2015). Improving Accuracy of Rare Variant Imputation with a Two-step Imputation Approach. Eur. J. Hum. Genet. 23 (3), 395–400. doi:10.1038/ejhg.2014.91
Lachance, J., and Tishkoff, S. A. (2013). SNP Ascertainment Bias in Population Genetic Analyses: Why it Is Important, and How to Correct it. Bioessays 35 (9), 780–786. doi:10.1002/bies.201300014
Li, Y., Willer, C., Sanna, S., and Abecasis, G. (2009). Genotype Imputation. Annu. Rev. Genom. Hum. Genet. 10, 387–406. doi:10.1146/annurev.genom.9.081307.164242
Mahajan, A., Taliun, D., Thurner, M., Robertson, N. R., Torres, J. M., Rayner, N. W., et al. (2018). Fine-mapping Type 2 Diabetes Loci to Single-Variant Resolution Using High-Density Imputation and Islet-specific Epigenome Maps. Nat. Genet. 50 (11), 1505–1513. doi:10.1038/s41588-018-0241-6
Ni, G., Cavero, D., Fangmann, A., Erbe, M., and Simianer, H. (2017). Whole-genome Sequence-Based Genomic Prediction in Laying Chickens with Different Genomic Relationship Matrices to Account for Genetic Architecture. Genet. Sel Evol. 49 (1), 8. doi:10.1186/s12711-016-0277-y
Oliveira Júnior, G. A., Chud, T. C. S., Ventura, R. V., Garrick, D. J., Cole, J. B., Munari, D. P., et al. (2017). Genotype Imputation in a Tropical Crossbred Dairy Cattle Population. J. Dairy Sci. 100 (12), 9623–9634. doi:10.3168/jds.2017-12732
Orho-Melander, M., Melander, O., Guiducci, C., Perez-Martinez, P., Corella, D., Roos, C., et al. (2008). Common Missense Variant in the Glucokinase Regulatory Protein Gene Is Associated with Increased Plasma Triglyceride and C-Reactive Protein but Lower Fasting Glucose Concentrations. Diabetes 57 (11), 3112–3121. doi:10.2337/db08-0516
Pasaniuc, B., Rohland, N., McLaren, P. J., Garimella, K., Zaitlen, N., Li, H., et al. (2012). Extremely Low-Coverage Sequencing and Imputation Increases Power for Genome-wide Association Studies. Nat. Genet. 44 (6), 631–635. doi:10.1038/ng.2283
Pérez-Enciso, M. (2014). Genomic Relationships Computed from Either Next-Generation Sequence or Array SNP Data. J. Anim. Breed. Genet. 131 (2), 85–96. doi:10.1111/jbg.12074
Pook, T., Mayer, M., Geibel, J., Weigend, S., Cavero, D., Schoen, C. C., et al. (2020). Improving Imputation Quality in BEAGLE for Crop and Livestock Data. G3 (Bethesda, Md. 10 (1), 177–188. doi:10.1534/g3.119.400798
Rubinacci, S., Ribeiro, D. M., Hofmeister, R. J., and Delaneau, O. (2021). Efficient Phasing and Imputation of Low-Coverage Sequencing Data Using Large Reference Panels. Nat. Genet. 53 (1), 120–126. doi:10.1038/s41588-020-00756-0
Schurz, H., Müller, S. J., van Helden, P. D., Tromp, G., Hoal, E. G., Kinnear, C. J., et al. (2019). Evaluating the Accuracy of Imputation Methods in a Five-Way Admixed Population. Front. Genet. 10, 34. doi:10.3389/fgene.2019.00034
Song, H., Ye, S., Jiang, Y., Zhang, Z., Zhang, Q., and Ding, X. (2019). Using Imputation-Based Whole-Genome Sequencing Data to Improve the Accuracy of Genomic Prediction for Combined Populations in Pigs. Genet. Sel Evol. 51 (1), 58. doi:10.1186/s12711-019-0500-8
van Binsbergen, R., Bink, M. C., Calus, M. P., van Eeuwijk, F. A., Hayes, B. J., Hulsegge, I., et al. (2014). Accuracy of Imputation to Whole-Genome Sequence Data in Holstein Friesian Cattle. Genet. Selection Evol. 46 (1), 41. doi:10.1186/1297-9686-46-41
VanRaden, P. M., Sun, C., and O’Connell, J. R. (2015). Fast Imputation Using Medium or Low-Coverage Sequence Data. BMC Genet. 16 (1), 82. doi:10.1186/s12863-015-0243-7
Wang, Y., Wylie, T., Stothard, P., and Lin, G. (2015). Whole Genome SNP Genotype Piecemeal Imputation. BMC bioinformatics 16, 340. doi:10.1186/s12859-015-0770-2
Keywords: genotype imputation, SNP density, reference population size, imputation accuracy, SNP chip, sequencing
Citation: Deng T, Zhang P, Garrick D, Gao H, Wang L and Zhao F (2022) Comparison of Genotype Imputation for SNP Array and Low-Coverage Whole-Genome Sequencing Data. Front. Genet. 12:704118. doi: 10.3389/fgene.2021.704118
Received: 01 May 2021; Accepted: 03 December 2021;
Published: 03 January 2022.
Edited by:
Lingzhao Fang, University of Edinburgh, United KingdomReviewed by:
Oscar Gonzalez-Recio, Instituto Nacional de Investigación y Tecnología Agroalimentaria (INIA), SpainCopyright © 2022 Deng, Zhang, Garrick, Gao, Wang and Zhao. This is an open-access article distributed under the terms of the Creative Commons Attribution License (CC BY). The use, distribution or reproduction in other forums is permitted, provided the original author(s) and the copyright owner(s) are credited and that the original publication in this journal is cited, in accordance with accepted academic practice. No use, distribution or reproduction is permitted which does not comply with these terms.
*Correspondence: Lixian Wang, aWFzd2x4QDI2My5uZXQ=; Fuping Zhao, emhhb2Z1cGluZ0BjYWFzLmNu
†These authors have contributed equally to this work and share first authorship
Disclaimer: All claims expressed in this article are solely those of the authors and do not necessarily represent those of their affiliated organizations, or those of the publisher, the editors and the reviewers. Any product that may be evaluated in this article or claim that may be made by its manufacturer is not guaranteed or endorsed by the publisher.
Research integrity at Frontiers
Learn more about the work of our research integrity team to safeguard the quality of each article we publish.