 Xin Qi
 Rui Wang
 Yuxin Lin
 Donghui Yan1
 Jiajia Chen
 Bairong Shen
94% of researchers rate our articles as excellent or good
Learn more about the work of our research integrity team to safeguard the quality of each article we publish.
Find out more
ORIGINAL RESEARCH article
Front. Genet., 01 July 2021
Sec. Cancer Genetics and Oncogenomics
Volume 12 - 2021 | https://doi.org/10.3389/fgene.2021.692426
This article is part of the Research TopicPrecision Medicine in Cancer Treatment Using Multi-omics DataView all 7 articles
Background: Colon cancer (CC) is a common gastrointestinal malignant tumor with high heterogeneity in clinical behavior and response to treatment, making individualized survival prediction challenging. Ferroptosis is a newly discovered iron-dependent cell death that plays a critical role in cancer biology. Therefore, identifying a prognostic biomarker with ferroptosis-related genes provides a new strategy to guide precise clinical decision-making in CC patients.
Methods: Alteration in the expression profile of ferroptosis-related genes was initially screened in GSE39582 dataset involving 585 CC patients. Univariate Cox regression analysis and LASSO-penalized Cox regression analysis were combined to further identify a novel ferroptosis-related gene signature for overall survival prediction. The prognostic performance of the signature was validated in the GSE17536 dataset by Kaplan-Meier survival curve and time-dependent ROC curve analyses. Functional annotation of the signature was explored by integrating GO and KEGG enrichment analysis, GSEA analysis and ssGSEA analysis. Furthermore, an outcome risk nomogram was constructed considering both the gene signature and the clinicopathological features.
Results: The prognostic signature biomarker composed of 9 ferroptosis-related genes accurately discriminated high-risk and low-risk patients with CC in both the training and validation datasets. The signature was tightly linked to clinicopathological features and possessed powerful predictive ability for distinct clinical subgroups. Furthermore, the risk score was confirmed to be an independent prognostic factor for CC patients by multivariate Cox regression analysis (p < 0.05). Functional annotation analyses showed that the prognostic signature was closely correlated with pivotal cancer hallmarks, particularly cell cycle, transcriptional regulation, and immune-related functions. Moreover, a nomogram with the signature was also built to quantify outcome risk for each patient.
Conclusion: The novel ferroptosis-related gene signature biomarker can be utilized for predicting individualized prognosis, optimizing survival risk assessment and facilitating personalized management of CC patients.
Colon cancer (CC) is one of the most common gastrointestinal malignancies and the leading cause of cancer-related death worldwide (5.8%), accounting for over 1.09 million new cases and about 551,269 deaths in 2018 (Bray et al., 2018). Because of insidious onset and invasive rapid-progression, the majority of CC patients were diagnosed at advanced stages, thereby missing the optimal therapeutic regimens and opportunity. Moreover, the five-year and overall survival rate of CC patients remain unsatisfactory due to distant metastasis, recurrence and/or drug resistance following treatment (Goldstein et al., 2016; Van der Jeught et al., 2018; Leon et al., 2019). Currently, in clinical practice, treatment decision making for individual CC patients are mainly based on cancer- and patient-specific factors, such as gender, age and tumor-node-metastasis (TNM) staging. Nevertheless, due to high clinical heterogeneity of CC, those conventional clinical indicators are insufficient for accurate prediction of individualized prognosis. Therefore, establishing novel and robust predictive signatures that can reliably estimate clinical outcomes would have tremendous value in monitoring personalized prognosis and guiding clinical management of CC patients (Chen et al., 2013; Zhang et al., 2019; Liu et al., 2020b; Qi et al., 2020a).
Ferroptosis is a newly discovered iron-dependent form of regulated cell death (RCD) characterized by lipid peroxidation and accumulation of reactive oxygen species (ROS) (Angeli et al., 2019). Like other forms of RCD such as apoptosis and necroptosis, ferroptosis is strictly regulated under normal physiological conditions, and its dysregulation has been reported to be associated with a variety of pathological diseases (Stockwell et al., 2017). Notably, growing evidence has demonstrated that ferroptosis plays a pivotal role in cancer biology, making it an effective, prospective pathway for cancer therapy (Xu et al., 2019). For example, Xu et al. (2020) unveiled that colorectal cancer (CRC) stem cells are sensitive to ferroptosis, and inducing ferroptosis could attenuate the progression of those stem cells by modulating SLC7A11. Park et al. (2018) found that the activation of ferroptosis by bromelain effectively inhibit Kras-mutant CRC cells by up-regulating ACSL-4 expression. Similarly, Xia et al. (2020) discovered that talaroconvolutin A is a novel ferroptosis inducer with higher anticancer activity than erastin. It can suppress the growth of CRC cells via triggering ferroptosis. In addition, many ferroptosis regulators or markers such as GPX4 (Seibt et al., 2019), P53 (Jiang et al., 2015), RSL3 (Sui et al., 2018), Frataxin (Du et al., 2020), and DPP4 (Tang and Kroemer, 2020) are tightly linked to the initiation and progression of multiple cancer types, highlighting their novel potentials as cancer biomarkers. Given the important role of ferroptosis-related genes (FRGs) in cancer progression, ferroptosis-derived gene signatures for survival prediction have been successfully constructed in multiple cancer types, such as glioma (Liu et al., 2020a), hepatocellular carcinoma (Du and Zhang, 2020; Liang et al., 2020) and clear cell renal cell carcinoma (Wu et al., 2020). However, no ferroptosis-based prognostic model is available for CC that can be employed to predict patient clinical outcomes.
In the present study, we focused on decoding the prognostic implications of ferroptosis in CC by analyzing the transcriptome and clinical information retrieved from large-scale publicly available datasets. The pipeline of the present study was illustrated in Figure 1. Firstly, FRG with prognostic value in CC was identified via differential expression analysis and univariate Cox regression analysis. Next, a novel FRG-based signature for risk stratification and survival prediction was established by utilizing Lasso-penalized Cox regression analysis, and the association between the risk signature and clinicopathological characteristics was also investigated. Importantly, the prognostic performance of the FRG-based individualized signature was validated in another independent dataset by employing a series of bioinformatics approaches. Furthermore, a nomogram was built based on independent prognostic factors to quantify overall survival probability for patients with CC.
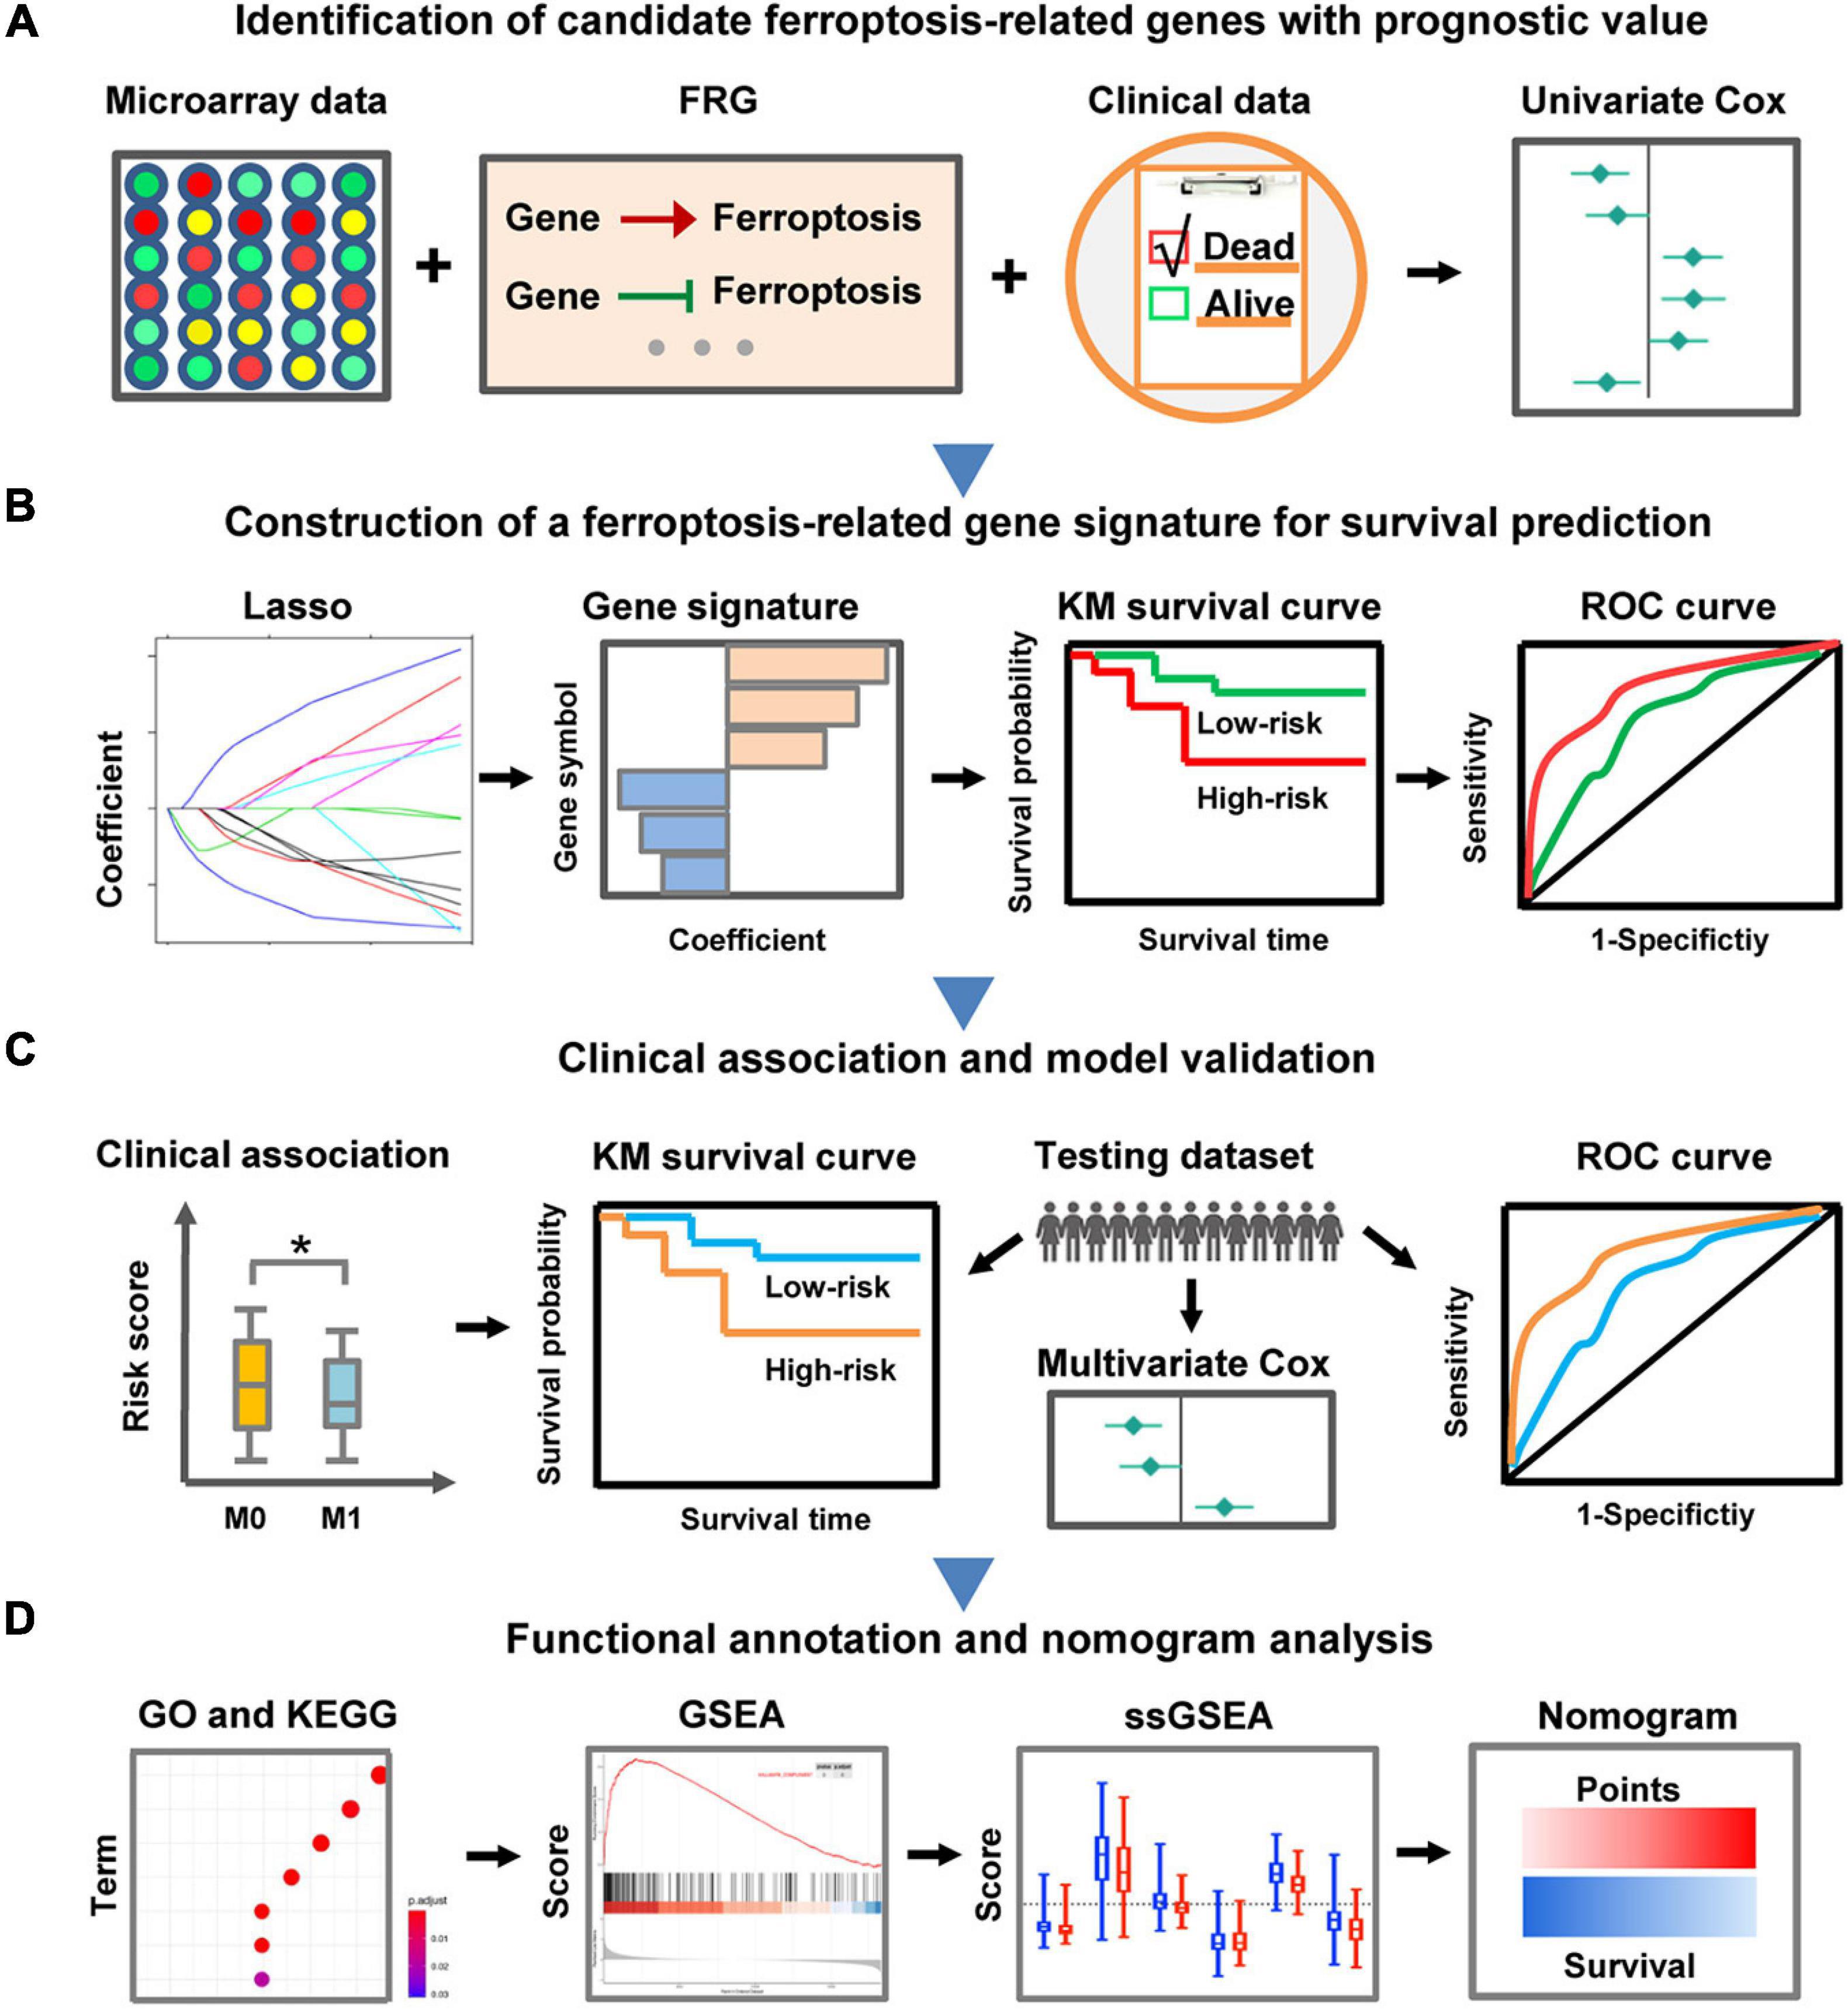
Figure 1. Schematic diagram of the FRG-related prognostic signature construction and characterization. (A) The FRGs with prognostic value were identified in CC through differential expression analysis and univariate Cox regression analysis. (B) LASSO Cox regression analysis was employed to develop a robust FRG signature for prognosis. (C) Clinical relevance exploration and independent validation of the FRG signature. The symbol ∗ means statistically significant. (D) Functional annotation of the FRG signature and construction of a nomogram predicting overall survival.
Ferroptosis-related genes (FRGs) that drive, suppress or mark ferroptosis were retrieved from the public FerrDb database1 (Zhou and Bao, 2020). After removing the duplicates, 260 FRGs were finally obtained for the following analyses (Supplementary Table 1).
To develop a prognostic prediction model for patients with CC, the training and validation datasets containing expression profiles and clinical information were retrieved from the publicly available Gene Expression Omnibus2 (GEO) with the accession number GSE39582 (Marisa et al., 2013) and GSE17536 (Smith et al., 2010), respectively. Among them, the training dataset involves 585 patients, and the testing dataset contains 177 patients. The clinicopathological data for the samples collected in the current study were shown in Table 1. The “limma” R package for microarray data was then employed to identify differentially expressed genes (DEGs) between tumor and normal samples in the training cohort (Ritchie et al., 2015). The mRNAs that meet the defined criteria: fold change > 1.5 or < −0.67 and adjusted p < 0.05, were considered as up-regulated or down-regulated DEGs.

Table 1. Clinical features of the CC patients involved in this study.
To construct the FRG-based prognostic prediction model, univariate Cox analysis was firstly carried out using the coxph function of the “survival” R package to screen differentially expressed FRGs (DE-FRGs) that significantly associated with overall survival (OS) of CC patients (Therneau, 2020). To obtain robust prognostic genes, samples with incomplete clinical data and OS less than or equal 1 month in GSE39582 dataset were removed. The expression level of genes was normalized by the “scale” function in R. Normalized expression data frame of DE-FRGs and prognostic data including OS time and OS status were used as the input files in the univariate Cox regression analysis. The DE-FRGs with p-values less than 0.05 were retained as candidate genes with prognostic value. Thereafter, to further minimize over-fitting effect, the LASSO-penalized Cox regression analysis was performed to construct the FRG-based prognostic model using the “glmnet” R package (Friedman et al., 2010). The minimum λ was determined through 10-fold cross-validation. According to the normalized expression value and coefficient of each FRG that composed the prognostic signature, the risk score of each included patient was calculated by the following formula:
Where n represents the number of genes that make up the model, Coef equals the coefficient of each prognostic FRG, x is the normalized expression level of each prognostic FRG. Then, the regression coefficients from the training dataset were applied into the validation dataset to compute risk scores. Further, multivariate Cox regression analysis for the risk score and clinical factors was conducted to measure whether the FRG-based signature was an independent prognostic indicator for OS.
To evaluate the prognostic performance of the established FRG signature, the patients in each dataset were divided into high-risk and low-risk groups. Then, Kaplan-Meier survival curve analyses were employed to determine whether there was a significant difference in OS time between high-risk and low-risk groups using the “survival” and “survminer” R packages (Alboukadel et al., 2018; Therneau, 2020). And the log-rank test (p < 0.05) was used to measure the difference. Furthermore, time-dependent ROC curve analysis was performed with “timeROC” and “survival” R packages to assess the predictive power of the prognostic signature (Blanche, 2015; Therneau, 2020).
To decode the function of the FRG-based signature in CC, DEGs between the high-risk and low risk groups were identified with the criteria (fold change > 1.5 or < −0.67 and adjust p < 0.05). Then, Gene Ontology (GO) and Kyoto Encyclopedia of Genes and Genomes (KEGG) pathway enrichment analyses of the signature-related DEGs were performed utilizing the “clusterProfiler” R package (v3.14.3) (Yu, 2018). P-values adjusted by Benjamini-Hochberg method (adj. p-value < 0.05) were employed to select statistically significant GO or KEGG terms. Furthermore, gene set enrichment analysis (GSEA)3 was carried out to interpret the enriched pathways of the identified DEGs between the high-risk and low risk groups. MSigDB gene set “h.all.v7.2.entrez.gmt” that represents well-defined biological states or processes was derived from the Molecular Signatures Database4. The “enrichplot” R package was utilized to exhibit the enriched GSEA pathways. Moreover, single-sample gene set enrichment analysis (ssGSEA) was performed with “GSVA” R package to determine the variation in immune-related biological processes between high-risk and low-risk groups (Hänzelmann et al., 2013). The well-defined gene set was downloaded from the reported reference (Liang et al., 2020).
According to the findings from the multivariate Cox regression analysis, the “rms” R package was utilized to build the nomogram based on independent prognostic factors including risk score, age and stage (Zhang and Kattan, 2017). The predictive power of the nomogram was evaluated by using the calibration curves and the concordance index (C-index) value.
All statistical analyses were conducted using the R software (Version 3.6.2) or GraphPad Prism (Version 9.0.0). If not specified, a two-sided p-value or adjusted p-value less than 0.05 was considered statistically significant.
To investigate FRGs with prognostic roles in CC, 260 FRGs were firstly collected from FerrDb, a database for ferroptosis regulators and markers. Through differential expression analysis, 68 FRGs (38 up-regulated and 30 down-regulated) were then identified as significantly dysregulated genes in CC specimens compared with control tissues in GSE39582 dataset (Supplementary Figure 1). Subsequently, univariate Cox regression analysis of those differentially expressed FRGs showed that the expression level of 13 FRGs, namely ABCC1, ATF3, AURKA, BID, DUSP1, HELLS, NFS1, RRM2, SLC1A4, SLC2A3, TXNIP, VLDLR, and ZFP69B, were significantly related to CC overall survival (Figure 2 and Supplementary Table 2). Besides, CC patients were classified into 6 molecular subtypes in the GSE39582 cohort. Considering the impact of molecular subtypes on the prognosis of CC patients, the subtype-based differential expression analysis was also carried out. As shown in Supplementary Table 3, most of the identified 13 DE-FRGs with prognostic value was significantly differentially expressed in the six comparison groups, respectively, highlighting their important roles in CC.
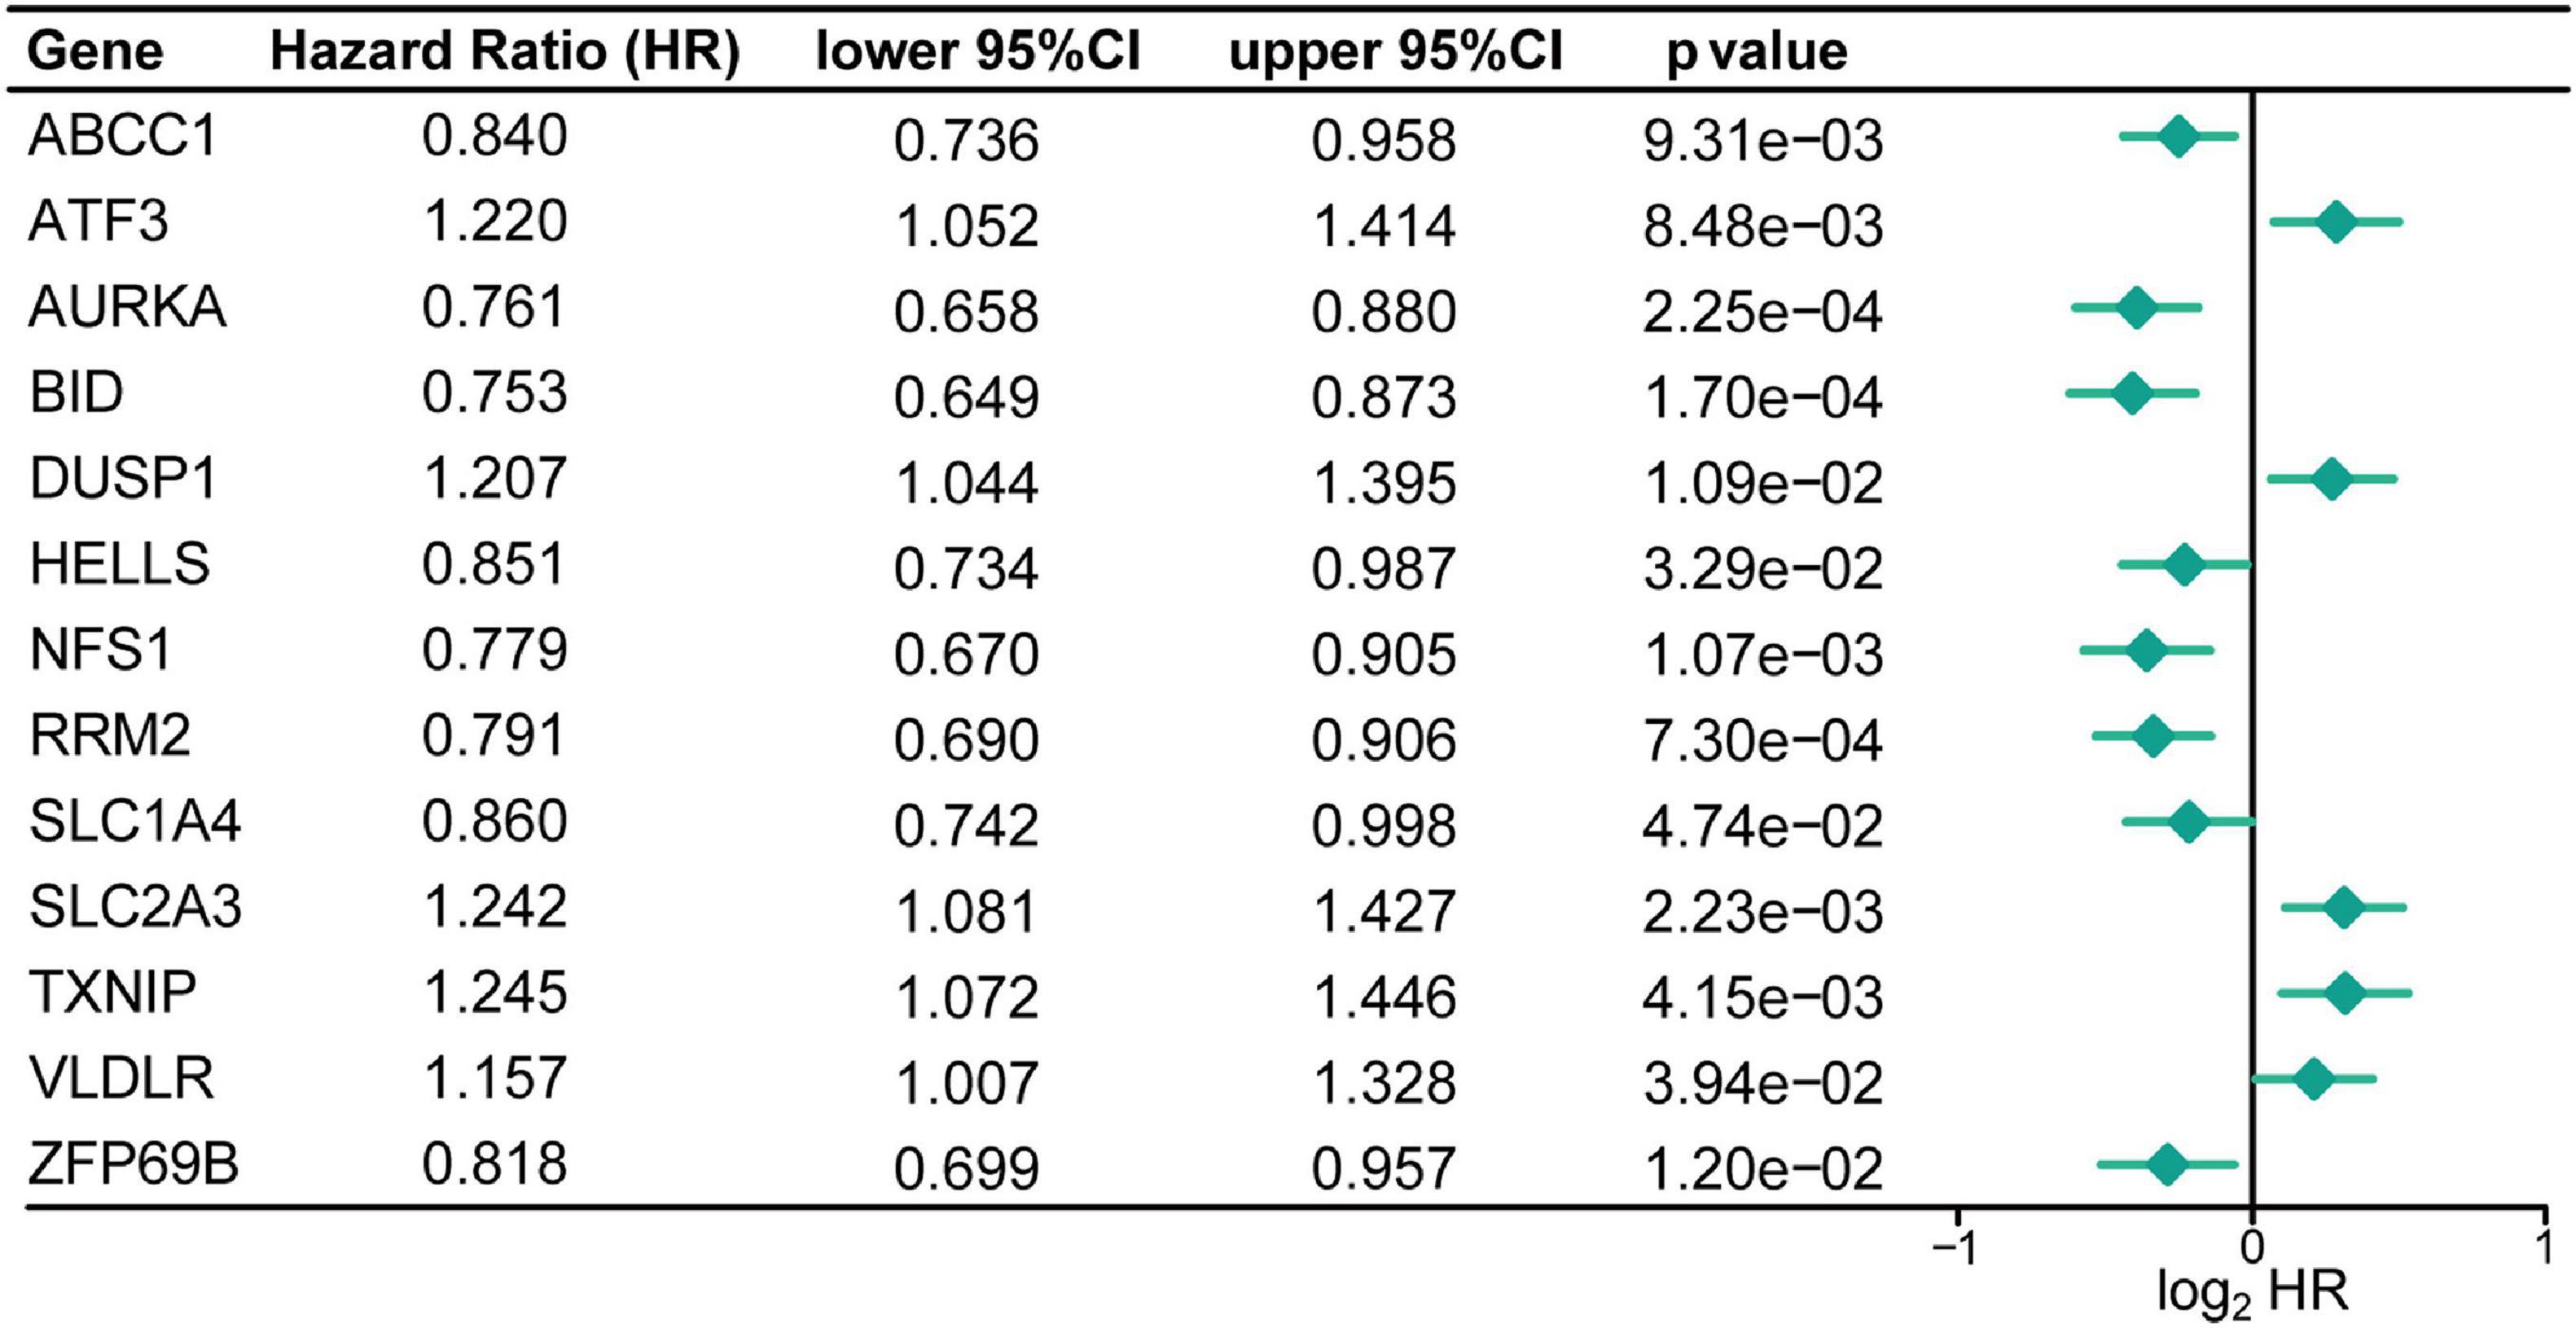
Figure 2. Identification of the FRGs with prognostic value in patients with CC. Forest plots shows the differentially expressed FRGs identified by univariate Cox regression analysis that can predict overall survival in patients with CC.
To construct a FRG-based prognostic signature for predicting overall survival in CC patients, we performed LASSO Cox regression analysis to screen out the most robust prognostic genes from 13 candidate FRGs. According to the optimal value of λ, a 9-FRG signature was finally established (Figures 3A–C). For each patient in the GSE39582 dataset, a risk score was calculated based on the regression coefficient and expression level of each FRG. Accordingly, the CC patients were stratified into high-risk and low-risk groups according to the median value of risk scores (Figure 3D). For each CC patient, the higher risk score indicated a poor overall survival. Therefore, the FRGs with a higher expression level and larger positive coefficient tend to have an increased risk feature of death, and vice versa.
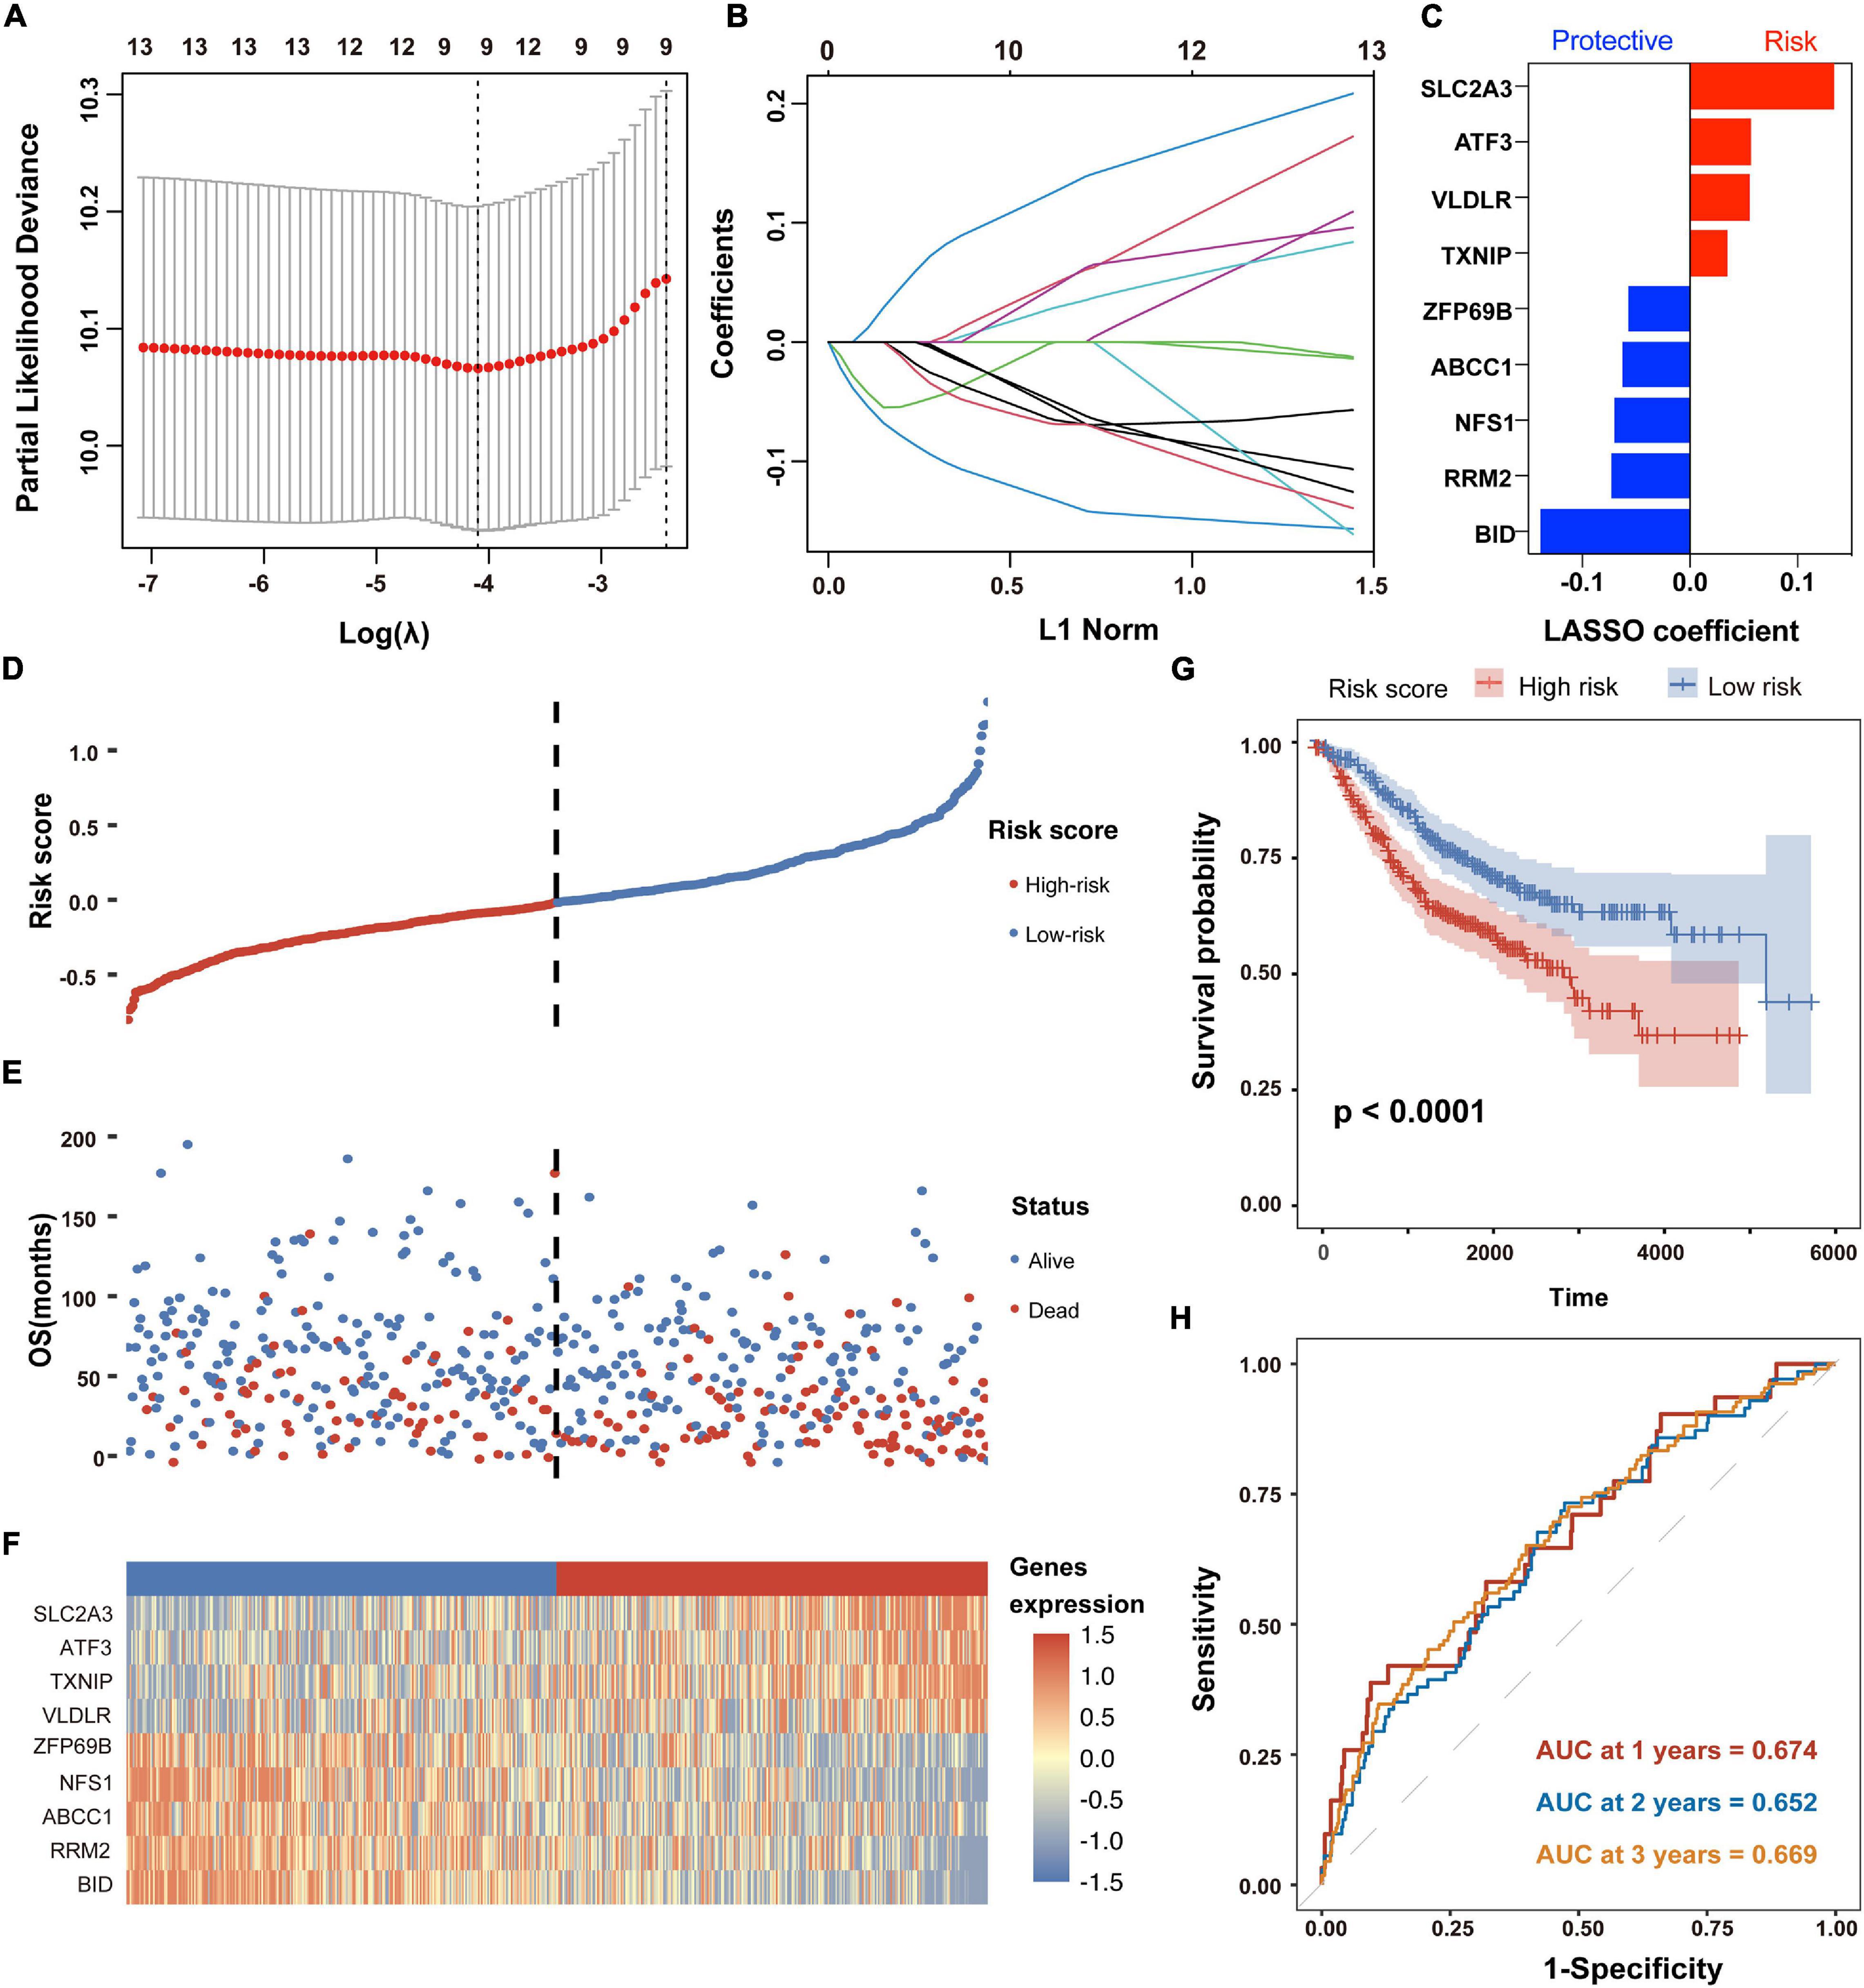
Figure 3. Establishment and prognostic analysis of the FRG signature in CC. (A,B) The LASSO Cox regression analysis was employed to identify the most robust prognostic FRGs, with the optimal λ value of 0.0166. (C) Distribution of LASSO Cox coefficients of nine FRGs that constitute the prognostic signature. (D) Distribution of risk scores based on the FRG prognostic signature in the GSE39582 dataset. (E) Survival status of CC patients with high or low risk scores in the GSE39582 dataset. (F) Heatmap shows the expression pattern of nine FRGs that constitute the prognostic signature in the GSE39582 dataset. (G) Kaplan-Meier plot for overall survival of CC patients in high- and low-risk groups in the GSE39582 dataset. (H) Time-dependent ROC curves for the prognostic performance of the FRG signature in the GSE39582 dataset.
As shown in the survival status distributions of Figure 3E, high-risk patients were more likely to have shorter survival time compared with those low-risk patients. Expression profile of the 9 FRGs that constitute the prognostic signature was obviously altered between high- and low-risk patients with CC (Figure 3F). Consistently, the Kaplan-Meier survival analysis demonstrated that patients with high risk scores exhibited significantly worse OS in the GSE39582 dataset (p < 0.05, Figure 3G). According to the results of time-dependent ROC curve analyses, the area under the curve (AUC) value reached 0.674 at 1 year, 0.652 at 2 years and 0.669 at 3 years, respectively (Figure 3H). Besides, time-dependent ROC analysis was also performed in subgroups of TNM stages. As shown in Supplementary Figure 2, the signature exhibited better performance in stage I (AUC value > 0.890) and stage III (AUC value > 0.679) than that in all patients. These results suggested that the FRG-derived prognostic signature is closely associated with OS of CC patients.
To explore the association between the established signature and clinicopathological characteristics, we compared the risk scores in different subgroups stratified by age, sex, tumor location, TNM stage, T stage, N stage, and M stage, respectively. As shown in Figure 4A, the risk score of patients with advanced CC was significantly higher than that of patients with primary CC. For tumor location, the risk scores obviously decreased in patients with distal tumor location compared with those with primary tumor location. However, the risk score was not significantly associated with age and gender. These results revealed that the established FRG-based prognostic signature was closely related to clinicopathological features including tumor location, TNM stage, T stage, N stage, and M stage.
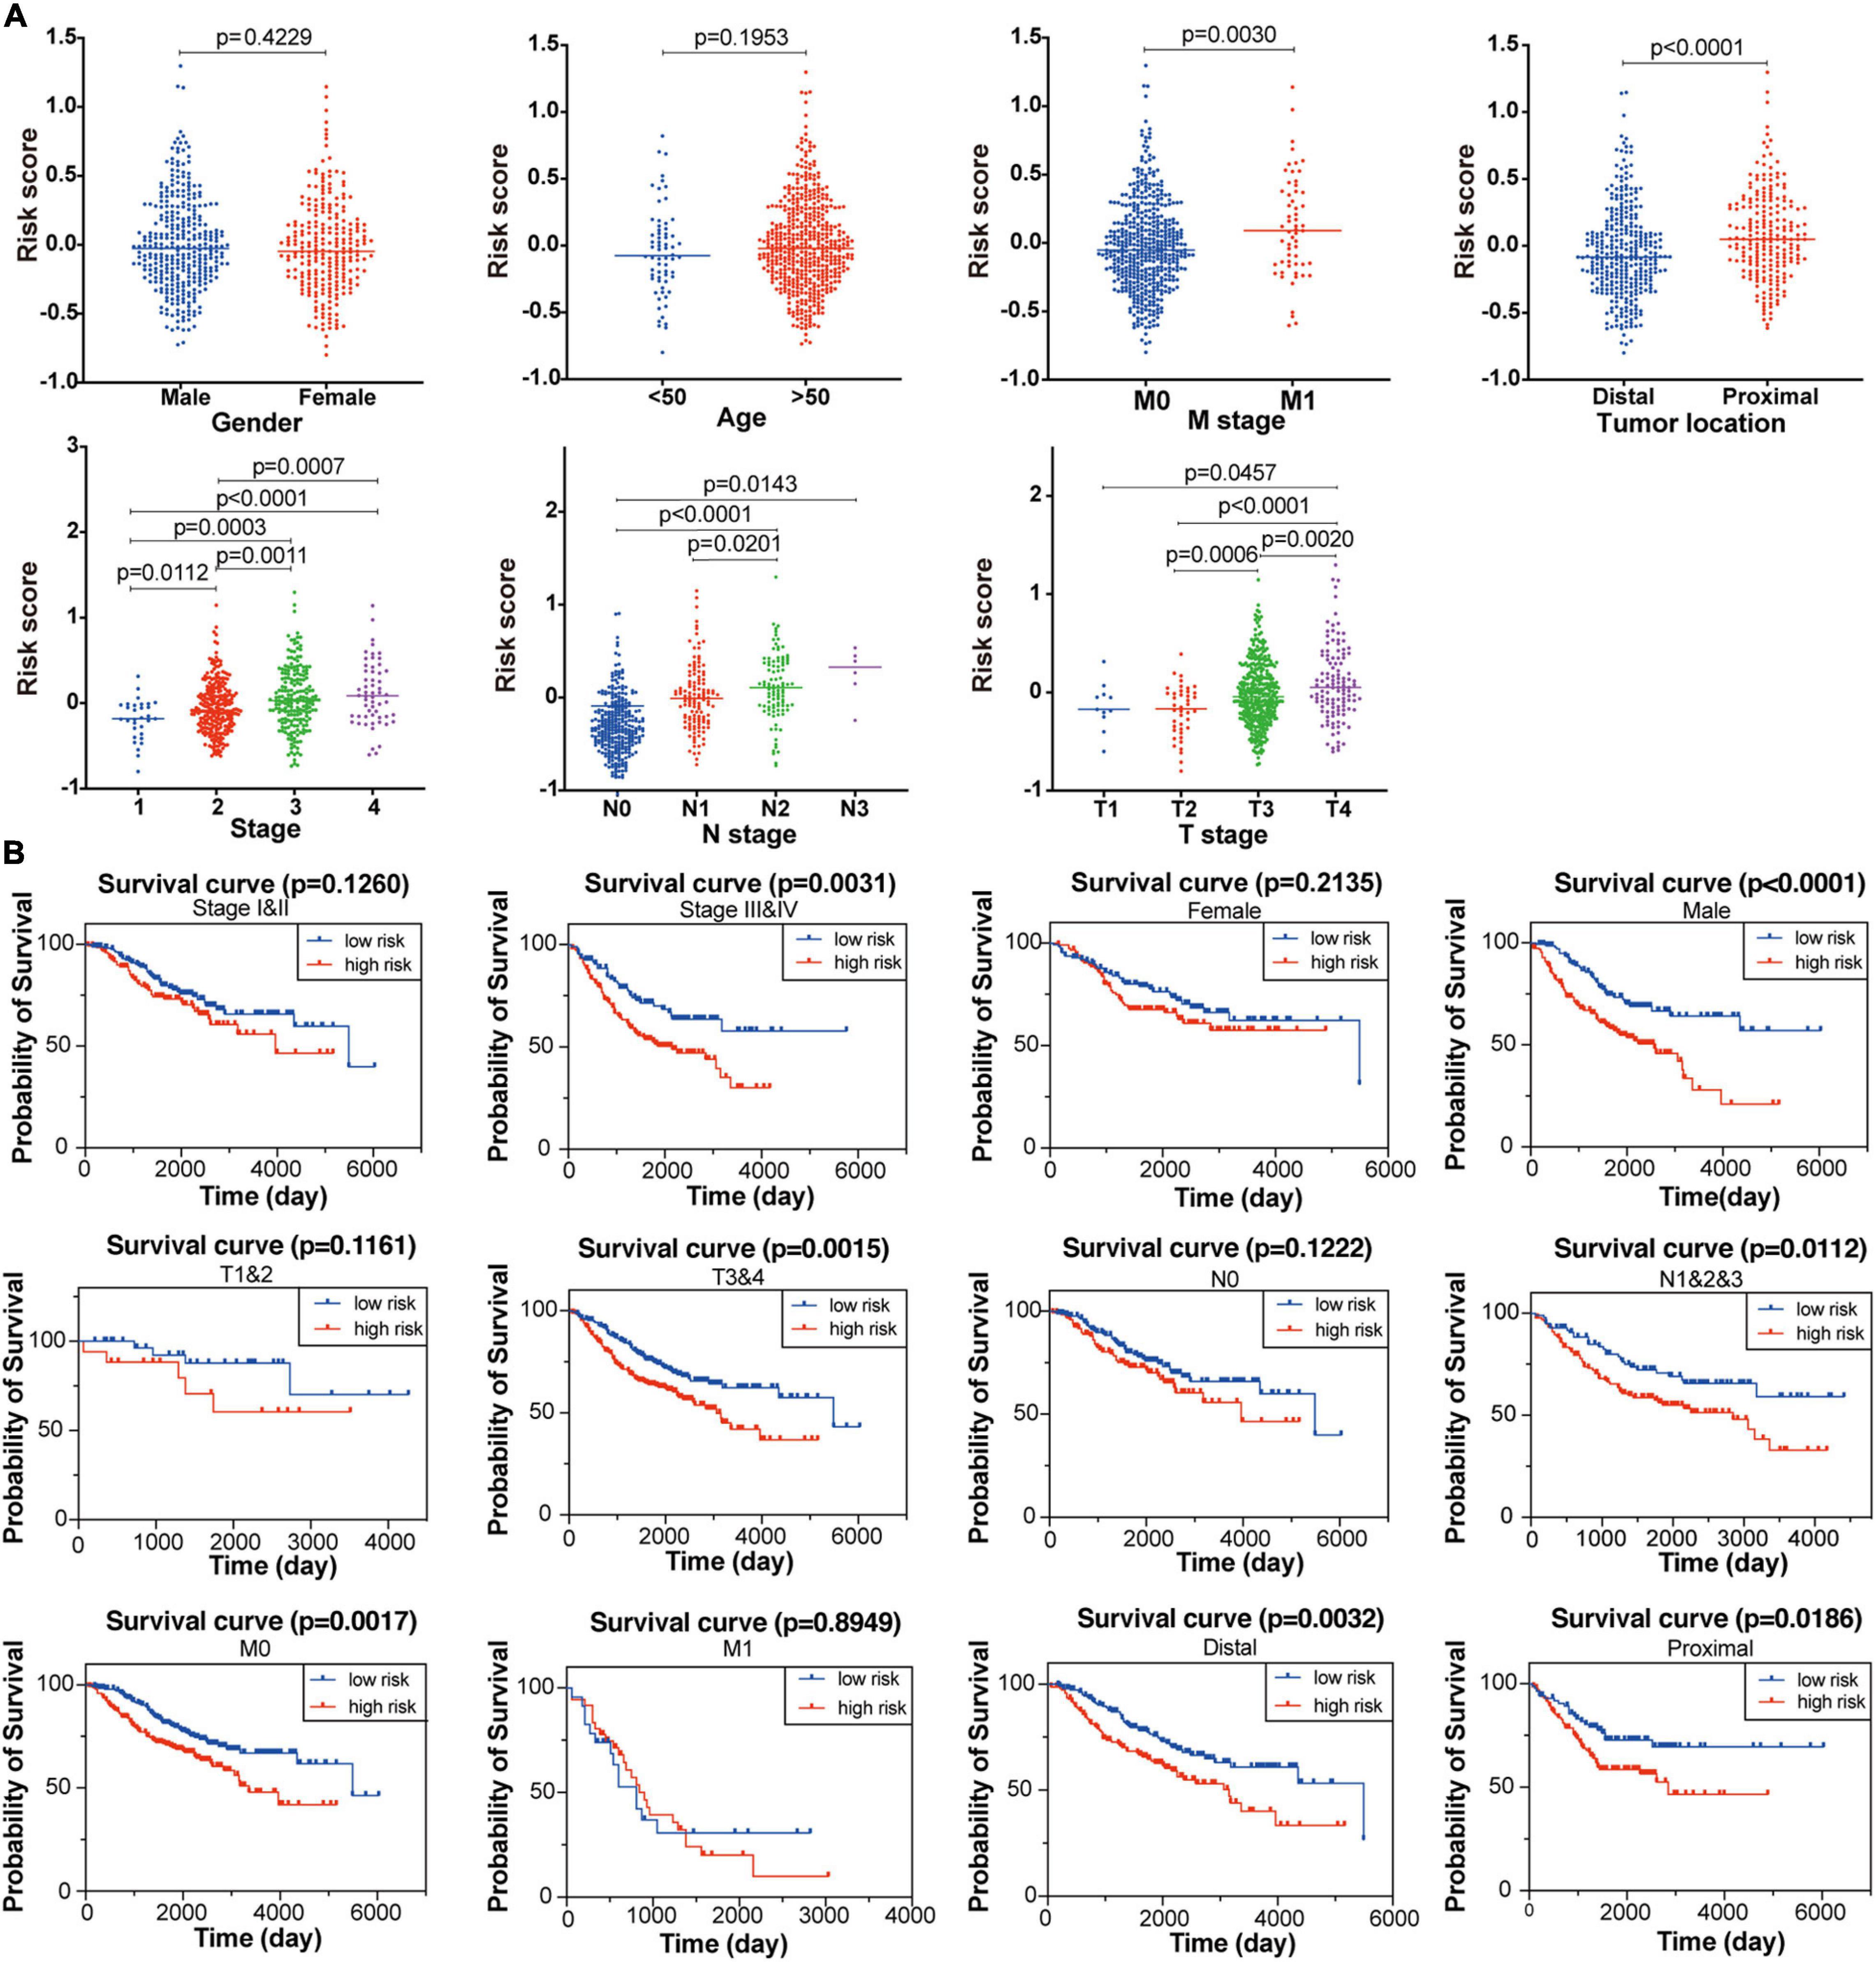
Figure 4. Association between the established FRG signature and clinicopathological characteristics. (A) Correlation analyses of risk scores calculated based on the FRG signature with multiple clinicopathological features of CC patients in the GSE39582 dataset, including gender, age, stage, tumor location, T stage, N stage and M stage. Statistical significance was calculated using the Student’s t-test (p < 0.05). (B) Subgroup Kaplan-Meier curve analysis shows overall survival probability of high- and low-risk CC patients from the GSE39582 dataset stratified by stage (stage I/II vs. stage III/IV), gender (female vs. male), T stage (T1/2 vs. T3/4), N stage (N0 vs. N1/2/3), M stage (M0 vs. M1), and tumor location (distal vs. proximal). Statistical significance was calculated using the log-rank test (p < 0.05).
Furthermore, to better evaluate the prognostic performance of the constructed signature, we conducted a stratified survival analysis based on clinical risk factors to examine whether it retains the robust ability to predict overall survival of distinct subgroups. Within each subgroup of TNM stage (stage I/II and stage III/IV), tumor location (primary and distal), T stage (T1/2 and T3/4), N stage (N0 and N1/2/3), M stage (M0 and M1), the CC patients were divided into high-risk and low-risk groups according to the median risk score calculated through the constructed formula. As shown in Figure 4B, patients with high-risk score had significantly poor survival probability than those with low-risk score in most of the above subgroups, indicating the signature’s powerful predictive capacity.
To test the robustness of the established prognostic model, CC patients from the GSE17536 cohort were divided into high-risk and low-risk groups by the median risk score value calculated with the formula constructed from the GSE39582 dataset (Figure 5A). Consistently, patients in the high-risk group tended to death earlier (Figure 5B) and had shorter overall survival time than their low-risk counterparts (Figures 5D,E). As shown in the heatmap, the expression abundance of 9 genes in the model was significantly different between high- and low-risk patients (Figure 5C). These results indicated that the FRG-based prognostic signature had a robust and stable power in predicting OS of CC patients. In addition, SLC2A3 and NFS1 were used as representative FRGs to verify their expression pattern between CRC and normal control tissues. As shown in Supplementary Figure 3, the expression level of SLC2A3 and NFS1 were significantly higher in CRC tissues compared with that in normal colon tissues.
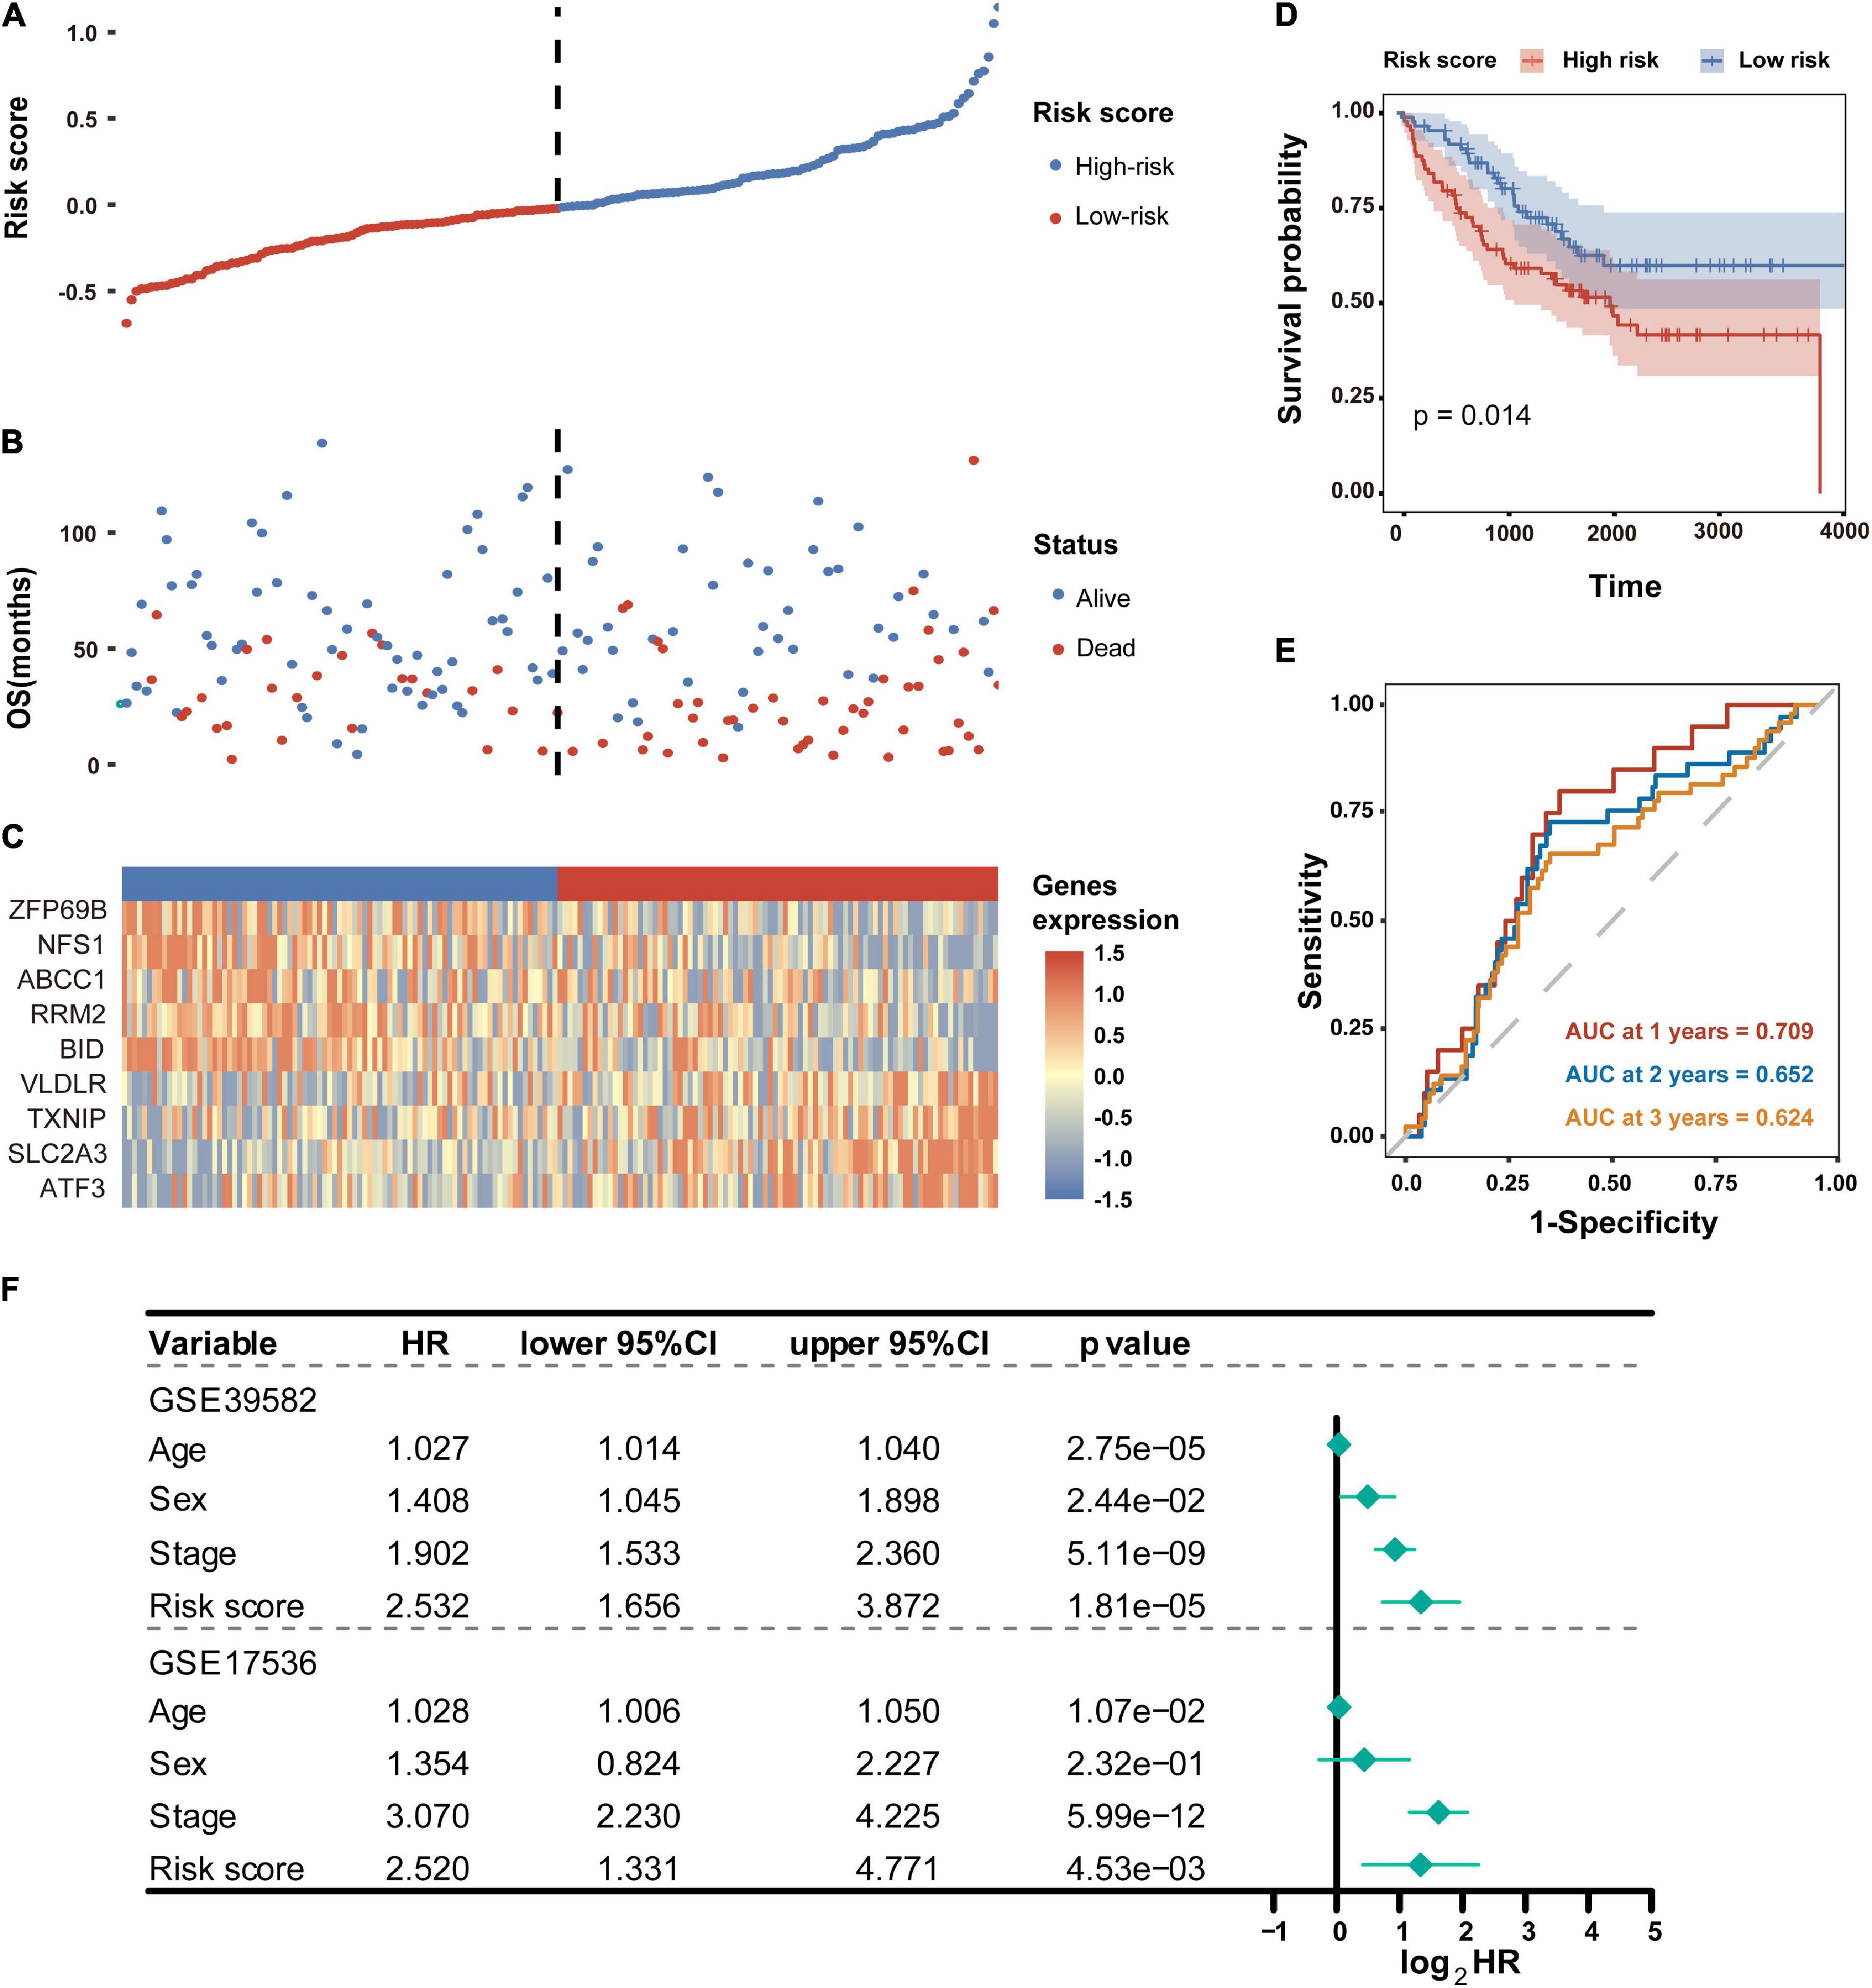
Figure 5. Validation of the FRG prognostic signature in the GSE17536 dataset. (A) Distribution of risk scores based on the FRG prognostic signature in the GSE17536 dataset. (B) Survival status of CC patients with high or low risk scores in the GSE17536 dataset. (C) Heatmap shows the expression pattern of nine FRGs that constitute the prognostic signature in the GSE17536 dataset. (D) Kaplan-Meier plot for overall survival of CC patients in high- and low-risk groups in the GSE17536 dataset. (E) Time-dependent ROC curves for the prognostic performance of the FRG signature in the GSE17536 dataset. (F) Multivariate Cox regression analyses evaluated the prognostic independence of the FRG signature regarding overall survival in GSE39582 and GSE17536 datasets. HR, hazard ratio.
To further determine whether the FRG-based prognostic signature can act as an independent overall survival predictor, multivariate Cox regression analyses were carried out using available clinical factors and risk score as variables. As shown in Figure 5F, the risk score was dramatically correlated with OS of patients in both the GSE39582 and GSE17536 cohorts, revealing that the risk score proved to be an independent prognostic factor for CC patients.
To gain insights into the biological features implicated with the FRG-based prognostic signature, functional enrichment analyses including GO and KEGG, were conducted based on the DEGs identified between high- and low-risk groups in the training dataset. As shown in Figure 6A, the DEGs were significantly enriched in GO terms, such as extracellular matrix (ECM) structural constituent, chemokine activity, receptor ligand activity, and binding of proteoglycan, integrin, heparin, sulfur compound, and collagen. Consistently, chemokine signaling has been demonstrated to be associated with ferroptosis in hepatocellular carcinoma (Liang et al., 2020). As expected, those DEGs were strikingly involved in the well-characterized pathways associated with CC including cell cycle, NF-κB signaling pathway, ECM-receptor interaction, etc. (Figure 6B).
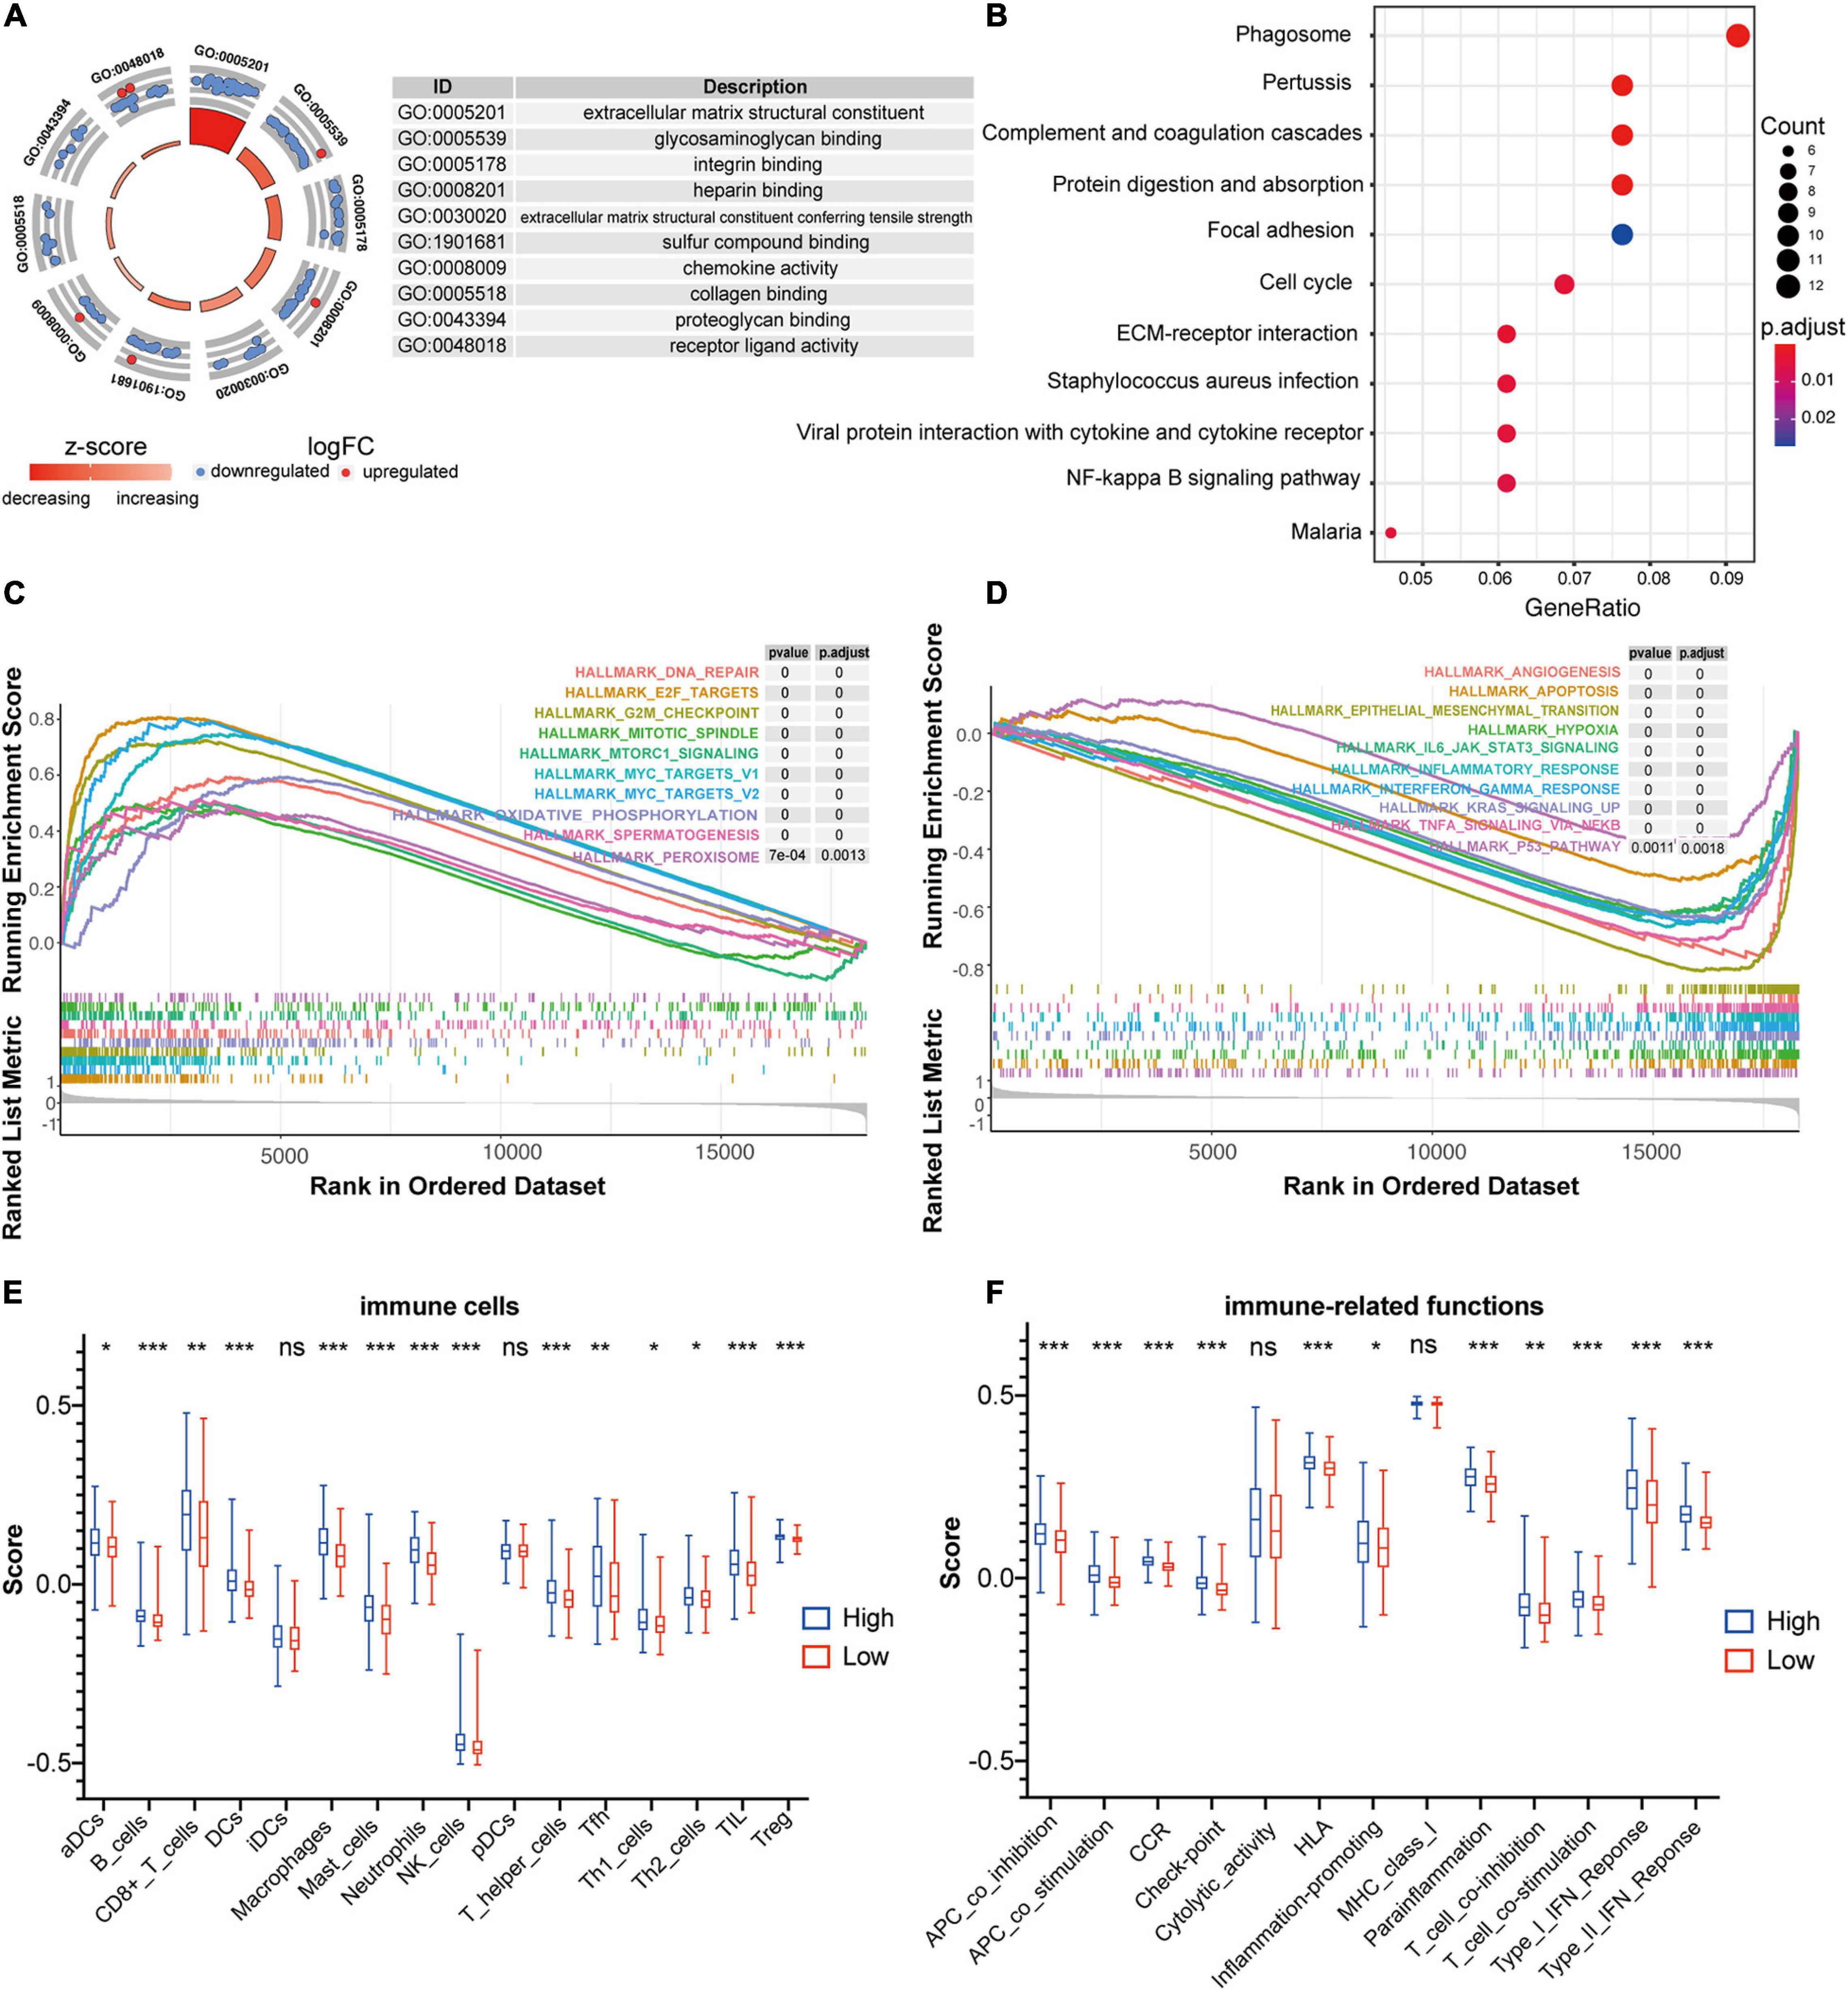
Figure 6. Functional annotation of the FRG prognostic signature. (A) Circle plot shows the top ten enriched GO terms for the DEGs identified between high- and low-risk groups in the training dataset of GSE39582. (B) Bubble diagram shows the enriched KEGG pathways for the DEGs identified between high- and low-risk groups in the training dataset of GSE39582. (C,D) GSEA analysis was used to explore cancer hallmarks that enriched in the high-risk subgroup (C) and low-risk subgroup (D) of the GSE39582 dataset. (E) Comparison of the ssGSEA scores of 16 immune cells between high- and low-risk groups in the GSE39582 dataset. Statistical significance was calculated using the Student’s t-test (p < 0.05). *p < 0.05; **p < 0.01; ***p < 0.001. (F) Comparison of the ssGSEA scores of 13 immune-related functions between high- and low-risk groups in the GSE39582 dataset. Statistical significance was calculated using the Student’s t-test (p < 0.05). *p < 0.05; **p < 0.01; ***p < 0.001.
Moreover, GSEA analyses were performed to compare the distinct pathways between high-risk and low risk groups of the FRG-based prognostic signature. As shown in Figure 6C, multiple cancer-associated hallmarks, e.g., DNA repair, G2M checkpoint and mitotic spindle that related to cell cycle, oxidative phosphorylation and peroxysome that associated with ferroptosis, and E2F targets, mTORC1 signaling and MYC targets that linked to transcriptional regulation, were highly enriched in CC patients with a high-risk score. Comparatively, the low-risk group was significantly associated with multiple cancer-related processes, such as angiogenesis, apoptosis, epithelial-mesenchymal transition, hypoxia, IL6_JAK_STAT3 signaling, inflammatory response, interferon γ response, KRAS signaling, TNFa signaling via NF-κB, and P53 pathway (Figure 6D).
In addition, given the pivotal role of immune in tumor pathogenesis, the ssGSEA enrichment analysis was employed to further explore the association between prognostic signature risk score and immune-related cell type or functions. As illustrated in Figure 6E, the score of multiple immune cell types such as aDCs, B cells, CD8+ T cells, DCs, iDCs, NK cells, TIL, Treg, and etc., were significantly higher in high-risk group than that in low-risk group. Notably, the high-risk group was dramatically enriched in critical immune events or processes compared with the low-risk counterpart, e.g., checkpoint, HLA, IFN response, inflammation-promoting, and etc. (Figure 6F). Therefore, these results provided valuable insights for individualized treatments of CC patients with different risk scores.
To develop a clinical method for quantifying the risk assessment and overall survival probability for individual CC patient, a nomogram with independent prognostic factors including the FRG signature, sex, age, and stage, was constructed based on the result of multivariate analysis in GSE39582 dataset (Figure 7A). The larger total points in the nomogram indicated a shorter overall survival probability. The C-index of the nomogram was 0.694 (95% CI, 0.655–0.733), and the calibration curves showed a good agreement between nomogram prediction and actual outcomes in the probability of 2-year, 3-year, and 5-year survival (Figures 7B–D), suggesting a powerful predictive capacity of the nomogram.

Figure 7. A nomogram for predicting the probability of patient overall survival based on FRG signature and clinical factors. (A) A nomogram with FRG signature and clinical variables was built to quantify survival probability for individual CC patient. Survival time is measured in days. The independent prognostic factors including risk score, gender, age and stage were selected from multivariate Cox regression analysis. *p < 0.05; ***p < 0.001. (B–D) Calibration curves of the nomogram for predicting the 2-year (B), 3-year (C), and 5-year (D) survival probability. Closer alignment with the 45-degree line represents a better performance.
The discovery of RCD processes has enabled striking advances in cancer intervention and therapeutics. As a novel RCD form, ferroptosis has emerged to play a crucial role in cancer development and treatment response, making it a promising biomarker and effective target in cancer therapy. Accordingly, ferroptosis gene signatures have been built for survival prediction in several types of cancer, e.g., glioma (Liu et al., 2020a), hepatocellular carcinoma (Du and Zhang, 2020; Liang et al., 2020) and clear cell renal cell carcinoma (Wu et al., 2020). However, the prognostic role of ferroptosis gene signature has yet to be explored in CC. Therefore, we herein aimed to establish a FRG-based signature for risk stratification and survival prediction in CC patients and decode its prognostic implications through comprehensive methods.
Firstly, alteration of FRG expression profile was initially determined in transcriptomic dataset involving 585 patients. To our excitement, 9 FRGs (SLC2A3, ATF3, VLDLR, TXNIP, ZFP69B, ABCC1, NFS1, RRM2, and BID) were identified as powerful prognostic indicators of overall survival in patients with CC by univariate Cox regression analysis as well as LASSO-penalized Cox regression analysis (Figure 3C). As reported, overfitting is a common characteristic of survival analysis modeling using microarray data (Xiong et al., 2020). Compared with Cox regression, Lasso-Cox regression can identify genes with high prognostic performance by minimizing the risk of overfitting, so it is widely used to construct survival prediction models for a variety of cancers (Liang et al., 2020; Wu et al., 2020). Therefore, the present study adopted the Lasso-Cox regression analysis to screen FRGs with prognostic value.
Notably, most of these FRGs have been identified as prognostic biomarkers and implicated in ferroptosis process of multiple types of tumors. For example, SLC2A3 could act as a biomarker to determine prognosis and immune infiltration in gastric cancer by mediating glycolysis reprogramming (Yao et al., 2020). The stress response gene ATF3, has been shown to activate erastin-induced ferroptosis by repressing amino acid antiporter system Xc– (Wang et al., 2020) and could serve as a prognostic biomarker in hepatocellular carcinoma (Li et al., 2021). TXNIP has been implicated in ferroptosis in retinal cells (Singh et al., 2020), and its downregulation indicates poor prognosis in patients with clear cell renal cell carcinoma (Gao et al., 2020). Furthermore, ABCC1, also known as multidrug resistance protein 1 (MRP1), was confirmed to affect ferroptosis process by mediating GSH efflux (Cao et al., 2019). As a regulator of iron metabolism in ferroptosis (Shi et al., 2019; Chen et al., 2020), NFS1 has been demonstrated to reduce ferroptosis sensitivity (Dixon and Stockwell, 2019). RRM2, a regulator of DNA replication and repair, could protect liver cancer cells against ferroptosis (Yang et al., 2020). BID, a member of pro-apoptotic BCL2 family, plays a pivotal role in oxidative death (Kuang et al., 2020). Mitochondrial transactivation of BID could mediate ROS-induced ferroptosis (Neitemeier et al., 2017). In particular, as prognostic indicators, ABCC1 and NFS1 have also been included in the survival prediction model of hepatocellular carcinoma, implying their robust roles in survival prediction (Liang et al., 2020).
A novel prognostic signature composed of the above nine FRGs was then built for predicting overall survival of patients with CC. As expected, patients with high risk scores calculated using the FRG signature-based formula showed significantly poorer overall survival, which has been verified in another independent dataset (Figures 3G, 5D). The signature is closely related to clinicopathological features as shown in the stratified Kaplan-Meier plots (Figure 4B). Furthermore, the risk score was confirmed to be an independent prognostic factor for CC patients by multivariate Cox regression analysis Figure 5F). Therefore, these results revealed that the novel FRG signature has great potential in guiding personalized treatment for each CC patient.
Recent discoveries have shown that CD8+ T cells can promote tumor ferroptosis during immune checkpoint therapy with PD-L1 blockade, and suppression of ferroptosis inhibited the anti-tumor effect of PD-L1 blockade, revealing that T cell-induced tumor ferroptosis is an anti-tumor immunological mechanism (Stockwell and Jiang, 2019; Wang et al., 2019). Consistently, functional annotation of the 9-FRG signature showed that DEGs identified between high- and low-risk groups were significantly enriched in immune and inflammatory processes, such as ECM-related pathway, chemokine activity, cell cycle, and NF-κB signaling pathway (Figure 6B). Furthermore, the results of GSEA and ssGSEA analyses also indicated that the FRG prognostic signature is closely correlated with pivotal cancer hallmarks, particularly cell cycle, transcriptional regulation, and immune-related functions (Figures 6E,F). Thus, these findings highlight that the ferroptosis activation is a promising pathway for cancer immune intervention.
There are some limitations in this study, which should be further addressed in the future. First, the FRG-based prognostic signature was both constructed and validated in microarray dataset. Considering the impact of the data generation platform, the prognostic validation of the signature also needs to be performed in RNA-Seq-based dataset. As shown in Supplementary Figure 4, the signature that containing the 8 FRGs except VLDLR had a good prognostic performance in the CC cohort from TCGA database (TCGA-COAD). Due to low expression level, the VLDLR gene was filtered out of the signature during the Kaplan-Meier survival curve analysis and time-dependent ROC curve analysis of TCGA-COAD cohort, so its prognostic role in CC needs further research. Moreover, a better strategy is to construct signatures in the RNA-Seq-based and microarray-based datasets separately and further examine the prognostic performance of the overlapped multi-gene signature. Second, as the FRG prognostic signature was constructed and verified with retrospective cohorts from public available databases, its prognostic robustness and clinical utility need to be further validated in larger prospective trials. Third, the method for FRG selection only focused on the reported FRGs in the FerrDb database, possibly ignoring the role of other “unidentified” FRG or “indirect regulators” of ferroptosis. The approach that using 260 genes and not the entire genome for univariate cox analysis may lead to false positives and needs to be validated using wet lab techniques. Besides, further in vitro and in vivo experimental studies are required to provide deep insight into the biological roles of this FRG signature in CC.
In addition, increasing evidence has indicated that molecular features, risk factors and clinical outcomes for CRC may vary by anatomic subsites (e.g., colon and rectum) (Buchwald et al., 2018; Demb et al., 2019; Qi et al., 2020b). Therefore, whether the FRG signature established in CC is robust and stable for prognosis stratification in CRC will be the focus of our further research.
In summary, our study established a novel prognostic FRG signature that performs well in individualized risk stratification and survival prediction for patients with CC. The signature is closely related to clinicopathological features and possesses powerful predictive ability for distinct clinical subgroups. Particularly, the FRG prognostic signature is closely linked to immune-related functions, implying the critical role of ferroptosis in immunotherapy. By integrating this signature with other independent clinicopathological factors, a nomogram was also built to quantify outcome risk for each patient. Therefore, the constructed FRG signature could be utilized for predicting individualized prognosis and facilitating personalized management of CC patients.
Publicly available datasets were analyzed in this study. This data can be found here: https://www.ncbi.nlm.nih.gov/geo/.
BS, XQ, and JC designed the research. XQ and RW collected the data and performed the computational analyses. XQ, RW, DY, and JZ drafted the manuscript. BS, XQ, YL, and JC revised the manuscript. All authors read and approved the final manuscript.
This work was supported by the National Natural Science Foundation of China (Grant Nos. 31900490, 31770903, and 32070671), the Natural Science Foundation of the Jiangsu Higher Education Institutions of China (Grant No. 19KJB180027), and the Regional Innovation Cooperation between Sichuan and Guangxi Provinces (Grant No. 2020YFQ0019).
The authors declare that the research was conducted in the absence of any commercial or financial relationships that could be construed as a potential conflict of interest.
We are grateful to the academic editor and the reviewers for their constructive comments to improve this manuscript.
The Supplementary Material for this article can be found online at: https://www.frontiersin.org/articles/10.3389/fgene.2021.692426/full#supplementary-material
Supplementary Figure 1 | Venn diagram shows the number of overlapping genes between DEGs and FRGs.
Supplementary Figure 2 | Time-dependent ROC curves for the prognostic performance of the FRG signature by subgroups of TNM stages in the GSE39582 dataset.
Supplementary Figure 3 | Protein expression level of SLC2A3 (A) and NFS1 (B) in normal colon and CC tissues based on immunohistochemistry images from the human protein atlas database. NC, normal colon; CC, colon cancer.
Supplementary Figure 4 | Validation of the FRG prognostic signature in the TCGA-COAD dataset. (A) Kaplan-Meier plot for overall survival of CC patients in high- and low-risk groups. (B) Time-dependent ROC curves for the prognostic performance of the FRG signature. It should be noted that the VLDLR gene was filtered out from the signature during Kaplan-Meier survival curve analysis and time-dependent ROC curve analysis due to its low expression level in the TCGA-COAD dataset.
Supplementary Table 1 | The FRGs retrieved from the public FerrDb database.
Supplementary Table 2 | Differential expression pattern of prognostic FRGs between tumor and normal control tissues.
Supplementary Table 3 | Subtype-based differential expression pattern of prognostic FRGs between tumor and normal control tissues.
CC, colon cancer; CRC, colorectal cancer; TNM, tumor-node-metastasis; RCD, regulated cell death; ROS, reactive oxygen species; FRG, ferroptosis-related gene; GEO, Gene Expression Omnibus; DEGs, differentially expressed genes; OS, overall survival; GO, Gene Ontology; KEGG, Kyoto Encyclopedia of Genes and Genomes; GSEA, gene set enrichment analysis; ssGSEA, single-sample gene set enrichment analysis; C-index, concordance index; AUC, area under the curve; ECM, extracellular matrix; MRP1, multidrug resistance protein 1.
Alboukadel, K., Marcin, K., Przemyslaw, B., and Scheipl, F. (2018). Survminer: Drawing Survival Curves Using ‘ggplot2’. R Package Version 0.4 3.
Angeli, J. P. F., Krysko, D. V., and Conrad, M. (2019). Ferroptosis at the crossroads of cancer-acquired drug resistance and immune evasion. Nat. Rev. Cancer 19, 405–414. doi: 10.1038/s41568-019-0149-1
Blanche, P. (2015). TimeROC: Time-Dependent ROC Curve and AUC for Censored Survival Data. R Package Version 2.
Bray, F., Ferlay, J., Soerjomataram, I., Siegel, R. L., Torre, L. A., and Jemal, A. (2018). Global cancer statistics 2018: GLOBOCAN estimates of incidence and mortality worldwide for 36 cancers in 185 countries. Ca Cancer J. Clin. 68, 394–424. doi: 10.3322/caac.21492
Buchwald, P., Hall, C., Davidson, C., Dixon, L., Dobbs, B., Robinson, B., et al. (2018). Improved survival for rectal cancer compared to colon cancer: the four cohort study. ANZ J. Surgery 88, E114–E117. doi: 10.1111/ans.13730
Cao, J. Y., Poddar, A., Magtanong, L., Lumb, J. H., Mileur, T. R., Reid, M. A., et al. (2019). A genome-wide haploid genetic screen identifies regulators of glutathione abundance and ferroptosis sensitivity. Cell Rep. 26, 1544–1556.e1548. doi: 10.1016/j.celrep.2019.01.043
Chen, J., Wang, Y., Shen, B., and Zhang, D. (2013). Molecular signature of cancer at gene level or pathway level? Case studies of colorectal cancer and prostate cancer microarray data. Comput. Math Methods Med. 2013:909525. doi: 10.1155/2013/909525
Chen, X., Yu, C., Kang, R., and Tang, D. (2020). Iron metabolism in ferroptosis. Front. Cell. Dev. Biol. 8:590226. doi: 10.3389/fcell.2020.590226
Demb, J., Earles, A., Martínez, M. E., Bustamante, R., Bryant, A. K., Murphy, J. D., et al. (2019). Risk factors for colorectal cancer significantly vary by anatomic site. BMJ Open Gastroenterol. 6:e000313. doi: 10.1136/bmjgast-2019-000313
Dixon, S. J., and Stockwell, B. R. (2019). The hallmarks of ferroptosis. Ann. Rev. Cancer Biol. 3, 35–54. doi: 10.1146/annurev-cancerbio-030518-055844
Du, J., Zhou, Y., Li, Y., Xia, J., Chen, Y., Chen, S., et al. (2020). Identification of frataxin as a regulator of ferroptosis. Redox Biol. 32:101483. doi: 10.1016/j.redox.2020.101483
Du, X., and Zhang, Y. (2020). Integrated analysis of immunity-and ferroptosis-related biomarker signatures to improve the prognosis prediction of hepatocellular carcinoma. Front. Genet. 11:1552. doi: 10.3389/fgene.2020.614888
Friedman, J., Hastie, T., and Tibshirani, R. (2010). Regularization paths for generalized linear models via coordinate descent. J. Statist. Softw. 33:1. doi: 10.18637/jss.v033.i01
Gao, Y., Qi, J. C., Li, X., Sun, J. P., Ji, H., and Li, Q. H. (2020). Decreased expression of TXNIP predicts poor prognosis in patients with clear cell renal cell carcinoma. Oncol. Lett. 19, 763–770. doi: 10.3892/ol.2019.11165
Goldstein, D. A., Zeichner, S. B., Bartnik, C. M., Neustadter, E., and Flowers, C. R. (2016). Metastatic colorectal cancer: a systematic review of the value of current therapies. Clin. Colorectal. Cancer 15, 1–6. doi: 10.1016/j.clcc.2015.10.002
Hänzelmann, S., Castelo, R., and Guinney, J. (2013). GSVA: gene set variation analysis for microarray and RNA-seq data. BMC Bioinform. 14:7. doi: 10.1186/1471-2105-14-7
Jiang, L., Kon, N., Li, T., Wang, S.-J., Su, T., Hibshoosh, H., et al. (2015). Ferroptosis as a p53-mediated activity during tumour suppression. Nature 520, 57–62. doi: 10.1038/nature14344
Kuang, F., Liu, J., Tang, D., and Kang, R. (2020). Oxidative damage and antioxidant defense in ferroptosis. Front. Cell. Dev. Biol. 8:586578. doi: 10.3389/fcell.2020.586578
Leon, J., Namuche, F., Montenegro, P. C., and Flores, C. J. (2019). Risk factors predicting colorectal cancer recurrence in a Latin American population. Am. Soc. Clin. Oncol. 37:e15180. doi: 10.1200/JCO.2019.37.15_suppl.e15180
Li, L., Song, S., Fang, X., and Cao, D. (2021). Role of ATF3 as a prognostic biomarker and correlation of ATF3 expression with macrophage infiltration in hepatocellular carcinoma. BMC Med. Genom. 14:8. doi: 10.1186/s12920-020-00852-4
Liang, J.-Y., Wang, D.-S., Lin, H.-C., Chen, X.-X., Yang, H., Zheng, Y., et al. (2020). A novel ferroptosis-related gene signature for overall survival prediction in patients with hepatocellular carcinoma. Int. J. Biol. Sci. 16:2430. doi: 10.7150/ijbs.45050
Liu, H.-J., Hu, H.-M., Li, G.-Z., Zhang, Y., Wu, F., Liu, X., et al. (2020a). Ferroptosis-related gene signature predicts glioma cell death and glioma patient progression. Front. Cell Dev. Biol. 8:538. doi: 10.3389/fcell.2020.00538
Liu, X., Zhang, X., Chen, J., Ye, B., Ren, S., Lin, Y., et al. (2020b). CRC-EBD: epigenetic biomarker database for colorectal cancer. Front. Genet. 11:907. doi: 10.3389/fgene.2020.00907
Marisa, L., de Reyniès, A., Duval, A., Selves, J., Gaub, M. P., Vescovo, L., et al. (2013). Gene expression classification of colon cancer into molecular subtypes: characterization, validation, and prognostic value. PLoS Med. 10:e1001453. doi: 10.1371/journal.pmed.1001453
Neitemeier, S., Jelinek, A., Laino, V., Hoffmann, L., Eisenbach, I., Eying, R., et al. (2017). BID links ferroptosis to mitochondrial cell death pathways. Redox Biol. 12, 558–570. doi: 10.1016/j.redox.2017.03.007
Park, S., Oh, J., Kim, M., and Jin, E.-J. (2018). Bromelain effectively suppresses Kras-mutant colorectal cancer by stimulating ferroptosis. Animal. Cells Syst. 22, 334–340. doi: 10.1080/19768354.2018.1512521
Qi, X., Lin, Y., Chen, J., and Shen, B. (2020a). The landscape of emerging ceRNA crosstalks in colorectal cancer: systems biological perspectives and translational applications. Clin. Transl. Med. 10:e153. doi: 10.1002/ctm2.153
Qi, X., Lin, Y., Liu, X., Chen, J., and Shen, B. (2020b). Biomarker discovery for the carcinogenic heterogeneity between colon and rectal cancers based on lncRNA-associated ceRNA network analysis. Front. Oncol. 10:2345. doi: 10.3389/fonc.2020.535985
Ritchie, M. E., Phipson, B., Wu, D., Hu, Y., Law, C. W., Shi, W., et al. (2015). limma powers differential expression analyses for RNA-sequencing and microarray studies. Nucleic Acids Res. 43:e47. doi: 10.1093/nar/gkv007
Seibt, T. M., Proneth, B., and Conrad, M. (2019). Role of GPX4 in ferroptosis and its pharmacological implication. Free Radical Biol. Med. 133, 144–152. doi: 10.1016/j.freeradbiomed.2018.09.014
Shi, Z. Z., Fan, Z. W., Chen, Y. X., Xie, X. F., Jiang, W., Wang, W. J., et al. (2019). Ferroptosis in carcinoma: regulatory mechanisms and new method for cancer therapy. Onco. Targets Ther. 12, 11291–11304. doi: 10.2147/OTT.S232852
Singh, L. P., Yumnamcha, T., Ibraham, A. S., and Devi, T. S. (2020). The role of TXNIP and redox imbalance in mitochondrial dysfunction and ferroptosis in retinal cells: implications for diabetic retinopathy. Investigat. Ophthalmol. Visual Sci. 61, 752–752.
Smith, J. J., Deane, N. G., Wu, F., Merchant, N. B., Zhang, B., Jiang, A., et al. (2010). Experimentally derived metastasis gene expression profile predicts recurrence and death in patients with colon cancer. Gastroenterology 138, 958–968. doi: 10.1053/j.gastro.2009.11.005
Stockwell, B. R., Angeli, J. P. F., Bayir, H., Bush, A. I., Conrad, M., Dixon, S. J., et al. (2017). Ferroptosis: a regulated cell death nexus linking metabolism, redox biology, and disease. Cell 171, 273–285. doi: 10.1016/j.cell.2017.09.021
Stockwell, B. R., and Jiang, X. (2019). A physiological function for ferroptosis in tumor suppression by the immune system. Cell Metab 30, 14–15. doi: 10.1016/j.cmet.2019.06.012
Sui, X., Zhang, R., Liu, S., Duan, T., Zhai, L., Zhang, M., et al. (2018). RSL3 drives ferroptosis through GPX4 inactivation and ROS production in colorectal cancer. Front. Pharmacol. 9:1371. doi: 10.3389/fphar.2018.01371
Tang, D., and Kroemer, G. (2020). Ferroptosis. Curr. Biol. 30, R1292–R1297. doi: 10.1016/j.cub.2020.09.068
Therneau, T. (2020). A Package for Survival Analysis in R. R Package Version 3.2-3. Computer Software. Rochester, MN: Mayo Clinic.
Van der Jeught, K., Xu, H.-C., Li, Y.-J., Lu, X.-B., and Ji, G. (2018). Drug resistance and new therapies in colorectal cancer. World J. Gastroenterol. 24:3834. doi: 10.3748/wjg.v24.i34.3834
Wang, L., Liu, Y., Du, T., Yang, H., Lei, L., Guo, M., et al. (2020). ATF3 promotes erastin-induced ferroptosis by suppressing system Xc–. Cell Death Different. 27, 662–675. doi: 10.1038/s41418-019-0380-z
Wang, W., Green, M., Choi, J. E., Gijon, M., Kennedy, P. D., Johnson, J. K., et al. (2019). CD8(+) T cells regulate tumour ferroptosis during cancer immunotherapy. Nature 569, 270–274. doi: 10.1038/s41586-019-1170-y
Wu, G., Wang, Q., Xu, Y., Li, Q., and Cheng, L. (2020). A new survival model based on ferroptosis-related genes for prognostic prediction in clear cell renal cell carcinoma. Aging 12:14933. doi: 10.18632/aging.104088
Xia, Y., Liu, S., Li, C., Ai, Z., Shen, W., Ren, W., et al. (2020). Discovery of a novel ferroptosis inducer-talaroconvolutin akilling colorectal cancer cells in vitro and in vivo. Cell Death Dis. 11, 1–18. doi: 10.1038/s41419-020-03194-2
Xiong, Y., Yuan, L., Xiong, J., Xu, H., Luo, Y., Wang, G., et al. (2020). An outcome model for human bladder cancer: A comprehensive study based on weighted gene co-expression network analysis. J. Cell. Mol. Med. 24, 2342–2355. doi: 10.1111/jcmm.14918
Xu, T., Ding, W., Ji, X. Y., Ao, X., Liu, Y., Yu, W. P., et al. (2019). Molecular mechanisms of ferroptosis and its role in cancer therapy. J. Cell. Mol. Med. 23, 4900–4912. doi: 10.1111/jcmm.14511
Xu, X., Zhang, X., Wei, C., Zheng, D., Lu, X., Yang, Y., et al. (2020). Targeting SLC7A11 specifically suppresses the progression of colorectal cancer stem cells via inducing ferroptosis. Eur. J. Pharmaceutical Sci. 152:105450. doi: 10.1016/j.ejps.2020.105450
Yang, Y., Lin, J., Guo, S., Xue, X., Wang, Y., Qiu, S., et al. (2020). RRM2 protects against ferroptosis and is a tumor biomarker for liver cancer. Cancer Cell Int. 20, 1–16. doi: 10.1186/s12935-020-01689-8
Yao, X., He, Z., Qin, C., Deng, X., Bai, L., Li, G., et al. (2020). SLC2A3 promotes macrophage infiltration by glycolysis reprogramming in gastric cancer. Cancer Cell Int. 20, 1–16. doi: 10.1186/s12935-020-01599-9
Yu, G. (2018). Cluster profiler: universal enrichment tool for functional and comparative study. BioRxiv [preprint] BioRxiv 256784, doi: 10.1101/256784
Zhang, X., Sun, X. F., Shen, B., and Zhang, H. (2019). Potential applications of DNA, RNA and protein biomarkers in diagnosis, therapy and prognosis for colorectal cancer: a study from databases to AI-assisted verification. Cancers 11:172. doi: 10.3390/cancers11020172
Zhang, Z., and Kattan, M. W. (2017). Drawing nomograms with R: applications to categorical outcome and survival data. Ann. Trans. Med. 5:211. doi: 10.21037/atm.2017.04.01
Keywords: colon cancer, ferroptosis, prognostic biomarker, gene signature, outcome risk nomogram
Citation: Qi X, Wang R, Lin Y, Yan D, Zuo J, Chen J and Shen B (2021) A Ferroptosis-Related Gene Signature Identified as a Novel Prognostic Biomarker for Colon Cancer. Front. Genet. 12:692426. doi: 10.3389/fgene.2021.692426
Received: 08 April 2021; Accepted: 09 June 2021;
Published: 01 July 2021.
Edited by:
Ming Tang, Dana–Farber Cancer Institute, United StatesReviewed by:
Yi Zhang, Dana-Farber Cancer Institute, United StatesCopyright © 2021 Qi, Wang, Lin, Yan, Zuo, Chen and Shen. This is an open-access article distributed under the terms of the Creative Commons Attribution License (CC BY). The use, distribution or reproduction in other forums is permitted, provided the original author(s) and the copyright owner(s) are credited and that the original publication in this journal is cited, in accordance with accepted academic practice. No use, distribution or reproduction is permitted which does not comply with these terms.
*Correspondence: Bairong Shen, YmFpcm9uZy5zaGVuQHNjdS5lZHUuY24=
†These authors have contributed equally to this work
Disclaimer: All claims expressed in this article are solely those of the authors and do not necessarily represent those of their affiliated organizations, or those of the publisher, the editors and the reviewers. Any product that may be evaluated in this article or claim that may be made by its manufacturer is not guaranteed or endorsed by the publisher.
Research integrity at Frontiers
Learn more about the work of our research integrity team to safeguard the quality of each article we publish.