 ZeBing Song
 ShaoQiang Li
94% of researchers rate our articles as excellent or good
Learn more about the work of our research integrity team to safeguard the quality of each article we publish.
Find out more
ORIGINAL RESEARCH article
Front. Genet. , 23 August 2021
Sec. Cancer Genetics and Oncogenomics
Volume 12 - 2021 | https://doi.org/10.3389/fgene.2021.689801
This article is part of the Research Topic Bioinformatics Tools (and Web Server) for Cancer Biomarker Development, Volume II View all 24 articles
Dysregulation of autophagy-related genes (ARGs) is related to the prognosis of cancers. However, the aberrant expression of ARGs signature in the prognosis of hepatocellular carcinoma (HCC) remain unclear. Using The Cancer Genome Atlas and the International Cancer Genome Consortium database, 188 common autophagy-related gene pairs (ARGPs) were identified. Through univariate, least absolute shrinkage and selection operator analysis, and multivariate Cox regression analysis, a prognostic signature of the training set was constructed on the basis of 6 ARGPs. Further analysis revealed that the ARGP based signature performed more accurately in overall survival (OS) prediction compared to other published gene signatures. In addition, a high risk of HCC was closely related to CTLA4 upregulation, LC3 downregulation, low-response to axitinib, rapamycin, temsirolimus, docetaxel, metformin, and high-response to bleomycin. Univariate Cox and multivariate Cox analysis revealed that the risk score was an independent prognostic factor for HCC. These results were internally validated in the test and TCGA sets and externally validated in the ICGC set. A nomogram, consisting of the risk score and the TNM stage, performed well when compared to an ideal nomogram. In conclusion, a 6-ARGP-based prognostic signature was identified and validated as an effective predictor of OS of patients with HCC. Furthermore, we recognized six small-molecule drugs, which may be potentially effective in treating HCC.
Hepatocellular carcinoma (HCC) is one of the most common liver malignancies worldwide, with increasing rates of morbidity and mortality annually (Bray et al., 2018). The prognosis of patients with HCC is poor owing to its high recurrence rate. Hence, effective biomarkers are needed to help improve the prognosis of patients with HCC.
Autophagy, also called “programmed cell death type II,” plays an important role in tumorigenesis, metastasis and drug resistance (Huang et al., 2018). Liu K. et al. (2018) reported that autophagy is required for benign hepatic tumors to progress into malignant HCC. Another study revealed that the activation of autophagy can promote metastasis through the upregulation of MCT1 via activating Wnt/β-catenin signaling in HCC cells (Fan et al., 2018). Sorafenib is an effective molecular-targeted drug used to treat advanced-stage HCC by inducing autophagy, thus prolonging the survival of patients with HCC (Raza and Sood, 2014; Finn et al., 2018). While only approximately 30% of patients with advanced HCC respond well to sorafenib, resistance to sorafenib remains an open question, which may result from pro-survival pathways of autophagy induced by sorafenib (Sun T. et al., 2017; Jiang et al., 2018). These findings indicate that autophagy plays an important role in the prognosis of patients with HCC. Hence, autophagy-related genes (ARGs) can be effective biomarkers to diagnose, and guide treatments for HCC. However, some effective biomarkers to predict the prognosis of HCC have not been established thus far.
To construct an autophagy-related prognostic signature for HCC, The Cancer Genome Atlas (TCGA) and the International Cancer Genome Consortium (ICGC) data sets were used as the data source in this study. A 6-autophagy-related gene pair (ARGP) prognostic signature was identified and validated for its predictability of overall survival (OS) among patients with HCC in comparison with 3 others previously reported prognostic gene signatures. Furthermore, the effectiveness of small-molecule drugs for HCC was assessed, and 6 types of drugs were identified and validated in this study.
Transcription profiling RNA data, along with the HCC clinical data were downloaded from TCGA1 (Liu J. et al., 2018), and were used to identify differentially expressed ARGs. Finally, 370 patients with complete survival data were identified from TCGA and randomized into a training set (n = 185) and test set (n = 185); These two sets were used to develop and internally validate the HCC prognostic signature. The demographic characteristics of the training set, test set, and TCGA set are summarized in Table 1. To externally validate the prognostic value of the prognostic signature, the gene expression data, and the clinical data on patients with HCC from the ICGC database (ICGC-LIRI-JP)2 were downloaded as well. The databases selection and data procession flow chart of this study were shown in Figure 1.
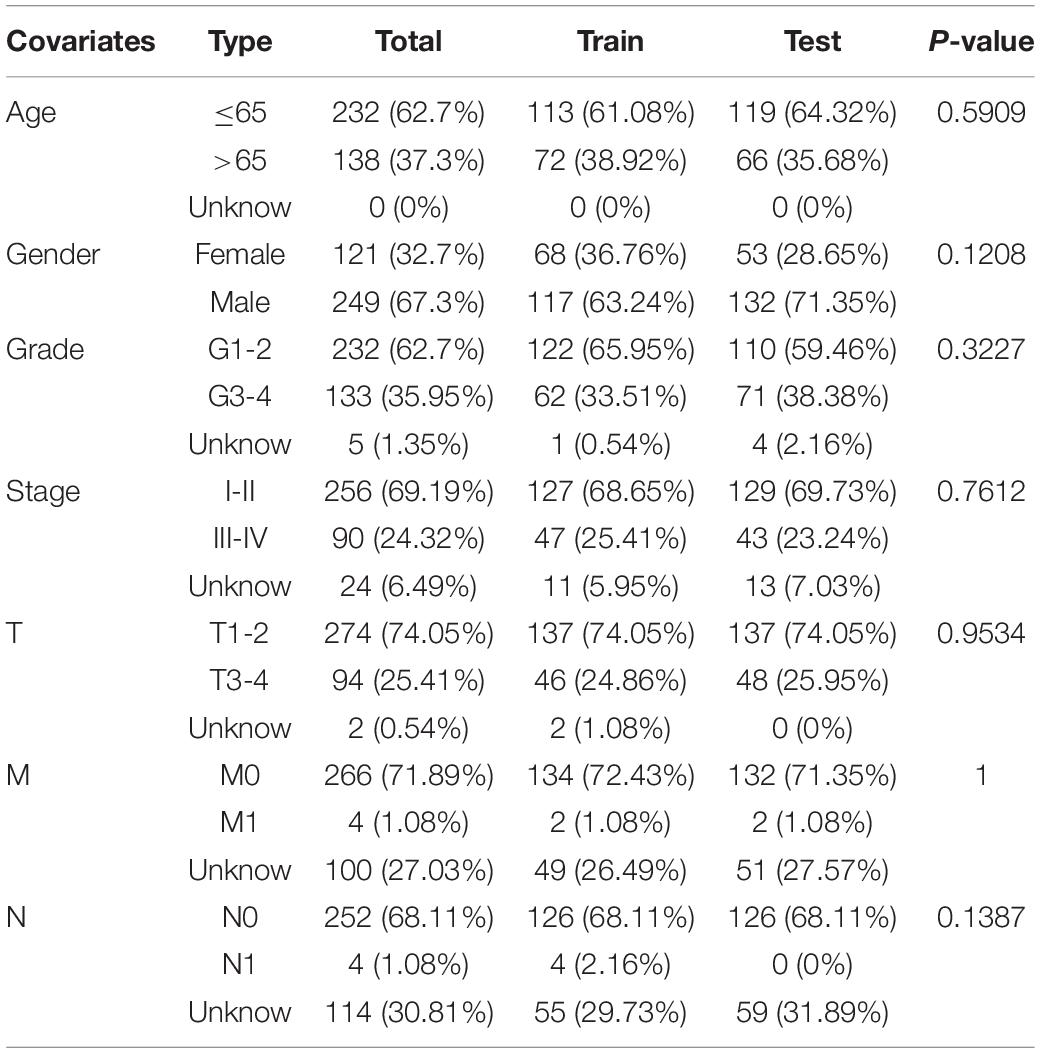
Table 1. Clinicopathological parameters of hepatocellular carcinoma patients in training set, test set and TCGA data set.
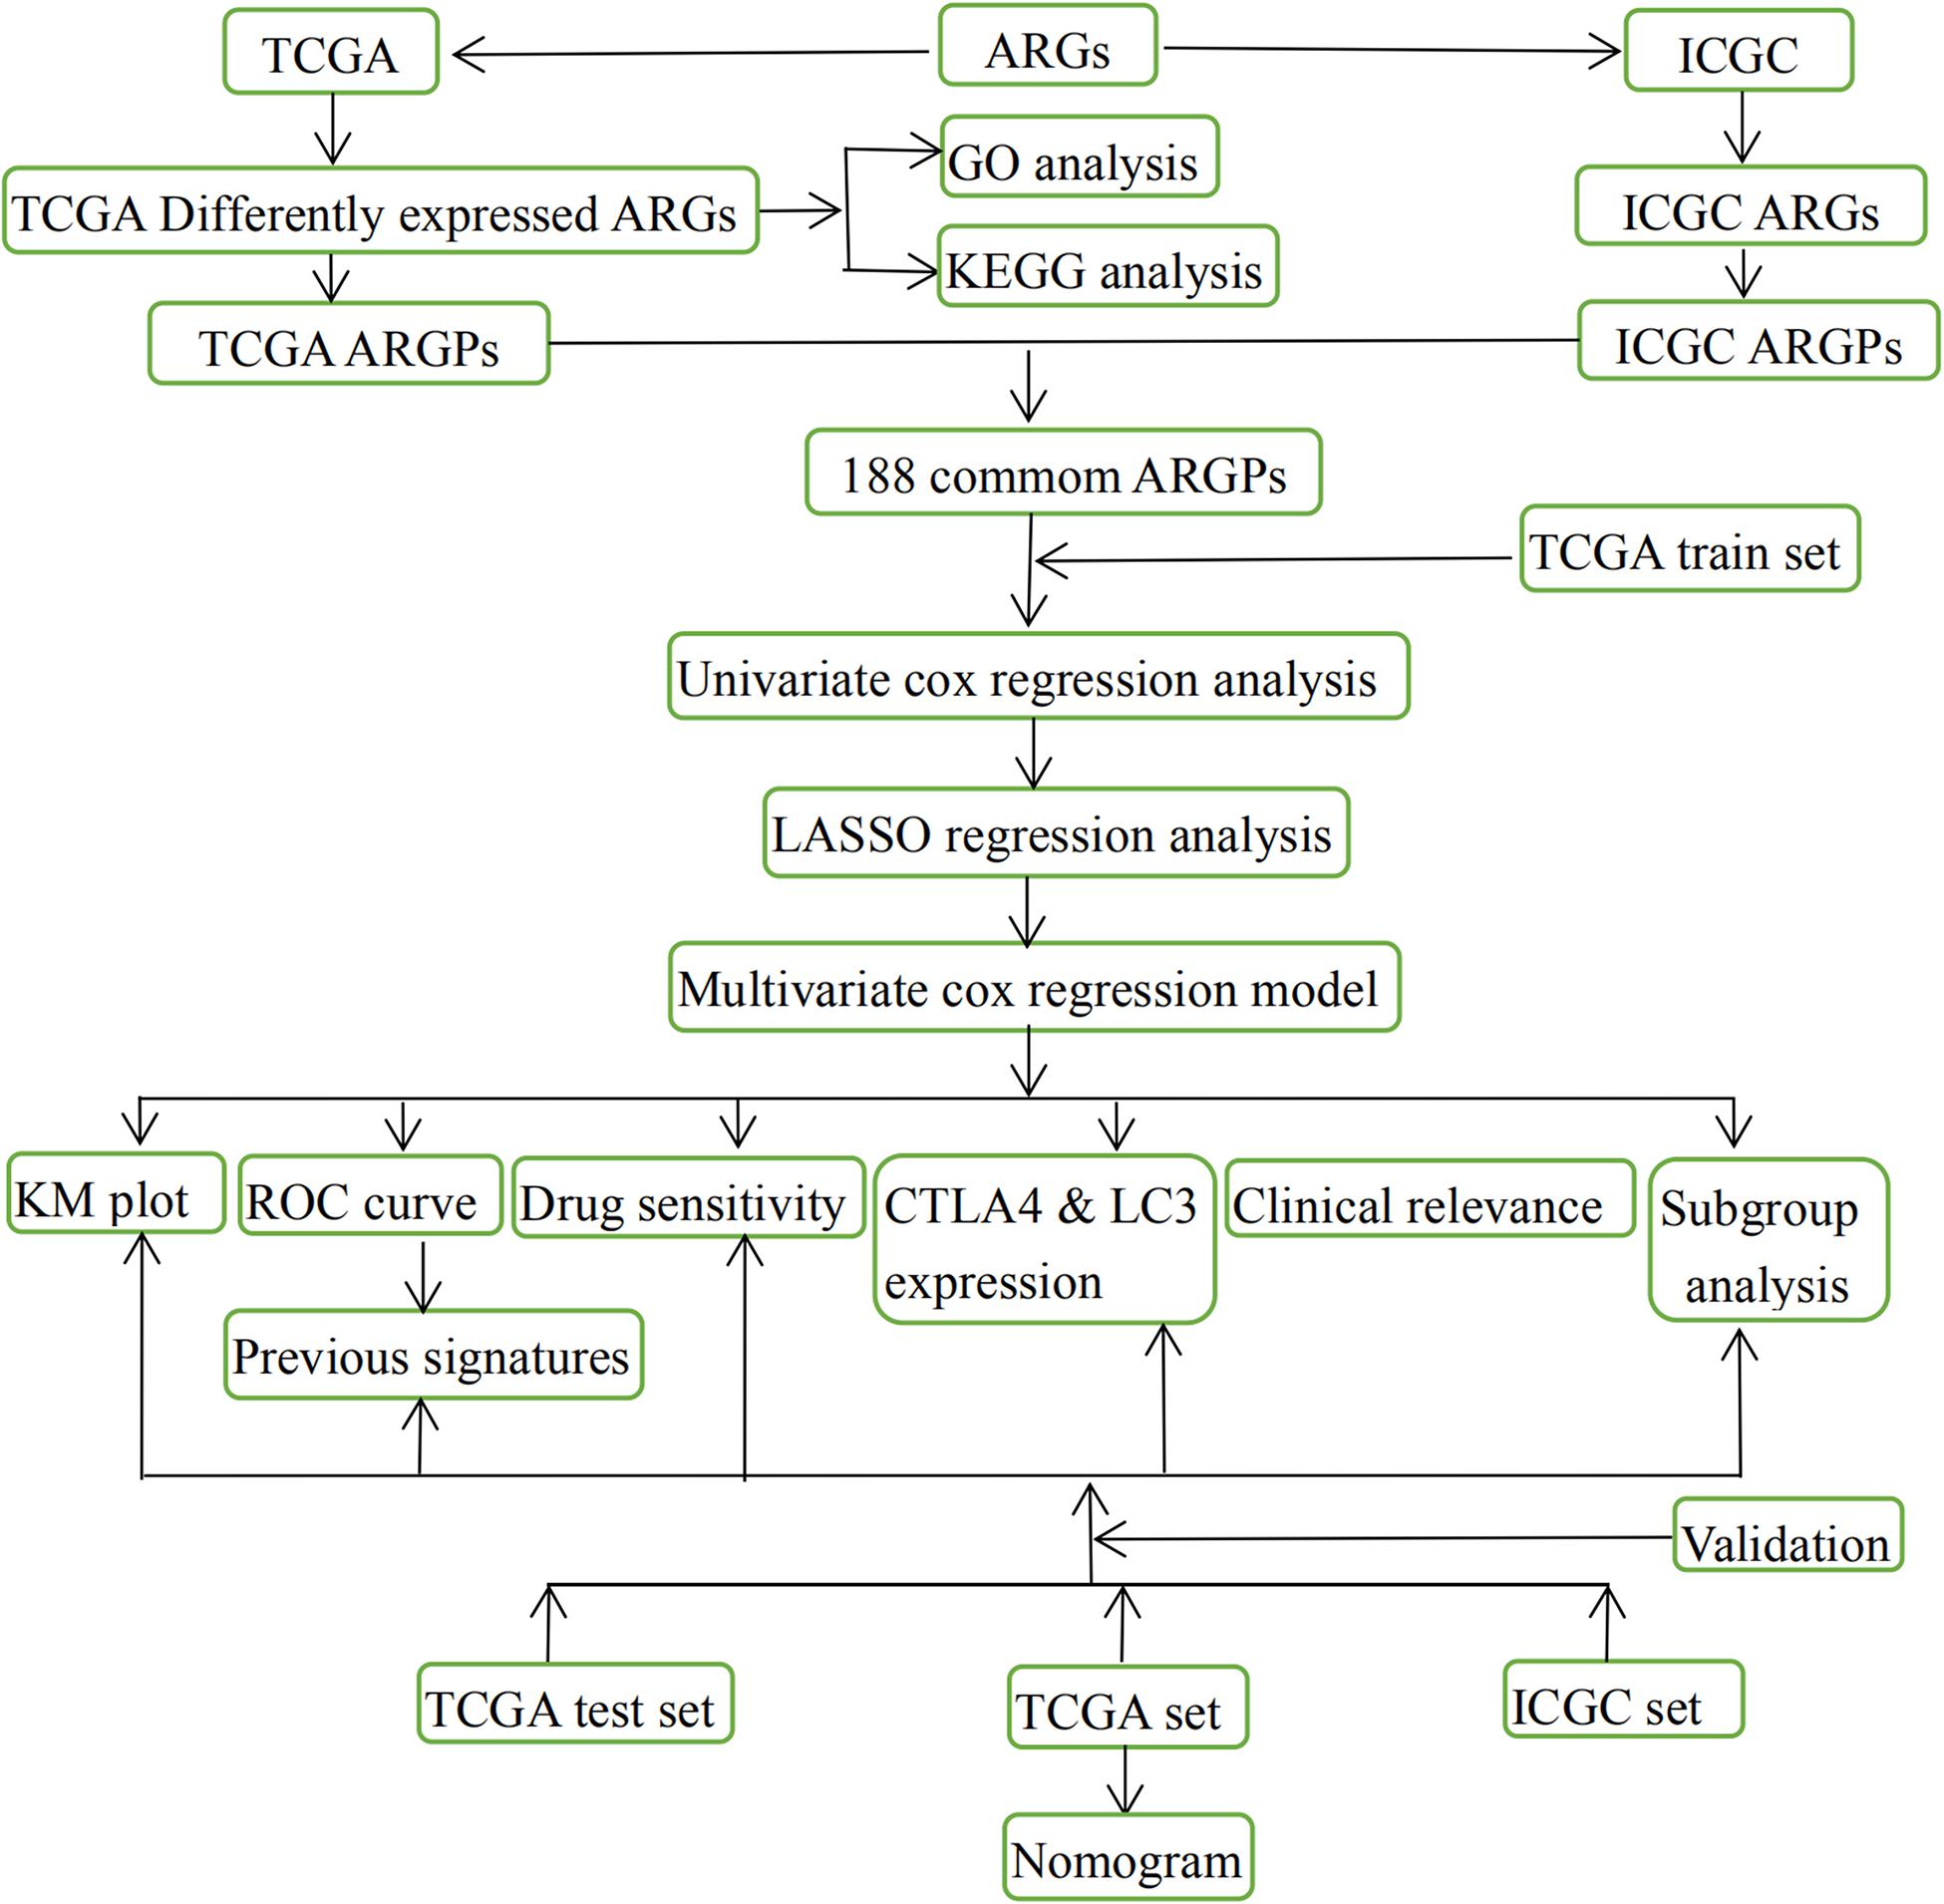
Figure 1. Entire workflow of the present study.
An ARG set was downloaded from the Human Autophagy Database3. We then extracted the expression profile of these ARGs on the basis of the gene set and TCGA transcription profiling data. Differentially expressed ARGs were identified using the limma package. Differential expression of ARGs with a log2 fold change (|log2FC|) > 1 and a false discovery rate < 0.05 were considered significant and were included in the subsequent analysis. The Gene Ontology (GO) and Kyoto Encyclopedia of Genes and Genomes (KEGG) functional analysis were performed to explore the potential molecular function of these differentially expressed ARGs (Bandyopadhyay and Mallick, 2014).
In this study, OS was considered the primary endpoint. Pairwise comparison was performed between the expression profiles of differentially expressed ARGs in each HCC sample to obtain a score for each ARGP by using the R software. According to the proposed algorithm (Heinäniemi et al., 2013), if the expression level of the first ARG was higher than that of the second ARG in an ARGP, the score of this ARGP was 1; otherwise, the score was 0. If the score of an ARGP was 0 or 1 in > 80% of the samples of the training or the test sets, the ARGP was discarded, and the rest of the ARGPs were involved in subsequent analysis. Univariate Cox regression analysis was performed for the training set to identify OS-related ARGPs (FDR < 0.05), and the Least absolute shrinkage and selection operator (LASSO) analysis was performed to avoid overfitting of the prognostic signature. The most stable ARGP prognostic signature was constructed through multivariate Cox regression analysis (FDR < 0.05). In this study, patients were categorized into high- and low-risk groups in accordance with the median risk score. The risk score of the prognostic signature was calculated by multiplying the expression level with Cox regression coefficients of the ARGPs. The formula was as followed: risk score = Σ Cox regression coefficient of ARGPi ∗ expression value of gene ARGPi.
The prognostic signature was evaluated by utilizing the training set and validated using the test set, TCGA set, and ICGC set. Following the median risk score of the train set, the patients were classified into high- and low-risk groups. The Kaplan-Meier (KM) method was applied to compare the OS between the high- and low-risk groups. The receiver operating characteristic (ROC) curve was plotted and the area under the curve (AUC) was calculated to ensure that the prognostic signature prediction efficacy can be estimated. Both univariate and multivariate Cox analysis were conducted with the clinicopathologic features and risk score to explore the HCC prognostic factors. Furthermore, we compared the AUC of the prognostic signature with that of 3 published gene prognostic signatures in the TCGA set. Subgroup analysis were performed to expand the application scope of the ARGP signature.
The drug response toward axitinib, rapamycin, temsirolimus, docetaxel, metformin, and bleomycin in each patient with HCC in the training set, test set, TCGA set, and ICGC set was calculated on the basis of the Genomics of Drug Sensitivity in Cancer (GDSC)4 by using the prophetic R package5. The half maximal inhibitory concentration (IC50) value for patients with HCC was used to evaluate the effectiveness of these drugs, and P < 0.05 was set as the cutoff value.
We included all independent clinicalpathological prognostic factors selected from multivariate Cox regression analysis to construct a nomogram that can assess an OS probability of 1, 3, and 5 years for patients with HCC. The prediction probability of the nomogram was compared with the observed actual probability form the calibration curve to verify its accuracy. Overlaps with the reference line indicate that the model is accurate.
Statistical analysis was performed using the R software (version 3.6.3)6 and Perl software (version 5.30)7. Cluster heatmaps and volcano maps were generated using gplots and heatmap packages. Univariate and multivariable Cox proportional hazards regression analysis were performed using the survival R software package. The KM analysis was performed using the survival R package and assessed using the log-rank test (Aalen, 1988). The survival ROC R package was used to calculate the AUC of the survival ROC curve.
As shown in Figures 2A,B 59 ARGs were identified, including 4 down-regulated and 55 up-regulated genes. GO analysis of these ARGs revealed that “autophagy,” “vacuolar membrane,” and “protein kinase regulator activity” were the most frequent biological terms for biological processes, cellular components, and molecular functions, respectively (Figures 2C,D; Wang et al., 2021). KEGG analysis revealed that the primary pathways of these ARGs were “autophagy-animal,” “IL-17 signaling pathway,” “PI3K-Akt signaling pathway,” and “mTOR signaling pathway,” which were primarily correlated with autophagy, immune process, and carcinogenicity (Figures 2E,F).
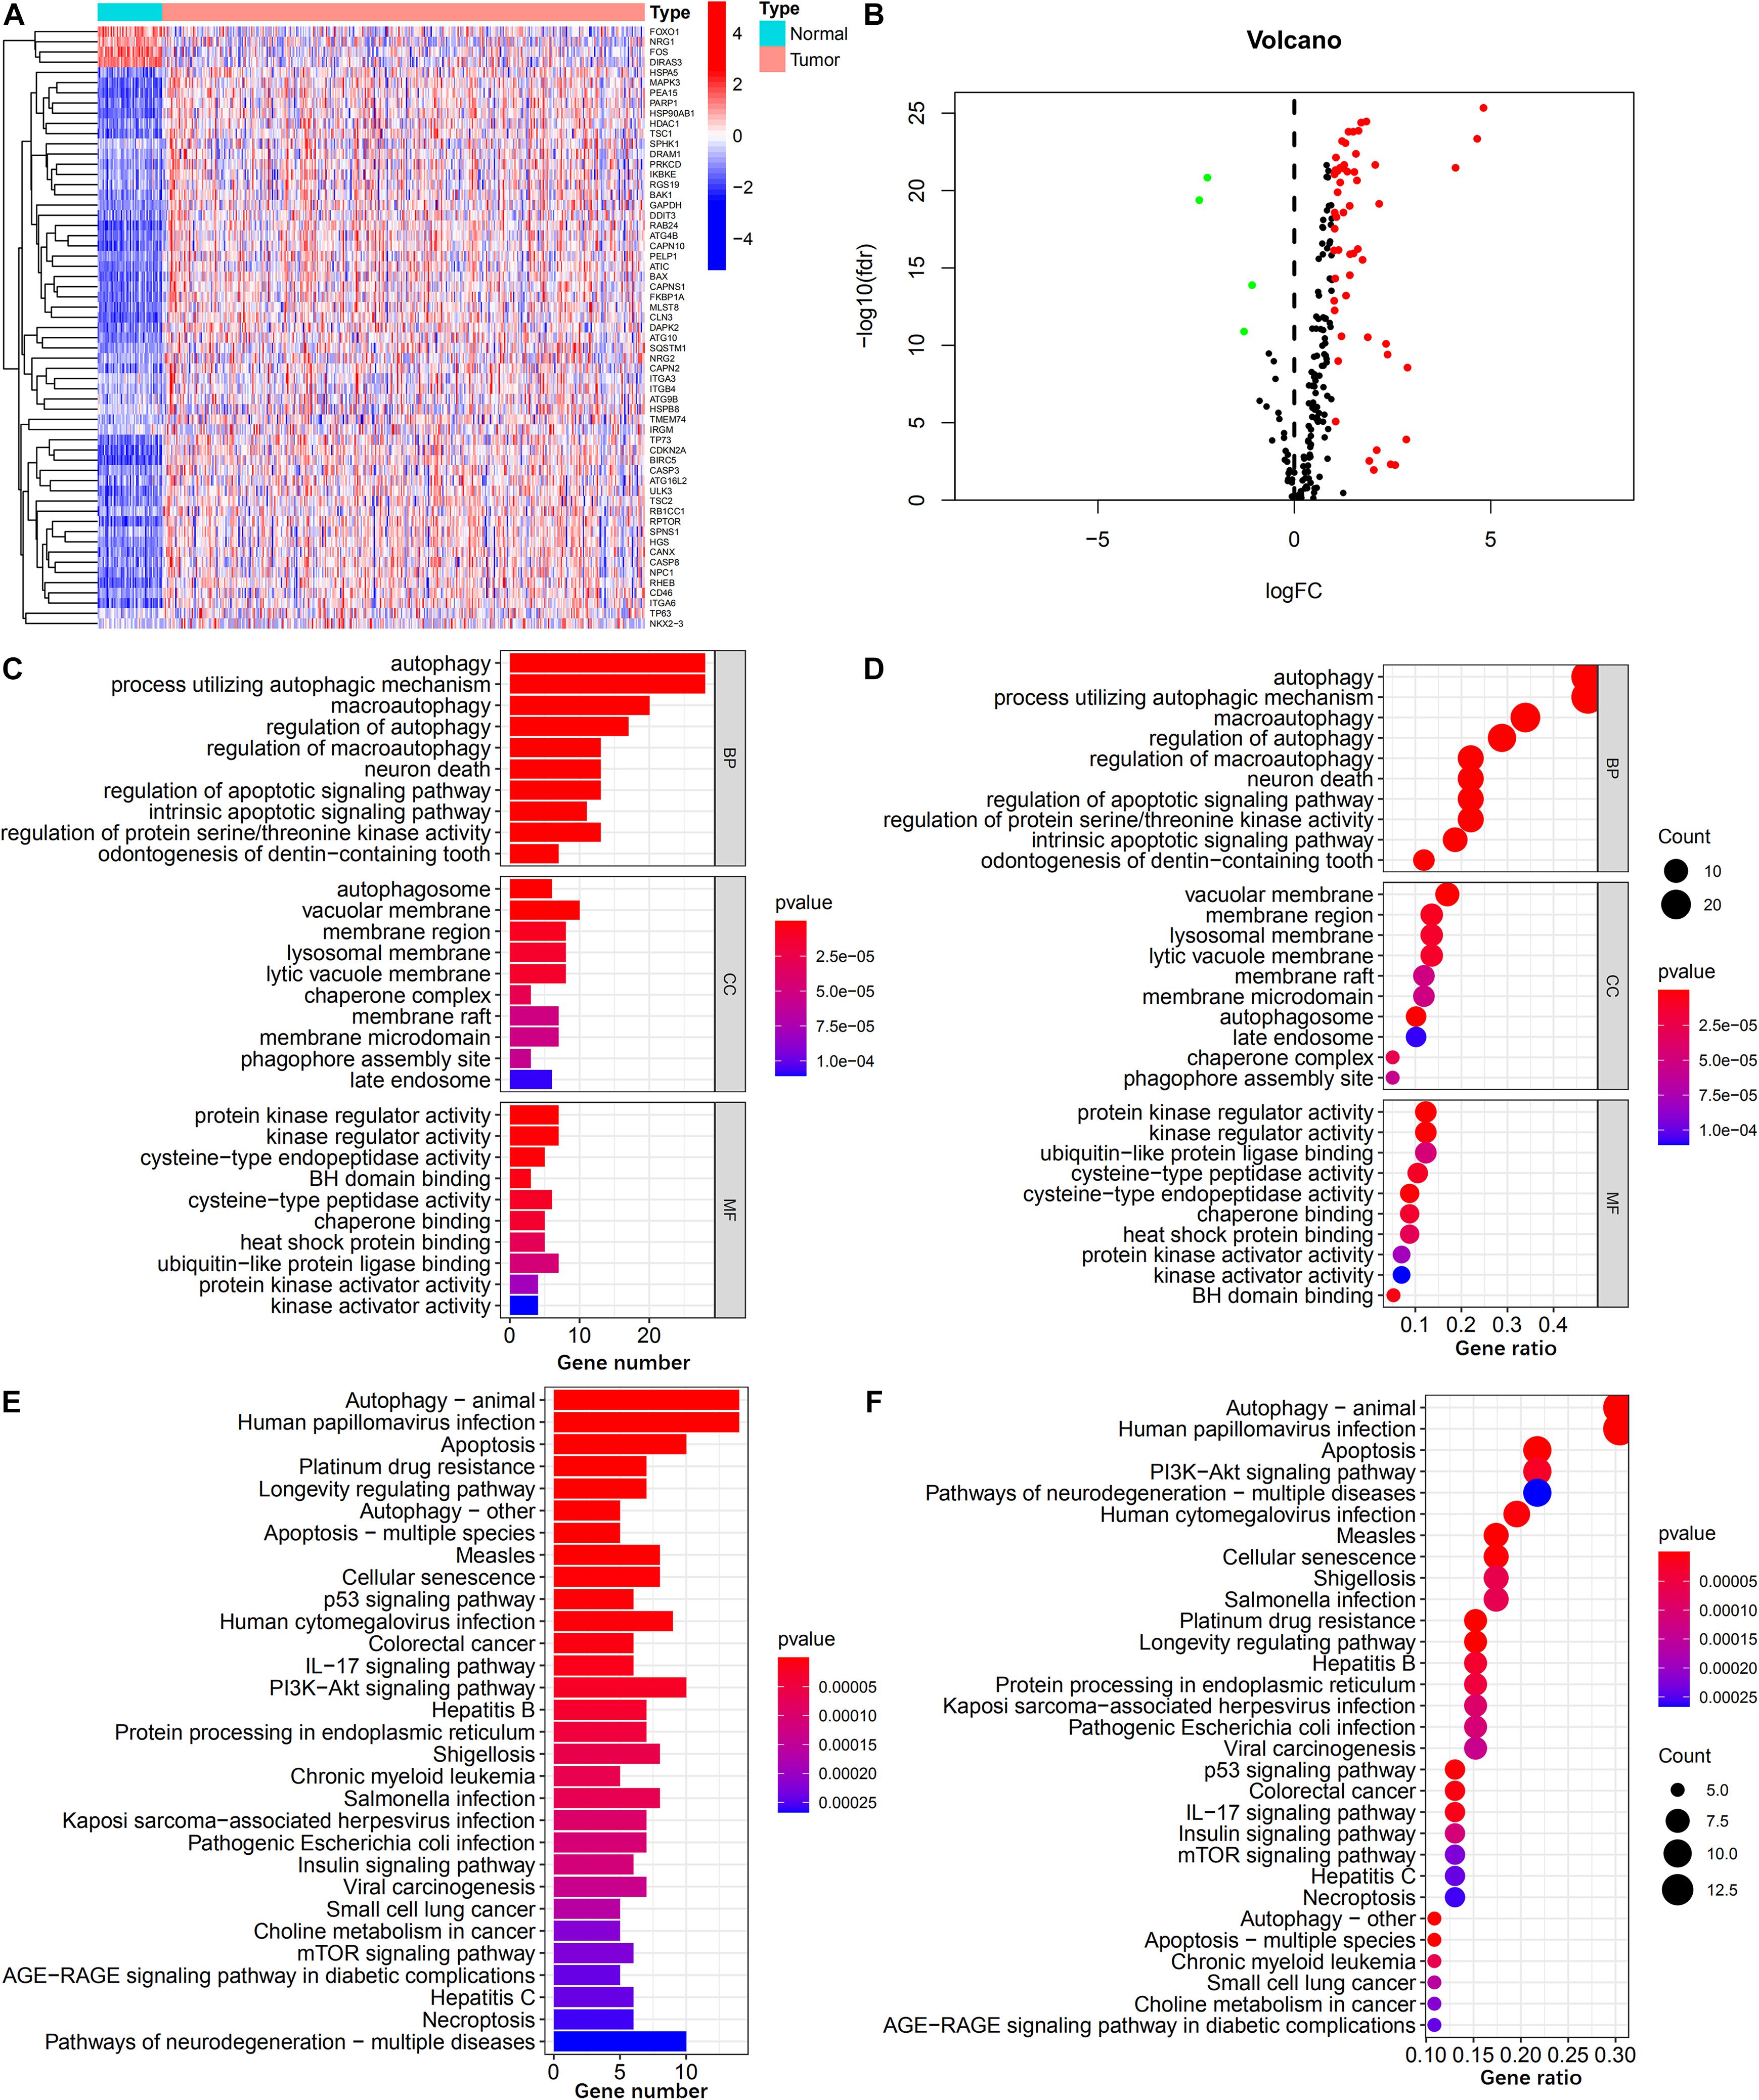
Figure 2. Identification of differentially expressed ARGs. (A,B) Heatmap and volcano plot illustrates the expression of 59 differentially expressed ARGs between HCC tumor and non-tumor specimens. (C,D) Barplot and bubble plot of GO analysis shows the top 10 biological functions of the differentially expressed ARGs in the biological processes, cellular components, and molecular functions. (E,F) Barplot and bubble plot of KEGG analysis shows the top 30 signaling pathways of the differentially expressed ARGs participated in.
In total, 188 common ARGPs from among the TCGA and ICGC expression profile data were extracted. 17 ARGPs were found to be related to OS among patients with HCC, as revealed through univariate Cox regression analysis (Figure 3B). Thereafter, 9 ARGPs were found to be capable to construct a prognostic signature through LASSO analysis (Figure 3A). Finally, a 6-ARGP prognostic signature was constructed through multivariate Cox regression analysis, which included BAK1| PELP1, BIRC5| CDKN2A, BIRC5| RGS19, CAPN2| ULK3, DIRAS3| TMEM74, and PRKCD| RB1CC1 (Figure 3C). The risk score of our prognostic signature was as follows: risk score = (the expression level of BAK1| PELP1 ∗ 0.6951) + (the expression level of BIRC5| CDKN2A ∗ 0.5093) + (the expression level of BIRC5| RGS19 ∗ 0.6322) + (the expression level of CAPN2| ULK3 ∗ 0.5645) + (the expression level of DIRAS3| TMEM74 ∗ -0.4505) + (the expression level of PRKCD| RB1CC1 ∗ 0.5581).
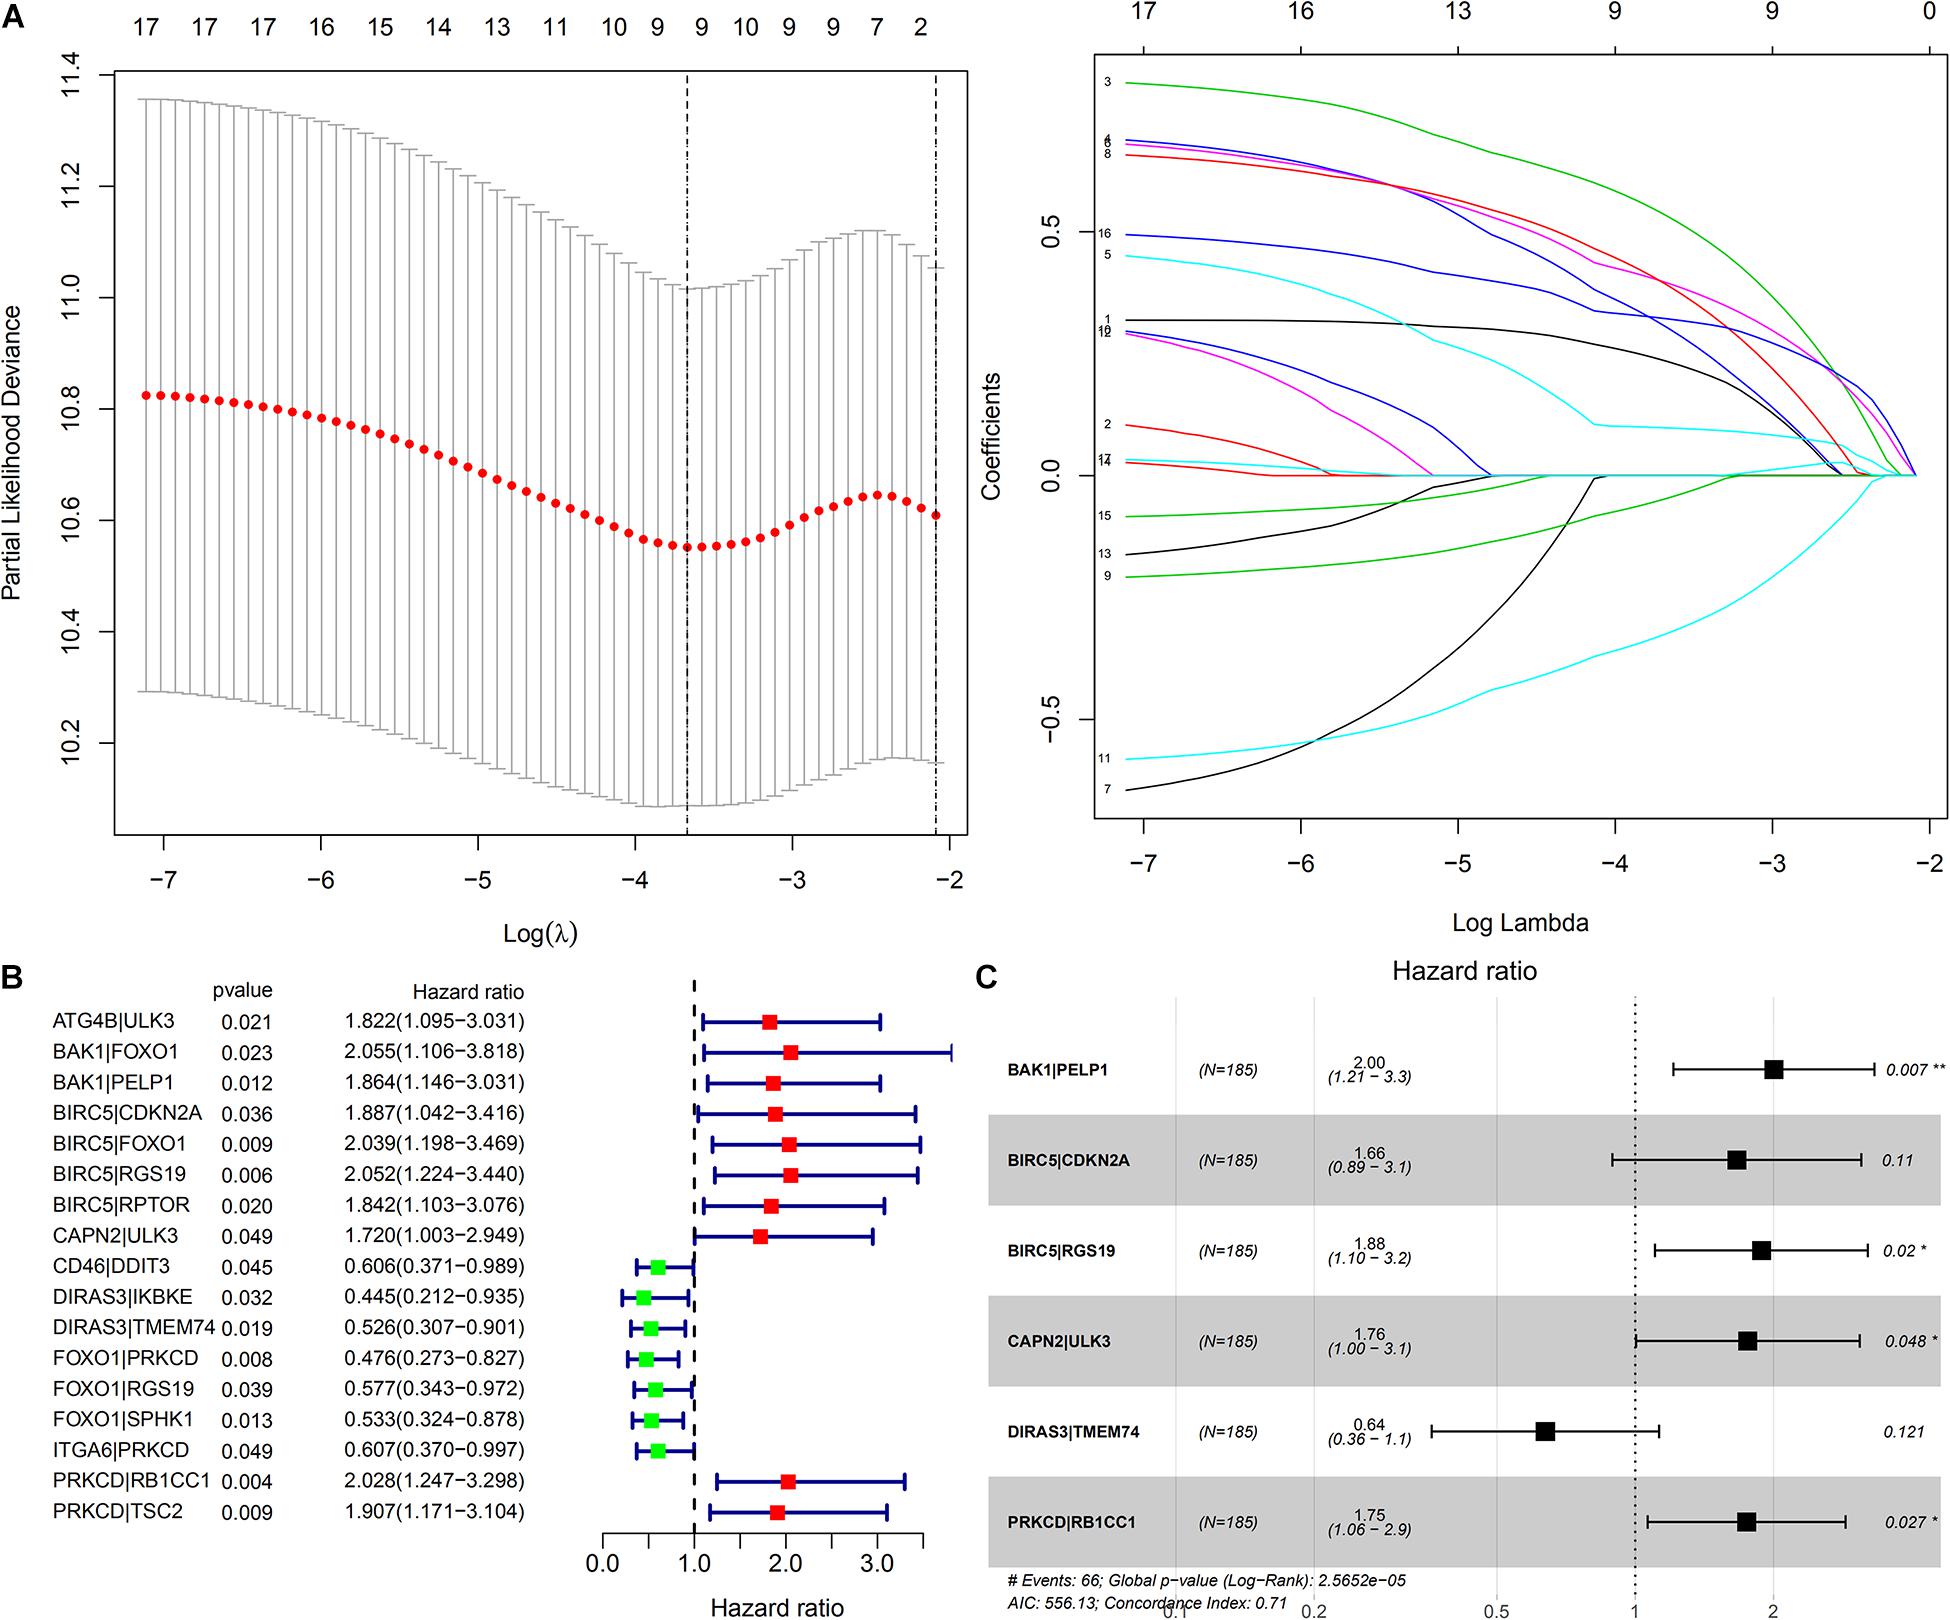
Figure 3. Construction of a prognostic signature based on ARGP. (A) The Cross-Validation fit curve was calculated by lasso regression analysis. (B) The Forest plot represents the 17 OS-related ARGPs identified by Univariate Cox regression analysis. (C) The 6 ARGPs to construct the prognostic signature selected by Multivariate Cox regression analysis. P < 0.05 sets as the cutoff value.
The AUC of the 1-, 2-, and 3-year OS were 0.773, 0.761, and 0.761, respectively (Figure 4E). As shown in Figure 4A, the OS of the high-risk group was poorer than that of the low-risk group.
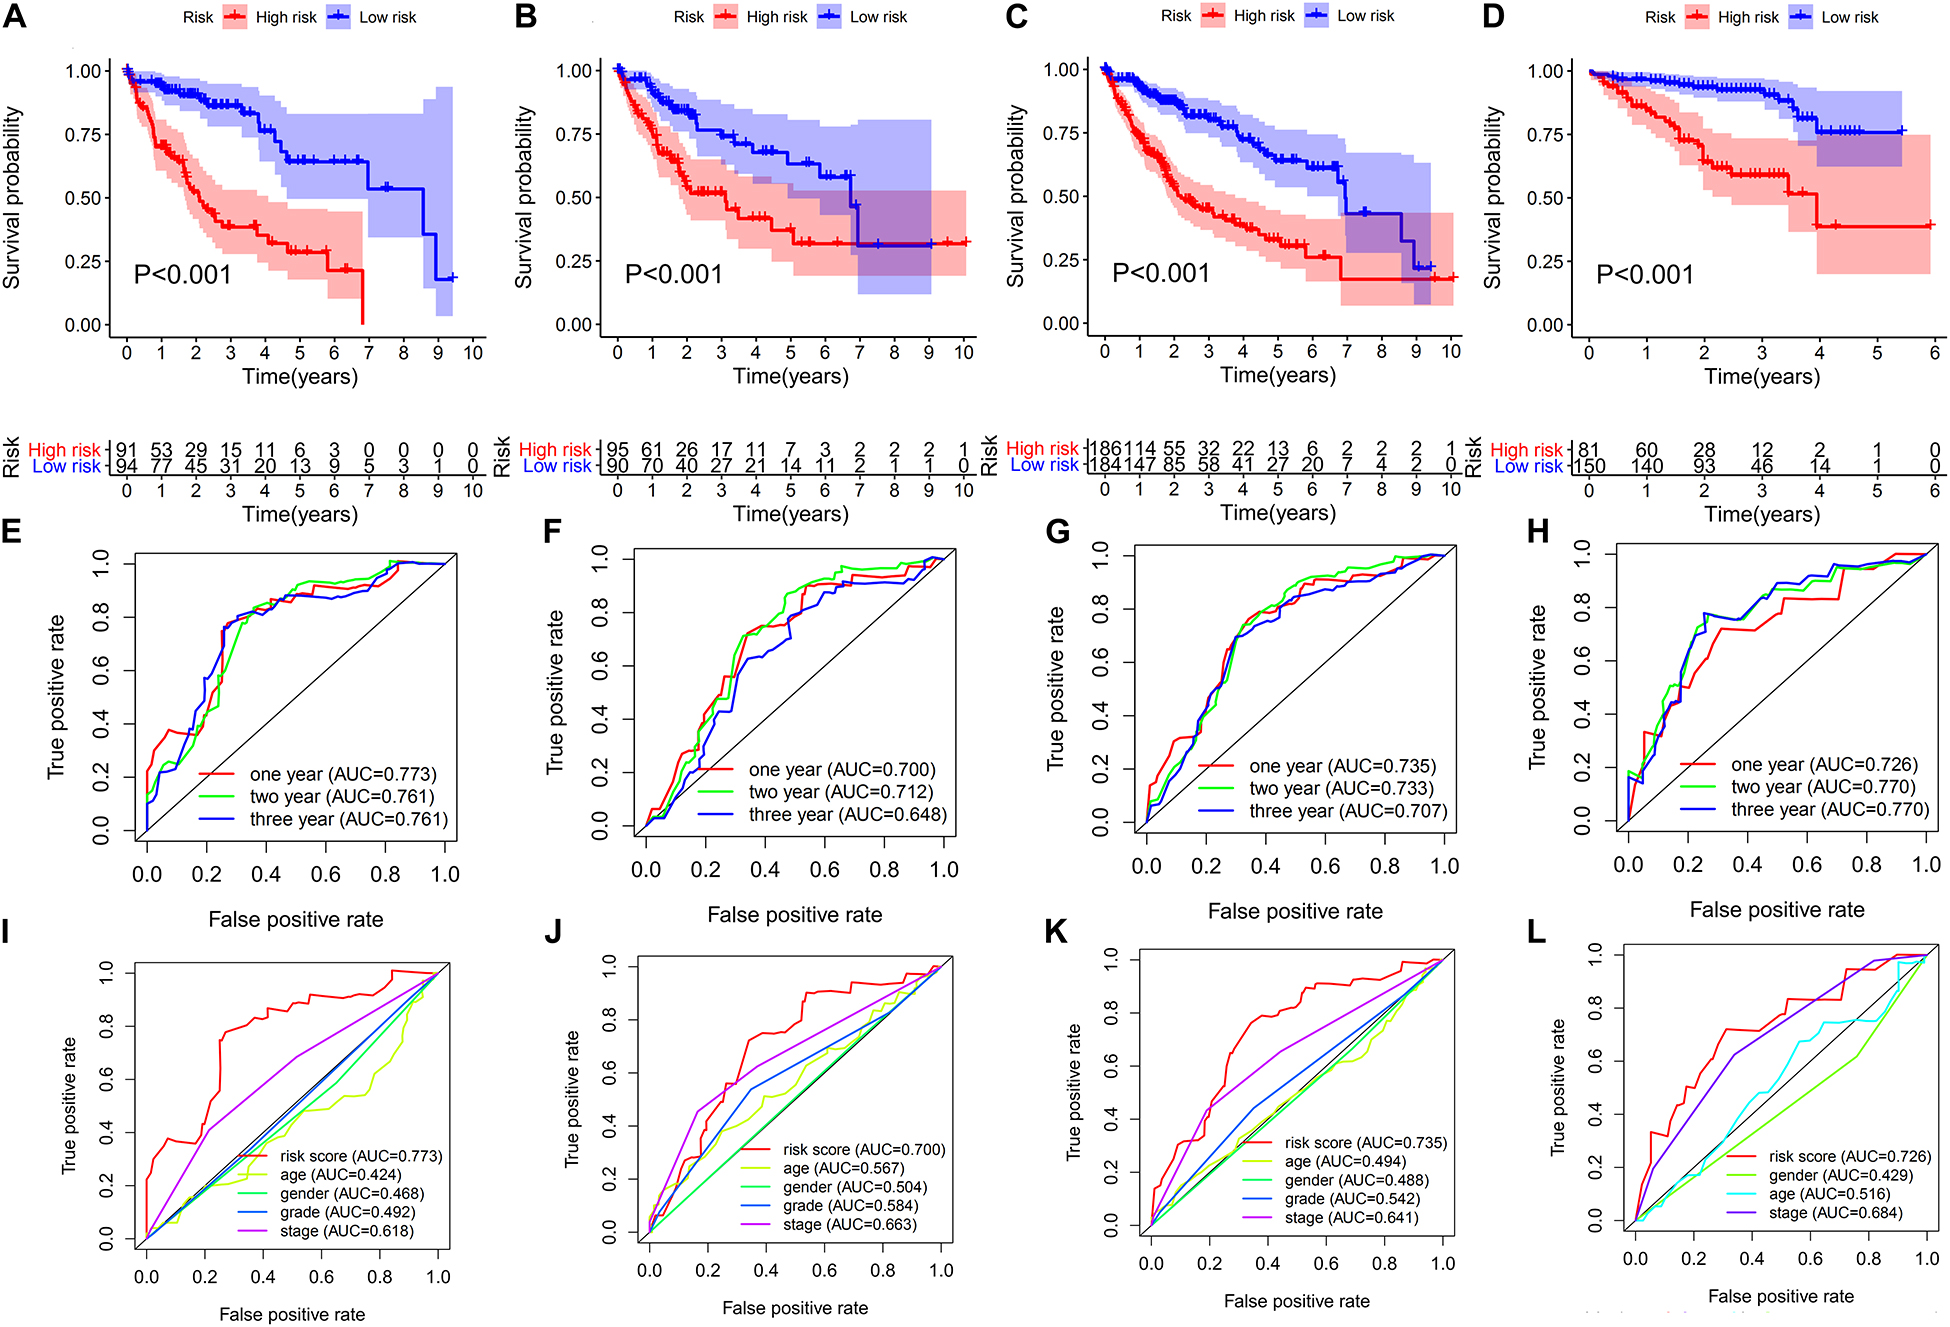
Figure 4. Evaluation and validation of the risk score of the 6-ARGP signature. Survival analysis and ROC analysis based on risk score in the training set (A,E,I), test set (B,F,J), TCGA set (C,G,K), and ICGC set (D,H,L), respectively.
The predictive values of the ARGP prognostic signature were validated in the test set, TCGA set, and ICGC set, respectively. To improve the accuracy of validation, patients in the aforementioned 3 data sets were randomized into high- and low-risk groups using the same cutoff of the training set, i.e., the median risk score of the training set. As shown in Figures 4B–D, the OS of the high-risk group of the aforementioned 3 data sets had poorer OS than the low-risk group. The AUC of test set, TCGA set and ICGC set was 0.7, 0.735, and 0.726 after year 1; 0.712, 0.733, and 0.77 after year 2; and 0.648, 0.707, and 0.77 after year 3, respectively (Figures 4F–H). In addition, the AUC of the ARGP signature was higher than age, gender, TNM stage and tumor grade in the train, test, TCGA and ICGC set (Figures 4I–L). The survival status of patients, the rank of the risk score, and the heatmap of expression profiles of the 6 ARGPs in the low- and high-risk groups are indicated in Supplementary Figure 1.
As shown in Figure 5, the univariate and multivariate Cox regression analysis indicate that the risk score could potentially be an independent prognostic factor after adjustment by age, gender, tumor grade, and TNM stage in the training (HR: 2.066, 95% CI: 1.637–2.607, P < 0.001), test (HR: 1.801, 95% CI: 1.487–2.18, P < 0.001), TCGA (HR: 1.397, 95% CI: 1.203–1.622, P < 0.001) and ICGC sets (HR: 1.59, 95% CI: 1.248–2.025, P < 0.001).
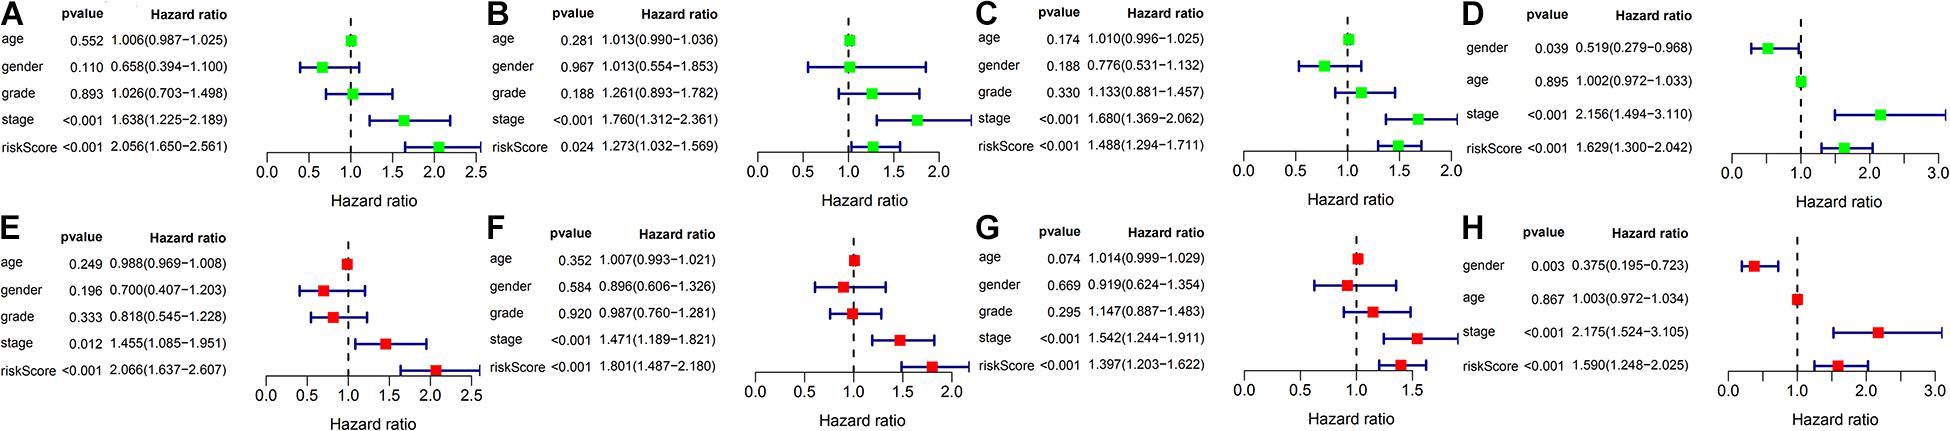
Figure 5. Univariate Cox and Multivariate Cox regression analysis of risk score and clinicopathologic factors in different cohorts. (A–D) Forest plot represents the results of univariate Cox regression analysis in the training set, test set, TCGA set and ICGC set, respectively. (E–H) Forest plot represents the results of multivariate Cox regression analysis in the training set, test set, TCGA set and ICGC set, respectively.
Subgroup analysis based on age (>65 and ≤ 65 years), gender (male and female), tumor grade (G1-2 and G3-4), TNM stage (I-II and III-IV), tumor stage (T1-2 and T3-4), lymph node metastasis status (N0), and distant metastasis status (M0) in the training, test, TCGA, and ICGC sets were performed to further validate the predictive values of the ARGP signature. As shown in Supplementary Figures 2, 3, all subgroup analysis in the training, TCGA, and ICGC sets performed well in OS prediction. In the test set, subgroup analysis performed well in OS prediction, except for patients in subgroups of female, G1-2, Stage III-IV, and T3-4.
As shown in Supplementary Figure 4, risk score of both the test and TCGA sets was associated with the pathological stage (I-II and III-IV), and tumor grade (G1-2 and G3-4), and the risk-score of training set was also correlated with the tumor grade (G1-2 and G3-4).
To further explore the role of autophagy and immune processes in the OS of patients with HCC, analysis of CTLA4 and LC3 expression levels between high-risk and a low-risk group of the ARGP prognostic signature was performed. As shown in Figure 6, the expression level of CTLA4 in the low-risk group of the training, test, TCGA, and ICGC sets was lower than that of the high-risk group, while the expression level of LC3 was higher in the low-risk group in the training, test, and TCGA sets.
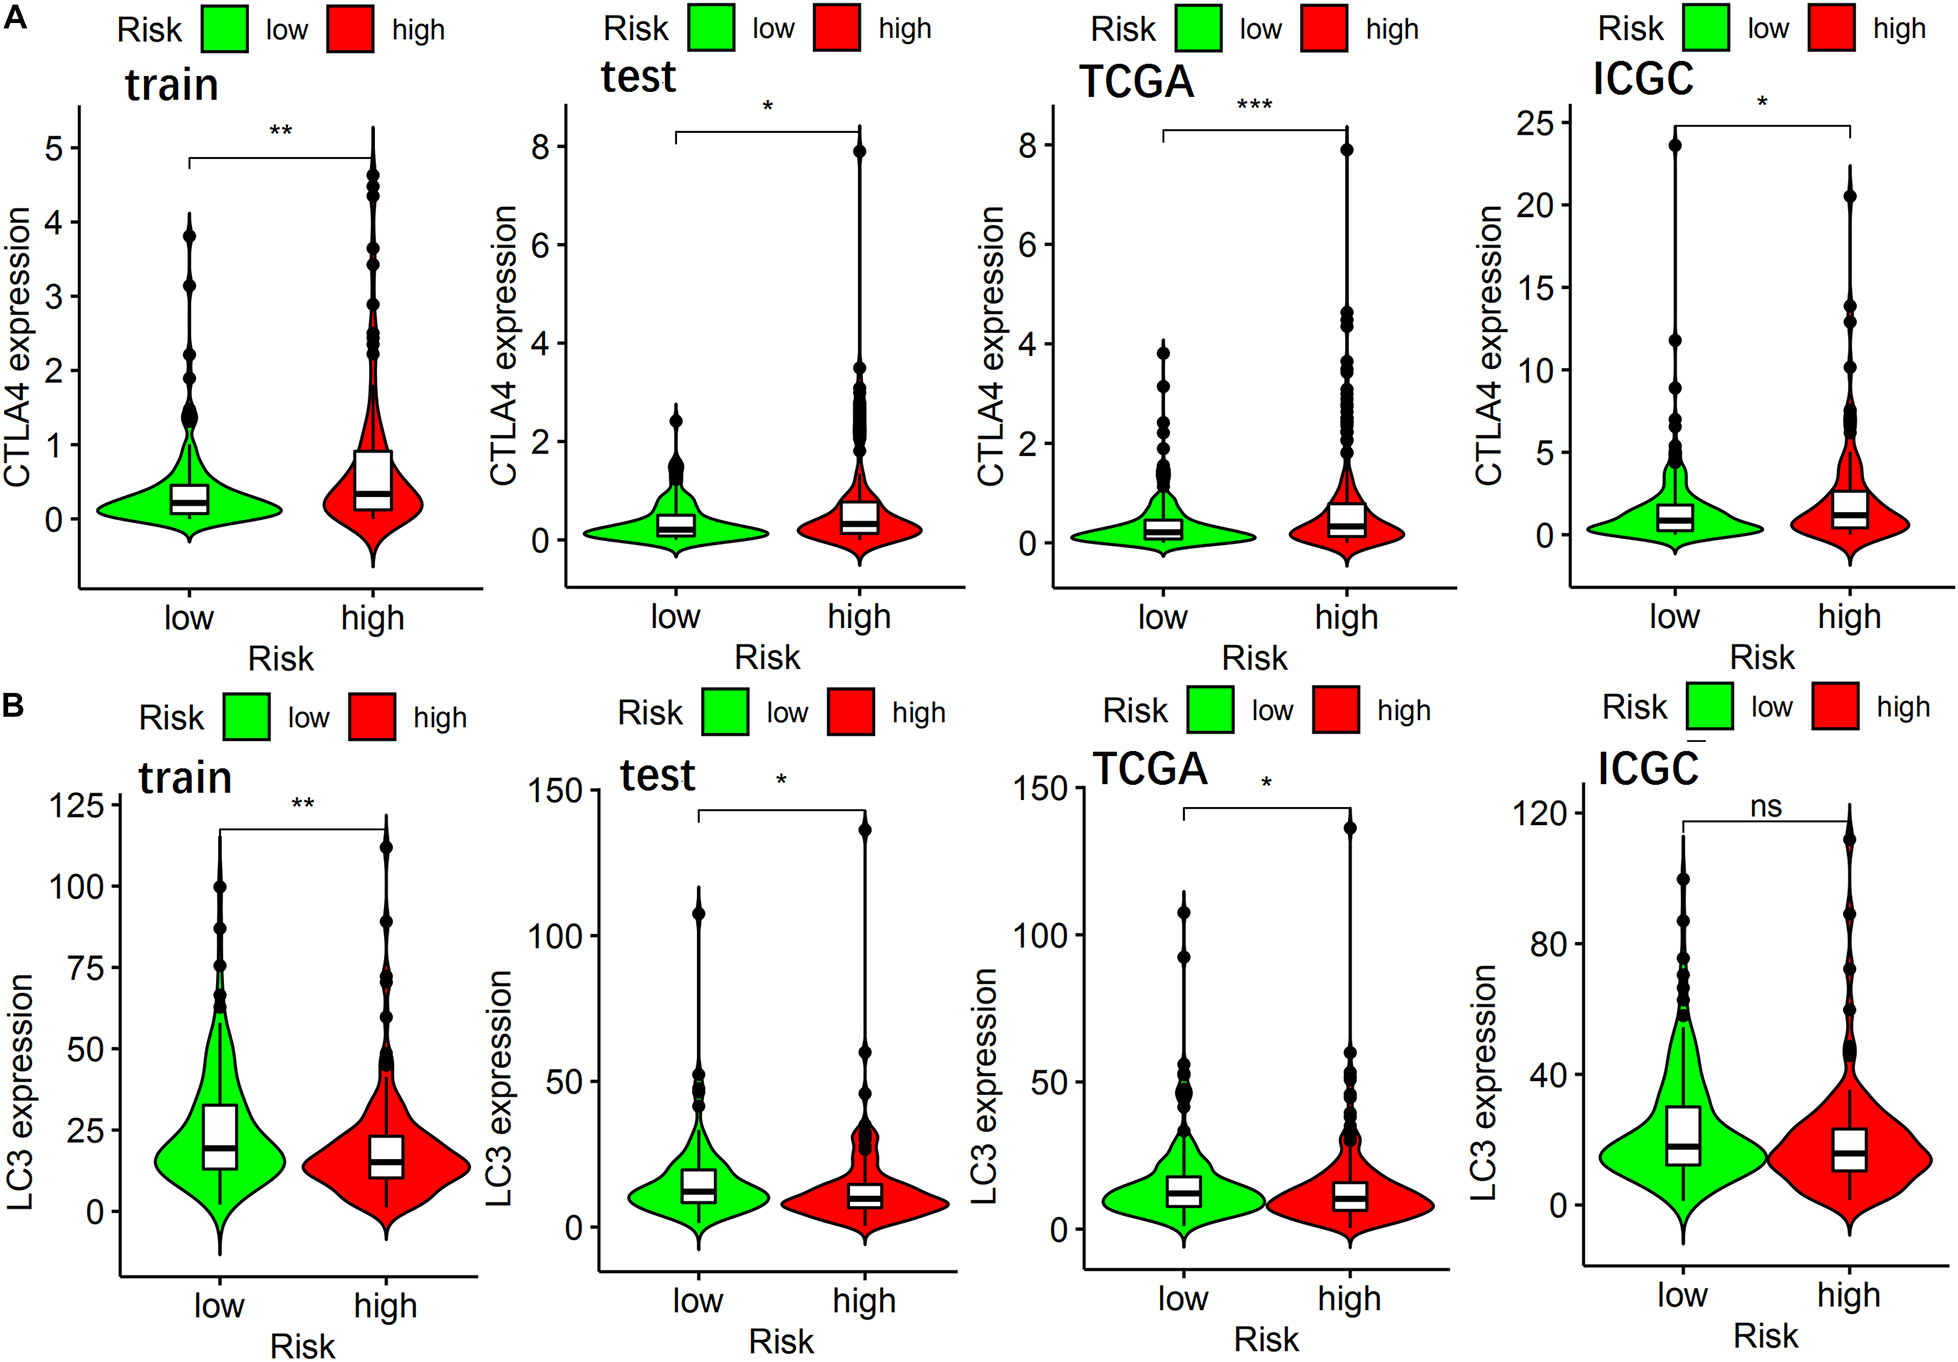
Figure 6. The relationship of ARGP risk group with CTLA4, LC3 expression in different data sets. (A) The differential expression of CTLA4 in the training set, test set, TCGA set, and ICGC set, respectively. (B) The differential expression of LC3 in the training set, test set, TCGA set, and ICGC set, respectively.
As shown in Table 2, the IC50 value of axitinib, rapamycin, temsirolimus, docetaxel, and metformin in the low-risk group was lower than that in the high-risk group, indicating that these 5 small molecule drugs were more effective for patients in the low-risk group. However, the IC50 value of bleomycin was greater in the low-risk group than in the high-risk group, indicating that bleomycin was more effective for patients in the high-risk group.
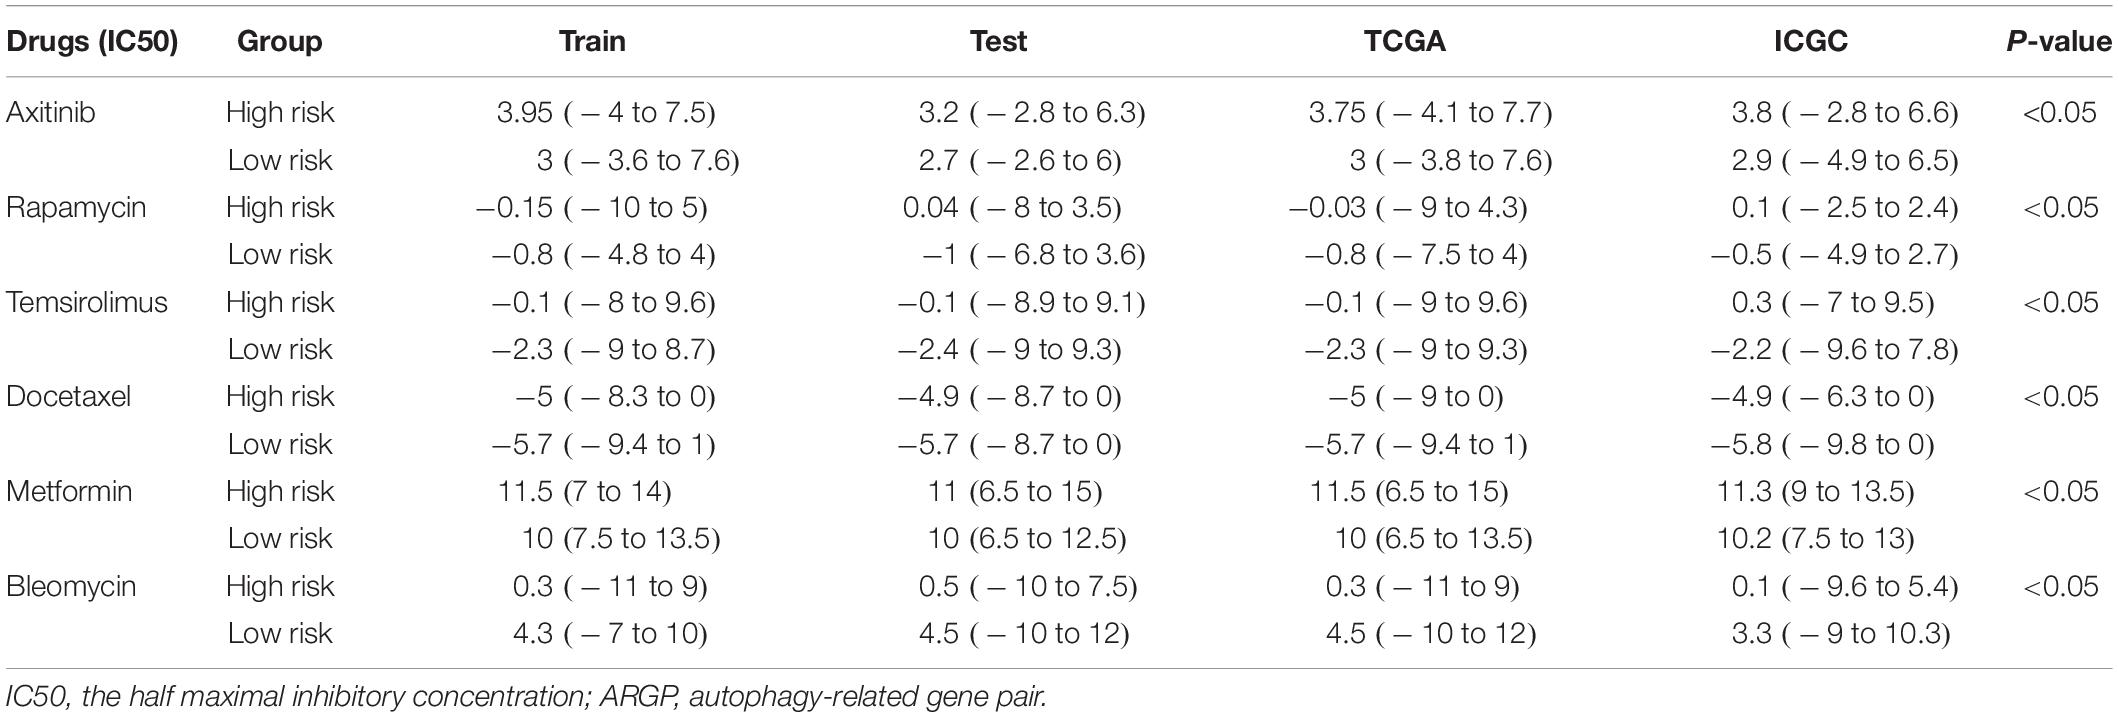
Table 2. The relationship of ARGP risk group with small molecule drug therapy response in different data sets.
As shown in Figure 7, the AUC at 1-, 3-, 5-years OS compared between the ARGP signature and 3 published gene signatures in the same TCGA set, which included a 6-gene signature (FangGeneSig), a 7-gene signature (XieGeneSig), and an 8-gene signature (XuGeneSig) (Fang and Chen, 2020; Xie et al., 2020; Xu et al., 2020). Although the AUC of the ARGP signature at 1-year OS was 0.727, which was lower than that of XieGeneSig (0.732) and XuGeneSig (0.737), the AUC of the ARGP signature at 3- and 5-year OS was 0.717 and 0.672, respectively, which was higher than that of FangGeneSig (0.606 and 0.623), XieGeneSig (0.667 and 0.648) and XuGeneSig (0.679 and 0.643). These results suggest that the predictive value of our signature was more accurate than that of the aforementioned 3 published gene signatures in longer OS prediction.
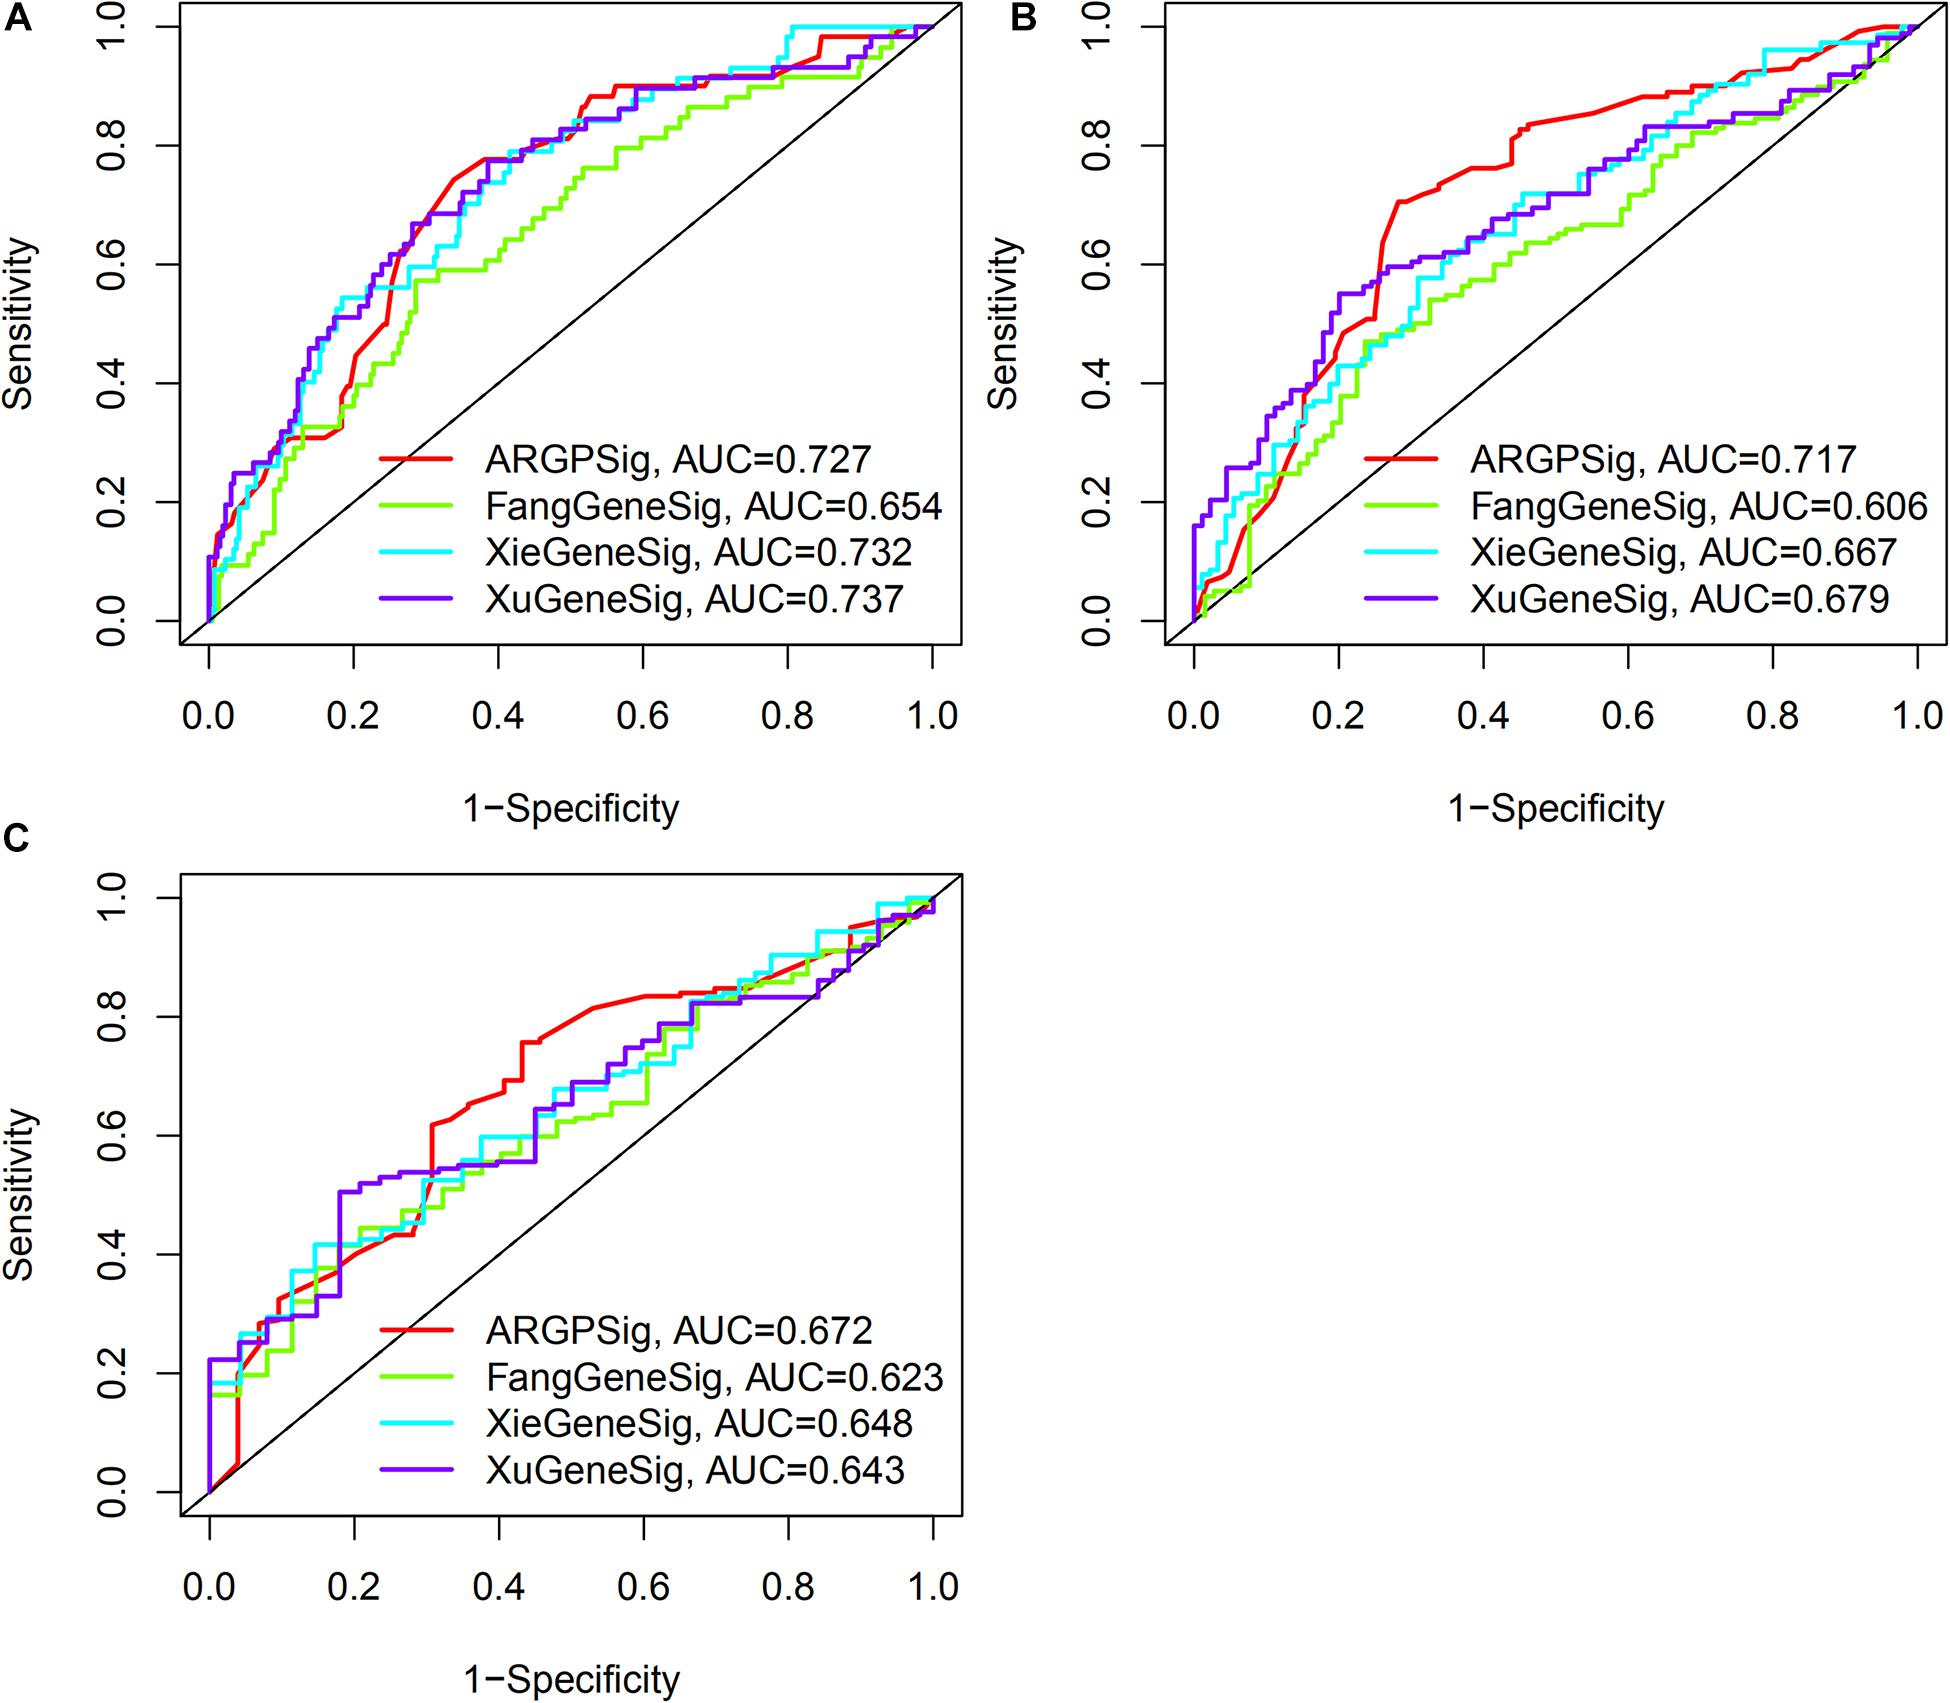
Figure 7. Comparative analysis of the predictive value of ARGP signature with published gene signature. (A–C) The AUC at 1-, 3-, 5-years OS of ARGP signature, Fang gene signature, Xie gene signature, and Xu gene signature, respectively.
The TNM stage and risk score of the signature could potentially be independent prognostic factors, as revealed through multivariate Cox regression analysis. Hence, a nomogram that consists of the TNM stage and risk score was constructed, to predict the 1-, 3-, and 5-years OS among patients with HCC. As shown in Figure 8, calibration curves of the nomogram at 1-, 3-, and 5-years OS were proximal to the actual line, indicating that our nomogram performed well in predicting the OS of patients with HCC.
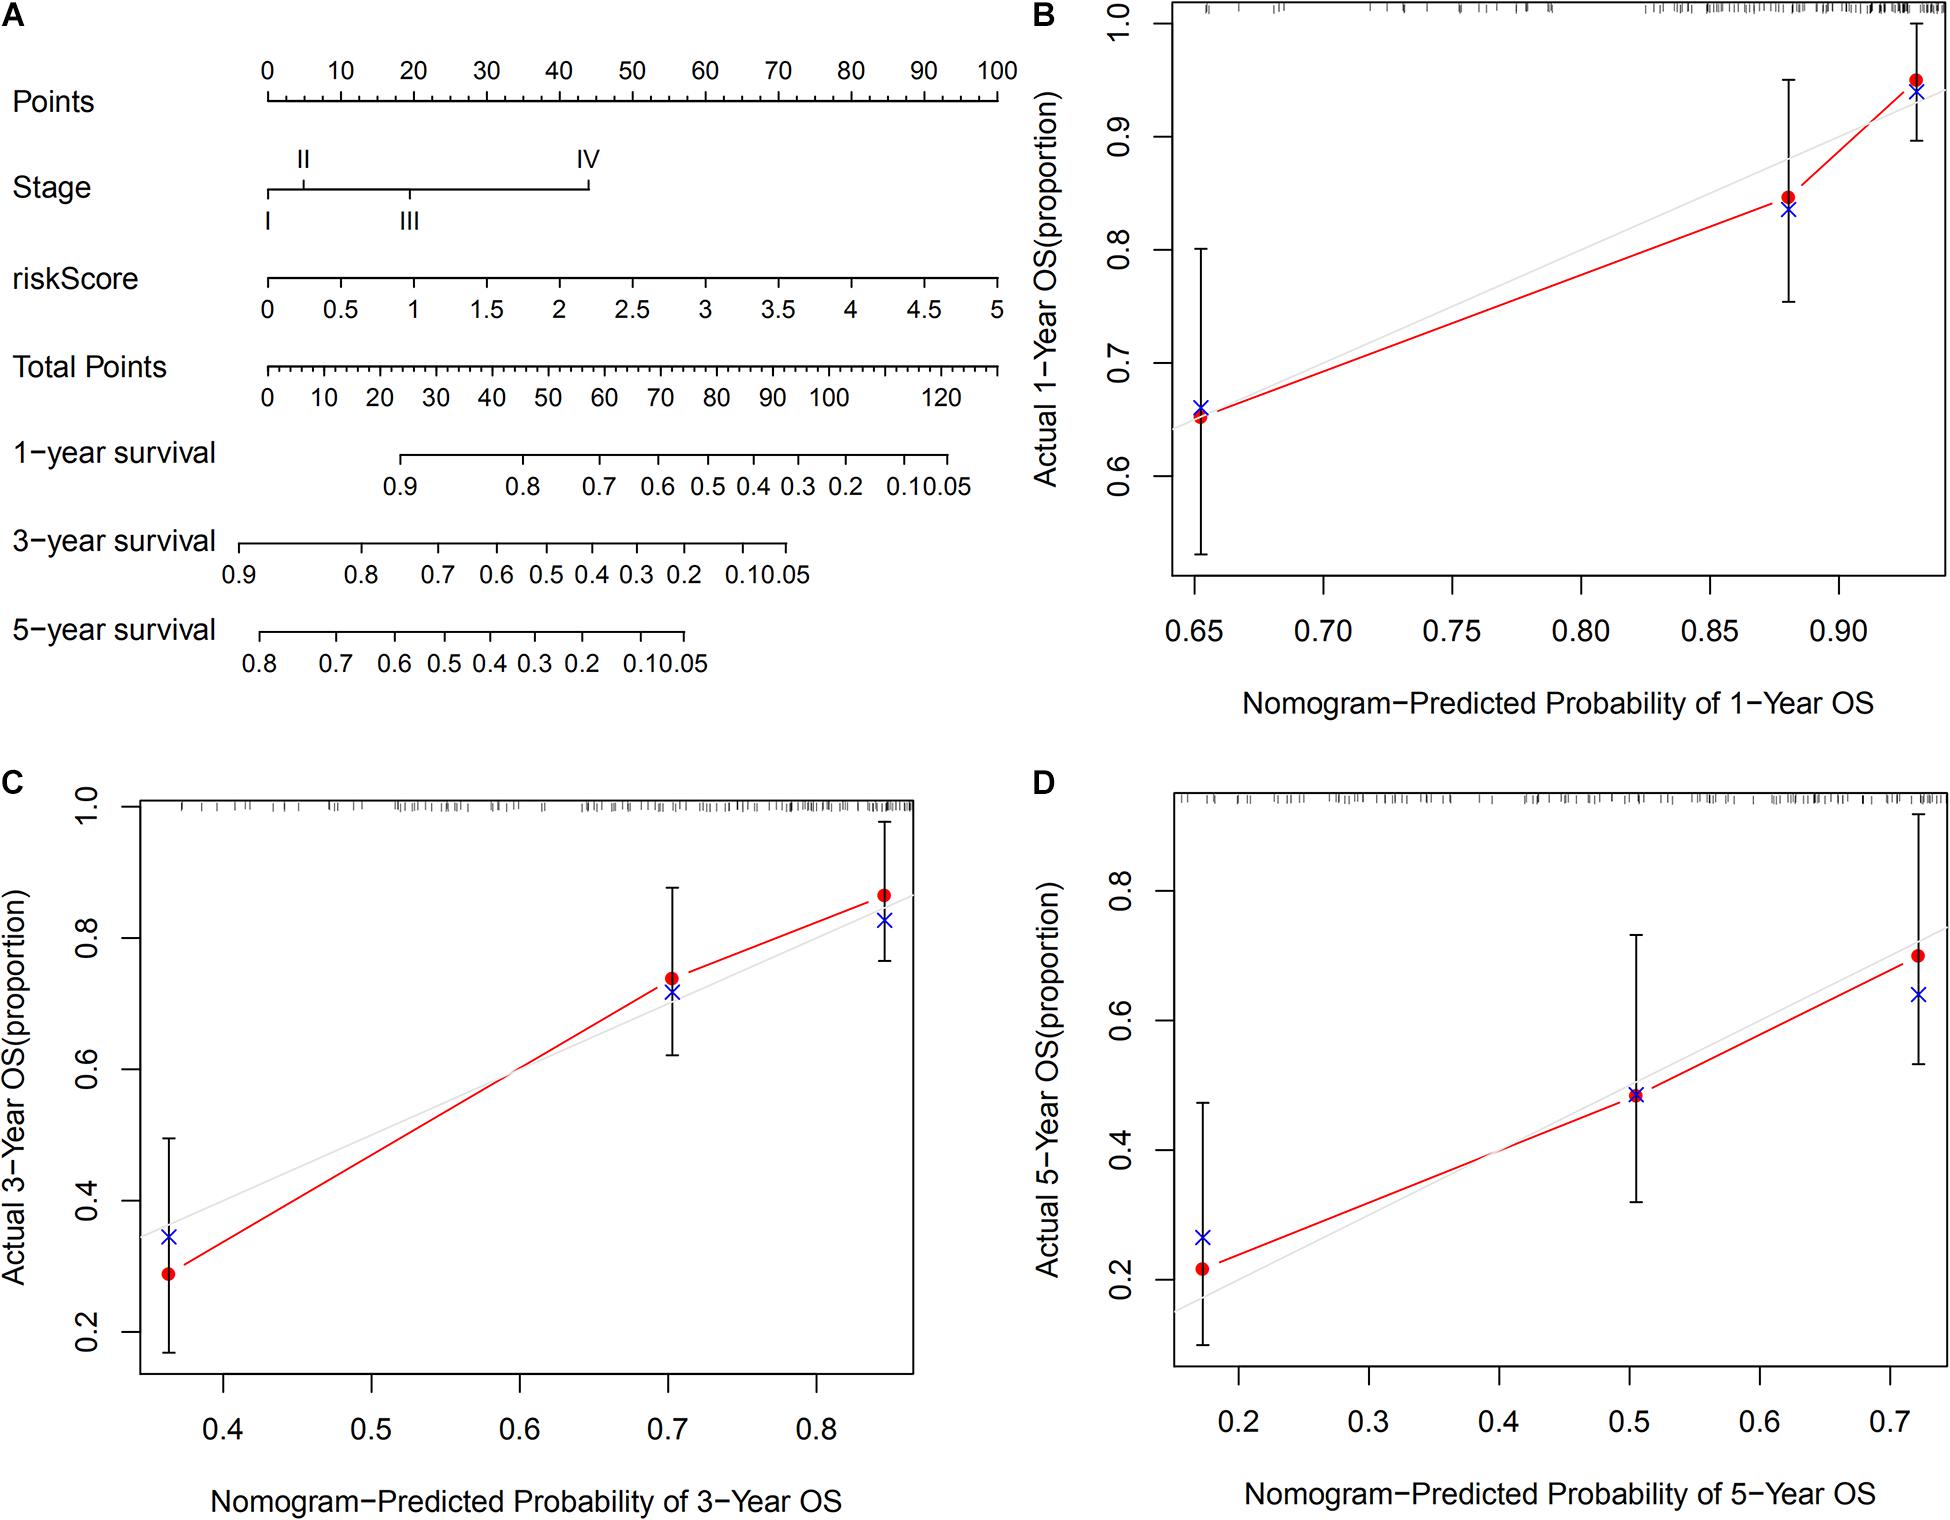
Figure 8. Construction of a nomogram based on risk score and TNM stage in TCGA set. (A) A nomogram consists of risk score and stage to predict the OS of HCC patients at 1-, 3-, and 5-years. (B–D) Calibration curves to validate the prediction value of nomogram at 1-, 3-, and 5-year OS, respectively.
HCC is one of the most prevalent malignancies worldwide. Patients with HCC are suffering high risk for recurrence and metastasis. Over the past decades, the therapeutic effect of surgery for HCC and adjuvant therapy remained unsatisfactory. With studies on autophagy, attention has been shifting to studies on novel biomarkers for tumor autophagy for estimating treatment responses and survival outcomes.
Hence, based on comprehensive bioinformatics analysis, 6 OS-related ARGPs that could potentially serve as effective biomarkers for HCC were identified. The molecular function of these ARGs was primarily related to the immune function and autophagy, indicating that the potential molecular mechanisms underlying the effect of these ARGs on HCC prognosis are related to immune and autophagy. Furthermore, this 6-ARGP prognostic signature could help doctors to classify patients with HCC into 2 subgroups with significantly different OS. The ROC of the prognostic signature indicated moderate predictive accuracy in OS prediction for patients with HCC, and it revealed an adequate discrimination ability of OS in subgroup analysis, indicating that the prognostic signature was applicable for different subgroups of patients with HCC. Multivariate Cox regression analysis revealed that the risk score of the prognostic signature could serve as an independent prognostic factor. Moreover, a nomogram consisting of the TNM stage and risk score was constructed to better predict the OS of HCC patients more clearly, which performed well in OS prediction.
Although, some ARG based signatures have been published, the methods of our study are different. Most of them only choose ARGs to construct a prognostic signature and validated the signature in other data sets. While we performed pairwise comparison analysis to identify ARGPs and then construct a prognostic signature based on ARGPs. Compared with ARGs, ARGPs can reduce the batch effects when validating the prognostic signature in other data sets, such as ICGC, GEO data set, etc. So, the validated results are more reliable and accurate. In addition, we validate the signature both externally and internally, while the published articles only validate the signature externally. We also perform subgroup analysis to further validate the predictive value of the signature for HCC patients in different clinical features and the results show the signature performs well. To guide the therapy of HCC, a drug sensitivity analysis is performed to identify potential small molecular drugs and 6 drugs are identified. So, the results of our study may be more clinically meaningful compared with published articles, and further researches are needed.
The 6-ARGP signature highlighted 11 ARGs, including BAK1, PELP1, BIRC5, CDKN2A, RGS19, CAPN2, ULK3, DIRAS3, TMEM74, PRKCD, and RB1CC1. Most of these ARGs are correlated with the prognosis of HCC or other cancers. BAK1 is an important cell death regulator that can initiate mitochondria-mediated apoptosis and is reportedly correlated with the occurrence of several cancers (Slager et al., 2012; Wang Y. D. et al., 2013; Marcotte et al., 2017). PELP1 serves as a proto-oncogene in all hormone-responsive cancers, including breast, prostate cancers, ovarian, and other cancers (Dimple et al., 2008; Cortez et al., 2012; Yang et al., 2012; Daniel et al., 2015). BIRC5 overexpression was reported in breast cancer, lung adenocarcinoma, and neuroblastic malignance specimens (Hagenbuchner et al., 2016; Hamy et al., 2016; Cao et al., 2019). In a rat model of HCC, combination therapy with a CDKN2A inhibitor and transarterial chemoembilization promoted cancer cell necrosis (Gade et al., 2017). Wang Y. et al. (2013) reported that RGS19 suppressed the occurrence of non-small-cell carcinoma by downregulating Ras. ULK3 is reportedly involved in cancer-associated fibroblast conversion by activating 2 main signaling pathways (Goruppi et al., 2017). Recent studies have revealed that CAPN2 plays a vital role in tumorigenesis and tumor progression in breast cancer, and colon cancer (Storr et al., 2012; Mo et al., 2019). DIRAS3 is downregulated in 60% of ovarian cancers and negatively related to progression-free survival (Yu et al., 2003; Rosen et al., 2004). Sun Y. et al. (2017) reported that TMEM74 promotes tumor cell survival by inducing autophagy by interacting with ATG16L1 and ATG9A. PRKCD is downregulated in HCC cells and PRKCD upregulation can suppress the viability of HCC cells (Nambotin et al., 2011). RB1CC1 also called FIP200, is crucial in autophagy and is associated with the prognosis of and drug resistance in multiple cancers, including HCC (Yeo et al., 2020). Our results show that the aforementioned ARGs are correlated with the prognosis of HCC; However, the underlying molecular mechanism of these ARGs in HCC prognosis requires further investigation.
To explore the mechanisms through which the ARGP signature effectively stratifies patients with HCC, the expression profiles of CTLA4 and LC3 between the high- and low-risk groups was performed. CTLA4 is a receptor on the surface of activated T cells and act as an effective immune therapy checkpoint, whose functions are to inhibit the production of IL-2, proliferation of T cells, and cell cycle (Fraser et al., 1999; Intlekofer and Thompson, 2013; Bhandaru and Rotte, 2019). LC3 is essential for the execution of autophagy. Therefore it is a widely accepted marker for autophagy, which can be a potential target for anticancer therapy (Schaaf et al., 2016). These results show that the low-risk group has a lower expression level of CTLA4 and a higher expression level of LC3. CTLA4 and LC3 dysregulation may be responsible for the difference in survival outcomes between the high- and low-risk groups.
Based on our results, we hypothesize that immunological and autophagy-related small-molecule drugs might be used to treat patients with HCC. Hence, a drug sensitivity analysis was performed to explore potentially effective small-molecule drugs for patients with HCC. 6 drugs were identified, including axitinib, rapamycin, temsirolimus, docetaxel, metformin, and bleomycin. Recent studies have reported that axitinib serves as a multi-receptor tyrosine kinase inhibitor to treat multiple cancers, and axitinib inhibits the VEGF receptor, platelet-derived growth factor receptor, and epidermal growth factor receptor (Ongkeko et al., 2005; Bran et al., 2009; Lawrence et al., 2015). Lin et al. (2020) reported that axitinib is an effective second-line therapy drug for advanced patients with HCC, who failed sorafenib therapy. Rapamycin and temsirolimus belong to Rapalogs, have been reported to suppress proliferation and promote autophagy in HCC cells by targeting the mTOR signaling pathway (Lu et al., 2020). In the work of Hui et al. (2010), rapamycin and temsirolimus can significantly inhibit the growth and metastasis of PLC/PRF/5 human HCC cells. Docetaxel belongs to the taxane family, and preclinical studies have reported the anticancer potential of docetaxel in suppressing HCC cell proliferation. For example, docetaxel treatment can reduce the tumor size in a nude mouse model of HCC, and suppress the proliferation capacity of the HepG2 cell line (Zhu et al., 2016). In addition, Zhang et al. (2019) revealed that docetaxel can induce HCC cell apoptosis by inhibiting the PI3K/AKT signaling pathway. Metformin is used to treat not only diabetes but also tumors. For instance, metformin can inhibit tumor cell proliferation by targeting mTOR complex 1 via an AMPK-independent mechanism (Kalender et al., 2010). DeWaal et al. (2018) reported that metformin can induce cell cycle arrest in HCC cells by targeting mTOR complex 1 through an AMPK-independent mechanism as well. These studies indicate that the AMPK-independent anticancer activities of metformin may be a novel finding Overall, this study and other preclinical studies have revealed that these small- molecule drugs can be potentially effective drugs in treating HCC, and further clinical trials are needed to validate these results.
In this study, we identified an ARGP based prognostic signature that performs well in predicting the OS of patients with HCC. For all we know, this is the first reported ARGP-based signature for HCC. However, our study has several limitations. First, the results were biased to an extent because we used fewer non-tumor specimens than HCC specimens. Second, the underlying molecular mechanisms of HCC in this study have not been determined on the basis of in vitro and in vivo studies. Further studies are needed to validate these results.
An ARGP prognostic signature was identified and validated in different data sets, this signature performed better in OS prediction of HCC in comparison with 3 previously published gene signatures. Furthermore, 6 small-molecule drugs were identified to be potentially effective drugs in treating HCC.
Publicly available datasets were analyzed in this study. This data can be found here: The data that support the findings of this study are openly available in TCGA data portal (https://portal.gdc.cancer.gov/), ICGC data base (https://dcc.icgc.org/), and HADb (http://www.autophagy.lu/).
SQL: conceptualization and manuscript revision. GPZ, ZBS, and YY: data curation. ZBS: data analysis and figure plot. ZBS and GPZ: manuscript writing. All authors final approval of manuscript.
This work was supported by the National Natural Science Foundation of China (82072663).
The authors declare that the research was conducted in the absence of any commercial or financial relationships that could be construed as a potential conflict of interest.
All claims expressed in this article are solely those of the authors and do not necessarily represent those of their affiliated organizations, or those of the publisher, the editors and the reviewers. Any product that may be evaluated in this article, or claim that may be made by its manufacturer, is not guaranteed or endorsed by the publisher.
We would like to thank the TCGA, ICGC, and the Human Autophagy Database for the availability of the data.
The Supplementary Material for this article can be found online at: https://www.frontiersin.org/articles/10.3389/fgene.2021.689801/full#supplementary-material
Supplementary Figure 1 | Risk score analysis of the prognostic signature in different cohorts. (A) Heatmap plot represents the expression of the 6 ARGPs between high- and low-risk groups in the training set, test set, TCGA set, and ICGC set, respectively. (B) Survival status of patients in the train set, test set, TCGA set, and ICGC set, respectively. (C) The rank of the risk score in the training set, test set, TCGA set, and ICGC set, respectively.
Supplementary Figure 2 | Subgroup analysis in the training set and ICGC set. (A,B) The KM curve represents the OS of high- and low-risk groups in different subgroups of the training set. (C) The KM curve represents the OS of high- and low-risk groups in different subgroups of the ICGC set.
Supplementary Figure 3 | Subgroup analysis in the test set and TCGA set. (A,B) The KM curve represents the OS of high- and low-risk groups in different subgroups of the test set. (C,D) The KM curve represents the OS of high- and low-risk groups in different subgroups of the TCGA set.
Supplementary Figure 4 | Clinical relevance analysis of risk score. (A–D) The relationship of stage group with risk score in the training set, test set, TCGA set, and ICGC set, respectively. (E–G) The relationship of grade group with risk score in the training set, test set, and TCGA set, respectively.
Aalen, O. O. (1988). Heterogeneity in survival analysis. Stat. Med. 7, 1121–1137. doi: 10.1002/sim.4780071105
Bandyopadhyay, S., and Mallick, K. (2014). A new path based hybrid measure for gene ontology similarity. IEEE/ACM Trans. Comput. Biol. Bioinform. 11, 116–127. doi: 10.1109/tcbb.2013.149
Bhandaru, M., and Rotte, A. (2019). Monoclonal antibodies for the treatment of melanoma: present and future strategies. Methods Mol. Biol. 1904, 83–108. doi: 10.1007/978-1-4939-8958-4_4
Bran, B., Bran, G., Hörmann, K., and Riedel, F. (2009). The platelet-derived growth factor receptor as a target for vascular endothelial growth factor-mediated anti-angiogenetic therapy in head and neck cancer. Int. J. Oncol. 34, 255–261.
Bray, F., Ferlay, J., Soerjomataram, I., Siegel, R. L., Torre, L. A., and Jemal, A. (2018). Global cancer statistics 2018: GLOBOCAN estimates of incidence and mortality worldwide for 36 cancers in 185 countries. CA Cancer J. Clin. 68, 394–424. doi: 10.3322/caac.21492
Cao, Y., Zhu, W., Chen, W., Wu, J., Hou, G., and Li, Y. (2019). Prognostic value of BIRC5 in lung adenocarcinoma lacking EGFR, KRAS, and ALK mutations by integrated bioinformatics analysis. Dis. Markers 2019:5451290. doi: 10.1155/2019/5451290
Cortez, V., Mann, M., Tekmal, S., Suzuki, T., Miyata, N., Rodriguez-Aguayo, C., et al. (2012). Targeting the PELP1-KDM1 axis as a potential therapeutic strategy for breast cancer. Breast Cancer Res. 14:R108. doi: 10.1186/bcr3229
Daniel, A. R., Gaviglio, A. L., Knutson, T. P., Ostrander, J. H., D’Assoro, A. B., Ravindranathan, P., et al. (2015). Progesterone receptor-B enhances estrogen responsiveness of breast cancer cells via scaffolding PELP1- and estrogen receptor-containing transcription complexes. Oncogene 34, 506–515. doi: 10.1038/onc.2013.579
DeWaal, D., Nogueira, V., Terry, A. R., Patra, K. C., Jeon, S. M., Guzman, G., et al. (2018). Hexokinase-2 depletion inhibits glycolysis and induces oxidative phosphorylation in hepatocellular carcinoma and sensitizes to metformin. Nat. Commun. 9:446. doi: 10.1038/s41467-017-02733-4
Dimple, C., Nair, S. S., Rajhans, R., Pitcheswara, P. R., Liu, J., Balasenthil, S., et al. (2008). Role of PELP1/MNAR signaling in ovarian tumorigenesis. Cancer Res. 68, 4902–4909. doi: 10.1158/0008-5472.can-07-5698
Fan, Q., Yang, L., Zhang, X., Ma, Y., Li, Y., Dong, L., et al. (2018). Autophagy promotes metastasis and glycolysis by upregulating MCT1 expression and Wnt/β-catenin signaling pathway activation in hepatocellular carcinoma cells. J. Exp. Clin. Cancer Res. 37:9. doi: 10.1186/s13046-018-0673-y
Fang, Q., and Chen, H. (2020). Development of a Novel Autophagy-Related Prognostic Signature and Nomogram for Hepatocellular Carcinoma. Front Oncol 10:591356. doi: 10.3389/fonc.2020.591356
Finn, R. S., Zhu, A. X., Farah, W., Almasri, J., Zaiem, F., Prokop, L. J., et al. (2018). Therapies for advanced stage hepatocellular carcinoma with macrovascular invasion or metastatic disease: a systematic review and meta-analysis. Hepatology 67, 422–435. doi: 10.1002/hep.29486
Fraser, J. H., Rincón, M., McCoy, K. D., and Le Gros, G. (1999). CTLA4 ligation attenuates AP-1, NFAT and NF-kappaB activity in activated T cells. Eur. J. Immunol. 29, 838–844.
Gade, T. P. F., Tucker, E., Nakazawa, M. S., Hunt, S. J., Wong, W., Krock, B., et al. (2017). Ischemia induces quiescence and autophagy dependence in hepatocellular carcinoma. Radiology 283, 702–710. doi: 10.1148/radiol.2017160728
Goruppi, S., Procopio, M. G., Jo, S., Clocchiatti, A., Neel, V., and Dotto, G. P. (2017). The ULK3 kinase is critical for convergent control of cancer-associated fibroblast activation by CSL and GLI. Cell Rep. 20, 2468–2479. doi: 10.1016/j.celrep.2017.08.048
Hagenbuchner, J., Kiechl-Kohlendorfer, U., Obexer, P., and Ausserlechner, M. J. (2016). BIRC5/Survivin as a target for glycolysis inhibition in high-stage neuroblastoma. Oncogene 35, 2052–2061. doi: 10.1038/onc.2015.264
Hamy, A. S., Bieche, I., Lehmann-Che, J., Scott, V., Bertheau, P., Guinebretière, J. M., et al. (2016). BIRC5 (survivin): a pejorative prognostic marker in stage II/III breast cancer with no response to neoadjuvant chemotherapy. Breast Cancer Res. Treat. 159, 499–511. doi: 10.1007/s10549-016-3961-2
Heinäniemi, M., Nykter, M., Kramer, R., Wienecke-Baldacchino, A., Sinkkonen, L., Zhou, J. X., et al. (2013). Gene-pair expression signatures reveal lineage control. Nat. Methods 10, 577–583. doi: 10.1038/nmeth.2445
Huang, F., Wang, B. R., and Wang, Y. G. (2018). Role of autophagy in tumorigenesis, metastasis, targeted therapy and drug resistance of hepatocellular carcinoma. World J. Gastroenterol. 24, 4643–4651. doi: 10.3748/wjg.v24.i41.4643
Hui, I. C., Tung, E. K., Sze, K. M., Ching, Y. P., and Ng, I. O. (2010). Rapamycin and CCI-779 inhibit the mammalian target of rapamycin signalling in hepatocellular carcinoma. Liver Int. 30, 65–75. doi: 10.1111/j.1478-3231.2009.02117.x
Intlekofer, A. M., and Thompson, C. B. (2013). At the bench: preclinical rationale for CTLA-4 and PD-1 blockade as cancer immunotherapy. J. Leukoc. Biol. 94, 25–39. doi: 10.1189/jlb.1212621
Jiang, P., Gu, S., Pan, D., Fu, J., Sahu, A., Hu, X., et al. (2018). Signatures of T cell dysfunction and exclusion predict cancer immunotherapy response. Nat. Med. 24, 1550–1558. doi: 10.1038/s41591-018-0136-1
Kalender, A., Selvaraj, A., Kim, S. Y., Gulati, P., Brûlé, S., Viollet, B., et al. (2010). Metformin, independent of AMPK, inhibits mTORC1 in a rag GTPase-dependent manner. Cell Metab. 11, 390–401. doi: 10.1016/j.cmet.2010.03.014
Lawrence, M. S., Sougnez, C., Lichtenstein, L., Cibulskis, K., Lander, E., Gabriel, S. B., et al. (2015). Comprehensive genomic characterization of head and neck squamous cell carcinomas. Nature 517, 576–582. doi: 10.1038/nature14129
Lin, Z. Z., Chen, B. B., Hung, Y. P., Huang, P. H., Shen, Y. C., Shao, Y. Y., et al. (2020). A multicenter phase II study of second-line axitinib for patients with advanced hepatocellular carcinoma failing first-line sorafenib monotherapy. Oncologist 25, e1280–e1285. doi: 10.1634/theoncologist.2020-0143
Liu, J., Lichtenberg, T., Hoadley, K. A., Poisson, L. M., Lazar, A. J., Cherniack, A. D., et al. (2018). An integrated TCGA pan-cancer clinical data resource to drive high-quality survival outcome analytics. Cell 173, 400–416.e411. doi: 10.1016/j.cell.2018.02.052
Liu, K., Lee, J., and Ou, J. J. (2018). Autophagy and mitophagy in hepatocarcinogenesis. Mol. Cell Oncol. 5:e1405142. doi: 10.1080/23723556.2017.1405142
Lu, X., Paliogiannis, P., Calvisi, D. F., and Chen, X. (2020). Role of the mammalian target of rapamycin pathway in liver cancer: from molecular genetics to targeted therapies. Hepatology 73 Suppl 1(Suppl 1), 49–61. doi: 10.1002/hep.31310
Marcotte, E. L., Pankratz, N., Amatruda, J. F., Frazier, A. L., Krailo, M., Davies, S., et al. (2017). Variants in BAK1, SPRY4, and GAB2 are associated with pediatric germ cell tumors: a report from the children’s oncology group. Genes Chromosomes. Cancer 56, 548–558. doi: 10.1002/gcc.22457
Mo, S., Dai, W., Xiang, W., Li, Y., Feng, Y., Zhang, L., et al. (2019). Prognostic and predictive value of an autophagy-related signature for early relapse in stages I-III colon cancer. Carcinogenesis 40, 861–870. doi: 10.1093/carcin/bgz031
Nambotin, S. B., Lefrancois, L., Sainsily, X., Berthillon, P., Kim, M., Wands, J. R., et al. (2011). Pharmacological inhibition of Frizzled-7 displays anti-tumor properties in hepatocellular carcinoma. J. Hepatol. 54, 288–299. doi: 10.1016/j.jhep.2010.06.033
Ongkeko, W. M., Altuna, X., Weisman, R. A., and Wang-Rodriguez, J. (2005). Expression of protein tyrosine kinases in head and neck squamous cell carcinomas. Am. J. Clin. Pathol. 124, 71–76. doi: 10.1309/btln5wtmj3pcnrrc
Raza, A., and Sood, G. K. (2014). Hepatocellular carcinoma review: current treatment, and evidence-based medicine. World J. Gastroenterol. 20, 4115–4127. doi: 10.3748/wjg.v20.i15.4115
Rosen, D. G., Wang, L., Jain, A. N., Lu, K. H., Luo, R. Z., Yu, Y., et al. (2004). Expression of the tumor suppressor gene ARHI in epithelial ovarian cancer is associated with increased expression of p21WAF1/CIP1 and prolonged progression-free survival. Clin. Cancer Res. 10, 6559–6566. doi: 10.1158/1078-0432.ccr-04-0698
Schaaf, M. B., Keulers, T. G., Vooijs, M. A., and Rouschop, K. M. (2016). LC3/GABARAP family proteins: autophagy-(un)related functions. FASEB J. 30, 3961–3978. doi: 10.1096/fj.201600698R
Slager, S. L., Skibola, C. F., Di Bernardo, M. C., Conde, L., Broderick, P., McDonnell, S. K., et al. (2012). Common variation at 6p21.31 (BAK1) influences the risk of chronic lymphocytic leukemia. Blood 120, 843–846. doi: 10.1182/blood-2012-03-413591
Storr, S. J., Lee, K. W., Woolston, C. M., Safuan, S., Green, A. R., Macmillan, R. D., et al. (2012). Calpain system protein expression in basal-like and triple-negative invasive breast cancer. Ann. Oncol. 23, 2289–2296. doi: 10.1093/annonc/mds176
Sun, T., Liu, H., and Ming, L. (2017). Multiple roles of autophagy in the sorafenib resistance of hepatocellular carcinoma. Cell Physiol. Biochem. 44, 716–727. doi: 10.1159/000485285
Sun, Y., Chen, Y., Zhang, J., Cao, L., He, M., Liu, X., et al. (2017). TMEM74 promotes tumor cell survival by inducing autophagy via interactions with ATG16L1 and ATG9A. Cell Death Dis. 8:e3031. doi: 10.1038/cddis.2017.370
Wang, N., Lefaudeux, D., Mazumder, A., Li, J. J., and Hoffmann, A. (2021). Identifying the combinatorial control of signal-dependent transcription factors. PLoS Comput. Biol. 17:e1009095. doi: 10.1371/journal.pcbi.1009095
Wang, Y., Tong, Y., Tso, P. H., and Wong, Y. H. (2013). Regulator of G protein signaling 19 suppresses Ras-induced neoplastic transformation and tumorigenesis. Cancer Lett. 339, 33–41. doi: 10.1016/j.canlet.2013.07.025
Wang, Y. D., Cai, N., Wu, X. L., Cao, H. Z., Xie, L. L., and Zheng, P. S. (2013). OCT4 promotes tumorigenesis and inhibits apoptosis of cervical cancer cells by miR-125b/BAK1 pathway. Cell Death Dis. 4:e760. doi: 10.1038/cddis.2013.272
Xie, H., Liu, S., Zhang, Z., Chen, P., and Tao, Y. (2020). A novel seven-gene signature as prognostic biomarker in hepatocellular carcinoma. J. Cancer 11, 5768–5781. doi: 10.7150/jca.44573
Xu, D., Wang, Y., Zhou, K., Wu, J., Zhang, Z., Zhang, J., et al. (2020). Development and validation of a novel 8 immune gene prognostic signature based on the immune expression profile for hepatocellular carcinoma. Oncol. Targets Ther. 13, 8125–8140. doi: 10.2147/ott.s263047
Yang, L., Ravindranathan, P., Ramanan, M., Kapur, P., Hammes, S. R., Hsieh, J. T., et al. (2012). Central role for PELP1 in nonandrogenic activation of the androgen receptor in prostate cancer. Mol. Endocrinol. 26, 550–561. doi: 10.1210/me.2011-1101
Yeo, S. K., Wang, C., and Guan, J. L. (2020). Role of FIP200 in inflammatory processes beyond its canonical autophagy function. Biochem. Soc. Trans. 48, 1599–1607. doi: 10.1042/bst20191156
Yu, Y., Fujii, S., Yuan, J., Luo, R. Z., Wang, L., Bao, J., et al. (2003). Epigenetic regulation of ARHI in breast and ovarian cancer cells. Ann. N. Y. Acad. Sci. 983, 268–277. doi: 10.1111/j.1749-6632.2003.tb05981.x
Zhang, X., Shao, J., Li, X., Cui, L., and Tan, Z. (2019). Docetaxel promotes cell apoptosis and decreases SOX2 expression in CD133-expressing hepatocellular carcinoma stem cells by suppressing the PI3K/AKT signaling pathway. Oncol. Rep. 41, 1067–1074. doi: 10.3892/or.2018.6891
Keywords: autophagy-related gene pair signature, small-molecule drugs, hepatocellular carcinoma, bioinformatic analysis, autophagy
Citation: Song ZB, Zhang GP, Yu Y and Li SQ (2021) A Prognostic Autophagy-Related Gene Pair Signature and Small-Molecule Drugs for Hepatocellular Carcinoma. Front. Genet. 12:689801. doi: 10.3389/fgene.2021.689801
Received: 01 April 2021; Accepted: 28 July 2021;
Published: 23 August 2021.
Edited by:
Jing Zhao, Chongqing Medical University, ChinaReviewed by:
Ning Wang, Arcus Biosciences, United StatesCopyright © 2021 Song, Zhang, Yu and Li. This is an open-access article distributed under the terms of the Creative Commons Attribution License (CC BY). The use, distribution or reproduction in other forums is permitted, provided the original author(s) and the copyright owner(s) are credited and that the original publication in this journal is cited, in accordance with accepted academic practice. No use, distribution or reproduction is permitted which does not comply with these terms.
*Correspondence: ShaoQiang Li, bGlzaGFvcUBtYWlsLnN5c3UuZWR1LmNu
Disclaimer: All claims expressed in this article are solely those of the authors and do not necessarily represent those of their affiliated organizations, or those of the publisher, the editors and the reviewers. Any product that may be evaluated in this article or claim that may be made by its manufacturer is not guaranteed or endorsed by the publisher.
Research integrity at Frontiers
Learn more about the work of our research integrity team to safeguard the quality of each article we publish.