 Huiqin Bian1†Ting Zhu2†Yuting Liang3Ruoxuan Hei1Xiaojing Zhang1Xiaochen Li1
 Jinnan Chen1Yaojuan Lu1,4Junxia Gu1
 Longwei Qiao5*Qiping Zheng1,4*
- 1Department of Hematology and Hematological Laboratory Science, Jiangsu Key Laboratory of Medical Science and Laboratory Medicine, School of Medicine, Jiangsu University, Zhenjiang, China
- 2Laboratory of Clinical Medicine, Huai'an Women & Children Hospital, Affiliated to Yangzhou University, Huai'an, China
- 3Center of Clinical Laboratory, The First Affiliated Hospital of Soochow University, Suzhou, China
- 4Shenzhen Academy of Peptide Targeting Technology at Pingshan and Shenzhen Tyercan Bio-Pharm Co., Ltd., Shenzhen, China
- 5Suzhou Affiliated to State Key Laboratory of Reproductive Medicine, School of Gusu, The Affiliated Suzhou Hospital of Nanjing Medical University, Nanjing Medical University, Suzhou, China
Hypertrophic chondrocytes and their specific marker, the type X collagen gene (Col10a1), are critical components of endochondral bone formation during skeletal development. We previously found that Runx2 is an indispensable mouse Col10a1 gene regulator and identified many other transcription factors (TFs) that potentially interact with the 150-bp Col10a1 cis-enhancer. However, the roles of these candidate TFs in Col10a1 expression and chondrocyte hypertrophy have not been elucidated. Here, we focus on 32 candidate TFs recently identified by analyzing the 150-bp Col10a1 enhancer using the transcription factor affinity prediction (TRAP) program. We found that 12 TFs (Hoxa3, Lsx, Evx2, Dlx5, S8, Pax2, Egr2, Mef2a, Barhl2, GKlf, Sox17, and Crx) were significantly upregulated and four TFs (Lhx4, Tbx5, Mef2c, and Hb9) were significantly downregulated in hypertrophic MCT cells, which show upregulation of Col10a1 expression. Most of the differential expression pattern of these TFs conformed with the results obtained from ATDC5 cell model and primary mouse chondrocytes. Notably, Tbx5 was downregulated upon Col10a1 upregulation, overexpression of Tbx5 decreased Col10a1 expression, and knock-down of Tbx5 increased Col10a1 expression in hypertrophic chondrocytes, suggesting that Tbx5 is a negative regulator of Col10a1. We further generated a stable Tbx5-overexpressing ATDC5 cell line and ColX-Tbx5 transgenic mice driven by Col10a1-specific enhancers and promoters. Tbx5 overexpression decreased Col10a1 expression in ATDC5 cells cultured as early as day 7 and in limb tissue on post-natal day 1. Slightly weaker alkaline phosphatase staining was also observed in cell culture on day 7 and in limb digits on embryonic day 17.5, indicating mildly delayed ossification. Further characterization of these candidate Col10a1 transcriptional regulators could help identify novel therapeutic targets for skeletal diseases associated with abnormal chondrocyte hypertrophy.
Introduction
Endochondral ossification is a major developmental pathway for most of the appendicular skeleton (i.e., long bones) and some of the axial skeleton (i.e., flat bones). Hypertrophic chondrocytes and their specific marker, the type X collagen gene (Col10a1), are two critical components of the endochondral pathway during long bone development (Mackie et al., 2008; Debiais-Thibaud et al., 2019). Although present at a late stage of chondrocyte differentiation, hypertrophic chondrocytes are implicated as the principal engine of bone growth, largely due to their association with blood vessel invasion and calcified matrix deposition, which are critical for endochondral ossification (Linsenmayer et al., 1991). Type X collagen also facilitates endochondral ossification by affecting hematopoiesis and promoting matrix mineralization (Shen, 2005; Grskovic et al., 2012). Mutant or abnormal human COL10A1 expression are often accompanied by abnormal chondrocyte hypertrophy, as seen in children and young adults with multiple skeletal dysplasia (Warman et al., 1993; Ikegawa et al., 1998; Bateman et al., 2005; Lu et al., 2014; Ain et al., 2018). Abnormal COL10A1 expression and chondrocyte hypertrophy are also observed in elderly individuals with osteoarthritis (OA), who show osteophyte formation involving a process mimicking the endochondral pathway (von der Mark et al., 1995; Girkontaite et al., 1996; Drissi et al., 2005; Lamas et al., 2010; Saito et al., 2010; Armiento et al., 2019; Gratal et al., 2019; He et al., 2019). Recent studies show that intact trimeric noncolla-genous 1 domain of type X collagen is a degradation by-product of endochondral ossification released into the circulation in proportion to the overall growth plate. Thus, its detection may be useful for monitoring growth in the pediatric population, fracture healing, scoliosis, arthritis, and cancer (Coghlan et al., 2017). Together, these findings indicate the existence of close relationships among Col10a1 expression, chondrocyte hypertrophy, and endochondral ossification. Therefore, regulators of hypertrophic chondrocyte-specific Col10a1 expression may play essential roles in chondrocyte hypertrophy.
Multiple transcription factors (TFs) and signaling pathways regulate hypertrophic chondrocyte-specific Col10a1 expression in vitro and in vivo (Lu et al., 2014). Of these, Runx2 is essential for osteoblast differentiation and chondrocyte hypertrophy (Komori et al., 1997; Lee et al., 1997; Otto et al., 1997; Komori, 2018; Liao et al., 2019; Qin et al., 2020) and is a major transcriptional determinant for Col10a1 expression across species (Drissi et al., 2003; Simoes et al., 2006; Higashikawa et al., 2009). In our work on mouse Col10a1 regulation, we found that Runx2 directly interacts with the Col10a1 proximal promoter and 150-bp enhancer and is an indispensable Col10a1 regulator (Zheng et al., 2003, 2009; Li et al., 2011). However, we also found that additional TFs and/or co-factors are required for cell-specific Col10a1/reporter expression in vivo (Li et al., 2011). Most recently, using combined bioinformatics and proteomic approaches, we identified many TFs that may interact with the 150-bp Col10a1 cis-enhancer (Gu et al., 2014). Of these, more than 50 candidate TFs were identified by the transcription factor affinity prediction (TRAP) program (Kel et al., 2003; Thomas-Chollier et al., 2011; Gu et al., 2014). However, how these candidate TFs regulate cell-specific Col10a1 expression and affect chondrocyte hypertrophy remain largely unknown.
Here, we systematically examined the expression levels of candidate TFs in in vitro and ex vivo chondrogenic cell models showing increased Col10a1 expression upon hypertrophy. From these candidate TFs, we identified many potential Col10a1 transactivators and repressors that promote or inhibit chondrocyte hypertrophy and are associated with skeletal diseases. We specifically investigated the role of Tbx5, a potential candidate Col10a1 repressor, during endochondral ossification using two mouse chondrogenic cell models: the MCT and ATDC5 cell lines. In addition, we generated ColX-Tbx5 transgenic mice with specific expression of exogenous Tbx5 gene in hypertrophic chondrocytes to study the effect of Tbx5 on Col10a1 expression and endochondral ossification in vivo. Our findings suggest that these candidate Col10a1 transcriptional regulators, including Tbx5, are potential therapeutic targets in collagenopathy and skeletal diseases associated with abnormal Col10a1 expression and chondrocyte hypertrophy.
Results
Candidate TF Binding Sites Within the Col10a1 Cis-Enhancer
We recently reported the in silico sequence analysis of the 150-bp Col10a1 cis-enhancer to search for TF binding sites (TFBSs) using multiple web-based programs (Gu et al., 2014). Here, we provide detailed information on these candidate TFs identified by the TRAP program (Kel et al., 2003; Thomas-Chollier et al., 2011; Gu et al., 2014). We identified 48 potential binding sites for candidate TFs that showed a p-value < 0.05, and were ranked from lowest to highest p-value based on their binding affinity (Supplementary Figure 1). The search criteria were set for mouse promoters (background model) in the transfac_2010.1 vertebrate (matrix file) database. These predicted 48 TFBSs represented ~40 candidate TFs, including multiple MEF2 and Tbx5 sites (Supplementary Figure 1) with slight sequence differences. These candidate TFs included homeobox-containing genes (Hoxa3, Hoxa4, Hoxa13, Lhx4, Lhx8, Lhx61), a zinc finger gene (Gklf), mouse embryonic fibroblast markers, paired box (Pax) family members (Pax2, Pax7), and Tbx5. Both 5′- and 3′-primer ends of the enhancer showed multiple TFBSs, although more potential TFBSs were found at the 3′-end, which is the location of the previously described putative Runx2 binding site (Figure 1A) (Gu et al., 2014). Specifically, Tbx5, CACD, Gklf, EGR2, and Gli bind to a sequence that is the same or similar to the previously described Runx2 binding site (Li et al., 2011). Hox3a, Brahl1, Brahl2, Lhx8, Isx, Lhx4, Lhx61, Evs2, Pou6f1, Gbx1, Pax7, Dlx5, S8, Brax2, Hb9, and Hoxa4 bind to a sequence adjacent to the Runx2 site (Figures 1B–E, data not shown). Six putative TFs (Og2, CACD, Tbx5, Tst-1, Rsrfc4, and Foxj2) were predicted to bind to the cis-enhancer using the MATCH program by searching the TRANSFAC database when the score was increased to 90. Intriguingly, all putative TFs were identified by both the TRAP and MATCH programs.
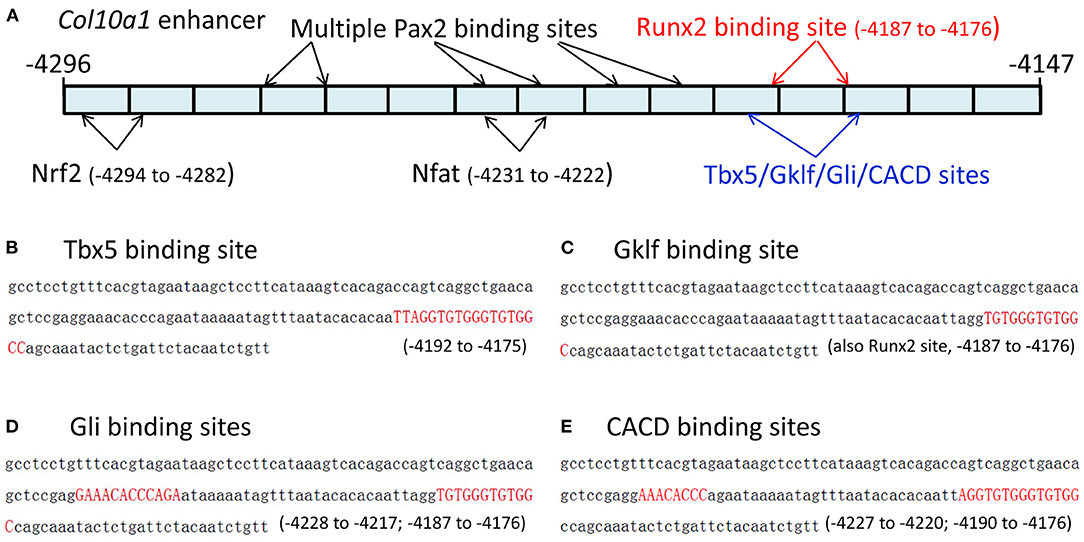
Figure 1. The 150-bp Col10a1 cis-enhancer and its binding sites for selected candidate TFs. (A) Schematic illustration of the cis-enhancer derived from the Col10a1 distal promoter region (−4,296 to −4,147 bp). Positions of putative binding sites for Pax2, Nrf2, Nfat, Tbx5, Gklf, Gli, CACD, and Runx2 are shown. (B–E) Sequences of predicted binding sites for Tbx5, Gklf, Gli, and CACD are highlighted in red. These TFBSs are the same as or overlap with the previously described Runx2 binding site TGTGGGTGTGGC (−4,187 to −4,176 bp) (Li et al., 2011).
Col10a1 and Candidate TF Gene Expression in Chondrogenic Cell Models
Next, we examined Col10a1 expression in MCT and ATDC5 cells as well as primary chondrocytes derived from mouse limbs and rib growth plates. MCT cells are mouse chondrocytes that show upregulated Col10a1 expression when cultured under 37°C (i.e., hypertrophic) but not 32°C (i.e., proliferative) conditions (Gu et al., 2014). As expected, after culture for 1, 2, or 3 days at 37°C, Col10a1 mRNA levels were upregulated by 11.6-fold (p = 0.0002), 23.1-fold (p = 0.0006), and 22.2-fold (p = 0.0006), respectively (Figure 2A). In addition, ATDC5 cells are an established model of endochondral ossification that show significant upregulation of Col10a1 after culture for long periods of time (i.e., 14 days) and/or insulin, transferrin, and sodium selenite (ITS) induction (Shukunami et al., 1997; Gu et al., 2013). Indeed, compared with cells on day 0 without ITS induction, Col10a1 expression was 13.3-fold higher (p = 0.0004) in hypertrophic ATDC5 cells maintained in ITS medium for 14 days (Figure 2B). Moreover, Col10a1 was abundantly expressed in hypertrophic primary chondrocytes but was barely detectable in proliferative primary chondrocytes micro-dissected from corresponding zones of growth plates (Figure 2C). Together, these results demonstrate the marked upregulation of Col10a1 in hypertrophic MCT cells, ATDC5 cells, and primary chondrocytes compared with their corresponding proliferative chondrocytes.
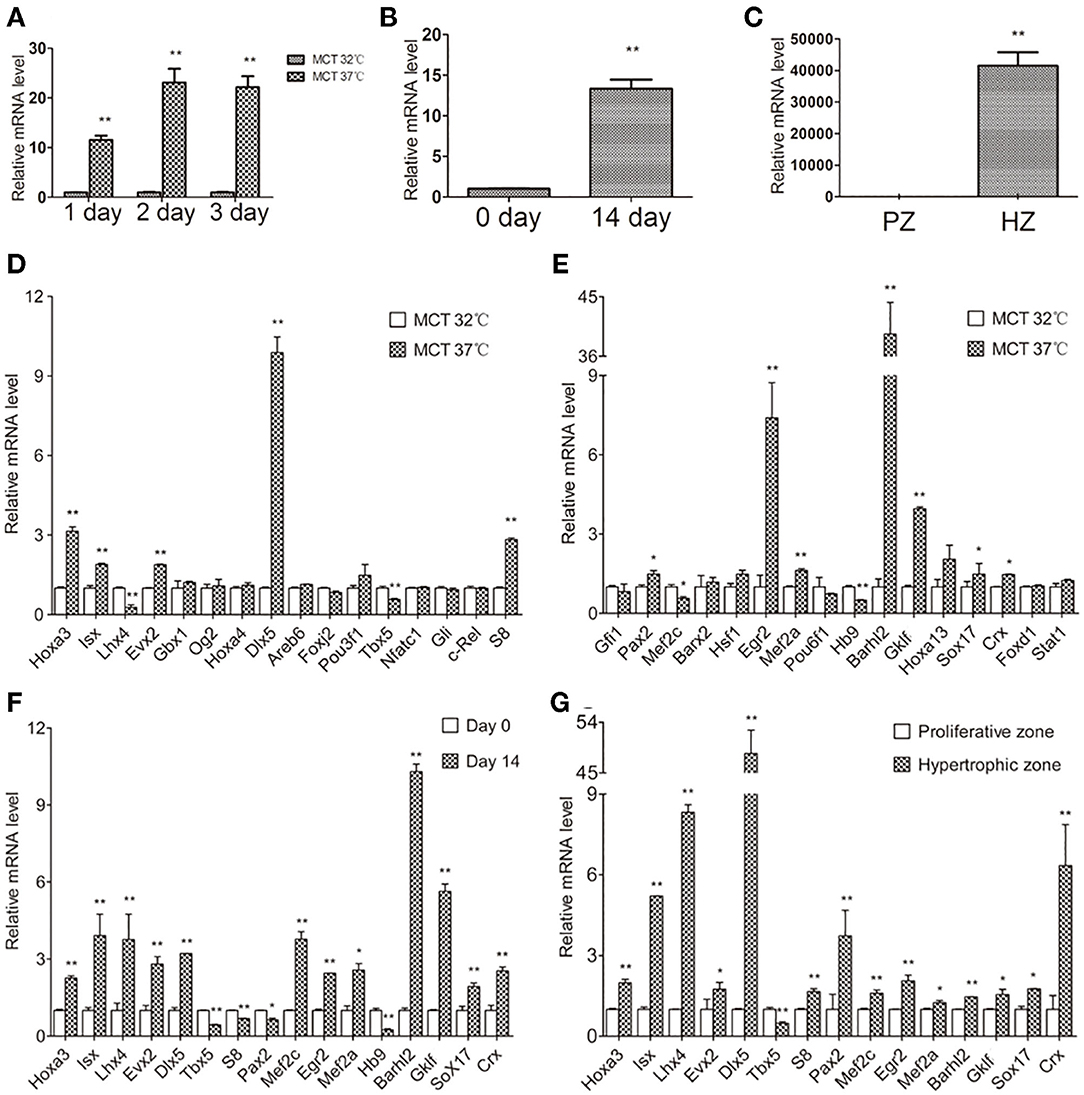
Figure 2. Relative Col10a1 and candidate TFs mRNA levels in hypertrophic vs. proliferative chondrocytes. (A) Col10a1 mRNA levels were upregulated in hypertrophic compared with proliferative MCT cells at 1, 2, and 3 days. (B) Col10a1 mRNA level in ATDC5 cells was upregulated on day 14 compared with day 0. (C) Col10a1 mRNA was barely detectable in proliferative primary chondrocytes but was abundantly expressed in hypertrophic primary chondrocytes. (D,E) Hoxa3, lsx, Evx2, Dlx5, S8, Pax2, Egr2, Mef2a, Barhl2, GKlf, Sox17, and Crx were upregulated and Lhx4, Tbx5, Mef2c, and Hb9 were downregulated in hypertrophic MCT cells. (F) Hoxa3, lsx, Lhx4, Evx2, Dlx5, Egr2, Mef2a, Mef2c, Barhl2, GKlf, Sox17, and Crx were upregulated and S8, Pax2, Tbx5, and Hb9 were downregulated in hypertrophic ATDC5 cells. (G) Except for Tbx5, all other genes examined were significantly upregulated in hypertrophic primary chondrocytes. *p < 0.05, **p < 0.01.
To determine their correlation with Col10a1 expression, we systematically examined mRNA levels for all candidate TFs identified by the TRAP program (Supplementary Figure 1) in proliferative and hypertrophic MCT cells on day 3 (Figure 2A). We found that 12 candidate genes (Hoxa3, lsx, Evx2, Dlx5, S8, Pax2, Egr2, Mef2a, Barhl2, GKlf, Sox17, and Crx) were significantly upregulated and four candidate genes (Lhx4, Tbx5, Mef2c, and Hb9) were significantly downregulated in hypertrophic MCT cells (Figures 2D,E). To confirm the differential expression of candidate TFs in proliferative vs. hypertrophic cells, we examined their mRNA expression in ATDC5 cells with or without hypertrophic induction (primers see Table 1). Despite some discrepancies, most candidate genes were up- or downregulated in similar directions as those in MCT cells (Figure 2F, Table 2). We also performed expression analysis of differentially expressed candidate genes in proliferative vs. hypertrophic primary chondrocytes. Again, despite some discrepancies, the results were similar to those obtained in MCT and ATDC5 cells (Figure 2G, Table 2). Across all three hypertrophic cell models, Hoxa3, lsx, Evx2, Dlx5, Egr2, Mef2a, Barhl2, GKlf, Sox17, and Crx were significantly upregulated, whereas Tbx5 and Hb9 were significantly downregulated or undetectable. Thus, the differential expression of these candidate genes upon Col10a1 upregulation in hypertrophic cell models suggests their distinct roles in regulating Col10a1 expression.
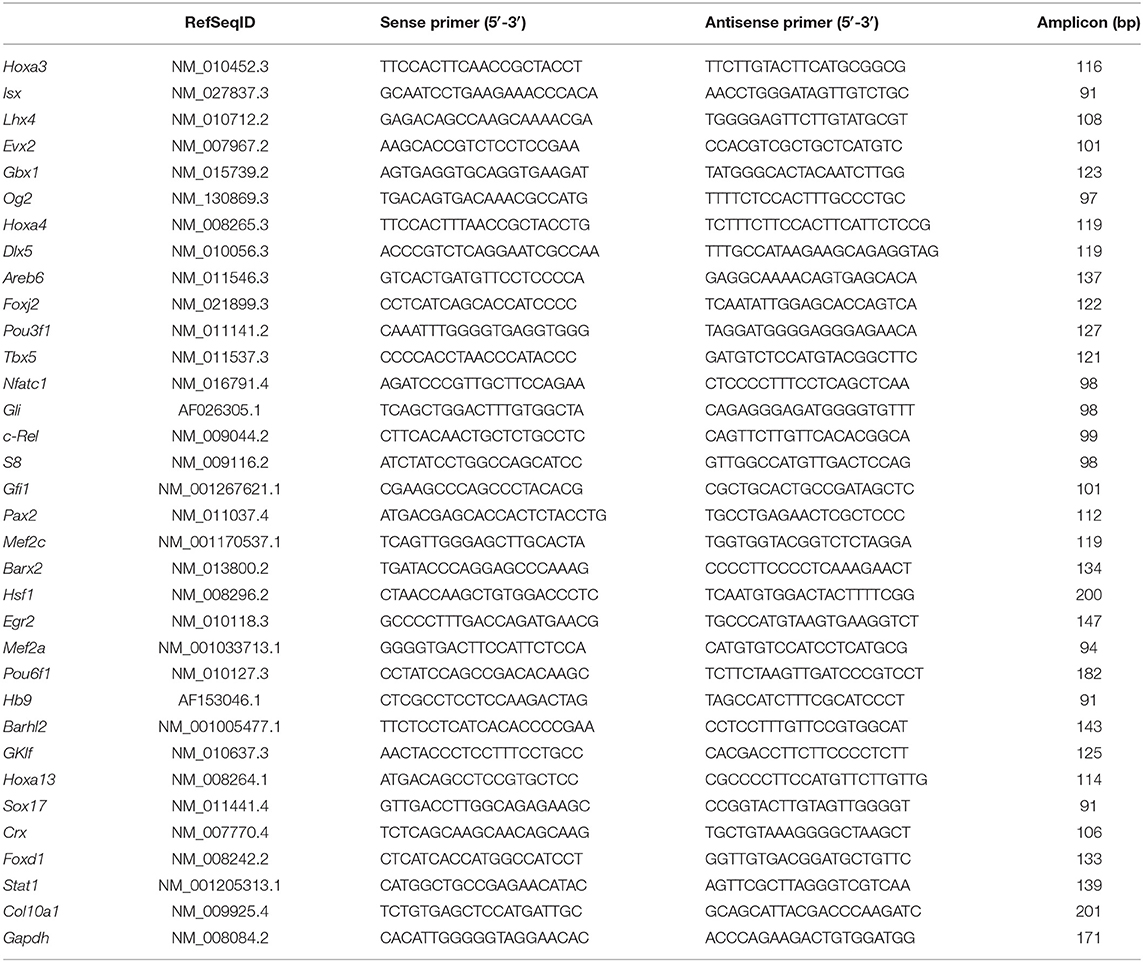
Table 1. The primers in real-time qRT-PCR.
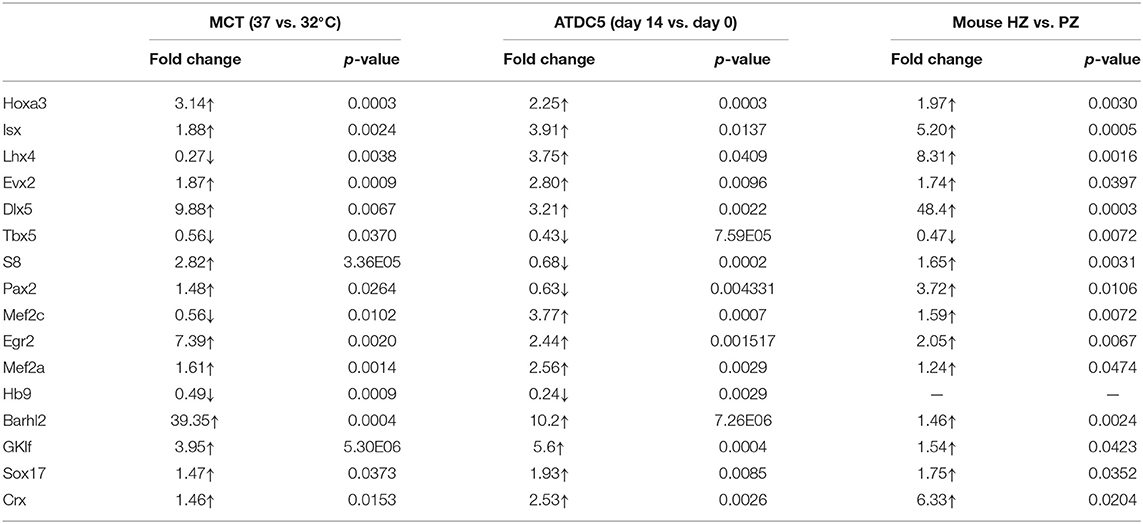
Table 2. Fold changes in mRNA levels of candidate TFs in hypertrophic vs. proliferative chondrocytes.
Col10a1 and Candidate TF Protein Expression in MCT Cells and Growth Plate Chondrocytes
We performed western blot analysis to measure protein levels of Tbx5, Sox17, Gklf, Egr2, and Dlx5 in proliferative and hypertrophic MCT cells, as the mRNA levels of these TFs were consistently upregulated (Sox17, Gklf, Egr2, and Dlx5) or downregulated (Tbx5) in all three chondrogenic cell models. As expected, the amount of Col10a1 protein was significantly increased in hypertrophic MCT cells (Figure 3A). Also, the protein levels of Sox17, Klf4, Egr2, and Dlx5 were significantly increased and that of Tbx5 was significantly decreased in hypertrophic as compared with proliferative MCT cells (Figures 3A,B). These results show that the protein levels of candidate TFs correspond to their mRNA levels in chondrogenic cell models.
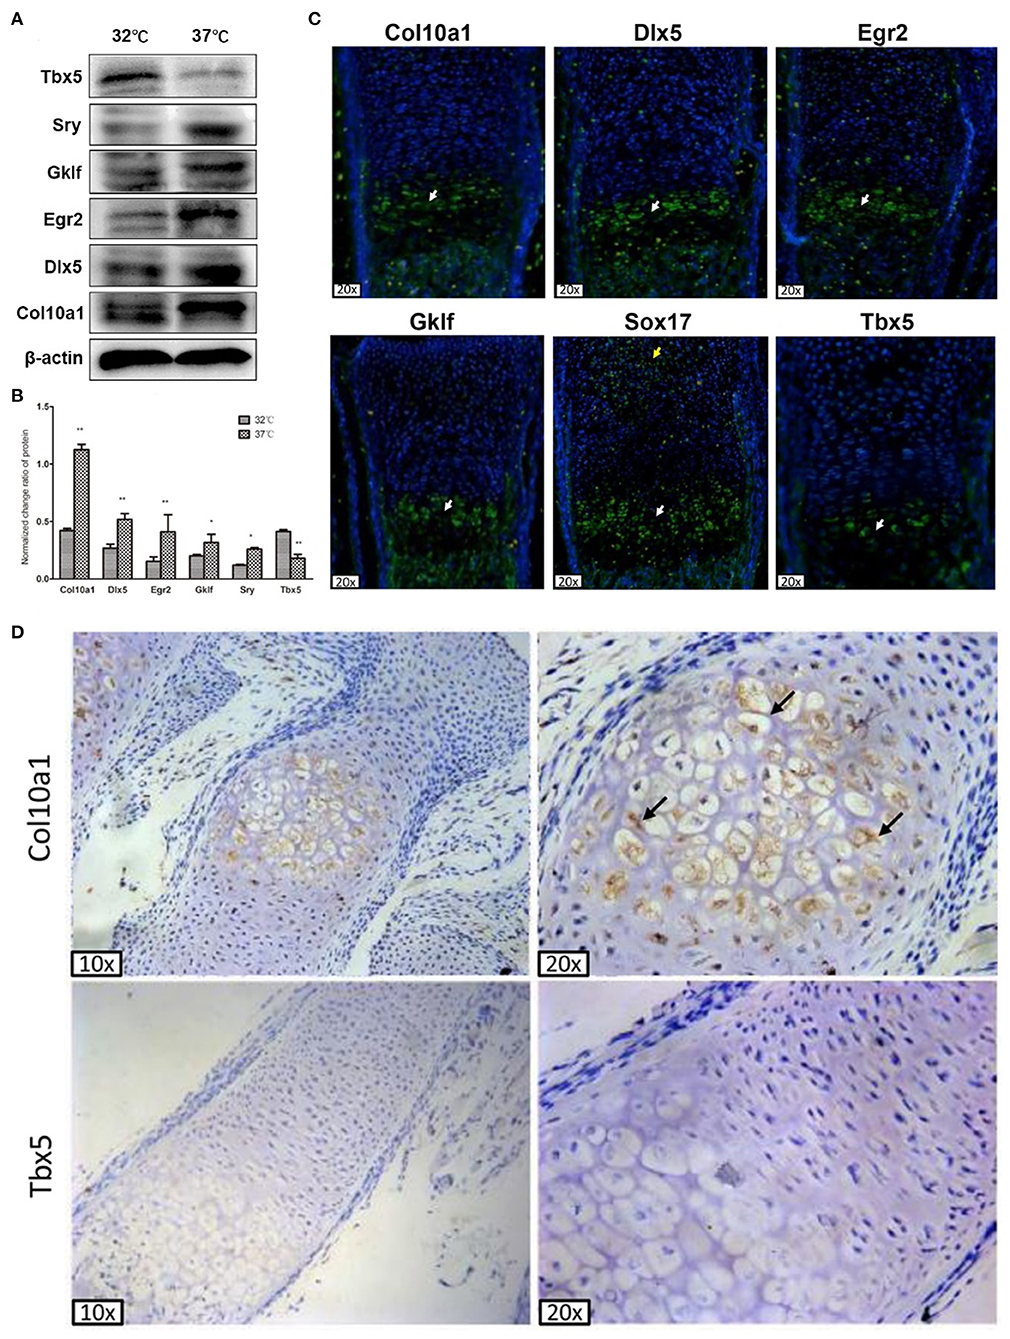
Figure 3. Col10a1 and candidate TFs protein expression in hypertrophic chondrocytes. (A) Protein levels of Col10a1, Dlx5, Egr2, Klf4, and Sox17 were increased and that of Tbx5 was decreased in hypertrophic compared with proliferative MCT cells. (B) Relative protein levels of Col10a1, Dlx5, Egr2, Gklf, Sox17, and Tbx5 normalized to β-actin in hypertrophic vs. proliferative MCT cells. (C) Strong green fluorescence signal indicating Col10a1 protein expression was observed throughout the hypertrophic zone. Dlx5, Egr2, Gklf, and Sox17 protein were also abundantly expressed in hypertrophic chondrocytes, with some Sox17 signal also seen in resting or proliferative chondrocytes. Tbx5 signal was much weaker in hypertrophic chondrocytes compared with that of other TFs. (D) Immunohistochemistry analysis detected strong Col10a1 expression only in the extracellular matrix of hypertrophic chondrocytes (top row), whereas no obvious Tbx5 expression was detected in either proliferative or hypertrophic chondrocytes. *p < 0.05, **p < 0.01.
To determine the in vivo relevance of these candidate genes to Col10a1 expression and chondrocyte hypertrophy, we performed fluorescence immunohistochemistry of selected candidate TFs to measure their protein expression within growth plate (i.e., hypertrophic) chondrocytes. Sagittal sections of the distal radius were prepared for fluorescence immunostaining. As expected, Col10a1 protein was expressed throughout the hypertrophic zone as indicated by green fluorescence signal. Also, Dlx5, Egr2, Gklf, and Sox17 protein were abundantly expressed in hypertrophic chondrocytes, with only Sox17 expressed in resting or proliferative chondrocytes (Figure 3C). We also detected fluorescence signal for Tbx5 in hypertrophic chondrocytes, but its intensity was weaker than that of the other TFs (Figure 3C). These results demonstrate the high levels of expression of most candidate TFs in hypertrophic chondrocytes, consistent with their high levels of mRNA and protein expression in hypertrophic MCT cells (Figures 2D–G, 3A).
To measure Tbx5 expression in hypertrophic chondrocytes in relation to Col10a1 expression, we performed immunohistochemistry analysis using Tbx5 and Col10a1 antibodies in sagittal sections from the distal ulna and fibula. Col10a1 was abundantly expressed in the extracellular matrix of hypertrophic chondrocytes (Figure 3D, top right panel, black arrows). However, no obvious Tbx5 signal was detected in growth plate chondrocytes (Figure 3D, bottom panels). These results are consistent with the low expression of Tbx5 in hypertrophic chondrocytes and no obvious Tbx5 expression in resting or proliferative chondrocytes (Figures 3C,D).
Tbx5 Repression of Col10a1 Expression in Endochondral Ossification Cell Models
We hypothesized that Tbx5 binds to a sequence of the Col10a1 cis-enhancer that is also the binding site for Runx2, a known Col10a1 transcriptional activator (Supplementary Figure 1, Figure 1). Interestingly, mRNA and protein levels of Tbx5 are significantly downregulated in hypertrophic MCT cells, ATDC5 cells, and primary chondrocytes (Figures 2, 3). To determine whether Tbx5 plays a repressive role in the regulation of Col10a1 expression, we performed in vitro transient transfection of MCT cells using Tbx5 expression plasmids and siRNAs. Tbx5 expression plasmids were driven by the CMV and Col10a1-specific enhancer and promoter, respectively (Figures 4A,B). We found that overexpression of pCMV-Tbx5 or Col10a1-Tbx5 significantly increased Tbx5 expression (Figure 4C) but downregulated Col10a1 expression (Figure 4D). By contrast, knocking down Tbx5 in proliferative MCT cells significantly decreased Tbx5 expression (Figure 4E) increased Col10a1 expression (Figure 4F). These results suggest an inverse correlation between Tbx5 and Col10a1 expression.
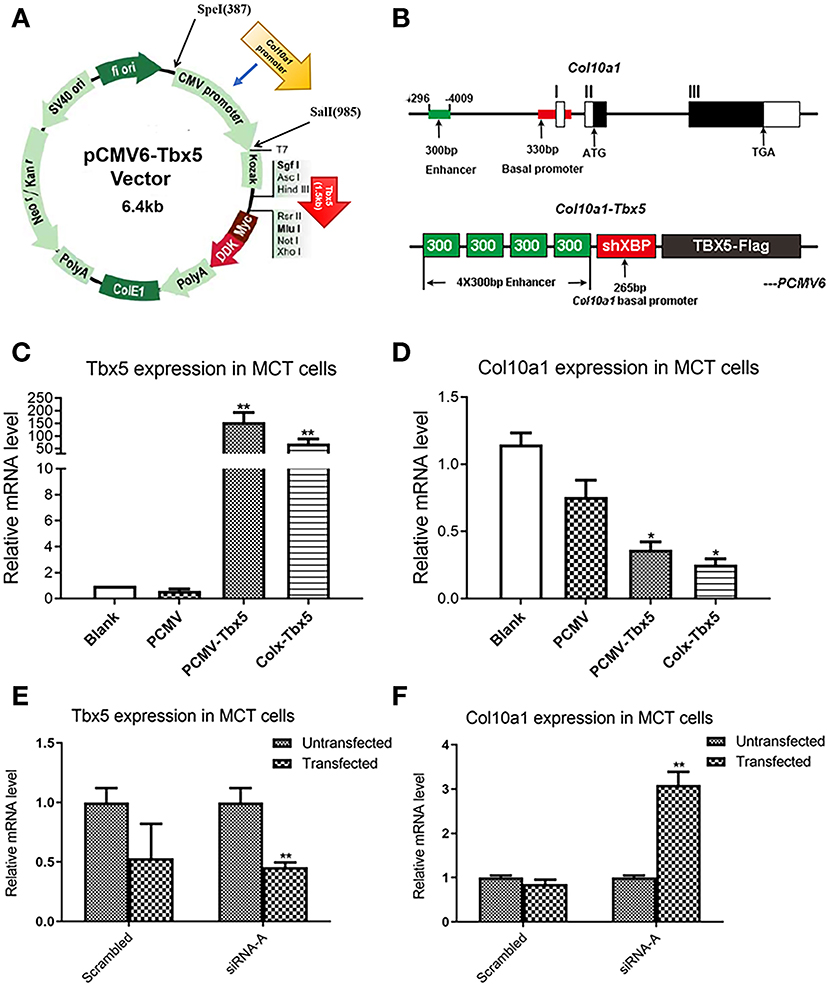
Figure 4. Transfection of Tbx5 in MCT cells. (A) Schema graph of Tbx5 expression plasmid driven by Col10a1-specific enhancer and promoter. (B) The Col10a1 gene (top) and Col10a1–Tbx5 transgenic construct (bottom). The ~300-bp hypertrophic chondrocyte-specific Col10a1 cis-element illustrated previously locate in the distal promoter (−4,296 to −4,009 bp) and four copies of the ~300-bp cis-elements and a short basal promoter (265bp) element were used to drive the Tbx5 gene with a Flag-tag. ATG: start codon; TAG: stop codon; ShXBP: Short Col10a1 basal promoter. (C,D) Transient transfection of Tbx5 increased the mRNA level of Tbx5 and downregulated Col10a1 expression. (E,F) Compared with scrambled RNA, Tbx5 siRNA downregulated Tbx5 expression and increased Col10a1 expression. *p < 0.05, **p < 0.01.
We also generated a stable Tbx5-overexpressing ATDC5 cell line using Tbx5-expressing plasmid with pCMV6-entry control and G418 selection. Gene expression analysis showed significantly increased levels of Tbx5 in ATDC5 cells stably transfected with pCMV6-Tbx5 and Colx-Tbx5 plasmid after 7 and 14 days of chondrogenic differentiation compared with blank and vector controls (Figure 5A). We also observed Col10a1 expression in Tbx5-overexpressing cells after culture, with the highest level observed on day 14 (Figure 5B). Furthermore, the protein level of Col10a1 in Tbx5-overexpressing cells also peaked on day 14, consistent with its mRNA expression (Figure 5C). However, the protein level of Col10a1 in Tbx5-overexpressing cells was lower than that of controls on days 7, 14, and 21, in contrast to the protein level of Tbx5. These results demonstrate that overexpression of Tbx5 inhibits Col10a1 expression in chondrogenic differentiation cell models.
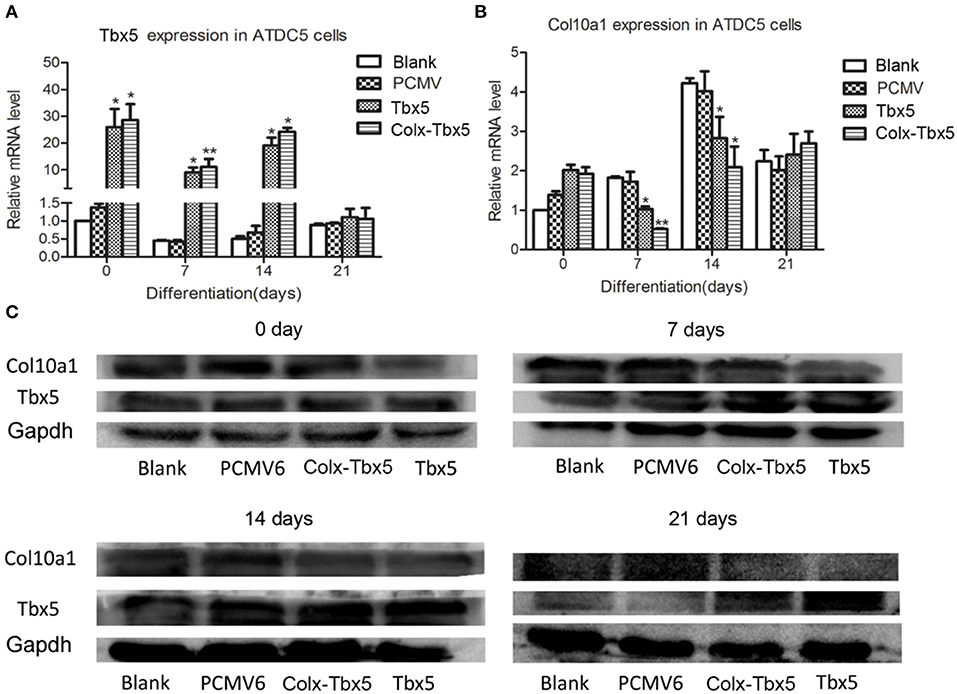
Figure 5. Tbx5 overexpression inhibited Col10a1 expression in ATDC5 cells. (A) Tbx5 mRNA was upregulated in ATDC5 cells stably transfected with Tbx5 expression plasmid compared with vector and blank controls. (B) Col10a1 expression was inhibited in Tbx5-overexpressing cells compared with vector and blank controls. (C) Protein levels of Tbx5 and Col10a1 were similar to their mRNA levels. *p < 0.05, **p < 0.01.
Effect of Tbx5 Overexpression on Chondrogenic Differentiation in ATDC5 Cells
To determine the effect of Tbx5 overexpression on chondrogenic differentiation and mineralization in ATDC5 cells, we performed Alizarin red, Alcian blue, and alkaline phosphatase (ALP) staining. Alizarin red staining, indicative of cells reaching the late stage of in vitro ossification, was strongest on days 14 and 21. Compared with control cells (blank, pCMV6), staining was slightly weaker in Tbx5-overexpressing cells (Tbx5, ColX-Tbx5; Figures 6A,B), suggesting that Tbx5 plays a limited role at late stages of in vitro ossification in this cell model. No difference in Alcian blue staining was found between Tbx5-overexpressing and control cells on any day (Supplementary Figure 2), suggesting that Tbx5 has a limited effect on chondrocyte proliferation. Compared with controls, ALP staining was slightly weaker in ColX-Tbx5 cells on days 4 and 7 (Figures 6A,B), suggesting that Tbx5 inhibits mineralization during chondrocyte maturation.
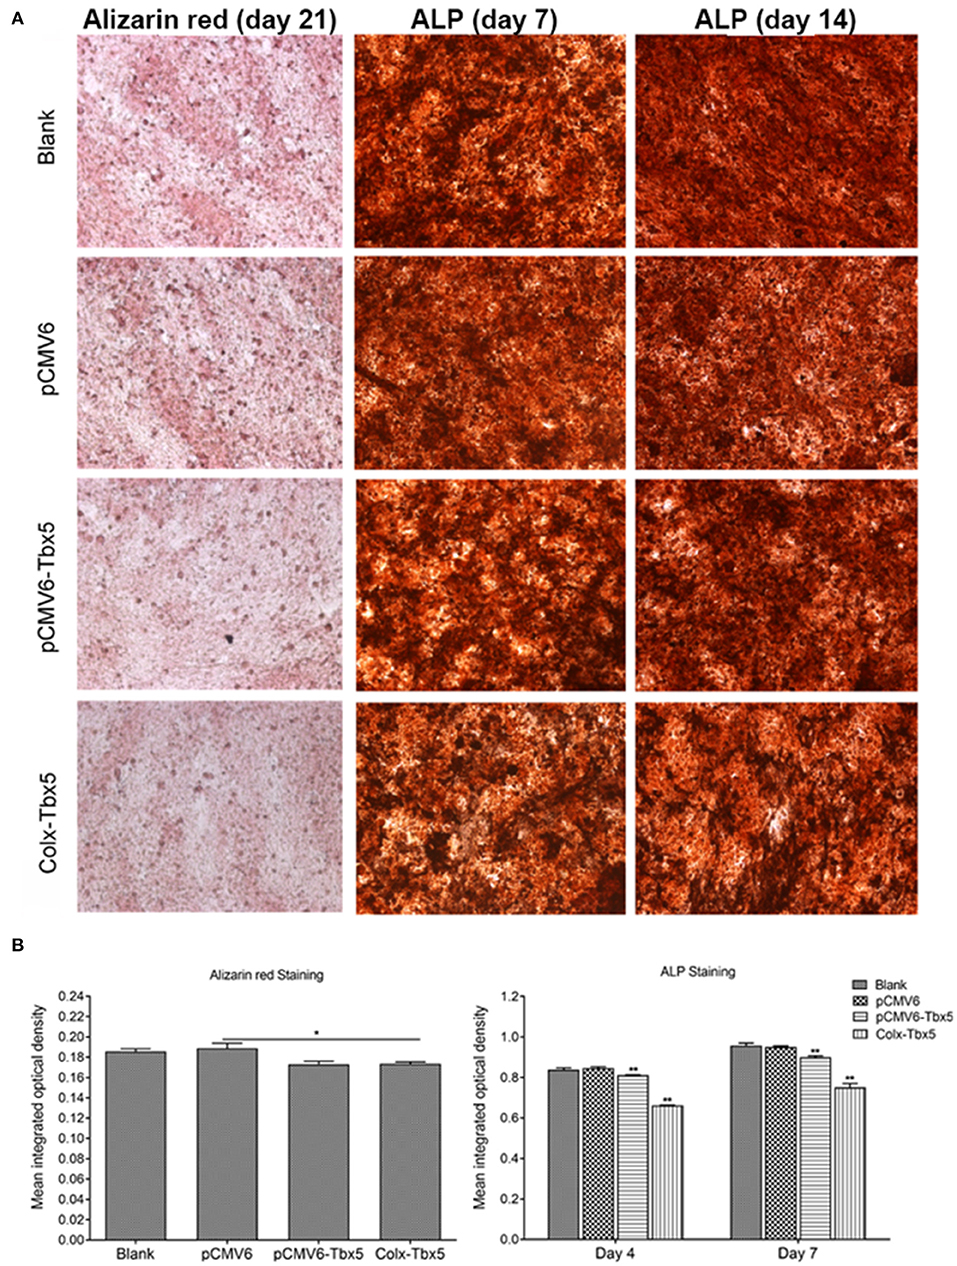
Figure 6. Effects of Tbx5 on chondrogenic differentiation in ATDC5 cells. (A) Tbx5-overexpressing cells showed slightly weaker Alizarin red staining than control cells on day 21 of culture. Tbx5-overexpressing cells showed slightly weaker ALP staining on days 4 and 7. (B) Quantification of mean integrated optical density of Alizarin red and ALP staining in Tbx5-overexpressing and control cells using Image-Pro Plus 6.0 image analysis software. Compared with control cells (blank, pCMV6), Tbx5-overexpressing cells (Tbx5, ColX-Tbx5) showed slightly weaker Alizarin red staining (left). Tbx5-overexpressing cells also showed slightly weaker ALP staining on days 4 and 7 (right). *p < 0.05, **p < 0.01.
Tbx5 Overexpression Represses Col10a1 Expression in ColX-Tbx5 Transgenic Mice
To examine the putative function of Tbx5 in regulating Col10a1 expression in endochondral ossification in vivo, we established ColX-Tbx5 transgenic (TG) mice with specific expression of exogenous Tbx5 gene in hypertrophic chondrocytes using a microinjection strategy (Zheng et al., 2009) (Figures 7A,B). RT-PCR indicated that the transgene (Flag-tagged Tbx5) was expressed in TG mice but not in their wild-type (WT) littermates (Figure 7C). Tbx5 expression was specifically found in the nuclei of hypertrophic chondrocytes in the proximal tibia by immunohistochemistry staining with Flag antibody (Figure 7D). On embryonic day (E17.5), TG mice tended to show decreased Col10a1 expression, but this change was not significant (Figure 7E). Compared with WT mice, TG mice showed significantly decreased Col10a1 expression in limb tissue on post-natal day (P1) and the hypertrophic zone of ribs on P7 (Figures 7F,G).
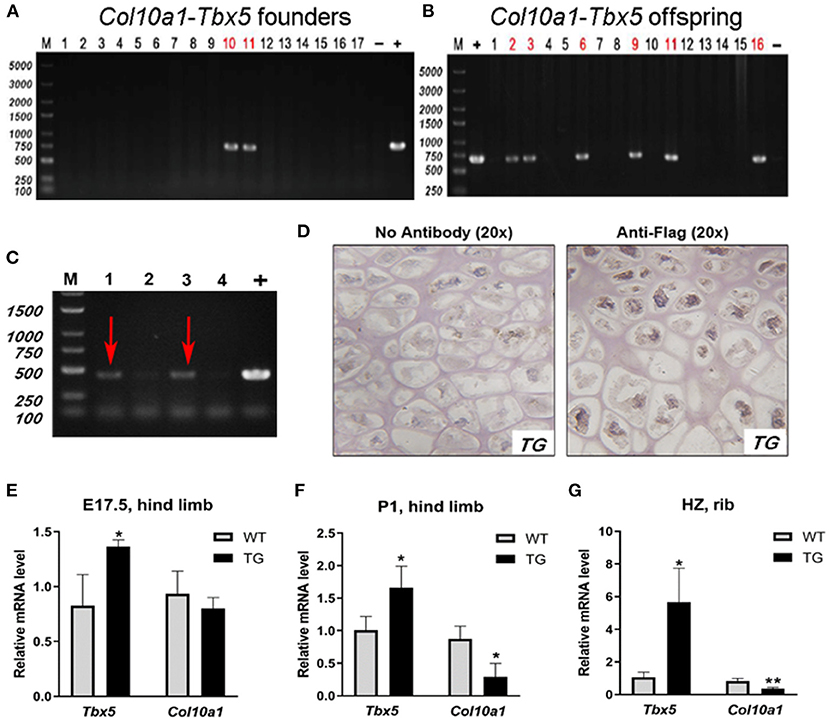
Figure 7. Expression of transgene and Col10a1 mRNA in Col10a1-Tbx5 TG mice. (A) Col10a1-Tbx5 transgenic mouse lines. PCR genotyping using mouse skin genome DNA and Col10a1-Tbx5 fragment specific primers indicated that we have successfully generated transgenic founders with ~10% positive rate (lanes 10, 11). (B) Genotype of the offspring of the transgenic founders breeding with wild-type mice was confirmed by PCR either and showed the establishment of Col10a1–Tbx5 transgenic mouse lines. (C) RT-PCR confirmed transgene expression in Col10a1-Tbx5 TG mice (red arrows). (D) Immunohistochemistry staining was used to analyze Flag expression in TG mouse hind limb sections. Dark brown staining shows Flag expression in hypertrophic chondrocytes of the proximal tibia in a TG mouse (right panel; control with no antibody, left panel). (E–G) Tbx5 expression was upregulated in TG mice compared with WT mice at each age, whereas Col10a1 expression was downregulated in limb tissue on P1 and the hypertrophic zone on P7. *p < 0.05, **p < 0.01.
To determine the effect of Tbx5 overexpression on chondrogenic differentiation and mineralization in ColX-Tbx5 TG mice, we performed whole-skeletal Alcian blue and Alizarin red staining in TG and WT mice on E17.5 and P1. Skeleton size and morphology were similar between TG and WT mice (Figure 8-A1, B1). Compared with WT mice, however, TG mice showed slightly weaker Alizarin red staining in the limb digits on E17.5 (Figure 8-A3, A5) and distal toe bones on P1 (Figure 8-B3, B5), indicating that Tbx5 may play a limited role in late stages of endochondral ossification in vivo.
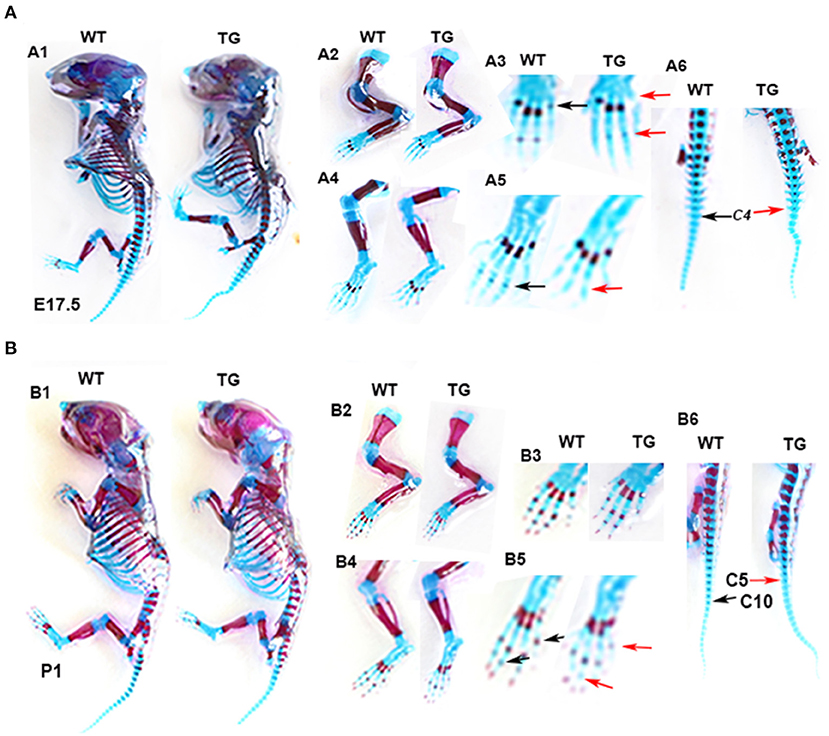
Figure 8. Skeletal phenotype of Col10a1-Tbx5 TG mice. (A) Alcian blue and Alizarin red staining of the mouse skeleton on E17.5. A1: whole skeleton, no difference in Alizarin red staining between TG and WT mice. A2/A3 (zoomed-in pictures of A2): forelimb, no Alizarin red staining in the last phalange of a TG mouse (red arrow), but slight staining in a WT mouse (black arrow). A4/A5 (zoomed-in pictures of A4): hind limb, less Alizarin red staining in the phalanx of a TG mouse (red arrow) compared with a WT mouse (black arrow). (B) Alcian blue and Alizarin red staining of the mouse skeleton on P1. B1: whole skeleton, no difference in Alizarin red staining between TG and WT mice. B2/B3 (zoomed-in pictures of B2): forelimb, no difference between TG and WT mice. B4/B5 (zoomed-in pictures of B4): hind limb, less Alizarin red staining in the metatarsal bones and terminal digits of a TG mouse (red arrows) compared with a WT mouse (black arrows).
Discussion
Cell-Specific Expression of Col10a1 Regulated by Its Cis-Enhancer Elements and Their Binding Factors
Several studies have identified multiple TFs and their binding sites that regulate the expression of Col10a1 specifically in hypertrophic chondrocytes(Riemer et al., 2002; Adams et al., 2003; Schipani and Provot, 2003; Dong et al., 2005; Ijiri et al., 2005; Magee et al., 2005; Arnold et al., 2007; Dy et al., 2012; Maruyama et al., 2013). In particular, we found that Runx2 interacts with the Col10a1 proximal promoter and its 150-bp cis-enhancer and contributes to its cell-specific expression in vivo (Zheng et al., 2003, 2009; Li et al., 2011). However, we also found that Runx2 interaction with this cis-enhancer is required but not sufficient for its reporter activity, suggesting that additional Col10a1 regulators are required. In the present study, we identified 48 potential binding sites for ~40 candidate TFs using the TRAP program. Intriguingly, in silico sequence analysis of the Col10a1 cis-enhancer indicates that multiple potential Col10a1 transactivators (e.g., Gklf, Gli) and repressors (e.g., Tbx5) bind in the same location or adjacent to the Runx2 site (Gu et al., 2014), indicating that multiple TFs may regulate Col10a1 expression and chondrocyte hypertrophy in skeletal development and disease.
Identification of Candidate TFs in Mouse Chondrogenic Cell Models
Using binding affinity to predict candidate TFs can substantially increase the efficiency of experiments (Sandelin, 2008). Theoretically, genes predicted to interact with the specific enhancer of Col10a1 should impact Col10a1 expression and chondrocyte hypertrophy. Indeed, it was previously reported that interruption of Mef2c in cartilage delays hypertrophic differentiation in mouse endochondral bones, whereas its ectopic activation causes pre-mature hypertrophy (Arnold et al., 2007). Studies of craniofacial development show that Mef2c is required for normal expression of Dlx5 in branchial arches. Notably, we detected significant upregulation of Mef2c and Dlx5 mRNA levels in hypertrophic chondrogenic cell models which also show increased Col10a1 expression, suggesting a role of Dlx5 and Mef2c in chondrogenic differentiation. To determine their correlation with Col10a1 expression and possible influence on endochondral ossification, we systematically examined the mRNA and protein levels of candidate TFs identified by the TRAP program in multiple mouse chondrogenic cell models. We found that the expression of most selected candidate genes was upregulated in hypertrophic MCT cells, ATDC5 cells, and mouse ribs. However, differences in the expression of candidate genes across models also existed, possibly due to differences in the tissues or cell populations selected and the corresponding approaches to analysis.
Tbx5 Repression of Col10a1 Expression in Endochondral Ossification
The T-box gene family, which share a highly conserved 180 amino acid T-box DNA binding domain, may play essential roles in embryogenesis and cardiac development. In particular, Tbx5 has been extensively studied over the past decade because its mutation is associated with cardiac and limb defects observed in Holt-Oram syndrome (Mori and Bruneau, 2004; Steimle and Moskowitz, 2017). Notably, Tbx5 and Tbx4 are the earliest required factors for initiating hind and forelimb outgrowth, respectively. Tbx5 and Tbx4 directly regulate the expression of Fgf10 and may establish a FGF signaling loop that drives successful limb outgrowth (Naiche and Papaioannou, 2003). By performing bioinformatics prediction of TFBSs for the Col10a1 cis-enhancer, we found that Tbx5 binds to a sequence similar to the previously identified Runx2 binding site.
To determine the in vivo relevance of the Tbx5 gene to Col10a1 expression and chondrocyte hypertrophy, we performed RT-PCR, western blot, fluorescence immunohistochemistry, and immunohistochemistry of Tbx5 to examine its expression in multiple chondrogenic differentiation cell models. We found that Tbx5 expression is inversely correlated with Col10a1 expression in chondrogenic cell models, suggesting that Tbx5 is a Col10a1 transcriptional repressor. Overexpression of Tbx5 in proliferative MCT cells downregulated the mRNA level of Col10a1, whereas knocking down Tbx5 upregulated Col10a1 expression. We also examined Col10a1 expression in a stable Tbx5-overexpressing ATDC5 cell line. Previous studies show that ITS-induced ATDC5 cells, a model of endochondral ossification, show mature hypertrophy and upregulation of Col10a1 (Newton et al., 2012). In the present study, Tbx5 overexpression decreased Col10a1 expression as early as day 7 in culture. Slightly weaker ALP staining was also observed on day 7, suggesting that Tbx5 negatively regulates mineralization during chondrocyte maturation.
To explore whether Tbx5 plays a similar role in regulating Col10a1 expression in vivo, we generated Col10a1-Tbx5 TG mice using a cell-specific Col10a1 control element containing a 265-bp shorter basal promoter and four copies of a 300-bp cis-enhancer, which was previously shown to drive reporter (LacZ) gene expression in hypertrophic cells (Zheng et al., 2009). Skeletal staining showed slightly delayed ossification in the distal appendicular skeleton of TG mice compared with their WT littermates, suggesting that overexpression of Tbx5 represses Col10a1 expression in vivo and has a mild impact on skeletal ossification in mice. Additional studies are needed to elucidate how Tbx5 regulates skeletal development. Interestingly, Karouzakis et al. (2014) found that demethylation of the Tbx5 promoter in rheumatoid arthritis synovial fibroblasts and synovium is associated with higher Tbx5 expression than in OA synovial fibroblasts and synovium. Han et al. (2019) also found that Tbx5 is hypermethylated in OA patients. In addition, abnormal COL10A1 expression and chondrocyte hypertrophy are observed in elderly OA patients. Combined with the present results, these findings suggest that Tbx5 may play a role in the progression of OA by impacting Col10a1 expression and chondrocyte hypertrophy.
Candidate TFs Regulate the Expression of Col10a1 in Endochondral Ossification
Runx2 expression is mainly observed in the late condensation stage of chondrogenesis, substantially declines in proliferating chondrocytes, and reappears in pre-hypertrophic and hypertrophic chondrocytes (Kronenberg, 2003). We and others show that Runx2 interaction with a cis-enhancer element of Col10a1 is required but not sufficient for Col10a1 expression and contributes to its cell-specific expression across species. Indeed, multiple TFs regulate Col10a1 expression, including Mef2c, Sox9, and Dlx5. Dlx5/6 and Mef2 form an enhanceosome with Tcf7, Ctnnb1, Sox5/6, Smad1, and Sp7 via protein-protein interactions, which activates the Runx2 enhancer and affects Co10a1 expression and chondrocyte hypertrophy (Komori, 2017).
In the present study, we identified many candidate Col10a1 regulators through bioinformatics analysis of the mouse Col10a1 enhancer. We also performed expression analysis to identify candidate TFs that positively (e.g., Sox17, Dlx5) and negatively (e.g., Tbx5) regulate Col10a1 expression in different cell models. Furthermore, we found that Tbx5 overexpression decreased Col10a1 expression and resulted in slightly weaker ALP staining as early as day 7 of culture. Tbx5 has been shown to bind the NuRD complex by interacting with CHD4 and recruits it to regulatory regions containing T-box binding elements. The NuRD complex then deacetylates histones and remodels chromatin to a transcriptionally inactive state, thereby repressing target gene expression (Boogerd and Evans, 2016; Waldron et al., 2016; Zhu et al., 2017). As Tbx5 shows three putative binding sites on the 150-bp Col10a1 cis-enhancer, we speculate that Tbx5 may directly interact with the Col10a1 enhancer to regulate Col10a1 expression.
Together, our results suggest that multiple TFs, including transactivators, inhibitors, and enhanceosomes, work with Runx2 to regulate Col10a1 expression and chondrocyte maturation. We speculate that Col10a1 transactivators accelerate chondrocyte maturation and endochondral ossification and thus could contribute to degradation of articular cartilage as seen in OA. Conversely, inhibitors or insufficient transactivators may decrease Col10a1 expression and delay chondrocyte maturation and thus contribute to low bone growth as seen in skeletal dysplasia, or less cartilage degradation as seen in Runx2+/− mice of an OA mouse model (Zhu et al., 2017). Further characterization of these candidate Col10a1 regulators will open new avenues of research that aims to better understand skeletal developmental and disease and thus better options developing new therapeutic targets for skeletal diseases.
Materials and Methods
In silico Sequence Analysis of Col10a1 Cis-Enhancer
The 150-bp Col10a1 promoter/enhancer element (−4,196 to −4,147 bp) was subjected to in silico sequence analysis to search for transcription factor binding sites (TFBS) using following web-based softwares: TRAP (transcription factor affinity prediction) is a web tool to predict which TFs are susceptible to bind a promoter or genes of interest with highest affinity (Thomas-Chollier et al., 2011). TRAP uses the TRANSFAC database which was released in January, 2010. The search result is listed in a table ranking the affinity of TFs with a p-value (Supplementary Figure 1). TRAP is available online at http://trap.molgen.mpg.de/cgi-bin/home.cgi.
Cell Culture, Total RNA Extraction and cDNA Synthesis
Mouse chondrocytes (MCT cells) were cultured at 32°C in standard DMEM with 8% FBS (Gibco, New Zealand) and 8% CO2 as per published protocol (Lefebvre et al., 1995; Shukunami et al., 1997). After grown until sub-confluence, these MCT cells were further cultured at either 32°C (proliferative) or 37°C for additional 3 days (become hypertrophic) before harvest. Total RNA was extracted using Trizol reagent (Invitrogen, Carlsbad, CA) according to the manufacturer's instructions. RNA was quantified using a NanoDrop spectrophotometer, and typically showed A260/280 ratios between 1.9 and 2.1. Total cDNA was synthesized by a commercial kit (iScript cDNA Synthesis kit, Bio-Rad, Hercules, CA) following the manufacturer's protocol. ATDC5 cells were maintained in a mixed DMEM/F-12 (1:1) medium (Invitrogen) with 5% FBS and 1% human insulin, transferrin, and sodium selenite (ITS, Sigma) at 37°C and 5% CO2 (Koshimizu et al., 2012). Cells were then harvested at days 0, 4, 7, 10, 14, and 21 and subjected to RNA extraction and cDNA synthesis respectively as described above.
Expression Analysis of Genes Using Real-Time/qRT-PCR
The RT product was subjected to real-time or quantitative polymerase chain reaction (qRT-PCR) to show the relative mRNA levels of genes of interest. These genes include hypertrophic chondrocyte-specific Col10a1, 32 candidate Col10a1 regulators and the endogenous control gene Gapdh for normalization of the RNA quality and quantity. For qRT-PCR, the cDNA templates were amplified with relevant gene- or 32 candidate regulators-specific primers (listed in Table 1) using the Bio-Rad iQ™ SYBR Green supermix and Bio-Rad CFXTM96 Detection System. Expression of selected genes was quantified by real-time PCR using an Applied Biosystems 2720 Fast Real-time PCR system (Applied Biosystems), following the manufacturer's instructions. The mean threshold cycle number (CT values) of target genes was normalized to endogenous Gapdh and calculated using 2−ΔΔCt and student t-test (Livak and Schmittgen, 2001; Pfaffl, 2001). Data was collected from multiple runs of real-time PCR with duplicate templates and the relative mRNA level was compared between proliferative and hypertrophic MCT cells, between day 0 and day 14 ATDC5 cells and between primary chondrocytes from the proliferative and hypertrophic zone by micro-dissection of mouse ribs. p < 0.05 was considered statistically significant fold change of mRNA level between samples.
Western Blot Analysis
MCT cells (proliferative and hypertrophic) were washed with cold phosphate-buffered saline (PBS) and lyzed in RIPA buffer (Beyotime Biotechnology, CA, China) containing protease inhibitor cocktail (KangChen, Shanghai, China) for 30 min incubation on ice, and then centrifugated at 14,000 rpm for 10 min to remove cellular debris. The supernatant was collected and the protein concentration was determined by BCA-assay (Eppendorf, Hamburg, Germany). Then, 50 μg of total protein were subjected to SDS-PAGE and subsequently transferred onto Immobilon-P membranes (Millipore, Billerica, USA) which were then blocked with 5% non-fat milk for 1 h under continuous shaking. These membranes were then treated with different primary antibodies (goat anti-EGR2 1:1,000, goat anti-TBX5 1:1,000, goat anti-DLX5 1:1,000, goat anti-GKLF 1:1,000, goat anti-SRY 1:1,000, goat anti-COL10A1 1:1,000) (Santa Cruz Biotechnology, CA, USA) independently at 4°C overnight. These membranes were washed with TBST containing 0.1% Tween20 three times and then incubated with horseradish peroxidase conjugated rabbit anti-goat IgG antibody (Fcmacs Biotechnology, CA, China) at room temperature for 1 h. Specific bands were detected by an enhanced chemiluminescence system (Minichemi, China). Anti-actin was used to ensure equal loading by scanning densitometric analysis of the X-ray films. Western blot assay was performed in triplicate.
Immunohistochemistry (IHC) Analysis
Sagittal sections of mouse hind limbs at the age of 1 day were subjected to IHC analysis using different primary antibodies (goat anti-TBX5 1:100 and goat anti-COL10A1 1:100) (Santa Cruz Biotechnology, CA, USA). Briefly, paraffin-embedded limb sections undergone de-paraffin and rehydration were subjected to antigen retrieval by incubation with hot (95°C) sodium citrate buffer (0.01 M, pH 6.0) for 10 min. The tissue sections were then exposed to hydrogen peroxide (3% H2O2) for 5 min to quench the endogenous peroxidase, followed by blocking with 30% goat serum (30 min). The slides were incubated overnight with above primary antigen at 4°C. Non-immune goat IgG was used as a negative control. After washing with the 1xTBST (Tris Buffered Saline with 0.1% Tween-20), the slides were further incubated with biotinylated secondary antibody (anti-goat IgG, Santa Cruz, CA) and detected using the ABC kit (Elite PK-6200 Universal, VECTOR laboratories, Burlingame, CA).
Fluorescence Immunohistochemistry
Ten micrometers frozen sagittal sections of mouse hind limbs at the age of 1 day were subjected to fluorescence immunohistochemistry analysis using different primary antibodies (goat anti-EGR2 1:1,000, goat anti-TBX5 1:100, goat anti-DLX5 1:100, goat anti-GKLF 1:100, goat anti-SRY 1:100, goat anti-COL10A1 1:100) (Santa Cruz Biotechnology, CA, USA). Sections washed three times with phosphate buffer (PBS, PH 7.4), and permeabilized with ice-cold 0.3% Triton X-100 for 10 min at room temperature (RT), and blocked in PBS containing 5% goat serum albumin (BSA) for 30 min at RT. The sections were incubated overnight at 4°C with above primary antigen. Non-immune goat IgG was used as a negative control. After washing with the PBS (Tris Buffered Saline with 0.1% Tween-20), the slides were further incubated with Alexa Fluor 488 – conjugated Affinipure Rabbit Anti- Goat IgG (1:200, Santa Cruz) for 1 h at room temperature. Nuclear counterstaining was performed with DAPI for 10 min at RT. Immunofluorescence images were acquired using A Zeiss fluorescence microscope with 20×.
Transfection, Establishment of Tbx5 Expressing Stable Cell Line
MCT cells grown in 6-well plates at 32°C and reached 70–80% confluence were used for transient transfection studies as previously described (Zheng et al., 2003; Gu et al., 2015). Specifically, 4 μg of Tbx5 expression plasmid (MR227369, Origene) with blank and control vector pCMV6-entry (PS100001, Origene, Rockville, MD, USA) were transfected respectively using serum-free medium and Lipofectamine-plus (GIBCO BRL). After transfection for 6 h, cells were switched to 37 °C and continually cultured for 24 h in complete medium. The small interfering RNA (siRNA) sequences targeting Tbx5 and scramble control sequence were purchased from Origene Technologies. Transfection of siRNAs and the scrambled control duplex in MCT cells was performed using siTran 1.0 reagent (Origene) according to the manufacturer's instructions. To establish the Tbx5 expressing stable cell line, ATDC5 cells grown in 37°C were transfected with Tbx5 expressing plasmid (pCMV6-Tbx5 and Colx-Tbx5) or pCMV6-entry as a control while reached 70–80% confluence using similar procedures as described above. Cells were then cultured in DMEM/F12 medium containing 5% FBS and neomycin G418 (600 μg/ml, 158782, MP Biomedicals). After G418 selection for 2 weeks, three colonies were picked up from the survival colonies that were confirmed to have integrated with Tbx5 expression plasmid and used for subsequent experiments.
Generation of Col10a1–Tbx5 Transgenic Mice
To generate the additional transgenic mice, a recombinant 3.9kb fragment with the hypertrophic chondrocyte-specific Col10a1 regulatory elements as previously described followed by the Flag-tagged mouse Tbx5 cDNA and a polyA sequence released from a pCMV6-Tbx5 expression plasmid (MR227369, Origene) was used for DNA microinjection. Specifically, the Col10a1 regulatory elements containing four copies of the 288-bp Col10a1 cis-enhancer (4,296 to −4,209 bp) and a short Col10a1 basal promoter (−220 to +45 bp) were released from plasmid PBS-4x300-sh-XBP by SpeI and SalI (blunted) digestion and cloned into pCMV6-Tbx5 vector to replace the CMV promoter. Before microinjection, the Col10a1–Tbx5 cassette digested from the recombinant vector by SpeI and PciI were purified by purification kit (Qiagen) and confirmed by sequencing. The transgenic mice were established in Nanjing Normal University by the research group of Professor Du. Briefly, the transgenic DNA construct was injected into pronuclei of ICR mouse zygotes and transplanted into pseudopregnant ICR mice. All the animal studies were approved by the animal care and oversight committees at Jiangsu University of Medicine.
Alcian Blue, ALP, and Alizarin Red Staining
For Alcian blue staining, ATDC5 cells from Tbx5 stable line and controls undergoing differentiation were rinsed twice with PBS, and fixed with methanol for 2 min at −20°C. After fixation and rinse with PBS, cells were stained overnight with 0.1% Alcian blue (A0298-1g, Biotechnology, Shanghai, China) in 0.1 N HCL, followed by wash with distilled water and observation and image analysis under Nikon microscope (Japan). For Alkaline phosphatase (ALP) staining, ATDC5 cells were stained according to manufacturer's instruction (CAKP D001-2, Jiancheng, Biotechnology Company Ltd. Nanjing, China). Briefly, cells were washed twice with PBS and fixed with 4% paraformaldehyde for 3 min, followed by incubation with freshly prepared alkaline phosphatase substrate for 15 min at 37°C in a humidified dark box. Cells were washed with PBS and counter-stained with hematoxylin-eosin before microscopic analysis. For Alizarin red staining, cells were washed twice with PBS and fixed with 95% ethanol for 10 min before staining with 1% Alizarin red (A5333, Sigma, PH 6.4) for 10 min at room temperature and then for microscopic analysis. The staining intensity were measured by analyzing mean integrated optical density using the Image-Pro Plus 6.0 image analysis software (Media Cybernetics, Inc. Silver Spring, MD USA). The signal intensity of Alizarin red used for staining mineralized cartilaginous and bony matrices was applied to evaluate the ossification status of the mouse limb, digit, and tail bones (ossified caudal vertebrae numbers). Meanwhile, at least three lines of transgenic mice and wild type littermates were stained and analyzed for each developmental stage.
Statistical Analysis
Expression of marker genes by qRT-PCR was analyzed using GraphPad prism 5 software. Relative mRNA levels of marker genes and Gapdh control were quantified by the comparative 2 –ΔΔCt method (Livak and Schmittgen, 2001). Date were collected from three repeated runs with duplicated templates and illustrated are results of representative runs. Analysis of variance (ANOVA) was used to compare between two or more groups. p < 0.05 implies significant fold changes of genes of interest in treated cells compared with controls.
Data Availability Statement
The original contributions presented in the study are included in the article/Supplementary Material, further inquiries can be directed to the corresponding authors.
Ethics Statement
The animal study was reviewed and approved by animal care and oversight committees at Jiangsu University School of Medicine.
Author Contributions
QZ and LQ: conception, design, collection, and assembly of data. HB, TZ, and YLi: provision of study materials. RH, XZ, XL, JC, YLu, and JG: data analysis and interpretation. All authors: manuscript writing and final approval of manuscript.
Funding
This work was supported by the Jiangsu Provincial key research and development program (Grant no. BE2020679 to QZ), the Innovation Team (leader) of Jiangsu Province (2017, QZ), the support from Shenzhen Science and Technology Program (Grant no. KQTD20170810154011370, QZ), Suzhou Science and Technology Support Program (Grant nos. SYS2019098 and SS2019066 to LQ), and the National Science Foundation of China (Grant no. 81472047, 81672229, and 81901632 to QZ and YLi).
Conflict of Interest
YLu and QZ were employed by company Shenzhen Academy of Peptide Targeting Technology at Pingshan and Shenzhen Tyercan Bio-pharm Co., Ltd., Shenzhen, China.
The remaining authors declare that the research was conducted in the absence of any commercial or financial relationships that could be construed as a potential conflict of interest.
Acknowledgments
We are grateful to Dr. Benoit de Crombrugghe from MD Anderson Cancer Center for the MCT cell model.
Supplementary Material
The Supplementary Material for this article can be found online at: https://www.frontiersin.org/articles/10.3389/fgene.2021.683939/full#supplementary-material
Supplementary Figure 1. Affinity-based ranking of TFBSs for the 150-bp Col10a1 cis-enhancer. The 150-bp Col10a1 promoter/enhancer element (−4,196 to −4,147 bp) was subjected to in silico sequence analysis to search for transcription factor binding sites (TFBSs) using TRAP. The search result is listed in a table ranking the affinity of TFs with a p-value.
Supplementary Figure 2. Effects of Tbx5 on cartilage matrix within chondrogenic differentiation in ATDC5 cells. Cells cultured for 7 days showed the strongest Alcian blue staining, but there were no differences between Tbx5-overexpressing and control cells across days.
References
Adams, S. L., Pallante, K. M., Niu, Z., Cohen, A. J., Lu, J., and LeBoy, P. S. (2003). Stimulation of type-X collagen gene transcription by retinoids occurs in part through the BMP signaling pathway. J. Bone Joint Surg. Am. 85-A(Suppl. 3), 29–33. doi: 10.2106/00004623-200300003-00006
Ain, N. U., Makitie, O., and Naz, S. (2018). Autosomal recessive chondrodysplasia with severe short stature caused by a biallelic COL10A1 variant. J. Med. Genet. 55, 403–407. doi: 10.1136/jmedgenet-2017-104885
Armiento, A. R., Alini, M., and Stoddart, M. J. (2019). Articular fibrocartilage - why does hyaline cartilage fail to repair? Adv. Drug Deliv. Rev. 146, 289–305. doi: 10.1016/j.addr.2018.12.015
Arnold, M. A., Kim, Y., Czubryt, M. P., Phan, D., McAnally, J., Qi, X., et al. (2007). MEF2C transcription factor controls chondrocyte hypertrophy and bone development. Dev. Cell 12, 377–389. doi: 10.1016/j.devcel.2007.02.004
Bateman, J. F., Wilson, R., Freddi, S., Lamandé, S. R., and Savarirayan, R. (2005). Mutations of COL10A1 in schmid metaphyseal chondrodysplasia. Hum. Mutat. 25, 525–534. doi: 10.1002/humu.20183
Boogerd, C. J., and Evans, S. M. (2016). TBX5 and NuRD divide the heart. Dev. Cell 36, 242–244. doi: 10.1016/j.devcel.2016.01.015
Coghlan, R. F., Oberdorf, J. A., Sienko, S., Aiona, M. D., Boston, B. A., Connelly, K. J., et al. (2017). A degradation fragment of type X collagen is a real-time marker for bone growth velocity. Sci. Transl. Med. 9:eaan4669. doi: 10.1126/scitranslmed.aan4669
Debiais-Thibaud, M., Simion, P., Ventéo, S., Muñoz, D., Marcellini, S., Mazan, S., et al. (2019). Skeletal mineralization in association with type X collagen expression is an ancestral feature for jawed vertebrates. Mol. Biol. Evol. 36, 2265–2276. doi: 10.1093/molbev/msz145
Dong, Y., Drissi, H., Chen, M., Chen, D., Zuscik, M. J., Schwarz, E. M., et al. (2005). Wnt-mediated regulation of chondrocyte maturation: modulation by TGF-beta. J. Cell Biochem. 95, 1057–1068. doi: 10.1002/jcb.20466
Drissi, H., Zuscik, M., Rosier, R., and O'Keefe, R. (2005). Transcriptional regulation of chondrocyte maturation: potential involvement of transcription factors in OA pathogenesis. Mol. Aspects Med. 26, 169–179. doi: 10.1016/j.mam.2005.01.003
Drissi, M. H., Li, X., Sheu, T. J., Zuscik, M. J., Schwarz, E. M., Puzas, J. E., et al. (2003). Runx2/Cbfa1 stimulation by retinoic acid is potentiated by BMP2 signaling through interaction with Smad1 on the collagen X promoter in chondrocytes. J. Cell Biochem. 90, 1287–1298. doi: 10.1002/jcb.10677
Dy, P., Wang, W., Bhattaram, P., Wang, Q., Wang, L., Ballock, R. T., et al. (2012). Sox9 directs hypertrophic maturation and blocks osteoblast differentiation of growth plate chondrocytes. Dev. Cell 22, 597–609. doi: 10.1016/j.devcel.2011.12.024
Girkontaite, I., Frischholz, S., Lammi, P., Wagner, K., Swoboda, B., Aigner, T., et al. (1996). Immunolocalization of type X collagen in normal fetal and adult osteoarthritic cartilage with monoclonal antibodies. Matrix Biol. 15, 231–238. doi: 10.1016/S0945-053X(96)90114-6
Gratal, P., Mediero, A., Sánchez-Pernaute, O., Prieto-Potin, I., Lamuedra, A., Herrero-Beaumont, G., et al. (2019). Chondrocyte enlargement is a marker of osteoarthritis severity. Osteoarthr. Cartil. 27, 1229–1234. doi: 10.1016/j.joca.2019.04.013
Grskovic, I., Kutsch, A., Frie, C., Groma, G., Stermann, J., Schlotzer-Schrehardt, U., et al. (2012). Depletion of annexin A5, annexin A6, and collagen X causes no gross changes in matrix vesicle-mediated mineralization, but lack of collagen X affects hematopoiesis and the Th1/Th2 response. J. Bone Miner. Res 27, 2399–2412. doi: 10.1002/jbmr.1682
Gu, J., Liang, Y., Qiao, L., Lu, Y., Hu, X., Luo, D., et al. (2015). URI expression in cervical cancer cells is associated with higher invasion capacity and resistance to cisplatin. Am. J. Cancer Res. 5, 1353–1367.
Gu, J., Lu, Y., Li, F., Qiao, L., Wang, Q., Li, N., et al. (2014). Identification and characterization of the novel Col10a1 regulatory mechanism during chondrocyte hypertrophic differentiation. Cell Death Dis. 5:e1469. doi: 10.1038/cddis.2014.444
Gu, J., Lu, Y., Qiao, L., Ran, D., Li, N., Cao, H., et al. (2013). Mouse p63 variants and chondrogenesis. Int. J. Clin Exp. Pathol. 6, 2872–2879.
Han, B., Zheng, Z., Ren, J., Qiu, W., and Li, X. (2019). Analysis of methylation datasets identified significantly changed genes and functional pathways in osteoarthritis. Clin. Rheumatol. 38, 3529–3538. doi: 10.1007/s10067-019-04700-4
He, Y., Manon-Jensen, T., Arendt-Nielsen, L., Petersen, K. K., Christiansen, T., Samuels, J., et al. (2019). Potential diagnostic value of a type X collagen neo-epitope biomarker for knee osteoarthritis. Osteoarthr. Cartil. 27, 611–620. doi: 10.1016/j.joca.2019.01.001
Higashikawa, A., Saito, T., Ikeda, T., Kamekura, S., Kawamura, N., Kan, A., et al. (2009). Identification of the core element responsive to runt-related transcription factor 2 in the promoter of human type X collagen gene. Arthritis Rheum 60, 166–178. doi: 10.1002/art.24243
Ijiri, K., Zerbini, L. F., Peng, H., Correa, R. G., Lu, B., Walsh, N., et al. (2005). A novel role for GADD45beta as a mediator of MMP-13 gene expression during chondrocyte terminal differentiation. J. Biol. Chem. 280, 38544–38555. doi: 10.1074/jbc.M504202200
Ikegawa, S., Nishimura, G., Nagai, T., Hasegawa, T., Ohashi, H., and Nakamura, Y. (1998). Mutation of the type X collagen gene (COL10A1) causes spondylometaphyseal dysplasia. Am. J. Hum. Genet. 63, 1659–1662. doi: 10.1086/302158
Karouzakis, E., Trenkmann, M., Gay, R. E., Michel, B. A., Gay, S., and Neidhart, M. (2014). Epigenome analysis reveals TBX5 as a novel transcription factor involved in the activation of rheumatoid arthritis synovial fibroblasts. J. Immunol. 193, 4945–4951. doi: 10.4049/jimmunol.1400066
Kel, A. E., Gossling, E., Reuter, I., Cheremushkin, E., Kel-Margoulis, O. V., and Wingender, E. (2003). MATCH: a tool for searching transcription factor binding sites in DNA sequences. Nucleic Acids Res. 31, 3576–3579. doi: 10.1093/nar/gkg585
Komori, T. (2017). Roles of Runx2 in skeletal development. Adv. Exp. Med. Biol. 962, 83–93. doi: 10.1007/978-981-10-3233-2_6
Komori, T. (2018). Runx2, an inducer of osteoblast and chondrocyte differentiation. Histochem. Cell Biol. 149, 313–323. doi: 10.1007/s00418-018-1640-6
Komori, T., Yagi, H., Nomura, S., Yamaguchi, A., Sasaki, K., Deguchi, K., et al. (1997). Targeted disruption of Cbfa1 results in a complete lack of bone formation owing to maturational arrest of osteoblasts. Cell 89, 755–764. doi: 10.1016/S0092-8674(00)80258-5
Koshimizu, T., Kawai, M., Kondou, H., Tachikawa, K., Sakai, N., Ozono, K., et al. (2012). Vinculin functions as regulator of chondrogenesis. J. Biol. Chem. 287, 15760–15775. doi: 10.1074/jbc.M111.308072
Kronenberg, H. M. (2003). Developmental regulation of the growth plate. Nature 423, 332–336. doi: 10.1038/nature01657
Lamas, J. R., Rodriguez-Rodriguez, L., Vigo, A. G., Alvarez-Lafuente, R., Lopez-Romero, P., Marco, F., et al. (2010). Large-scale gene expression in bone marrow mesenchymal stem cells: a putative role for COL10A1 in osteoarthritis. Ann. Rheum Dis. 69, 1880–1885. doi: 10.1136/ard.2009.122564
Lee, B., Thirunavukkarasu, K., Zhou, L., Pastore, L., Baldini, A., Hecht, J., et al. (1997). Missense mutations abolishing DNA binding of the osteoblast-specific transcription factor OSF2/CBFA1 in cleidocranial dysplasia. Nat. Genet. 16, 307–310. doi: 10.1038/ng0797-307
Lefebvre, V., Garofalo, S., and de Crombrugghe, B. (1995). Type X collagen gene expression in mouse chondrocytes immortalized by a temperature-sensitive simian virus 40 large tumor antigen. J. Cell Biol. 128, 239–245. doi: 10.1083/jcb.128.1.239
Li, F., Lu, Y., Ding, M., Napierala, D., Abbassi, S., Chen, Y., et al. (2011). Runx2 contributes to murine Col10a1 gene regulation through direct interaction with its cis-enhancer. J. Bone Miner. Res. 26, 2899–2910. doi: 10.1002/jbmr.504
Liao, L., Zhang, S., Zhou, G. Q., Ye, L., Huang, J., Zhao, L., et al. (2019). Deletion of Runx2 in condylar chondrocytes disrupts TMJ tissue homeostasis. J. Cell. Physiol. 234, 3436–3444. doi: 10.1002/jcp.26761
Linsenmayer, T. F., Chen, Q. A., Gibney, E., Gordon, M. K., Marchant, J. K., Mayne, R., et al. (1991). Collagen types IX and X in the developing chick tibiotarsus: analyses of mRNAs and proteins. Development 111, 191–196. doi: 10.1242/dev.111.1.191
Livak, K. J., and Schmittgen, T. D. (2001). Analysis of relative gene expression data using real-time quantitative PCR and the 2(-Delta Delta C[T]) Method. Methods 25, 402–408. doi: 10.1006/meth.2001.1262
Lu, Y., Qiao, L., Lei, G., Mira, R. R., Gu, J., and Zheng, Q. (2014). Col10a1 gene expression and chondrocyte hypertrophy during skeletal development and disease. Front. Biol. 9, 195–204. doi: 10.1007/s11515-014-1310-6
Mackie, E. J., Ahmed, Y. A., Tatarczuch, L., Chen, K. S., and Mirams, M. (2008). Endochondral ossification: how cartilage is converted into bone in the developing skeleton. Int. J. Biochem. Cell Biol. 40, 46–62. doi: 10.1016/j.biocel.2007.06.009
Magee, C., Nurminskaya, M., Faverman, L., Galera, P., and Linsenmayer, T. F. (2005). SP3/SP1 transcription activity regulates specific expression of collagen type X in hypertrophic chondrocytes. J. Biol. Chem. 280, 25331–25338. doi: 10.1074/jbc.M412549200
Maruyama, T., Miyamoto, Y., Yamamoto, G., Yamada, A., Yoshimura, K., Suzawa, T., et al. (2013). Downregulation of carbonic anhydrase IX promotes Col10a1 expression in chondrocytes. PLoS ONE 8:e56984. doi: 10.1371/journal.pone.0056984
Mori, A. D., and Bruneau, B. G. (2004). TBX5 mutations and congenital heart disease: Holt-Oram syndrome revealed. Curr. Opin. Cardiol. 19, 211–215. doi: 10.1097/00001573-200405000-00004
Naiche, L. A., and Papaioannou, V. E. (2003). Loss of Tbx4 blocks hindlimb development and affects vascularization and fusion of the allantois. Development 130, 2681–2693. doi: 10.1242/dev.00504
Newton, P. T., Staines, K. A., Spevak, L., Boskey, A. L., Teixeira, C. C., Macrae, V. E., et al. (2012). Chondrogenic ATDC5 cells: an optimised model for rapid and physiological matrix mineralisation. Int. J. Mol. Med. 30, 1187–1193. doi: 10.3892/ijmm.2012.1114
Otto, F., Thornell, A. P., Crompton, T., Denzel, A., Gilmour, K. C., Rosewell, I. R., et al. (1997). Cbfa1, a candidate gene for cleidocranial dysplasia syndrome, is essential for osteoblast differentiation and bone development. Cell 89, 765–771. doi: 10.1016/S0092-8674(00)80259-7
Pfaffl, M. W. (2001). A new mathematical model for relative quantification in real-time RT-PCR. Nucleic Acids Res 29:e45. doi: 10.1093/nar/29.9.e45
Qin, X., Jiang, Q., Nagano, K., Moriishi, T., Miyazaki, T., Komori, H., et al. (2020). Runx2 is essential for the transdifferentiation of chondrocytes into osteoblasts. PLoS Genet. 16:e1009169. doi: 10.1371/journal.pgen.1009169
Riemer, S., Gebhard, S., Beier, F., Poschl, E., and von der Mark, K. (2002). Role of c-fos in the regulation of type X collagen gene expression by PTH and PTHrP: localization of a PTH/PTHrP-responsive region in the human COL10A1 enhancer. J. Cell Biochem. 86, 688–699. doi: 10.1002/jcb.10260
Saito, T., Fukai, A., Mabuchi, A., Ikeda, T., Yano, F., Ohba, S., et al. (2010). Transcriptional regulation of endochondral ossification by HIF-2alpha during skeletal growth and osteoarthritis development. Nat. Med. 16, 678–686. doi: 10.1038/nm.2146
Sandelin, A. (2008). Prediction of regulatory elements. Methods Mol. Biol. 453, 233–244. doi: 10.1007/978-1-60327-429-6_11
Schipani, E., and Provot, S. (2003). PTHrP, PTH, and the PTH/PTHrP receptor in endochondral bone development. Birth Defects Res. C Embryo Today 69, 352–362. doi: 10.1002/bdrc.10028
Shen, G. (2005). The role of type X collagen in facilitating and regulating endochondral ossification of articular cartilage. Orthod. Craniofac. Res. 8, 11–17. doi: 10.1111/j.1601-6343.2004.00308.x
Shukunami, C., Ishizeki, K., Atsumi, T., Ohta, Y., Suzuki, F., and Hiraki, Y. (1997). Cellular hypertrophy and calcification of embryonal carcinoma-derived chondrogenic cell line ATDC5 in vitro. J. Bone Miner. Res. 12, 1174–1188. doi: 10.1359/jbmr.1997.12.8.1174
Simoes, B., Conceicao, N., Viegas, C. S., Pinto, J. P., Gavaia, P. J., Hurst, L. D., et al. (2006). Identification of a promoter element within the zebrafish colXalpha1 gene responsive to runx2 isoforms Osf2/Cbfa1 and til-1 but not to pebp2alphaA2. Calcif. Tissue Int. 79, 230–244. doi: 10.1007/s00223-006-0111-6
Steimle, J. D., and Moskowitz, I. P. (2017). TBX5: a key regulator of heart development. Curr. Top. Dev. Biol. 122, 195–221. doi: 10.1016/bs.ctdb.2016.08.008
Thomas-Chollier, M., Hufton, A., Heinig, M., O'Keeffe, S., Masri, N. E., Roider, H. G., et al. (2011). Transcription factor binding predictions using TRAP for the analysis of ChIP-seq data and regulatory SNPs. Nat. Protoc. 6, 1860–1869. doi: 10.1038/nprot.2011.409
von der Mark, K., Frischholz, S., Aigner, T., Beier, F., Belke, J., Erdmann, S., et al. (1995). Upregulation of type X collagen expression in osteoarthritic cartilage. Acta Orthop. Scand. Suppl. 266, 125–129. doi: 10.3109/17453679509157667
Waldron, L., Steimle, J. D., Greco, T. M., Gomez, N. C., Dorr, K. M., Kweon, J., et al. (2016). The cardiac TBX5 interactome reveals a chromatin remodeling network essential for cardiac septation. Dev. Cell 36, 262–275. doi: 10.1016/j.devcel.2016.01.009
Warman, M. L., Abbott, M., Apte, S. S., Hefferon, T., McIntosh, I., Cohn, D. H., et al. (1993). A type X collagen mutation causes Schmid metaphyseal chondrodysplasia. Nat. Genet. 5, 79–82. doi: 10.1038/ng0993-79
Zheng, Q., Keller, B., Zhou, G., Napierala, D., Chen, Y., Zabel, B., et al. (2009). Localization of the cis-enhancer element for mouse type X collagen expression in hypertrophic chondrocytes in vivo. J. Bone Miner. Res. 24, 1022–1032. doi: 10.1359/jbmr.081249
Zheng, Q., Zhou, G., Morello, R., Chen, Y., Garcia-Rojas, X., and Lee, B. (2003). Type X collagen gene regulation by Runx2 contributes directly to its hypertrophic chondrocyte-specific expression in vivo. J. Cell Biol. 162, 833–842. doi: 10.1083/jcb.200211089
Keywords: Col10a1 regulators, Tbx-5, Runx2, TRAP program, chondrocyte hypertrophy, skeletal disease
Citation: Bian H, Zhu T, Liang Y, Hei R, Zhang X, Li X, Chen J, Lu Y, Gu J, Qiao L and Zheng Q (2021) Expression Profiling and Functional Analysis of Candidate Col10a1 Regulators Identified by the TRAP Program. Front. Genet. 12:683939. doi: 10.3389/fgene.2021.683939
Received: 22 March 2021; Accepted: 24 May 2021;
Published: 02 July 2021.
Edited by:
Przemko Tylzanowski, KU Leuven, BelgiumReviewed by:
Baoheng Gui, The Second Affiliated Hospital of Guangxi Medical University, ChinaYuan Gao, Shandong University, China
Copyright © 2021 Bian, Zhu, Liang, Hei, Zhang, Li, Chen, Lu, Gu, Qiao and Zheng. This is an open-access article distributed under the terms of the Creative Commons Attribution License (CC BY). The use, distribution or reproduction in other forums is permitted, provided the original author(s) and the copyright owner(s) are credited and that the original publication in this journal is cited, in accordance with accepted academic practice. No use, distribution or reproduction is permitted which does not comply with these terms.
*Correspondence: Qiping Zheng, cXBfemhlbmdAaG90bWFpbC5jb20=; Longwei Qiao, cWlhb2xvbmd3ZWkxQDEyNi5jb20=
†These authors have contributed equally to this work