
94% of researchers rate our articles as excellent or good
Learn more about the work of our research integrity team to safeguard the quality of each article we publish.
Find out more
METHODS article
Front. Genet., 27 July 2021
Sec. Genomic Assay Technology
Volume 12 - 2021 | https://doi.org/10.3389/fgene.2021.679612
This article is part of the Research TopicNovel approaches and concepts of biomarker discovery for cancerView all 8 articles
 Changlong Dong1,2,3
 Nini Rao1,2,3*
 Wenju Du1,2,3Fenglin Gao1,2,3Xiaoqin Lv1,2,3
 Guangbin Wang1,2,3
 Junpeng Zhang1,2,3
Purpose: In this work, an algorithm named mRBioM was developed for the identification of potential mRNA biomarkers (PmBs) from complete transcriptomic RNA profiles of gastric adenocarcinoma (GA).
Methods: mRBioM initially extracts differentially expressed (DE) RNAs (mRNAs, miRNAs, and lncRNAs). Next, mRBioM calculates the total information amount of each DE mRNA based on the coexpression network, including three types of RNAs and the protein-protein interaction network encoded by DE mRNAs. Finally, PmBs were identified according to the variation trend of total information amount of all DE mRNAs. Four PmB-based classifiers without learning and with learning were designed to discriminate the sample types to confirm the reliability of PmBs identified by mRBioM. PmB-based survival analysis was performed. Finally, three other cancer datasets were used to confirm the generalization ability of mRBioM.
Results: mRBioM identified 55 PmBs (41 upregulated and 14 downregulated) related to GA. The list included thirteen PmBs that have been verified as biomarkers or potential therapeutic targets of gastric cancer, and some PmBs were newly identified. Most PmBs were primarily enriched in the pathways closely related to the occurrence and development of gastric cancer. Cancer-related factors without learning achieved sensitivity, specificity, and accuracy of 0.90, 1, and 0.90, respectively, in the classification of the GA and control samples. Average accuracy, sensitivity, and specificity of the three classifiers with machine learning ranged within 0.94–0.98, 0.94–0.97, and 0.97–1, respectively. The prognostic risk score model constructed by 4 PmBs was able to correctly and significantly (∗∗∗p < 0.001) classify 269 GA patients into the high-risk (n = 134) and low-risk (n = 135) groups. GA equivalent classification performance was achieved using the complete transcriptomic RNA profiles of colon adenocarcinoma, lung adenocarcinoma, and hepatocellular carcinoma using PmBs identified by mRBioM.
Conclusions: GA-related PmBs have high specificity and sensitivity and strong prognostic risk prediction. MRBioM has also good generalization. These PmBs may have good application prospects for early diagnosis of GA and may help to elucidate the mechanism governing the occurrence and development of GA. Additionally, mRBioM is expected to be applied for the identification of other cancer-related biomarkers.
Gastric cancer is a global health problem, with more than 1 million patients being diagnosed worldwide each year. Gastric cancer remains the third leading cause of cancer-related death, despite a worldwide decline in morbidity and mortality over the past 5 years (Bray et al., 2018; Thrift and El-Serag, 2020). Gastric adenocarcinoma (GA) is a type of gastric cancer caused by malignant transformation of gastric gland cells. Incidence of GA accounts for approximately 95% of gastric malignancies (Lawrence, 2004), and GA pathogenesis has not been fully elucidated. Five-year survival rate of early gastric cancer can reach >90% (Tan, 2019), and 5-year survival rate of patients with advanced gastric cancer is only 20–40% (Siegel et al., 2016; Song Z. et al., 2017). Therefore, an improvement in early diagnosis and treatment of GA can decrease GA incidence and mortality.
Several studies have suggested that molecular biomarkers are important for early diagnosis, treatment, and evaluation of prognosis of cancer (Parker et al., 2009; Collins and Varmus, 2015; Pellegrini et al., 2015). According to the central dogma of biology, RNA carries genetic and regulatory information that reflects the state of the cells. RNA biomarkers have considerably higher sensitivity and specificity for the detection of cancer samples compared with those of protein biomarkers and can more dynamically reflect cellular states and regulatory processes to provide additional cellular information compared with that provided by DNA biomarkers (Xi et al., 2017). Furthermore, miRNAs can regulate gene expression by binding to mRNAs or related proteins (Bartel, 2009). LncRNAs can competitively bind miRNAs as competing endogenous RNAs (ceRNAs) to regulate gene expression and cellular functions (Xia et al., 2014; Song Y. X. et al., 2017). Therefore, mRNAs occupy a key position in the complex regulatory processes involving three types of biomolecules. Abnormal expression of mRNAs in the key positions of the regulatory network can easily bias the overall stability of the network. mRNAs may cause abnormal activation of one or more signaling pathways, which also leads to abnormal expression or function of the biomolecules in these signaling pathways to promote physiological and tissue disorders, such as cancer (Lu et al., 2016; Duan et al., 2020; Hu et al., 2020; Wei et al., 2020). mRNAs that occupy the key positions are more likely to be biomarkers.
Many mRNA biomarkers associated with occurrence and development of GA were identified using experimental and computational methods. Representative studies can be summarized as follows. Yoon et al. (2019) confirmed that the activation of KRAS in GA cells stimulates epithelial-to-mesenchymal transition to form cancer stem-like cells, thereby promoting metastasis. Huang C. et al. (2020) found that overexpression of DGKi in GA indicates poor prognosis, and the MAPK signaling pathway may be one of the key pathways that regulate occurrence and development of GA by DGKi. Necula et al. (2020) showed that overexpression of COL10A1 in GA patients is associated with poor survival and that COL10A1 can be used as a potential biomarker for early detection of GA. Wang (2017) identified 446 differentially expressed (DE) mRNAs in the gene expression profile related to gastric cancer, used these DE mRNAs to construct a protein-protein interaction network, and finally identified five key mRNAs in the protein-protein interaction network (COL5A2, TOP2A, KIF20A, FN1, and PRC1). However, existing GA-related mRNA biomarkers are not sufficient to provide accurate GA diagnosis in the clinic and thoroughly elucidate GA pathogenesis. Identification of GA-related mRNA markers with high sensitivity and specificity is of great significance for early diagnosis, targeted therapy, and analysis of prognosis of GA. Therefore, this study first proposes an algorithm to identify potential mRNA biomarkers (PmBs) related to GA based on complete transcriptomic RNA (including mRNA, lncRNA, and miRNA) profiles of GA. The proposed algorithm evaluates the potential of an mRNA with abnormal expression as GA biomarker in the regulation of transcriptional coexpression and at the protein-protein interaction level. The integrated analysis of multiple omics data objectively avoids the problems of signal noise and high inaccuracy caused by single omics analysis. Then, the sample classification power and prognostic relevance of PmBs were analyzed to assess their reliability and value for assistance with clinical diagnosis. The novelty of this paper are as follows:
1. An novel algorithm named mRBioM for the identification of potential mRNA biomarkers from complete transcriptomic profiles of GA was developed.
2. A cancer-related factor was proposed to distinguish whether a single sample is cancer or normal, which may have good application prospects in the personalized diagnosis of cancers.
3. The mRBioM-based prognostic risk score model was constructed to assess the overall survival rate of cancer patients.
The complete transcriptome TCGA-STAD dataset of RNAs (including mRNA, lncRNA, and microRNA) of GA patients published by various countries was obtained from the Genomic Data Commons of National Cancer Institute in July, 2019. The pathological tissue types of the source data were limited to GA. The dataset included 279 GA patients and the corresponding clinical information (Table 1). The dataset included 257 cases that had only GA tissue samples, 20 cases that had GA and paired paracancerous tissue samples, and 2 cases that had only paracancerous tissue samples. Detailed information about these 299 samples is shown in Supplementary Table 1.
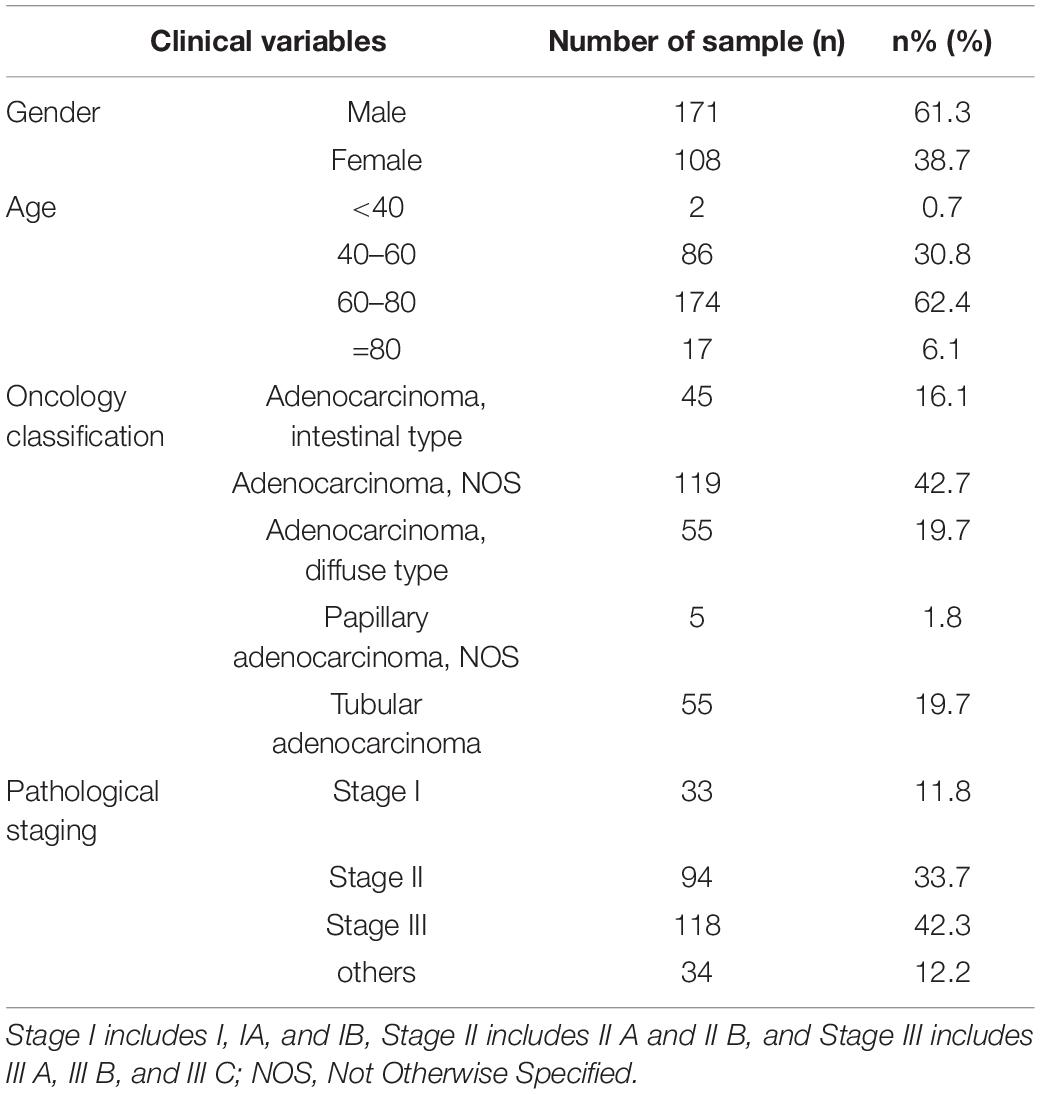
Table 1. Statistics of clinical information of included 279 GA patients.
TCGA-STAD was organized into five subsets for various studies: dataset 1 for GA-related PmB identification, datasets 2–4 for evaluation of PmB classification, and dataset 5 for survival analysis, as shown in Figure 1A. Three other cancer-related RNA transcriptomic profiles were downloaded from the Genomic Data Commons database in May of 2020 and were used to verify the generalization ability of mRBioM: TCGA-COAD, including 478 cases of colon cancer and 41 cases of normal tissues; TCGA-LUAD, including 533 cases of lung adenocarcinoma and 59 cases of normal tissues; and TCGA-LIHC, including 371 cases of liver cancer and 50 cases of normal tissues. The characteristics of the three datasets are shown Figure 1B.
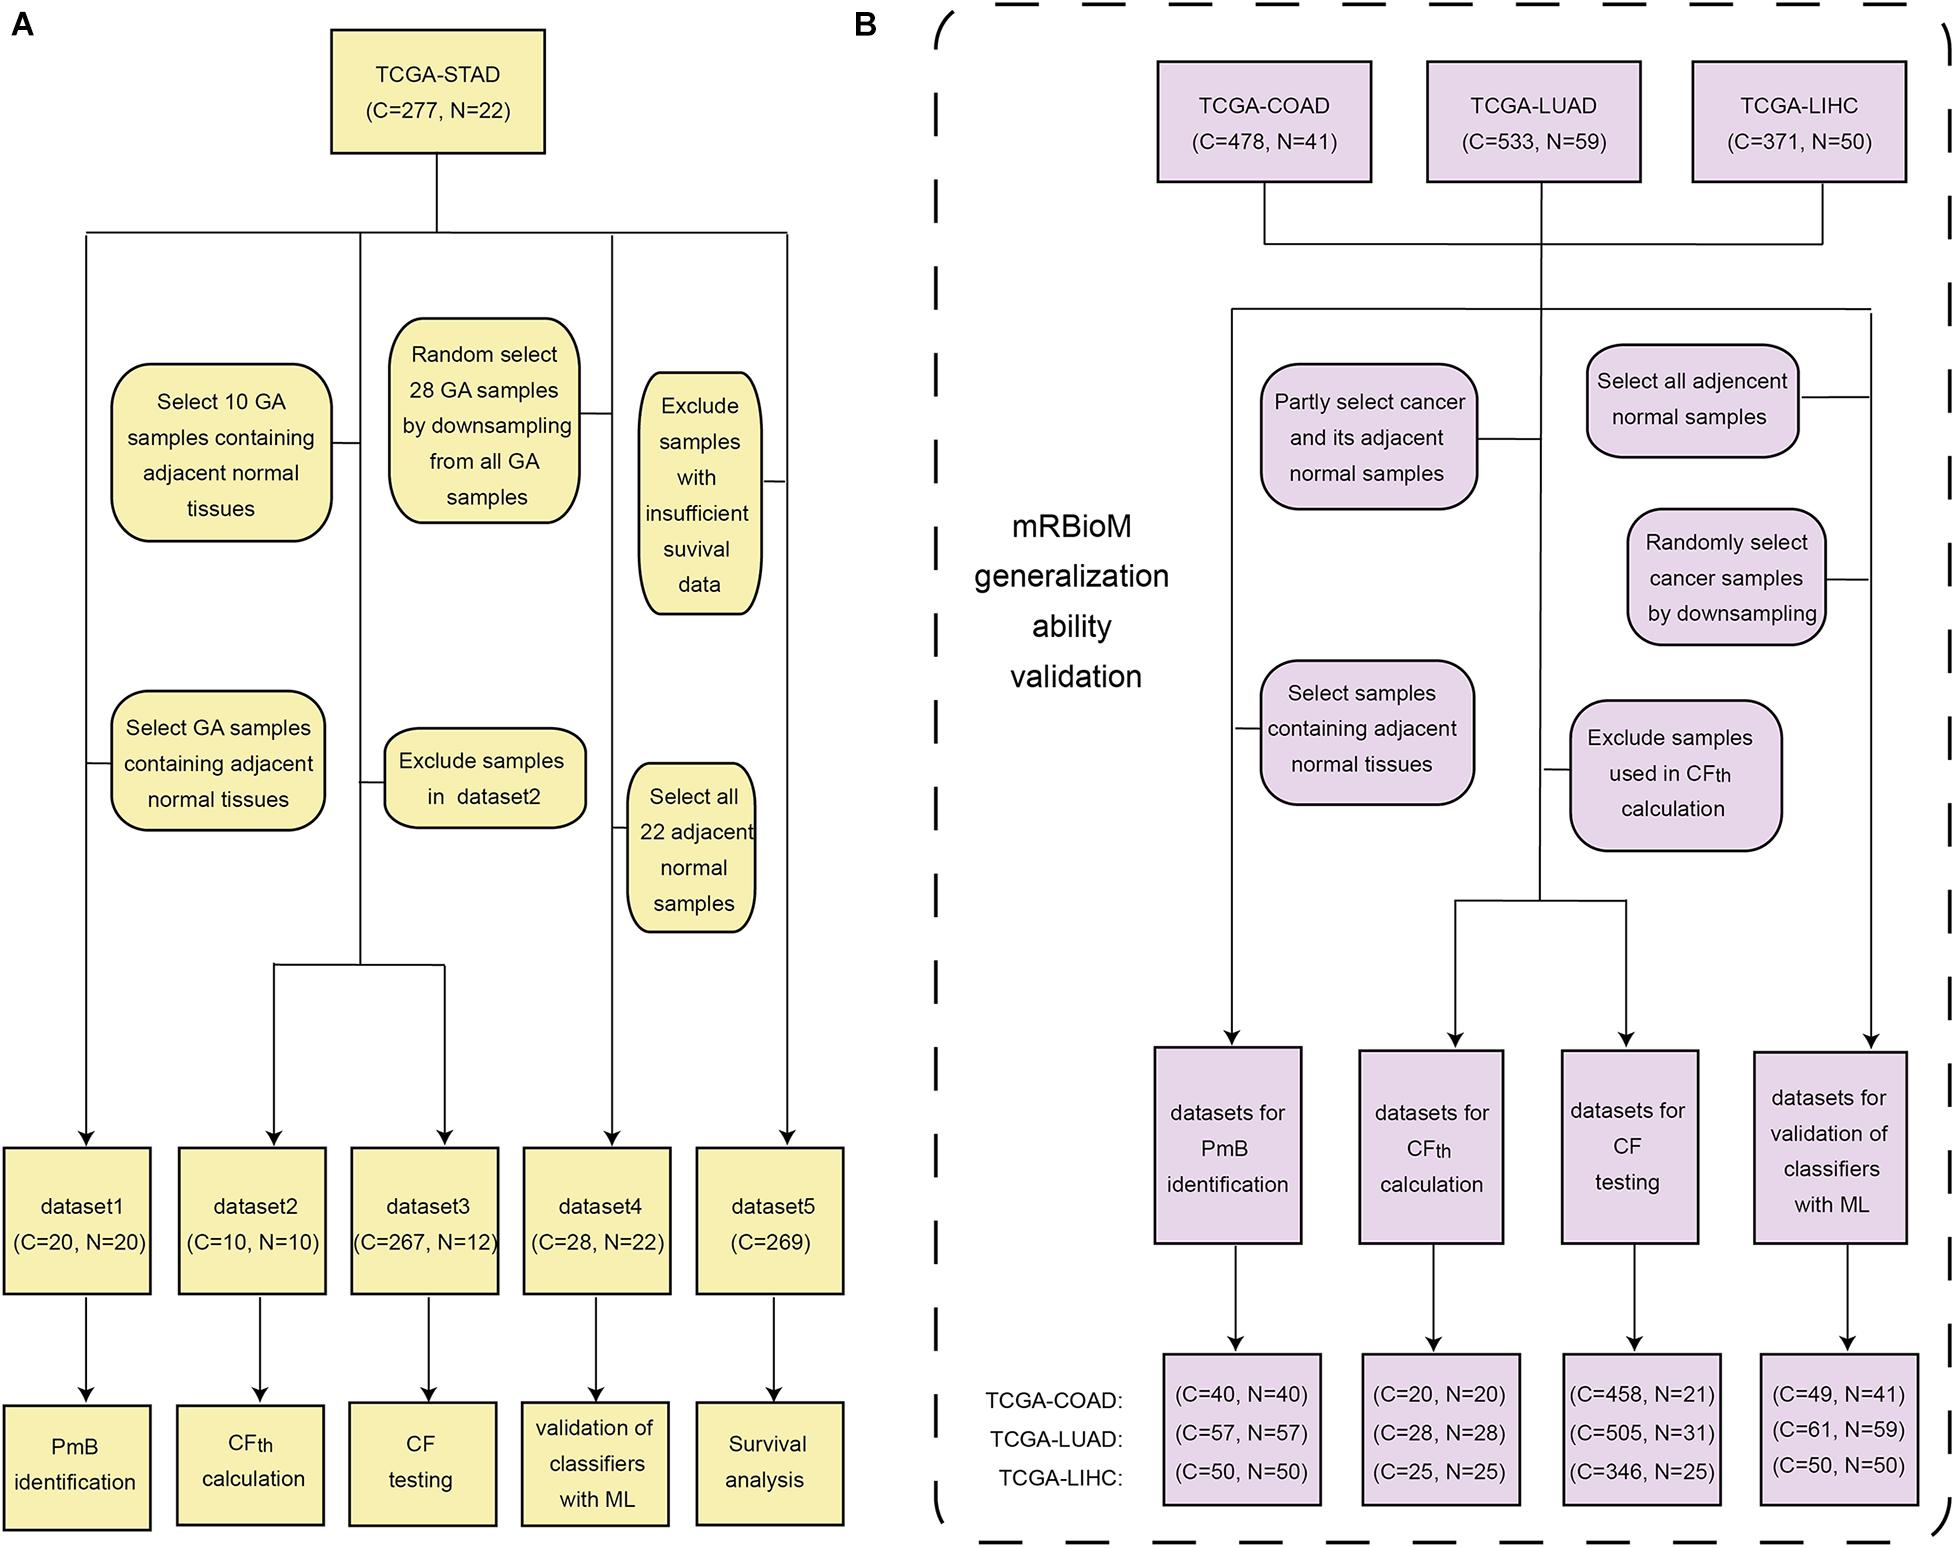
Figure 1. Data organization and utilization. (A) Five subsets from the TCGA-STAD dataset. (B) TCGA-COAD, TCGA-LUAD, and TCGA-LIHC. C, cancer sample; N, adjacent normal sample; CF, cancer-related factor; CFth, threshold of CF; ML, machine learning.
The amount of information for a molecule can determine whether this molecule is in a key position in the regulatory network (Teschendorff et al., 2014). Thus, mRBioM identified PmBs by evaluating the amount of information for each DE mRNA based on the transcriptional coexpression relationships between DE mRNAs, miRNAs, and lncRNAs and in the PPI network. The steps of the mRBioM algorithm are described below.
The limma package of R (Ritchie et al., 2015) was used to identify DE RNAs from dataset 1 containing 20 GA and 20 paracancer samples (a total of 40 samples) from TCGA-STAD. Dataset 1 was preprocessed by cleaning and standardization; next, the logarithm of the expression fold change (FC) of each RNA in GA vs. adjacent normal samples was calculated. The log2FC value and corresponding corrected p-value (represented by Padj) of each RNA were used to determine whether an RNA was differentially expressed. The screening conditions for DE RNAs in this study were Padj < 0. 05 or 0.01 and |log2FC | 1.
Suppose that we identified N, J, and K DE mRNAs, DE miRNAs, and DE lncRNAs, respectively. The expression vector of each DE RNA in all samples was extracted from dataset 1. Pearson correlation coefficients Mxy and Lxz between DE mRNA x(x = 1,⋅, N) and DE miRNA y(y = 1,⋅, J) and between DE mRNA x and DE lncRNA z(z = 1,⋅, K), respectively, were calculated according to Eqs. (1) and (2).
where xi, yi, and zi and , , and are the i-th element and the average value of all elements in the expression vectors of DE mRNA x, DE miRNA y, and DE lncRNA z, respectively. Pearson correlation coefficients between all DE mRNAs and DE miRNAs and between all DE mRNAs and DE lncRNAs constitute two correlation coefficient matrixes, which are represented by M (N × J) and L (N × K), respectively.
The connection of each molecule in the regulatory network is influenced by many factors, such as environment and diet, and has a degree of uncertainty that accounts for the amount of information for each molecule (Teschendorff et al., 2014). In this study, we propose to use the information rate of a DE mRNA in the transcriptional coexpression networks to measure the uncertainty of its connection and then use Shannon’s information entropy theory to estimate the amount of coexpression information for a DE mRNA.
The information rate for DE mRNA x in the coexpression network between DE mRNA and DE miRNA was defined as the ratio of a significant pearson correlation coefficient (p < 0.05) in the x-th line corresponding to DE mRNA x in M to the sum of all significant pearson correlation coefficients (p < 0.05) in the x-th line of M, which measures the correlation degree between a DE mRNA x and a DE miRNA y (y = 1,⋅, J’). All information rates for DE mRNA x associated with other DE miRNAs constitute the information rate vector px defined by Eq. (3). Similarly, the information rate vector qx for DE mRNA x in the coexpression network of DE mRNAs and DE lncRNAs is defined according to Eq. (4).
where nd L’x are the vectors composed of the pearson correlation coefficients with statistical p values less than 0.05 in the x-th row of M and L, respectively; M’xy (y = 1, 2,⋅, J’) and L’xz (z = 1, 2, ⋅, K’) are the pearson correlation coefficients with statistical p-values less than 0.05 in the x-th row of M and L, respectively; and J’ and K’ are the corresponding numbers.
According to Shannon’s information entropy theory, the amount of coexpression information for DE mRNA x (expressed as SRNAx) is estimated by Eq. (5).
where pxy is the y-th information rate in px, y = 1, 2, ⋅,J’; qxz is the z-th information rate in qx, z = 1, 2,⋅, K’.
We constructed a protein-protein interaction network based on the protein interaction information of all DE mRNAs acquired from the online STRING database1. Higher protein-protein connectivity score in the protein-protein interaction network corresponds to greater amount of interaction information between two proteins (Szklarczyk et al., 2019). Therefore, we used cs to measure the amount of protein interaction information (represented by SPPIx) that corresponds to DE mRNA x according to Eq. (6).
where csxj = 1) represents the connection score between a protein encoded by DE mRNA x and a protein encoded by another DE mRNA j (j∋N, j≠x).
The sum of SRNAx and SPPIx normalized by maximum was used as the total information amount of DE mRNA x (denoted by Sx) according to Eq. (7).
All DE mRNAs were sorted according to Sx (x = 1, 2 ⋅, N), and PmBs were identified based on the change trend of Sx (x = 1, 2⋅,N). The number of identified PmBs was recorded as Q. Gene Ontology (GO) enrichment and Kyoto Encyclopedia of Genes and Genomes (KEGG) pathway analyses of PmBs were performed by the clusterProfiler R package to investigate the functions of PmBs (Yu et al., 2012).
We designed four classifiers based on PmBs to discriminate the positive GA and negative control samples to illustrate the value of PmBs identified by mRBioM in auxiliary clinical diagnosis. The performance of the four classifiers was evaluated by sensitivity, specificity, and accuracy.
The cancer-related factor of a sample was determined by the expression values of PmBs in the samples and was used to discriminate the sample types. The cancer-related factor value of a sample was defined as the ratio of the average logarithm values of the expression of upregulated and downregulated PmBs in the sample according to Eq. (8).
where CF indicates the value of cancer-related factor. nupnd Exup(i) are the number of upregulated PmBs and the expression value of the i-th upregulated PmB in a sample, respectively. Similarly, ndnnd Exdn(j) are the number of downregulated PmBs and the expression value of the j-th downregulated PmB.
We randomly selected n (in this instance, n = 10) GA and adjacent normal samples from the mRNA expression profile of dataset 1 to identify the best CF threshold for discrimination of the positive and negative samples, and only the expression value of Q PmBs from each sample was used to form dataset 2 (C = 10, N = 10). Next, the expression profiles of 2n samples in dataset 2 were converted into a new expression profile containing n samples. The expression value vector Sm (dimension is 1 × n) of the m-th (m = 1, 2,⋅,Q) PmB in the synthetic expression profile was calculated according to Eq. (9).
where Stm (dimension is 1 × n) and Snm (dimension is 1 × n) are the expression value vectors of the GA and control samples in dataset 2 of m-th (m = 1, 2,⋅,Q) PmB, respectively. Stm(i) and Snm(i) are the i-th expression value elements (I = 1, 2,⋅,n) of Stm (dimension is 1 × n) and Snm (dimension is 1 × n), respectively.
Next, Eq. (8) was used to calculate the CF of the i-th sample in the generated expression profile (denoted as CFi, i = 1, 2,⋅,n), and the geometric mean value of the CF values of n samples (Eq. 10) was used as the threshold of CF (denoted as CFth).
Finally, the samples of dataset 2 were excluded from TCGA-STAD, and the remaining samples only with the expression values of Q PmB were used to form dataset 3 (C = 267, N = 12), which was used to test the ability of cancer-related factor to recognize the GA samples. If the CF of a sample was greater than CFth, the sample was identified as GA (positive); otherwise, the sample was identified as control (negative).
Three classifiers with machine learning based on random forest (RF) (Wang H. et al., 2020), support vector machine (SVM) (Zhang et al., 2017; Zhang and Liu, 2017), and naive Bayes (NB) (Dou et al., 2015) were constructed using the normalized expression values of PmBs as the classification feature implemented by randomForest R package (Liaw and Wiener, 2002), the svm function of the e1071 R package (Meyer et al., 2019), and the NaiveBayes function of the klaR R package (Weihs et al., 2005), respectively. Of course, there are other improved Bayesian models that can replace NB classification algorithms (Nagarajan et al., 2013; Thapa et al., 2018). Since the unbalanced sample size between the GA and control groups will affect the classification effect of the three classifiers, we used the downsampling method to randomly extract 28 samples from 277 GA samples and retain all 22 adjacent normal samples in TCGA-STAD, which formed validation dataset 4 (C = 28, N = 22). Finally, the performance of the three classifiers with machine learning was confirmed on dataset 4 by using the fivefold cross-validation method.
We excluded 10 patients with missing survival time or less than 30 day survival from the cohort of 279 patients in TCGA-STAD to exclude patients who died from other factors and finally used the transcription profiles of 269 GA patients with 55 PmBs to form dataset 5 for survival analysis. The average survival time of GA patients in dataset 5 was 21.575 ± 17.506 months, and 105 GA patients died at the end of follow-up, accounting for 39% of the total cohort.
Clinical information about patients (Supplementary Table 1) and dataset 5 (C = 269) were integrated, and a univariate Cox regression model of the survival R package (Peterschmitt et al., 2018) was used to identify survival-related PmBs that have a significant impact on survival time (p < 0.05); then, a multivariate Cox regression model was used to determine T survival-related PmBs to construct a prognostic risk model (Lossos et al., 2004) used to calculate the survival-based risk score of a patient (Eq. 11).
where ExpPmB(t) is the expression value of t-th survival-related PmB in the patient sample, and WPmB(t) is the corresponding multivariate Cox regression coefficient of t-th survival-related PmB, t = 1, 2,⋅, T.
Then, the median of the risk scores of all patients in dataset 5 was used as the cutoff value to divide the patients into the high- and low-risk groups. Finally, Kaplan–Meier analysis was used to assess the overall survival rate of patients in the high- and low-risk groups, and the log-rank test was used to determine whether there is a significant difference in the overall survival rate of patients in the high-risk vs. low-risk groups. In addition, we used the survivalROC package (Kamarudin et al., 2017) of R to perform ROC curve analysis to evaluate the sensitivity and specificity of the prognostic risk model.
A total of 170 DE mRNAs |log2FC(| 1, Padj < 0.01), 623 DE lncRNAs |log2FC(| 1, Padj < 0.05), and 52 DE miRNAs |log2FC(| > 1, Padj < 0.01) were obtained. Figure 2A shows the volcano plots of significantly DE RNAs, the details of all DE mRNAs are shown in Supplementary Table 2. And the results of the protein-protein interacti network analysis are shown in the attached file “string_protein_interactions_170.tsv.”
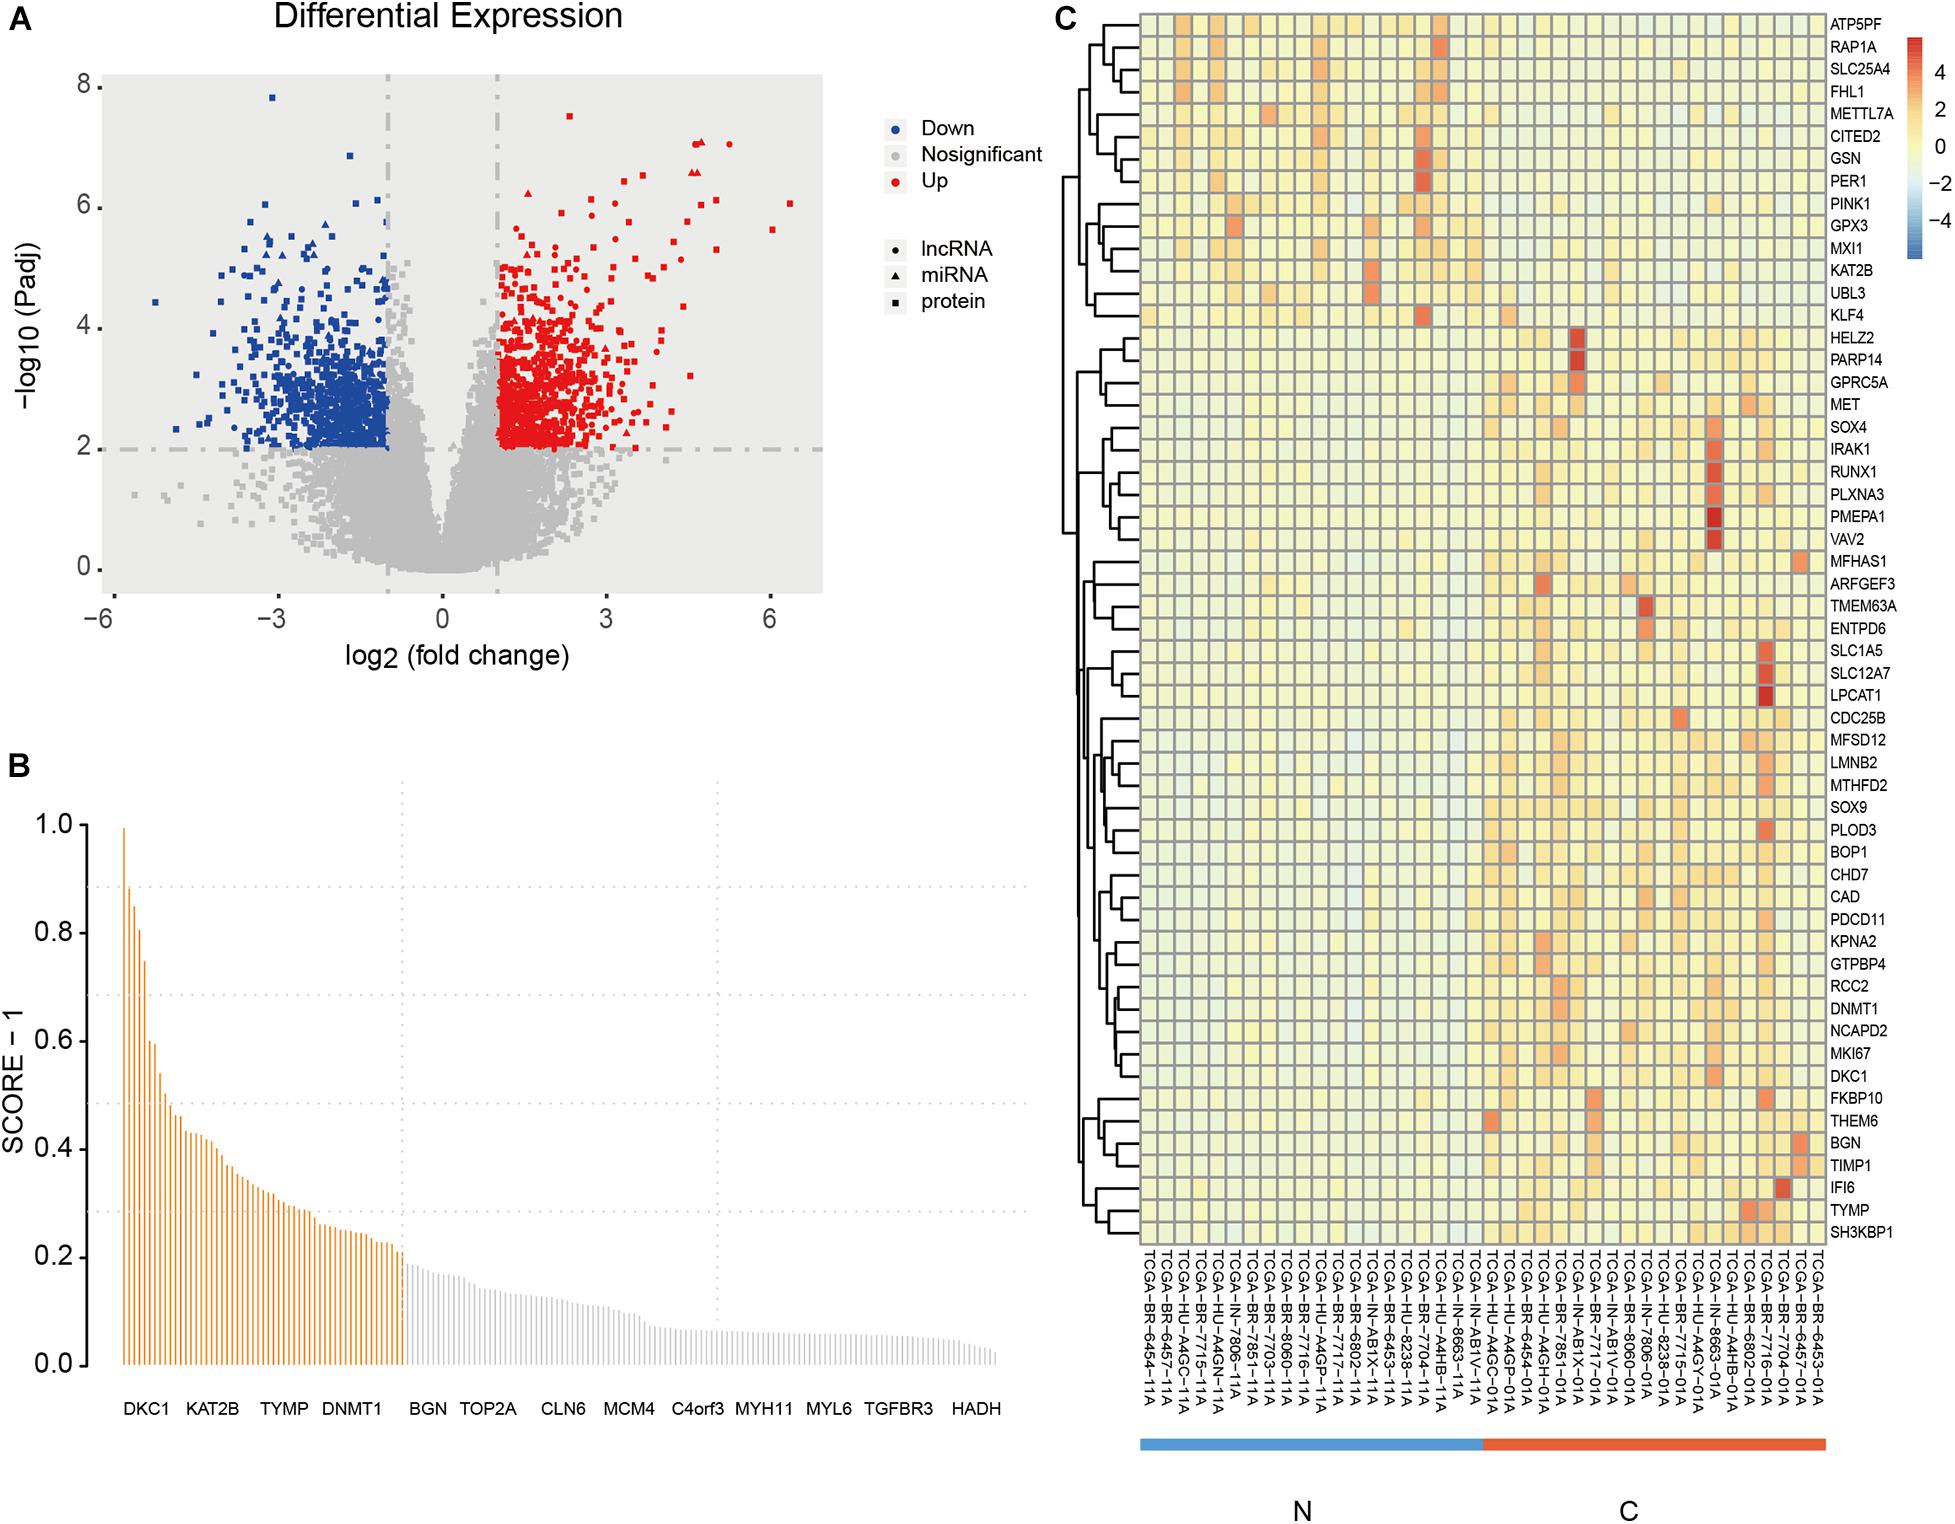
Figure 2. DE RNAs and the screening results of PmBs. (A) Volcano plot of DE RNAs (circles: DE mRNA, squares: DE miRNA, triangles: DE lncRNA); red dots represent up-regulated DE RNAs, and blue dots represent down-regulated DE RNAs. (B) The total information amount plot of DE mRNAs; the abscissa represents symbols of mRNA (part of the symbols is displayed), and the ordinate is the total information amount of each DE mRNA. (C) Heatmap of the PmBs of adjacent normal group vs. GA group. DE, differentially expressed; PmBs, potential mRNA biomarkers; N, adjacent normal sample; C, cancer sample; TIA, total amount of information.
The total information amount for each DE mRNA was calculated by mRBioM, and the curve constructed by total information amount of all DE mRNAs from large to small is shown in Figure 2B. There is a significant decrease of curve after the orange area and finally the curve tends to be stable. Therefore, a total of 55 DE mRNAs with total information amount corresponding to the orange region were identified as PmBs for further study (Table 2). A literature search confirmed that 13 PmBs were related to GA (23.64%), and 27 PmBs were related to other cancers (49.09%) (Table 2). The expression distribution of 55 PmBs is shown in Figure 2C, corresponding to 41 upregulated PmBs (lower right corner vs. lower left corner) and 14 downregulated PmBs (upper right corner vs. upper left corner).
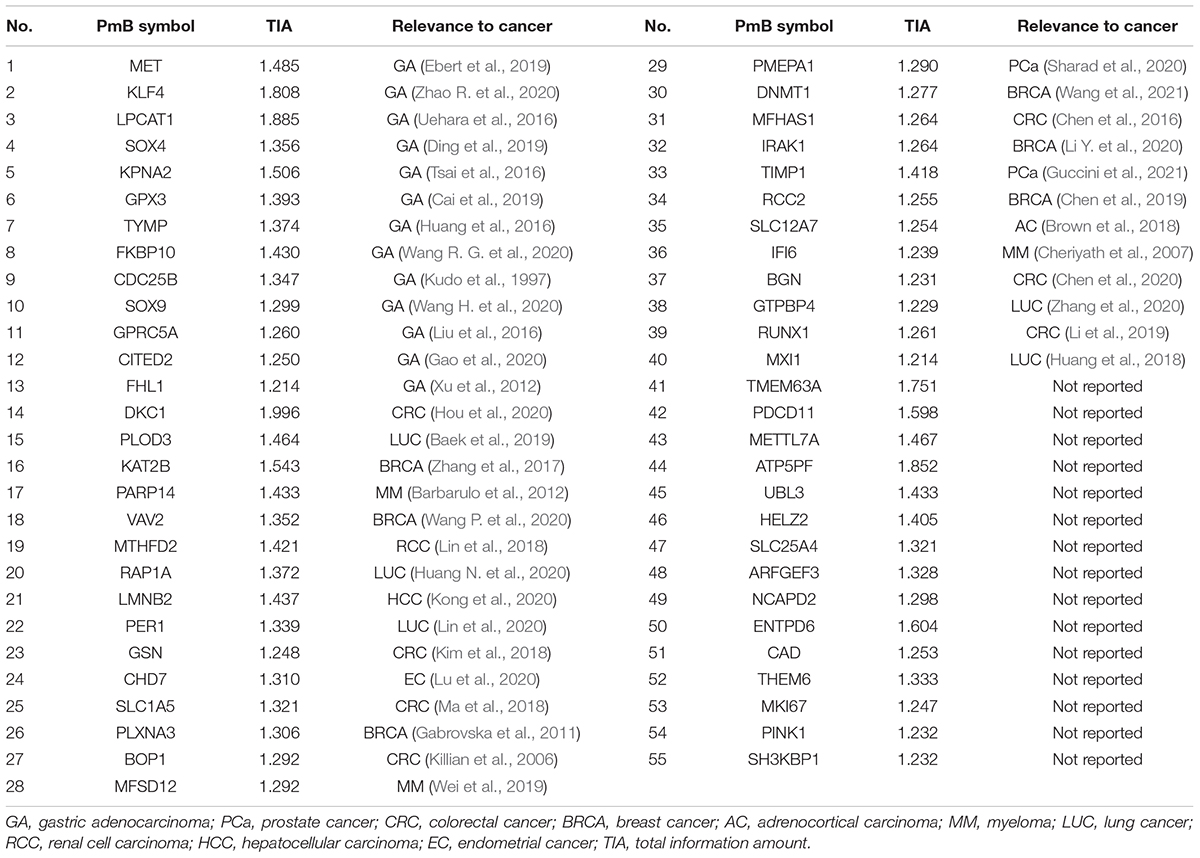
Table 2. The identified PmBs and their total information amount.
GO and KEGG functional enrichment analyses were performed by clusterProfiler of R using 55 PmBs to investigate the potential functions of these biomarkers. As shown in Figure 3A, the GO terms indicated that these 55 PmBs were mainly concentrated in chromatin binding (p < 0.05). The results of KEGG analysis with p < 0.05 suggested that these 55 PmBs were mainly related to pathways closely associated with occurrence and development of cancer, such as mitophagy-animal, ribosome biogenesis in eukaryotes, MAPK signaling pathway, cAMP signaling pathway, central carbon metabolism, microRNAs in cancer, and renal cell carcinoma (Figure 3B).
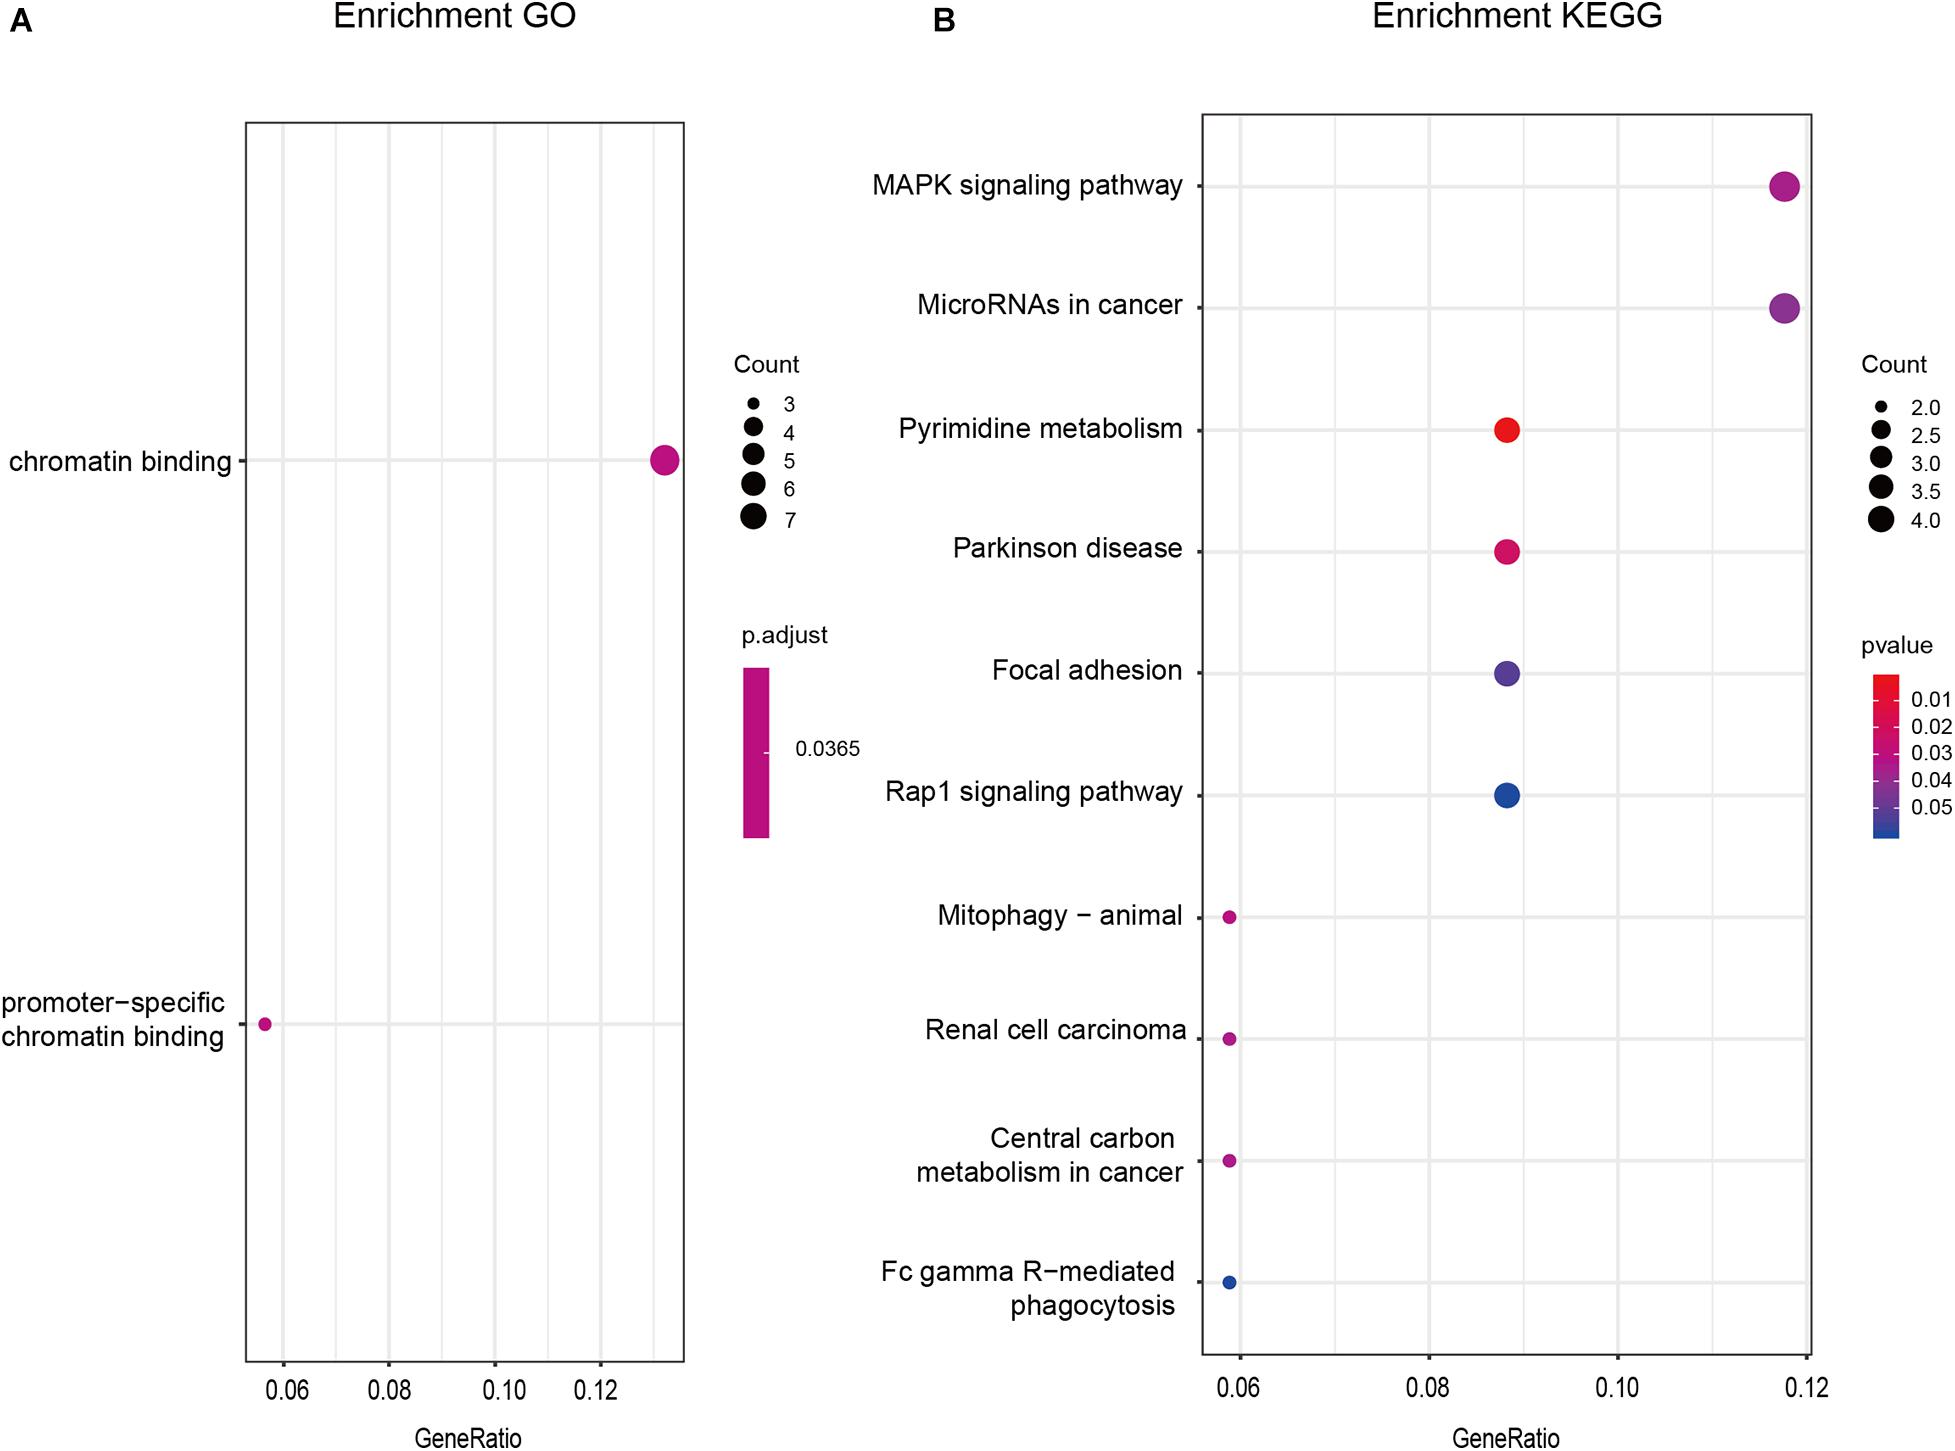
Figure 3. GO and KEGG enrichment analysis of PmBs. (A) GO enrichment analysis. (B) KEGG enrichment analysis. GO, Gene Ontology; KEGG, Kyoto Encyclopedia of Genes and Genomes; GA, gastric adenocarcinoma.
CFth of dataset 2 was 0.9725, and the remaining samples in TCGA-STAD formed dataset 3 to test the sample classification power of cancer-related factor (Table 3). Table 3 shows that accuracy, sensitivity, and specificity achieved by cancer-related factor were 0.90, 0.89, and 1, respectively. The ROC curve of cancer-related factor is shown in Figure 4A, and the area under the ROC curve (AUC) reached 0.9494. The cancer-related factor constructed by PmBs has high specificity and sensitivity and low computational complexity and does not require training; thus, it has great potential application in auxiliary clinical diagnosis.
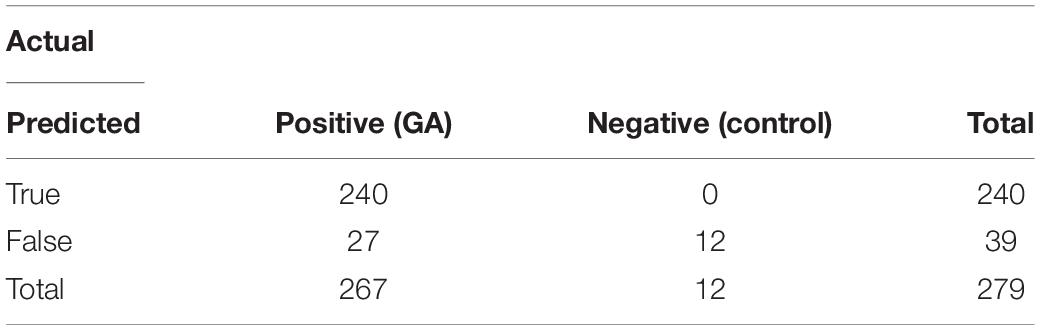
Table 3. Performance of cancer-related factor.
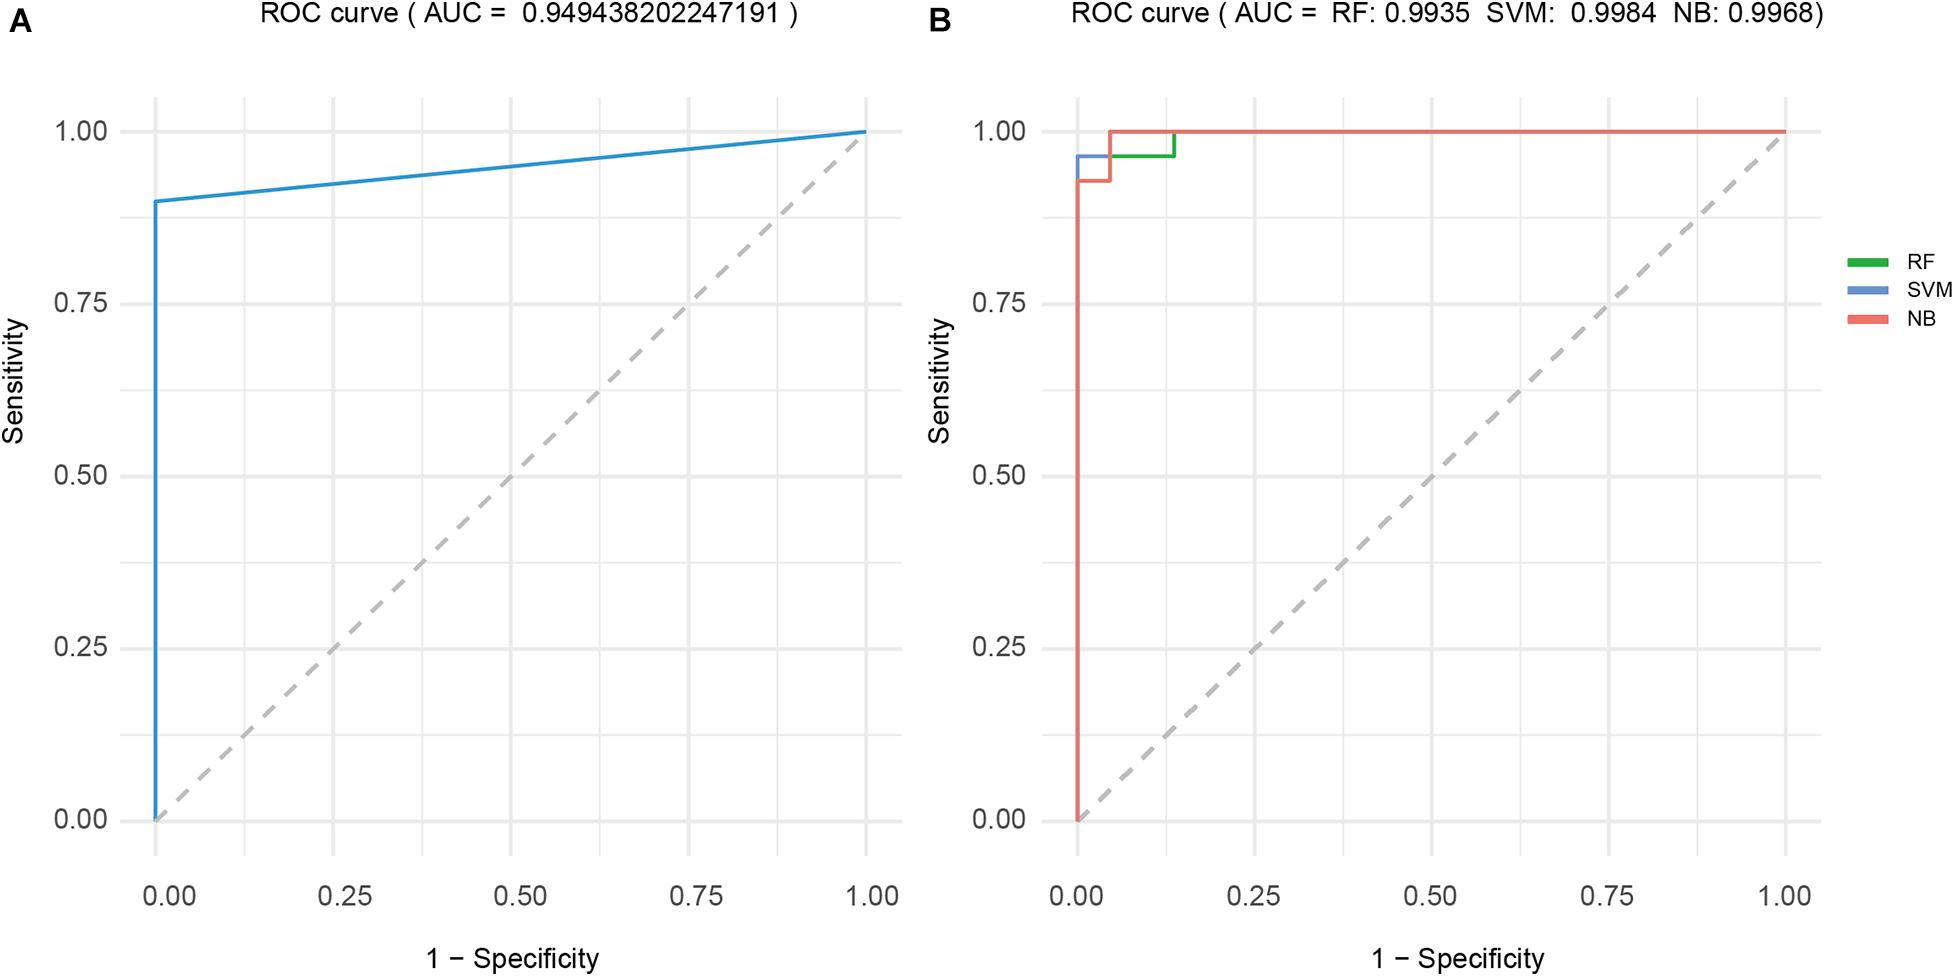
Figure 4. ROC curve analysis for the four classifiers. (A) CF. (B) RF-based, SVM-based and NB-based classifiers. ROC, receiver operating characteristic; CF, cancer factor; RF, random forest; SVM, support vector machine; NB, naive Bayes.
The results of fivefold cross-validation of RF-based, SVM-based, and NB-based classifiers using dataset 4 are shown in Table 4. Average accuracy, sensitivity, and specificity of the RF-based, SVM-based, and NB-based classifiers were 0.94, 0.98, and 0.96, 0.94, 0.97, and 0.94, and 1, 1, and 0.97, respectively. The average ROC curves of the three classifiers are shown in Figure 4B, and all three AUCs were above 0.99. This finding provides further proof that PmBs can be potential markers related to GA.
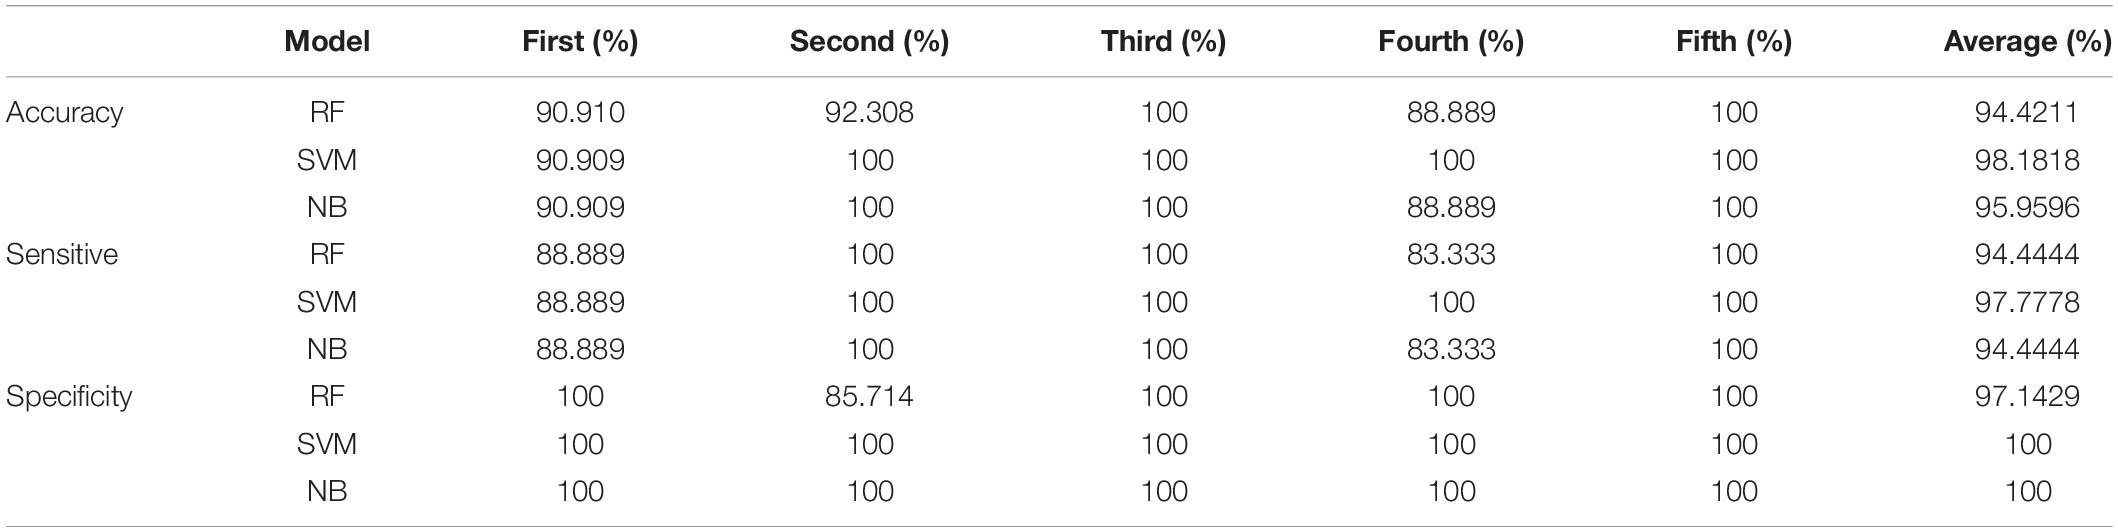
Table 4. Results of fivefold cross-validation of three classifiers with machine learning.
Fourteen survival-related PmBs (LMNB2, BGN, IRAK1, MFSD12, FKBP10, SOX4, SLC12A7, DNMT1, SLC1A5, TIMP1, ENTPD6, GPX3, HELZ2, and PMEPA1) were identified by univariate Cox regression analysis, and the detailed results are shown in Supplementary Table 3. Multivariate Cox regression analysis identified LMNB2, BGN, MFSD12, and SOX4 (refer to Supplementary Table 4), which can be used to construct a prognostic risk model. The risk score of the i-th (i = 1, 2,⋅, 269) GA sample was calculated as follows:
Where Expα(i) (α is LMNB2, BGN, MFSD12, or SOX4) is the expression value of a survival-related PmB in the i-th GA sample.
The median of the risk scores of all GA samples −(34 in this case) was used as the cutoff value, and 269 patients were divided into the high-risk (>−34, n = 134) and low-risk groups (<−8.34, n = 135). Kaplan-Meier survival analysis of patients in the high- and low-risk groups showed that the difference between the two groups was significant (p < 0.0001). As shown in Figure 5A, the average survival time of patients inhe high-risk group was shorter, and the number of deaths was higher than those of patients in the low-risk group. In addition, the results of ROC analysis showed that the AUC value of the prognostic risk model constructed using 4 PmBs was 0.7742 (Figure 5B), suggesting good specificity and sensitivity.
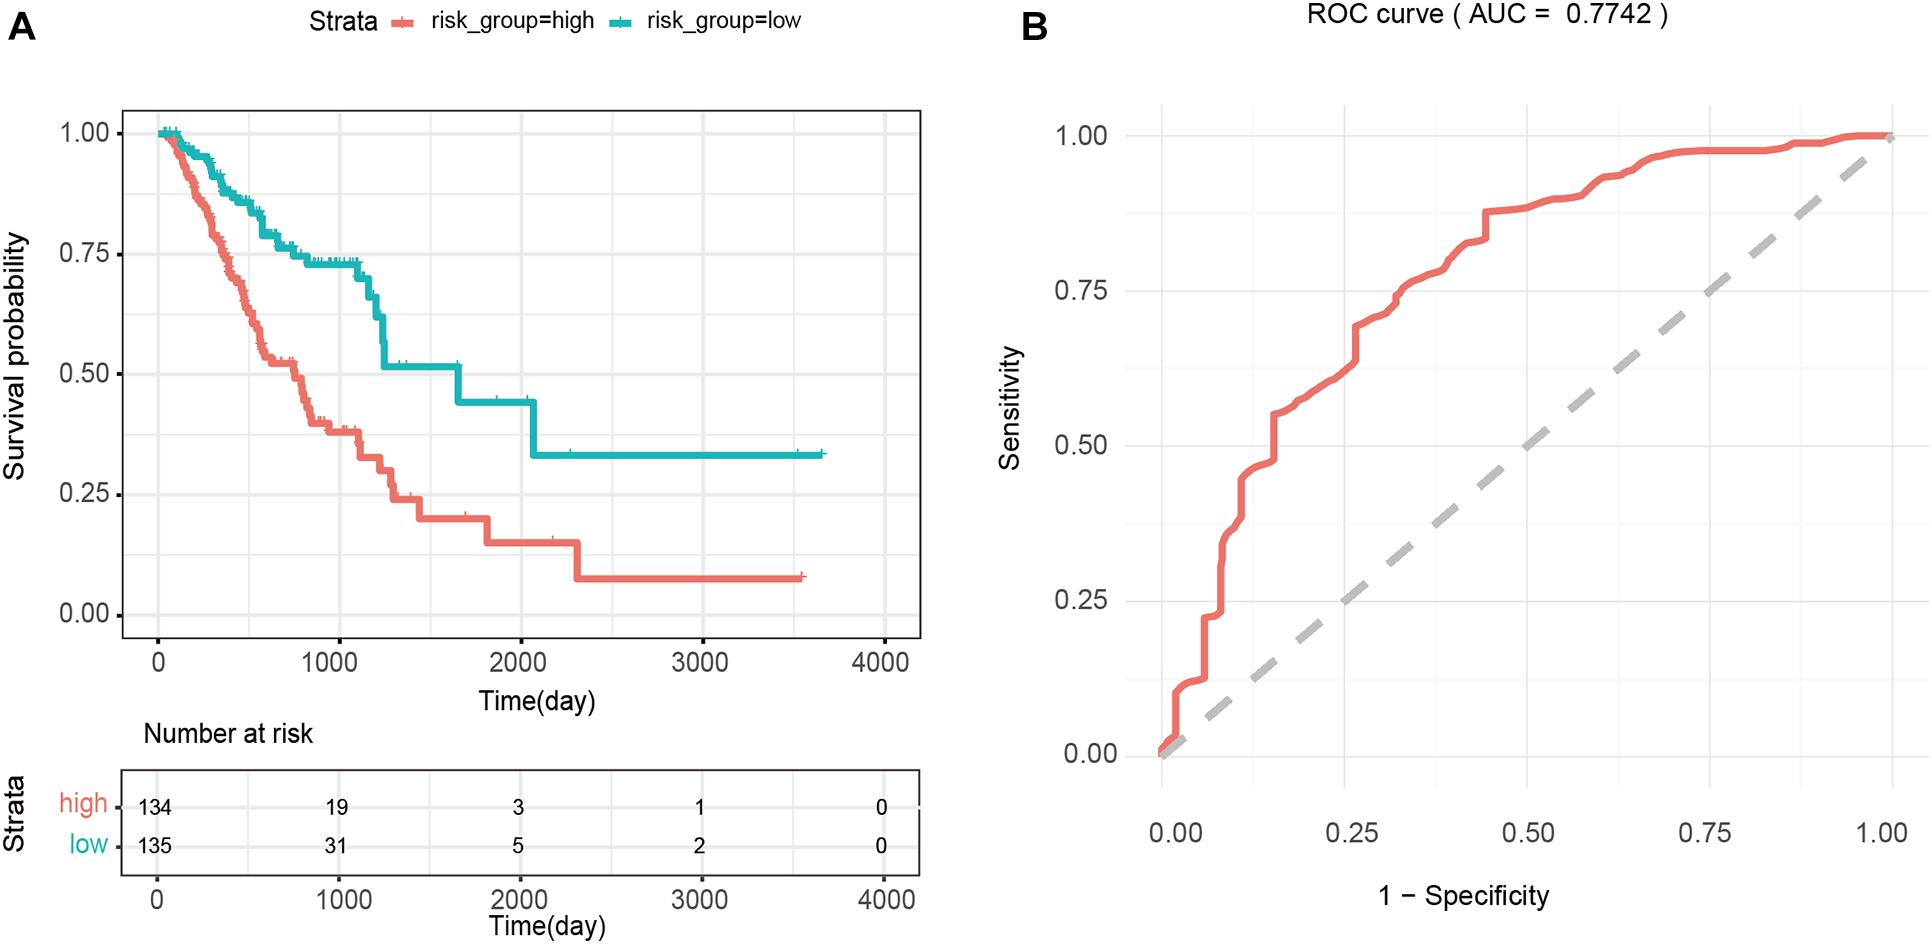
Figure 5. Survival analysis based on four prognostic PmBs. (A) Kaplan–Meier curves analysis for overall survival of patients between the high- and low-risk groups; the upper panel represents the Kaplan-Meier curve for the high and low risk groups, the lower panel shows the cumulative number of deaths. (B) ROC analysis for prognostic risk model with the 4 PmBs.
Generalization ability of mRBioM was assessed on three other complete transcriptomic datasets, including TCGA-COAD (colonic adenocarcinoma), TCGA-LUAD (lung adenocarcinoma), and TCGA-LIHC (hepatocellular carcinoma), downloaded from the TCGA database, and the results are shown in Table 5. Average accuracy and sensitivity of CF were between 0.92 and 0.99, and average specificity was 1. Average accuracy and sensitivity of the RF-based, SVM-based, and NB-based classifiers were between 0.94 and 0.99, and average specificity was above 0.95. Therefore, the classifiers constructed with PmBs have good sample classification power in 3 other cancer datasets, indicating that the mRBioM algorithm has good generalization ability and can effectively identify potential cancer-related mRNA markers in other cancers.
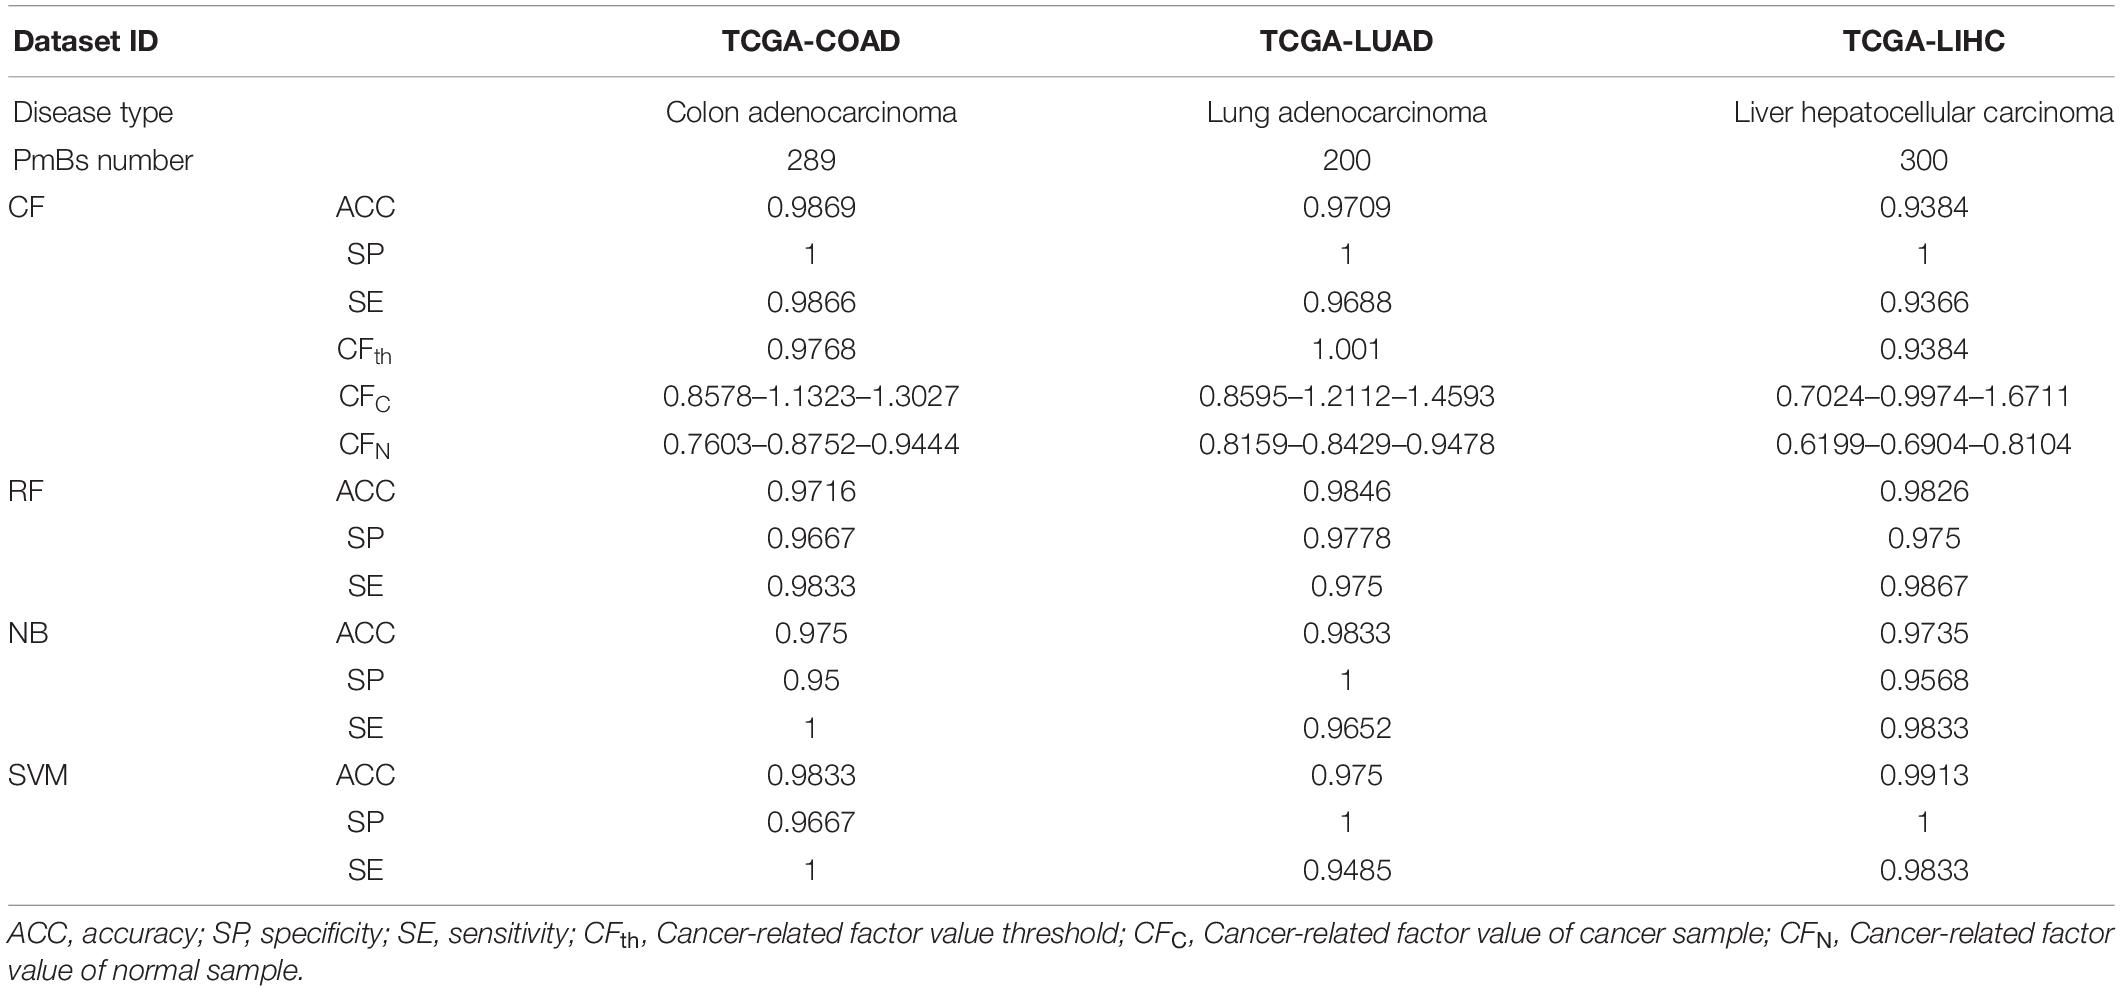
Table 5. Generalization ability verification results.
This study proposed the mRBioM algorithm to identify potential mRNA biomarkers from the complete transcriptomic RNA profiles of GA. Unlike existing algorithms, mRBioM evaluates the potential of each DE mRNA as a biomarker by combining the corresponding amount of information at the transcription and protein levels based on the information entropy theory. Fifty-five DE mRNAs were identified as PmBs associated with GA. These 55 PmBs were used to construct four sample classifiers, including cancer-related factor, RF-based, SVM-based, and NB-based classifiers, to illustrate the reliability of PmBs identified by mRBioM. Good sensitivity, specificity, and accuracy of classification were achieved by the four classifiers. Four of fifty-five PmBs had good ability for prognostic evaluation of the overall survival of GA patients. TCGA-COAD, TCGA-LUAD, and TCGA-LIHC datasets confirmed the generalization ability of mRBioM. The classifiers constructed by the identified PmBs suggested good performance in a variety of classification algorithms and cancer-related datasets, which is expected to be used in more researches on cancer-related biomarker identification.
Thirteen of 55 PmBs (Table 2) were confirmed by the data of the literature to play certain roles in occurrence and development of GA and were biomarkers or potential therapeutic targets of GA. For example, GPRC5A and SOX9 have been shown to be related to occurrence and development of GA (Liu et al., 2016; Wang H. et al., 2020), and their expression levels changed more than fourfold in the GA vs. adjacent control samples according to the result of DE RNA analysis (log2FC > 2). FCMET has been confirmed as a resistance factor in GA (Ebert et al., 2019), and Wang R. G. et al. (2020) demonstrated that FKBP10 may be a crucial player mediating cell proliferation, invasion, and migration by regulating the PI3K signaling pathway in GA. Twenty-seven of 55 PmBs (Table 2) were shown to be associated with other cancers according to the data of the literature. Thus, mRBioM identified some new GA-related mRNAs. We attempted to extract additional DE mRNAs as PmBs related to GA. However, adding PmBs did not improve the classification powers of the four classifiers, and these extra PmBs were not associated with prognosis. Thus, our strategy for PmBs screening according to the change trend of the total information amount for all PmBs was effective.
Notably, the value ranges of the cancer-related factor calculated in most cancer and adjacent normal samples of four cancer-related datasets were 0.9–1.4 and 0.7–0.9, respectively. Additionally, the thresholds of cancer-related factors (CFth) in all four datasets were approximately 1. The values of cancer-related factors and their corresponding thresholds showed good consistency and robustness in all four datasets. Although the classification performance of cancer-related factor is slightly worse than that of three classifiers with machine learning, the approach does not require training and has considerably lower computational complexity than that of three classifiers with machine learning. Importantly, the method requires only a small number of cancer and adjacent samples to determine the threshold and evaluates whether a single sample corresponds to cancer. Thus, the cancer-related factor may have good application prospects in the personalized diagnosis of cancers.
LMNB2, BGN, MFSD12, and SOX4 in 55 GA-related PmBs were identified and combined into a prognostic risk scoring model. There is no experimental evidence that LMNB2, BGN, and MFSD12 in this combination are associated with GA, and these are new PmBs identified in this study. LMNB2 belongs to the lamin family and is closely related to occurrence, development, and prognosis of liver cancer (Kong et al., 2020; Li X. N. et al., 2020). BGN is an important member of the leucine-rich small proteoglycan family and an important component of the extracellular matrix. Clinical studies have shown that upregulation of BGN is related to poor prognosis of patients with various types of cancer syndromes (Zhao S. F. et al., 2020). MFSD12, also known as PP3501, is a nuclear protein (Wang et al., 2012). Bioinformatic analysis revealed that upregulated expression of MFSD12 is a key promoter of cell proliferation, potential prognostic biomarker, and therapeutic target for melanoma (Wei et al., 2019). SOX4 is a key transcription factor involved in occurrence and development of many cancers (Liu et al., 2018; Wang et al., 2018; Ding et al., 2019) and was shown to be related to the proliferation, migration, and invasion of GA cells and prognosis of GA patients (Fang et al., 2012; Dong et al., 2018; Shao et al., 2020). Therefore, the model has good sensitivity and specificity (AUC = 0.7742), and the risk score calculated by the model can effectively predict the risk of GA patients (p < 0.0001, hazard ratio = 2.845, 95% CI: 2.033–3.981).
In conclusion, our study proposes an mRBioM algorithm to identify PmBs from the complete transcriptomic RNA profiles of GA by integrating and analyzing the information at transcriptome and proteome levels. mRBioM identified 55 PmBs related to the occurrence, development and prognosis of GA, which may provide potential biomarkers for early diagnosis, treatment, and prognosis of GA. mRBioM can also be applied in other cancers for cancer-related biomarker identification. But this study also has several limitations. mRBioM is a computational method, and reliability of GA-related PmBs identified by mRBioM was confirmed only by computational methods; thus, further experimental studies are needed to verify the clinical value of identified GA-related PmBs.
The original contributions presented in the study are included in the article/Supplementary Material, further inquiries can be directed to the corresponding author/s.
Ethical review and approval was not required for the study on human participants in accordance with the local legislation and institutional requirements. The patients/participants provided their written informed consent to participate in this study.
CD and NR designed the study and wrote the manuscript. CD, FG, and XL conducted the computer experiments. NR, WD, GW, and JZ analyzed the results and revised and offered advice about the manuscript. All authors participated in the critical review, revision of this manuscript, contributed to the article, and approved the submitted version.
The present study was funded by the National Natural Science Foundation of China (61872405 and 61720106004) and the Key R&D Project of Sichuan Province (2020YFS0243).
The authors declare that the research was conducted in the absence of any commercial or financial relationships that could be construed as a potential conflict of interest.
All claims expressed in this article are solely those of the authors and do not necessarily represent those of their affiliated organizations, or those of the publisher, the editors and the reviewers. Any product that may be evaluated in this article, or claim that may be made by its manufacturer, is not guaranteed or endorsed by the publisher.
The Supplementary Material for this article can be found online at: https://www.frontiersin.org/articles/10.3389/fgene.2021.679612/full#supplementary-material
mRBioM, mRNA Biomarkers; GA, gastric adenocarcinoma; PmBs, potential mRNA biomarkers; DE, differentially expressed; FC, fold change; GO, Gene Ontology; KEGG, Kyoto Encyclopedia of Genes and Genomes; RF, random forest; SVM, support vector machine; NB, naive Bayes; AUC, area under the ROC curve.
Baek, J. H., Yun, H. S., Kwon, G. T., Lee, J., Kim, J. Y., Jo, Y., et al. (2019). PLOD3 suppression exerts an anti-tumor effect on human lung cancer cells by modulating the PKC-delta signaling pathway. Cell Death Dis. 10:156. doi: 10.1038/s41419-019-1405-8
Barbarulo, A., Iansante, V., Chaidos, A., Naresh, K., and Bubici, C. (2012). Poly(ADP-ribose) polymerase family member 14 (PARP14) is a novel effector of the JNK2-dependent pro-survival signal in multiple myeloma. Oncogene 32, 4231–4242. doi: 10.1038/onc.2012.448
Bartel, D. P. (2009). MicroRNAs: target recognition and regulatory functions. Cell 136, 215–233. doi: 10.1016/j.cell.2009.01.002
Bray, F., Ferlay, J., Soerjomataram, I., Siegel, R. L., Torre, L. A., and Jemal, A. (2018). Global cancer statistics 2018: GLOBOCAN estimates of incidence and mortality worldwide for 36 cancers in 185 countries. CA Cancer J. Clin. 68, 394–424. doi: 10.3322/caac.21492
Brown, T. C., Murtha, T. D., Rubinstein, J. C., Korah, R., and Carling, T. (2018). SLC12A7 alters adrenocortical carcinoma cell adhesion properties to promote an aggressive invasive behavior. Cell Commun. Signal. 16:27. doi: 10.1186/s12964-018-0243-0
Cai, M., Sikong, Y., Wang, Q., Zhu, S., Pang, F., and Cui, X. (2019). Gpx3 prevents migration and invasion in gastric cancer by targeting NFsmall ka, CyrillicB/Wnt5a/JNK signaling. Int. J. Clin. Exp. Pathol. 12, 1194–1203.
Chen, D., Qin, Y., Dai, M., Li, L., Liu, H., Zhou, Y., et al. (2020). BGN and COL11A1 regulatory network analysis in colorectal cancer (CRC) reveals that BGN influences CRC cell biological functions and interacts with miR-6828-5p. Cancer Manag. Res. 12, 13051–13069. doi: 10.2147/CMAR.S277261
Chen, W., Xu, Y., Zhong, J., Wang, H., Weng, M., Cheng, Q., et al. (2016). MFHAS1 promotes colorectal cancer progress by regulating polarization of tumor-associated macrophages via STAT6 signaling pathway. Oncotarget 7, 78726–78735. doi: 10.18632/oncotarget.12807
Chen, Z., Wu, W., Huang, Y., Xie, L., Li, Y., Chen, H., et al. (2019). RCC2 promotes breast cancer progression through regulation of Wnt signaling and inducing EMT. J. Cancer 10, 6837–6847. doi: 10.7150/jca.36430
Cheriyath, V., Glaser, K. B., Waring, J. F., Baz, R., Hussein, M. A., and Borden, E. C. (2007). G1P3, an IFN-induced survival factor, antagonizes TRAIL-induced apoptosis in human myeloma cells. J. Clin. Invest. 117, 3107–3117. doi: 10.1172/JCI31122
Collins, F. S., and Varmus, H. (2015). A new initiative on precision medicine. N. Engl. J. Med. 372, 793–795. doi: 10.1056/NEJMp1500523
Ding, L., Zhao, Y., Dang, S., Wang, Y., Li, X., Yu, X., et al. (2019). Circular RNA circ-DONSON facilitates gastric cancer growth and invasion via NURF complex dependent activation of transcription factor SOX4. Mol. Cancer 18:45. doi: 10.1186/s12943-019-1006-2
Dong, X., Chen, R., Lin, H., Lin, T., and Pan, S. (2018). lncRNA BG981369 inhibits cell proliferation, migration, and invasion, and promotes cell apoptosis by SRY-related high-mobility group box 4 (SOX4) signaling pathway in human gastric cancer. Med. Sci. Monit. 24, 718–726. doi: 10.12659/msm.905965
Dou, Y., Guo, X., Yuan, L., Holding, D. R., and Zhang, C. (2015). Differential expression analysis in RNA-Seq by a naive bayes classifier with local normalization. Biomed. Res. Int. 2015:789516. doi: 10.1155/2015/789516
Duan, F., Mei, C., Yang, L., Zheng, J., Lu, H., Xia, Y., et al. (2020). Vitamin K2 promotes PI3K/AKT/HIF-1alpha-mediated glycolysis that leads to AMPK-dependent autophagic cell death in bladder cancer cells. Sci. Rep. 10:7714. doi: 10.1038/s41598-020-64880-x
Ebert, K., Mattes, J., Kunzke, T., Zwingenberger, G., and Luber, B. (2019). MET as resistance factor for afatinib therapy and motility driver in gastric cancer cells. PLoS One 14:e0223225. doi: 10.1371/journal.pone.0223225
Fang, C. L., Hseu, Y. C., Lin, Y. F., Hung, S. T., Tai, C., Uen, Y. H., et al. (2012). Clinical and prognostic association of transcription factor SOX4 in gastric cancer. PLoS One 7:e52804. doi: 10.1371/journal.pone.0052804
Gabrovska, P. N., Smith, R. A., Tiang, T., Weinstein, S. R., Haupt, L. M., and Griffiths, L. R. (2011). Semaphorin–plexin signalling genes associated with human breast tumourigenesis. Gene 489, 63–69. doi: 10.1016/j.gene.2011.08.024
Gao, Y., Xie, M., Guo, Y., Yang, Q., Hu, S., and Li, Z. (2020). Long non-coding RNA FGD5-AS1 regulates cancer cell proliferation and chemoresistance in gastric cancer through miR-153-3p/CITED2 Axis. Front. Genet 11:715. doi: 10.3389/fgene.2020.00715
Guccini, I., Revandkar, A., D’Ambrosio, M., Colucci, M., Pasquini, E., Mosole, S., et al. (2021). Senescence Reprogramming by TIMP1 Deficiency Promotes Prostate Cancer Metastasis. Cancer Cell 39, 68–82.e9. doi: 10.1016/j.ccell.2020.10.012
Hou, P., Shi, P., Jiang, T., Yin, H., Chu, S., Shi, M., et al. (2020). DKC1 enhances angiogenesis by promoting HIF-1alpha transcription and facilitates metastasis in colorectal cancer. Br. J. Cancer 122, 668–679. doi: 10.1038/s41416-019-0695-z
Hu, Y., Zhang, Y., Ding, M., and Xu, R. (2020). LncRNA TMPO-AS1/miR-126-5p/BRCC3 axis accelerates gastric cancer progression and angiogenesis via activating PI3K/Akt/mTOR pathway. J. Gastroenterol. Hepatol. doi: 10.1111/jgh.15362 [Epub ahead of print],
Huang, C., Zhao, J., Luo, C., and Zhu, Z. (2020). Overexpression of DGKI in gastric cancer predicts poor prognosis. Front. Med. (Lausanne) 7:320. doi: 10.3389/fmed.2020.00320
Huang, L., Liu, S., Lei, Y., Wang, K., Xu, M., Chen, Y., et al. (2016). Systemic immune-inflammation index, thymidine phosphorylase and survival of localized gastric cancer patients after curative resection. Oncotarget 7, 44185–44193. doi: 10.18632/oncotarget.9923
Huang, N., Dai, W., Li, Y., Sun, J., Ma, C., and Li, W. (2020). LncRNA PCAT-1 upregulates RAP1A through modulating miR-324-5p and promotes survival in lung cancer. Arch. Med. Sci. 16, 1196–1206. doi: 10.5114/aoms.2019.84235
Huang, Y., Hu, K., Zhang, S., Dong, X., Yin, Z., Meng, R., et al. (2018). S6K1 phosphorylation-dependent degradation of Mxi1 by beta-Trcp ubiquitin ligase promotes Myc activation and radioresistance in lung cancer. Theranostics 8, 1286–1300. doi: 10.7150/thno.22552
Kamarudin, A. N., Cox, T., and Kolamunnage-Dona, R. (2017). Time-dependent ROC curve analysis in medical research: current methods and applications. BMC Med. Res. Methodol. 17:53. doi: 10.1186/s12874-017-0332-6
Killian, A., Sarafan-Vasseur, N., Sesboue, R., Le Pessot, F., Blanchard, F., Lamy, A., et al. (2006). Contribution of the BOP1 gene, located on 8q24, to colorectal tumorigenesis. Genes Chromosomes Cancer 45, 874–881. doi: 10.1002/gcc.20351
Kim, J. C., Ha, Y. J., Tak, K. H., Roh, S. A., Kwon, Y. H., Kim, C. W., et al. (2018). Opposite functions of GSN and OAS2 on colorectal cancer metastasis, mediating perineural and lymphovascular invasion, respectively. PLoS One 13:e0202856. doi: 10.1371/journal.pone.0202856
Kong, W., Wu, Z., Yang, M., Zuo, X., Yin, G., and Chen, W. (2020). LMNB2 is a prognostic biomarker and correlated with immune infiltrates in hepatocellular carcinoma. IUBMB Life 72, 2672–2685. doi: 10.1002/iub.2408
Kudo, Y., Yasui, W., Ue, T., Yamamoto, S., Yokozaki, H., Nikai, H., et al. (1997). Overexpression of Cyclin-dependent Kinase-activating CDC25B Phosphatase in Human Gastric Carcinomas. Jpn. J. Cancer Res. 88, 947–952. doi: 10.1111/j.1349-7006.1997.tb00313.x
Lawrence, W. (2004). Gastric adenocarcinoma. Curr. Treat. Options Gastroenterol. 7, 149–157. doi: 10.1007/s11938-004-0036-y
Li, Q., Lai, Q., He, C., Fang, Y., Yan, Q., Zhang, Y., et al. (2019). RUNX1 promotes tumour metastasis by activating the Wnt/beta-catenin signalling pathway and EMT in colorectal cancer. J. Exp. Clin. Cancer Res. 38:334. doi: 10.1186/s13046-019-1330-9
Li, X. N., Yang, H., and Yang, T. (2020). miR-122 inhibits hepatocarcinoma cell progression by targeting LMNB2. Oncol. Res. 28, 41–49. doi: 10.3727/096504019X15615433287579
Li, Y., Li, W., Lin, J., Lv, C., and Qiao, G. (2020). miR-146a enhances the sensitivity of breast cancer cells to paclitaxel by downregulating IRAK1. Cancer Biother. Radiopharm. doi: 10.1089/cbr.2020.3873 [Epub ahead of print],
Liaw, A., and Wiener, M. (2002). Classification and Regression by randomForest. R News, 2, 18-22, R Package Version 4.6-14, 2018.
Lin, H., Huang, B., Wang, H., Liu, X., Hong, Y., Qiu, S., et al. (2018). MTHFD2 overexpression predicts poor prognosis in renal cell carcinoma and is associated with cell proliferation and vimentin-modulated migration and invasion. Cell Physiol. Biochem. 51, 991–1000. doi: 10.1159/000495402
Lin, Y. S., Tsai, K. L., Chen, J. N., and Wu, C. S. (2020). Mangiferin inhibits lipopolysaccharide-induced epithelial-mesenchymal transition (EMT) and enhances the expression of tumor suppressor gene PER1 in non-small cell lung cancer cells. Environ. Toxicol. 35, 1070–1081. doi: 10.1002/tox.22943
Liu, H., Zhang, Y., Hao, X., Kong, F., Li, X., Yu, J., et al. (2016). GPRC5A overexpression predicted advanced biological behaviors and poor prognosis in patients with gastric cancer. Tumor Biol. 37, 503–510. doi: 10.1007/s13277-015-3817-0
Liu, Q., Li, Y., Lv, W., Zhang, G., Tian, X., Li, X., et al. (2018). UCA1 promotes cell proliferation and invasion and inhibits apoptosis through regulation of the miR129-SOX4 pathway in renal cell carcinoma. Onco Targets Ther. 11, 2475–2487. doi: 10.2147/OTT.S160192
Lossos, I. S., Czerwinski, D. K., Alizadeh, A. A., Wechser, M. A., Tibshirani, R., Botstein, D., et al. (2004). Prediction of survival in diffuse large-B-cell lymphoma based on the expression of six genes. N. Engl. J. Med. 350, 1828–1837. doi: 10.1056/NEJMoa032520
Lu, L., Wang, J., Wu, Y., Wan, P., and Yang, G. (2016). Rap1A promotes ovarian cancer metastasis via activation of ERK/p38 and notch signaling. Cancer Med. 5, 3544–3554. doi: 10.1002/cam4.946
Lu, M., Ding, N., Zhuang, S., and Li, Y. (2020). LINC01410/miR-23c/CHD7 functions as a ceRNA network to affect the prognosis of patients with endometrial cancer and strengthen the malignant properties of endometrial cancer cells. Mol. Cell Biochem. 469, 9–19. doi: 10.1007/s11010-020-03723-9
Ma, H., Wu, Z., Peng, J., Li, Y., and Liao, W. (2018). Inhibition of SLC1A5 sensitizes colorectal cancer to cetuximab: SLC1A5 inhibition enhances the efficacy of cetuximab. Int. J. Cancer 142, 2578–2588. doi: 10.1002/ijc.31274
Meyer, D., Dimitriadou, E., Hornik, K., Weingessel, A., and Leisch, F. (2019). e1071: Misc Functions of the Department of Statistics, Probability Theory Group (Formerly: E1071), TU Wien. R Package Version 1.7-6, 2021.
Nagarajan, R., Scutari, M., and Lebre, S. (2013). Bayesian Networks in R with Applications in Systems Biology. Springer. R Package Version 4.6-1, 2020.
Necula, L., Matei, L., Dragu, D., Pitica, I., Neagu, A. I., Bleotu, C., et al. (2020). High plasma levels of COL10A1 are associated with advanced tumor stage in gastric cancer patients. World J. Gastroenterol. 26, 3024–3033. doi: 10.3748/wjg.v26.i22.3024
Parker, J. S., Mullins, M., Cheang, M. C., Leung, S., Voduc, D., Vickery, T., et al. (2009). Supervised risk predictor of breast cancer based on intrinsic subtypes. J. Clin. Oncol. 27, 1160–1167. doi: 10.1200/JCO.2008.18.1370
Pellegrini, K. L., Sanda, M. G., and Moreno, C. S. (2015). RNA biomarkers to facilitate the identification of aggressive prostate cancer. Mol. Aspects Med. 45, 37–46. doi: 10.1016/j.mam.2015.05.003
Peterschmitt, M. J., Cox, G. F., Ibrahim, J., MacDougall, J., Underhill, L. H., Patel, P., et al. (2018). A pooled analysis of adverse events in 393 adults with Gaucher disease type 1 from four clinical trials of oral eliglustat: evaluation of frequency, timing, and duration. Blood Cells Mol. Dis. 68, 185–191. doi: 10.1016/j.bcmd.2017.01.006
Ritchie, M. E., Phipson, B., Wu, D., Hu, Y., Law, C. W., Shi, W., et al. (2015). limma powers differential expression analyses for RNA-sequencing and microarray studies. Nucleic Acids Res. 43:e47. doi: 10.1093/nar/gkv007
Shao, J. P., Su, F., Zhang, S. P., Chen, H. K., Li, Z. J., Xing, G. Q., et al. (2020). miR-212 as potential biomarker suppresses the proliferation of gastric cancer via targeting SOX4. J. Clin. Lab. Anal. 34:e23511. doi: 10.1002/jcla.23511
Sharad, S., Dobi, A., Srivastava, S., Srinivasan, A., and Li, H. (2020). PMEPA1 gene isoforms: a potential biomarker and therapeutic target in prostate cancer. Biomolecules 10:1221. doi: 10.3390/biom10091221
Siegel, R. L., Miller, K. D., and Jemal, A. (2016). Cancer statistics, 2016. CA Cancer J. Clin. 66, 7–30. doi: 10.3322/caac.21332
Song, Y. X., Sun, J. X., Zhao, J. H., Yang, Y. C., Shi, J. X., Wu, Z. H., et al. (2017). Non-coding RNAs participate in the regulatory network of CLDN4 via ceRNA mediated miRNA evasion. Nat. Commun. 8:289. doi: 10.1038/s41467-017-00304-1
Song, Z., Wu, Y., Yang, J., Yang, D., and Fang, X. (2017). Progress in the treatment of advanced gastric cancer. Tumour Biol. 39:1010428317714626. doi: 10.1177/1010428317714626
Szklarczyk, D., Gable, A. L., Lyon, D., Junge, A., Wyder, S., Huerta-Cepas, J., et al. (2019). STRING v11: protein-protein association networks with increased coverage, supporting functional discovery in genome-wide experimental datasets. Nucleic Acids Res. 47, D607–D613. doi: 10.1093/nar/gky1131
Tan, Z. (2019). Recent advances in the surgical treatment of advanced gastric cancer: a review. Med. Sci. Monit. 25, 3537–3541. doi: 10.12659/MSM.916475
Teschendorff, A. E., Sollich, P., and Kuehn, R. (2014). Signalling entropy: a novel network-theoretical framework for systems analysis and interpretation of functional omic data. Methods 67, 282–293. doi: 10.1016/j.ymeth.2014.03.013
Thapa, S., Lomholt, M. A., Krog, J., Cherstvy, A. G., and Metzler, R. (2018). Bayesian analysis of single-particle tracking data using the nested-sampling algorithm: maximum-likelihood model selection applied to stochastic-diffusivity data. Phys. Chem. Chem. Phys. 20, 29018–29037. doi: 10.1039/C8CP04043E
Thrift, A. P., and El-Serag, H. B. (2020). Burden of gastric cancer. Clin. Gastroenterol. Hepatol. 18, 534–542. doi: 10.1016/j.cgh.2019.07.045
Tsai, M. M., Huang, H. W., Wang, C. S., Lee, K. F., Tsai, C. Y., Lu, P. H., et al. (2016). MicroRNA-26b inhibits tumor metastasis by targeting the KPNA2/c-jun pathway in human gastric cancer. Oncotarget 7, 39511–39526. doi: 10.18632/oncotarget.8629
Uehara, T., Kikuchi, H., Miyazaki, S., Iino, I., Setoguchi, T., Hiramatsu, Y., et al. (2016). Overexpression of Lysophosphatidylcholine Acyltransferase 1 and Concomitant Lipid alterations in gastric cancer. Ann. Surg. Oncol. 23(Suppl. 2), 206–213. doi: 10.1245/s10434-015-4459-6
Wang, H., Sham, P., Tong, T., and Pang, H. (2020). Pathway-based single-cell RNA-Seq classification, clustering, and construction of gene-gene interactions networks using random forests. IEEE J. Biomed. Health Inform. 24, 1814–1822. doi: 10.1109/JBHI.2019.2944865
Wang, N., Liu, W., Zheng, Y., Wang, S., Yang, B., Li, M., et al. (2018). CXCL1 derived from tumor-associated macrophages promotes breast cancer metastasis via activating NF-kappaB/SOX4 signaling. Cell Death Dis. 9:880. doi: 10.1038/s41419-018-0876-3
Wang, P., Liu, G. Z., Wang, J. F., and Du, Y. Y. (2020). SNHG3 silencing suppresses the malignant development of triple-negative breast cancer cells by regulating miRNA-326/integrin alpha5 axis and inactivating Vav2/Rac1 signaling pathway. Eur. Rev. Med. Pharmacol. Sci. 24, 5481–5492. doi: 10.26355/eurrev_202005_21333
Wang, Q., Liu, J., You, Z., Yin, Y., Liu, L., Kang, Y., et al. (2021). LncRNA TINCR favors tumorigenesis via STAT3-TINCR-EGFR-feedback loop by recruiting DNMT1 and acting as a competing endogenous RNA in human breast cancer. Cell Death Dis. 12:83. doi: 10.1038/s41419-020-03188-0
Wang, R. G., Zhang, D., Zhao, C. H., Wang, Q. L., Qu, H., and He, Q. S. (2020). FKBP10 functioned as a cancer-promoting factor mediates cell proliferation, invasion, and migration via regulating PI3K signaling pathway in stomach adenocarcinoma. Kaohsiung J. Med. Sci. 36, 311–317. doi: 10.1002/kjm2.12174
Wang, Y. (2017). Transcriptional regulatory network analysis for gastric cancer based on mRNA microarray. Pathol. Oncol. Res. 23, 785–791. doi: 10.1007/s12253-016-0159-1
Wang, Y., Ma, C., Zhang, H., and Wu, J. (2012). Novel protein pp3501 mediates the inhibitory effect of sodium butyrate on SH-SY5Y cell proliferation. J. Cell. Biochem. 113, 2696–2703. doi: 10.1002/jcb.24145
Wei, C. Y., Zhu, M. X., Lu, N. H., Peng, R., Yang, X., Zhang, P. F., et al. (2019). Bioinformatics-based analysis reveals elevated MFSD12 as a key promoter of cell proliferation and a potential therapeutic target in melanoma. Oncogene 38, 1876–1891. doi: 10.1038/s41388-018-0531-6
Wei, Y., Chen, X., Liang, C., Ling, Y., Yang, X., Ye, X., et al. (2020). A noncoding regulatory RNAs network driven by Circ-CDYL acts specifically in the early stages hepatocellular carcinoma. Hepatology 71, 130–147. doi: 10.1002/hep.30795
Weihs, C., Ligges, U., Luebke, K., and Raabe, N. (2005). klaR Analyzing German Business Cycles. Data Analysis and Decision Support, 335-343. R Package Version 0.6-15, 2020.
Xi, X., Li, T., Huang, Y., Sun, J., Zhu, Y., Yang, Y., et al. (2017). RNA biomarkers: frontier of precision medicine for cancer. Noncoding RNA 3:9. doi: 10.3390/ncrna3010009
Xia, T., Liao, Q., Jiang, X., Shao, Y., Xiao, B., Xi, Y., et al. (2014). Long noncoding RNA associated-competing endogenous RNAs in gastric cancer. Sci. Rep. 4:6088. doi: 10.1038/srep06088
Xu, Y., Liu, Z., and Guo, K. (2012). Expression of FHL1 in gastric cancer tissue and its correlation with the invasion and metastasis of gastric cancer. Mol. Cell Biochem. 363, 93–99. doi: 10.1007/s11010-011-1161-2
Yoon, C., Till, J., Cho, S. J., Chang, K. K., Lin, J. X., Huang, C. M., et al. (2019). KRAS activation in gastric adenocarcinoma stimulates epithelial-to-mesenchymal transition to cancer stem-like cells and promotes metastasis. Mol. Cancer Res. 17, 1945–1957. doi: 10.1158/1541-7786.MCR-19-0077
Yu, G., Wang, L. G., Han, Y., and He, Q. Y. (2012). clusterProfiler: an R package for comparing biological themes among gene clusters. OMICS 16, 284–287. doi: 10.1089/omi.2011.0118
Zhang, G., Zhang, W., Li, B., Stringer-Reasor, E., Chu, C., Sun, L., et al. (2017). MicroRNA-200c and microRNA- 141 are regulated by a FOXP3-KAT2B axis and associated with tumor metastasis in breast cancer. Breast Cancer Res. 19:73. doi: 10.1186/s13058-017-0858-x
Zhang, X., and Liu, S. (2017). RBPPred: predicting RNA-binding proteins from sequence using SVM. Bioinformatics 33, 854–862. doi: 10.1093/bioinformatics/btw730
Zhang, Z., Wang, J., Mao, J., Li, F., Chen, W., and Wang, W. (2020). Determining the clinical value and critical pathway of GTPBP4 in lung adenocarcinoma using a bioinformatics strategy: a study based on datasets from the cancer genome atlas. Biomed. Res. Int. 2020:5171242. doi: 10.1155/2020/5171242
Zhao, R., Liu, Z., Xu, W., Song, L., Ren, H., Ou, Y., et al. (2020). Helicobacter pylori infection leads to KLF4 inactivation in gastric cancer through a TET1-mediated DNA methylation mechanism. Cancer Med. 9, 2551–2563. doi: 10.1002/cam4.2892
Keywords: complete transcriptomic profiles, biomarkers, sample classification, prognosis, generalization ability
Citation: Dong C, Rao N, Du W, Gao F, Lv X, Wang G and Zhang J (2021) mRBioM: An Algorithm for the Identification of Potential mRNA Biomarkers From Complete Transcriptomic Profiles of Gastric Adenocarcinoma. Front. Genet. 12:679612. doi: 10.3389/fgene.2021.679612
Received: 12 March 2021; Accepted: 06 May 2021;
Published: 27 July 2021.
Edited by:
Guini Hong, Gannan Medical University, ChinaReviewed by:
Andrey Cherstvy, University of Potsdam, GermanyCopyright © 2021 Dong, Rao, Du, Gao, Lv, Wang and Zhang. This is an open-access article distributed under the terms of the Creative Commons Attribution License (CC BY). The use, distribution or reproduction in other forums is permitted, provided the original author(s) and the copyright owner(s) are credited and that the original publication in this journal is cited, in accordance with accepted academic practice. No use, distribution or reproduction is permitted which does not comply with these terms.
*Correspondence: Nini Rao, cmFvbm5AdWVzdGMuZWR1LmNu
Disclaimer: All claims expressed in this article are solely those of the authors and do not necessarily represent those of their affiliated organizations, or those of the publisher, the editors and the reviewers. Any product that may be evaluated in this article or claim that may be made by its manufacturer is not guaranteed or endorsed by the publisher.
Research integrity at Frontiers
Learn more about the work of our research integrity team to safeguard the quality of each article we publish.