 Jinhuan Dou1,2
 Angela Cánovas
 Ying Yu
 Flavio S. Schenkel
 Yachun Wang
- 1Key Laboratory of Animal Genetics, Breeding and Reproduction, MARA, National Engineering Laboratory for Animal Breeding, College of Animal Science and Technology, China Agricultural University, Beijing, China
- 2Department of Animal Biosciences, Centre for Genetic Improvement of Livestock, University of Guelph, Guelph, ON, Canada
- 3Department of Animal Sciences, Purdue University, West Lafayette, IN, United States
Understanding heat stress physiology and identifying reliable biomarkers are paramount for developing effective management and mitigation strategies. However, little is known about the molecular mechanisms underlying thermal tolerance in animals. In an experimental model of Sprague–Dawley rats subjected to temperatures of 22 ± 1°C (control group; CT) and 42°C for 30 min (H30), 60 min (H60), and 120 min (H120), RNA-sequencing (RNA-Seq) assays were performed for blood (CT and H120), liver (CT, H30, H60, and H120), and adrenal glands (CT, H30, H60, and H120). A total of 53, 1,310, and 1,501 differentially expressed genes (DEGs) were significantly identified in the blood (P < 0.05 and |fold change (FC)| >2), liver (P < 0.01, false discovery rate (FDR)–adjusted P = 0.05 and |FC| >2) and adrenal glands (P < 0.01, FDR-adjusted P = 0.05 and |FC| >2), respectively. Of these, four DEGs, namely Junb, P4ha1, Chordc1, and RT1-Bb, were shared among the three tissues in CT vs. H120 comparison. Functional enrichment analyses of the DEGs identified in the blood (CT vs. H120) revealed 12 biological processes (BPs) and 25 metabolic pathways significantly enriched (FDR = 0.05). In the liver, 133 BPs and three metabolic pathways were significantly detected by comparing CT vs. H30, H60, and H120. Furthermore, 237 BPs were significantly (FDR = 0.05) enriched in the adrenal glands, and no shared metabolic pathways were detected among the different heat-stressed groups of rats. Five and four expression patterns (P < 0.05) were uncovered by 73 and 91 shared DEGs in the liver and adrenal glands, respectively, over the different comparisons. Among these, 69 and 73 genes, respectively, were proposed as candidates for regulating heat stress response in rats. Finally, together with genome-wide association study (GWAS) results in cattle and phenome-wide association studies (PheWAS) analysis in humans, five genes (Slco1b2, Clu, Arntl, Fads1, and Npas2) were considered as being associated with heat stress response across mammal species. The datasets and findings of this study will contribute to a better understanding of heat stress response in mammals and to the development of effective approaches to mitigate heat stress response in livestock through breeding.
Introduction
Heat stress refers to the sum of the nonspecific physiological responses of the body to high ambient temperature (Dikmen and Hansen, 2009). Heat stress is a well-recognized environmental factor that threatens human health (Cheshire, 2016), animal welfare, and productive efficiency (Belhadj-Slimen et al., 2016; Polsky and von Keyserlingk, 2017). Significant increases in mortality and morbidity in humans and livestock exposed to severe heat stress have been documented in the literature (Mader et al., 2006; Belhadj-Slimen et al., 2016; Greene et al., 2016). Heat stress is also a major factor jeopardizing animal production in tropical, subtropical, and arid regions around the globe, through decreasing productive performance, compromised reproduction and welfare, and increasing heat-related diseases (Belhadj-Slimen et al., 2016; Saeed et al., 2019).
Heat stress poses great research challenges because it involves complex (and partially unknown) regulatory mechanisms in animals. The magnitude of the body's response to heat stress is influenced by numerous factors, such as the heat intensity (Thompson et al., 2018; Khan et al., 2020), heat duration (Volodina et al., 2017; Wang et al., 2019), genetic background of animals (e.g., species, breeds; Lees et al., 2018; Xu et al., 2018), and physiological state (Lucy and Safranski, 2017; Tamura et al., 2017). Therefore, it is difficult to evaluate and quantify the degree of heat stress. The temperature–humidity index (THI) is often used to represent the environmental conditions that drive heat stress (De Rensis et al., 2015). However, the definitions (Armstrong, 1994; De Rensis et al., 2015) and THI values (Bohmanova et al., 2007) tend to vary across studies and environmental conditions (e.g., geographic location, physical size, and the different equations), and therefore, THI can only be used as a rough indicator for assessing heat stress (Polsky and von Keyserlingk, 2017). In this context, various studies have focused on evaluating the effects of heat stress in humans and other animals (e.g., cattle, pig, and sheep) from the perspective of physiological measures to assess body coping mechanisms when exposed to different environmental challenges. For instance, rectal temperature (RT) (Leon et al., 2005) and respiratory rate (RR) (Kadzere et al., 2002) are common physiological indicators of heat stress response (Brito et al., 2020; Li et al., 2020). In addition, drooling score (DS) can also be as a good indicator for heat stress, because it is highly correlated with RR when heat stress occurs (Mader et al., 2006). However, although physiological measures can describe the health and biological status at a given environmental condition, they fail to constitute a gold standard due to their susceptibility to different detection methods and physiological conditions.
With the development of next-generation sequencing, including RNA-sequencing (RNA-Seq; Wickramasinghe et al., 2014), the accuracy and speed of identifying environmentally responsive genes at a large scale have increased substantially, thus contributing to a better understanding of the molecular mechanisms underlying heat stress response (Han et al., 2019; Li et al., 2019a). However, results remain limited by distinct heat stress conditions (intensity or time of heat stress), tissue sampling, and individual differences. Blood is a good model for medical and physiology research (Cohn, 2015) and is widely used in clinical disease diagnosis because of its advantages of noninvasive collection (Nisenblat et al., 2016; Kiddle et al., 2018). Previous studies have shown that mild/severe heat stress can affect blood physiological, biochemical, and immunological indicators (Bagath et al., 2019; Johnson et al., 2019), as well as the expression of certain genes [e.g., heat shock protein (HSP)] (Garner et al., 2020; Lee et al., 2020). Meanwhile, our previous studies have also proven that blood biomarkers can reflect the degree of acute and short-term heat stress (Dou et al., 2019, 2020). Liver is an important regulator of metabolism, controlling many of the physiological processes influenced by heat stress (Hubbard et al., 2019), and adrenal glands are the main tissues involved in production and release of heat stress–responsive hormones (e.g., glucocorticoids) to maintain animal homeostasis during heat stress (Li et al., 2019a,b). Moreover, heat stress induces transcriptomics, metabolic, and proteomic changes in the liver (Hubbard et al., 2019; Ma et al., 2019) and adrenal glands (Koko et al., 2004; Li et al., 2019a). In short, blood, liver, and adrenal glands are the three main tissues for studying the heat stress regulatory mechanisms. In this context, the main hypothesis of the present study is that the regulation of heat stress–related genes has temporal and tissue-specific differences. The main objectives of this study were to (1) identify heat stress–responsive genes in different key tissues (blood, liver, and adrenal glands) using the RNA-Seq technology and (2) investigate the dynamic expression pattern of differentially expressed genes (DEGs) in liver and adrenal glands under various heat stress conditions.
Materials and Methods
Ethics Approval
The animal protocol was reviewed and approved by the Institutional Animal Care and Use Committee from the China Agricultural University (Beijing, China). The in vivo rat experiments were performed at the College of Animal Science and Technology (China Agricultural University, Beijing, China). The Institutional Animal Care and Use Committee approved all the experimental procedures, which complied with the China Physiological Society's guiding principles for research involving animals and adhered to the high standard (best practice) of veterinary care as stipulated in the Guide for Care and Use of Laboratory Animals.
Animals and Sample Collection
Twenty 8-week-old female Sprague–Dawley rats (Beijing Vital River Laboratory, Animal Technology Co. Ltd., Beijing, China), weighing 205 ± 7.16 g, were used as heat-stressed rat models under different climatic conditions: Control (22 ± 1°C and relative humidity of 50%, n = 5) or at three heat-stress conditions (42°C for 30 min (H30, n = 5), 60 min (H60, n = 5), or 120 min (H120, n = 5), following Dou et al. (2019). The changes in body temperature and biochemical indicators in blood (n = 4), liver (n = 5), and adrenal glands (n = 5) in the control group (CT) and H120 groups were investigated using RNA-Seq technology (Dou et al., 2020). In addition, liver (n = 5) and adrenal gland (n = 5) tissues from the H30 and H60 groups were also collected as described by Dou et al. (2020) and used for RNA-Seq analyses. Briefly, the experimental rats were anesthetized with an injection of 1.2 mL 1% pentobarbital sodium (0.6 mL/100 g body weight; Jeon et al., 2011), sacrificed, and quickly dissected by sterile surgical scissors and forceps (Shinva Medical Instrument Co. Ltd., Shandong, China). Liver and adrenal glands were collected, washed in ice-cold phosphate-buffered solution, and snap-frozen immediately in liquid nitrogen (−196°C).
RNA Isolation and Library Construction
RNA reagents were used to extract the total RNA from the samples of Sprague–Dawley rats used in this study, according to the manufacturer's protocol (HUAYUEYANG Biotechnology Co., Ltd., Beijing, China). The purity of the RNA samples was assessed by A260/230 nm and A260/280 nm ratios using NanoDrop 2100 (Thermo Fisher Scientific, Waltham, MA, USA). The integrity of the RNA samples was determined using the RNA Nano 6000 Assay Kit of the Agilent Bioanalyzer 2100 system (Agilent Technologies, CA, USA), and the RNA concentration and genomic DNA contamination were determined using the Qubit® 2.0 Fluorometer (Invitrogen, Carlsbad, CA, USA). The 260/280 ratio of all samples ranged from 1.8 to 2.0, and the integrity number (RIN) values were > 7.0, indicating good RNA quality (Cánovas et al., 2013). A total of 3 μg RNA from each sample was used to prepare the cDNA libraries using the NEBNext® Ultra™ Directional RNA Library Prep Kit from Illumina® (NEB, San Diego, CA, USA), following the manufacturer's recommendation. Paired-end (2 × 150 bp) reads of samples in H30 and H60 were sequenced using the HiSeq 2500 sequencer (Illumina, San Diego, CA, USA).
RNA Reads Mapping and Candidate Gene Identification
A total of 48 RNA-Seq samples from 20 rats were analyzed. First, a quality control analysis was performed using the CLC Genomics Workbench software 20.0 (CLC Bio, Aarhus, Denmark, https://www.qiagenbioinformatics.com), following the parameters described by Cánovas et al. (2014a). All the samples analyzed passed all the quality control parameters having the same length (100 bp); 100% coverage in all bases; 25% of A, T, G, and C nucleotide contributions; 50% GC on base content; and < 0.1% overrepresented sequences, indicating good quality of sequencing outputs. The paired-end sequence reads were mapped to the reference genome Rattus norvegicus 6.0 (ftp://ftp.ensembl.org/pub/release-95/genbank/rattus_norvegicus/) using the CLC Genomics Workbench software 20.0 (Cánovas et al., 2014a). The detailed mapping parameters were as follows: two mismatches, three insertions, and three deletions per read were allowed; end-to-end with 0.9 length fraction (the minimum percentage of the total alignment length that must match the reference sequence at the selected similarity fraction); and 0.9 similarity fraction (the minimum percentage identity between the aligned region of the read and the reference sequence). Expression data were normalized by calculating the reads per kilobase per million mapped reads (RPKM = total exon reads/mapped reads in millions × exon length in kb) for each gene (Allison et al., 2006; Mortazavi et al., 2008; Cánovas et al., 2014b; Medici et al., 2016) and log10 transformed. Only transcripts with RPKM ≥ 0.2 were considered expressed genes; otherwise, they were discarded from further analyses (Cardoso et al., 2018). Principal component analysis (PCA) between RPKM expression levels for samples in different comparisons were performed using the R 3.6.3 software (https://cran.r-project.org/src/base/R-3/).
Differential Gene Expression
Differential gene expression analyses were performed using the CLC Genomics Workbench software 20.0 as described by Asselstine et al. (2019) using a negative binomial generalized linear model (GLM). The GLM assumes that the expression levels follow a negative binomial distribution. This distribution has a free parameter, the dispersion. The greater the dispersion, the greater the variation in expression levels for a gene. The most likely values of the dispersion and coefficients are determined simultaneously by fitting the GLM to the data. Therefore, the Cox–Reid adjusted likelihood was used to correct the GLM dispersion for a gene (Robinson et al., 2010). Differential expression analysis was performed using t-test [P ≤ 0.01, false discovery rate (FDR)–adjusted P = 0.05 and |fold change (FC)| >2] on transformed data to identify the DEGs between the groups of samples under different heat-stressed conditions, with the exception of blood samples P < 0.05 and |FC| >2, considered to be DEGs (Medici et al., 2016). Short Time-series Expression Miner (STEM) was used for the dynamic expression pattern analyses of the shared DEGs identified among the four groups (Ernst and Bar-Joseph, 2006). The parameters of STEM analysis were set as follows: maximum number of model profiles equal to 20 and minimum FC of genes in different samples were >2, and the log2 normalization was used for the FC of gene expression between the heat treatment group and CT group (Ernst and Bar-Joseph, 2006). Significant patterns were considered at P < 0.05 and shown in color.
Functional Enrichment Analysis and Gene Annotation
Functional annotation was performed using the Gene Ontology (GO) (http://geneontology.org) and Kyoto Encyclopedia of Genes and Genomes (KEGG) (http://www.genome.ad.jp/kegg/) databases based on the GO biological processes (BPs) and pathway analysis. The analyses were performed based on DEGs identified in each tissue under various heat stress conditions, and those DEGs significantly enriched in dynamic expression patterns. The BPs and metabolic pathways significantly associated with the gene lists were determined based on their FDR (Ashburner et al., 2000). Functional evidence of the relationship between the significant GO terms (FDR = 0.05) and the DEGs was identified (Sweett et al., 2020). The FDR thresholds of 0.05 for genes involved in the BPs or metabolic pathways were applied to filter significant candidate genes by function, pathway, and network effects (Cardoso et al., 2017). The Protein Analysis Through Evolutionary Relationships (PANTHER; Mi et al., 2019) and Database for Annotation, Visualization, and Integrated Discovery (DAVID) 6.8 (https://david.ncifcrf.gov/tools.jsp) were used to perform functional annotation for the genes in the liver and adrenal glands that were significantly (P < 0.05) enriched in the expression patterns (Cánovas et al., 2012).
Cross-Species Analysis of Genes With Significant Expression Patterns in the Liver and Adrenal Glands
In another of our recent studies, a multiple-trait animal model was used to estimate genetic parameters using 59,265 RT, 30,290 RR, and 30,421 DS records from 13,592 lactating Holstein cows (Luo et al., 2020). A total of 2,627 cows were genotyped using the Illumina 150K Bovine Bead chip (Illumina, San Diego, CA, USA). After quality control of the chip data, a total of 116,594 single-nucleotide polymorphisms (SNPs) were used in the analysis (Luo et al., 2020). Subsequently, the LiftOver software (https://genome.ucsc.edu/cgi-bin/hgLiftOver) was used to convert the 140 unique DEGs of rats to the cattle genes based on the physical locations and UMD 3.1 bovine reference genome (Bos_taurus_UMD 3.1.1/bos Tau8) information. After the LiftOver analysis, the intersect function of BEDTools software (Quinlan and Hall, 2010) was used to perform overlap analysis between the genes converted to the cow with SNPs. Moreover, only the SNP with the smallest P-value that overlapped with each gene was retained and stored into a new candidate list. Finally, a phenome-wide association studies (PheWAS) analysis was performed based on the new candidate gene list using the GWASATLAS software (Watanabe et al., 2020), which provides annotation information on human genome for candidate SNPs and genes related to complex traits. The human complex traits were mainly summarized based on six key groups, namely, cardiovascular, endocrine, environmental, immunological, metabolic, and others (e.g., neurological, psychiatric, and respiratory).
Results and Discussion
Through the exploration of the transcriptome profile, further understanding of the coping mechanisms under heat stress challenges from the perspective of genetic regulation is essential for in-depth explaining of thermo-tolerance and breeding of heat-tolerant varieties. In the present study, a well-established heat-stressed rat model was used to investigate the effects of various heat stress conditions (H30, H60, and H120) on the gene expression levels in multiple tissues (blood, liver, and adrenal glands), thereby providing a theoretical reference for the research on the temporal and tissue-specific expression of heat stress genes.
Sequencing and Profiling of Transcriptomes in Response to Heat Stress
For the liver and adrenal gland tissues in the H30 and H60 groups, the 20 RNA-Seq libraries generated an average of 10.94 Gb paired-end clean reads, for which the percentages of Q20 and Q30 were > 96 and 92%, respectively, with GC content of < 50% (Supplementary Table 1). The quality of the 28 RNA-Seq data generated from blood, liver, and adrenal gland samples in the CT and H120 groups was reported by Dou et al. (2020) and showed an average of 9.46 Gb paired-end clean reads for each sample, with high quality (GC content: 50.81%, Q20: 95.06%, and Q30: 89.10%). In the current study, an average of 87.47% reads for the 48 samples was mapped in pairs (Supplementary Table 2). Furthermore, 92.46% and 7.54% of the reads were mapped in genic and intergenic regions, respectively (Supplementary Table 2). The PCA analysis indicated that the samples seem to be more similar within treatment group and more divergent across treatments based on each principal component dimension (Supplementary Figure 1). In addition, under different heat stress conditions, the difference between the CT and heat treatment groups of the adrenal glands was clear (Supplementary Figure 1), which may be because adrenal glands can rapidly release the glucocorticoids into the bloodstream when heat stress occurs (Blake et al., 1991), and then the glucocorticoids act on a variety of tissues to yield their numerous homeostatic effects (Meaney et al., 1993).
Differentially Gene Expression Analysis
In the blood (CT vs. H120), liver (CT vs. H30, CT vs. H60, and CT vs. H120), and adrenal gland (CT vs. H30, CT vs. H60, and CT vs. H120) tissues, a total of 53, 2,449, and 2,763 genes were identified based on P < 0.05 and |FC| >2, as well as 0, 1,310, and 1,501 genes were detected based on P < 0.05, FDR-adjusted P = 0.05, and |FC| >2, respectively (Table 1). The detailed information on the DEGs in blood, liver, and adrenal gland tissues is summarized in Supplementary Tables 3–9. Among the 53 DEGs in blood, 66.04% of genes were up-regulated in CT vs. H120 (Table 1 and Supplementary Table 3), and the Actg1 (actin, gamma 1) gene was the most expressed with FC = 39.70. The Actg1 has a function associated with response to mechanical stimulus and positive regulation of gene expression (Ogneva et al., 2014). The possible role of the Actg1 gene in heat stress has not been reported yet. The number of DEGs in the liver and adrenal glands was 24.26 and 27.80 times higher, respectively, than that in blood. In the liver (Supplementary Tables 4–6), most DEGs were found when comparing CT vs. H60, which were 225 and 289 more than those for CT vs. H30 and CT vs. H120, respectively. However, most DEGs in the adrenal glands (Supplementary Tables 7–9) were identified at H120 (723), and the numbers of up-regulated DEGs were 126, 250, and 277 higher than down-regulated DEGs in CT vs. H30, CT vs. H60, and CT vs. H120, respectively. In all comparisons in the liver, Hspa1b [HSP family A (HSP70) member 1B] gene had the largest FC among all the DEGs identified in CT vs. H30 (FC = 101.69) and CT vs. H60 (FC = 1,281.27), and also the top 2 genes were expressed with FC = 315.32 in CT vs. H120. Furthermore, the top 1 expressed gene in CT vs. H120 was LOC108348108 (heat shock 70-kDa protein 1A; FC = 461.79), which belongs to the HSP70 family together with Hspa1b. HSPs are ubiquitously expressed in eukaryotes (Locke and Tanguay, 1996) and play a critical role in the regulation of many fundamental cellular processes as molecular chaperones (Abravaya et al., 1992), such as heat stress response (Baler et al., 1996). Previous studies have confirmed that the expression of endogenous Hspa1b was modified by Hsf2 (heat shock factor 2) (Le Masson and Christians, 2011). However, the specific mechanisms of the interaction between Hsf2 and Hsp70 during heat stress in rats remain unclear. Unlike the liver tissue, the Hspa1b in adrenal glands changed most in H60 (FC = 182.12). The LOC108348130 [carbonyl reductase (NADPH) 1–like] and Vom2r53 (vomeronasal 2 receptor, 53) genes were most expressed under H30 and H120 treatments, respectively. LOC108348130 and Vom2r53 play an important role in the oxidation–reduction process and G protein–coupled receptor signaling pathway, respectively, and no evidence has been reported of their roles in heat stress response yet.

Table 1. Summary of differentially expressed genes (DEGs) in each comparison.
To further understand the expression levels of DEGs in blood, liver, and adrenal glands, the numbers of genes with low, medium, and high expression levels were summarized according to the criteria of RPKM ≤ 50, 50 < RPKM < 500, and RPKM ≥500 (as described by Cánovas et al., 2014a). Most DEGs belong to the low expression group (RPKM ≤ 50), followed by medium and highly DEG levels (Figure 1). Genes with the highest RPKM values in the liver were cytochrome c oxidase I, mitochondrial (Mt-co1, CT vs. H30) and cytochrome P450, family 2, subfamily c, and polypeptide 7 (Cyp2c7, CT vs. H60, and CT vs. H120), respectively. Mt-col is a mitochondrial component, which contributes to cytochrome c oxidase activity and is involved in the process of response to oxidative stress (García and Chávez, 2007; Gaudet et al., 2011). Cyp2c7, a gene in the cytochrome P450 family, encodes for cytochrome P450 2C7 precursor and participates in the epoxygenase P450 pathway (Gaudet et al., 2011). Hspa1b (CT vs. H30 and CT vs. H60) and scavenger receptor class B, member 1 (Scarb1, CT vs. H120), were highly expressed in adrenal glands. The function of Hspa1b was discussed above, and the gene Scarb1 has the function of positive regulation of cholesterol storage and lipid transport (Rigotti et al., 1997; Azhar et al., 2002).
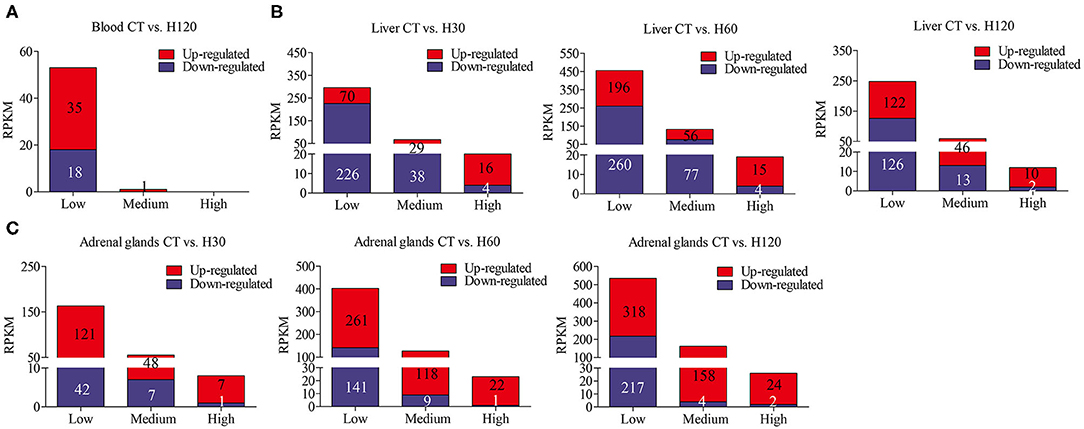
Figure 1. Number of lowly (RPKM ≤ 50), medium (50 < RPKM < 500), and highly (RPKM ≥ 500) expressed genes in each library. (A–C) refer to the numbers of lowly, medium and highly expressed genes identified in blood, liver and adrenal glands, respectively.
Functional Annotation of the DEGs
To elucidate the biological functions related to heat stress at the molecular level, genes that were differentially expressed in blood, liver, and adrenal glands were included in a functional enrichment analysis performed using the GO and KEGG databases. In blood, 38 unique DEGs were significantly enriched (FDR = 0.05) in 12 unique BPs (Figure 2A and Supplementary Table 10). Among them, 5 of 38 unique genes were assigned to the most significant BPs (FDR = 7.99E−07) of antigen processing and presentation of peptide or polysaccharide antigen via major histocompatibility complex (MHC) class II (GO: 0002504). In addition, 17 genes were significantly enriched in BPs of the immune system process (GO: 0002376, FDR = 1.98E−04) (Supplementary Table 10). In the liver, 323, 492, and 271 unique genes from comparisons of CT vs. H30, CT vs. H60, and CT vs. H120, respectively, were assigned to GO analysis, and 133 unique BPs were significantly enriched across all comparisons, which included response to regulation of cold-induced thermogenesis (GO: 0120161), adaptive thermogenesis (GO:1990845), and temperature homeostasis (GO: 0001659) (Supplementary Table 10). In addition, 233 BPs were commonly found in at least two comparisons, and 29, 134, and 158 BPs were specifically enriched in comparisons of CT vs. H30, CT vs. H60, and CT vs. H120, respectively (Supplementary Table 10). The top 20 significantly enriched BPs in each comparison of liver tissues are shown in Figures 2B–D. In adrenal glands, 226, 552, and 723 DEGs were identified in comparisons of CT vs. H30, CT vs. H60, and CT vs. H120, respectively, and 183, 469, and 612 of these were commonly enriched (FDR = 0.05) in 237 BPs (Supplementary Table 10). The commonly identified BP terms included response to stress (GO:0006950), regulation of response to stress (GO:0080134), cellular response to stress (GO:0033554), regulation of cellular response to stress (GO:0080135), response to temperature stimulus (GO:0009266), and cellular response to heat (GO:0034605). Three hundred fifty-four BPs were identified in at least two comparisons. Furthermore, 178, 313, and 133 BPs were specifically enriched in CT vs. H30, CT vs. H60, and CT vs. H120, respectively (Supplementary Table 10). In addition, Figures 2E–G show the top 20 significantly enriched BPs terms for CT vs. H30, CT vs. H60, and CT vs. H120 (Figure 2E). Of these, the cellular response to chemical stimulus (GO:0070887) was the most significantly enriched term in the comparisons of CT vs. H60, and CT vs. H120, with FDR of 1.86E−17 and 3.63E−13, respectively, following cellular response to organic substance (GO:0071310) and response to organic substance (GO:0010033). In addition, Figure 2 also shows that seven BPs terms were commonly enriched in liver and adrenal glands, and no shared BP terms were detected among blood, liver, and adrenal glands.
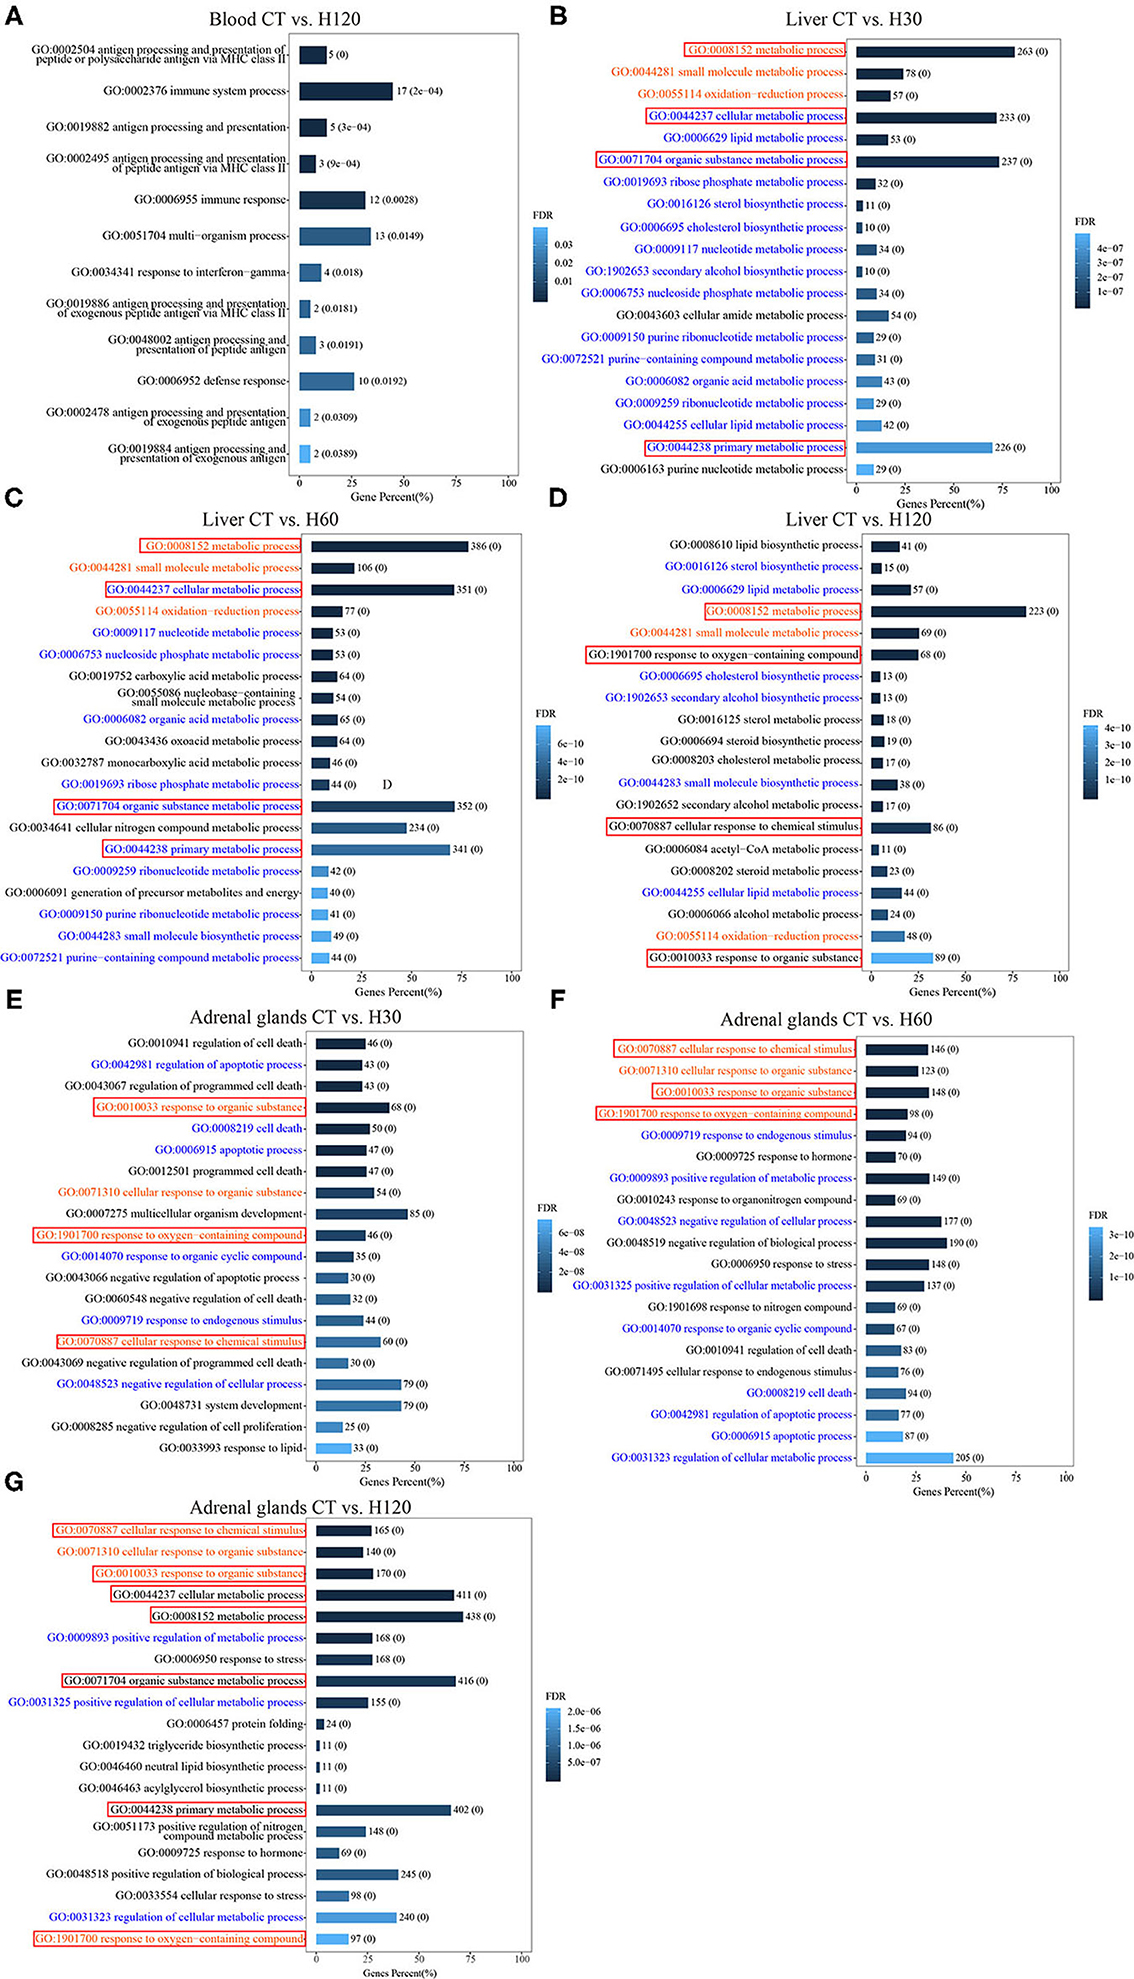
Figure 2. Significantly (FDR = 0.05) enriched biological processes (BPs) for differentially expressed genes (DEGs) in the blood, liver, and adrenal glands. CT means rats were kept at 22 ± 1°C and relative humidity 50%; H30, H60, and H120 mean rats were kept at 42°C for 30, 60, and 120 min, and the relative humidity 50% conditions. (A) All of the 12 significantly enriched BPs for DEGs in blood for CT vs. H120. (B–D) The top 20 significantly enriched BPs for DEGs in liver for CT vs. H30, CT vs. H60, and CT vs. H120, respectively. (E–G) The top 20 significantly enriched BPs for DEGs in adrenal glands for CT vs. H30, CT vs. H60, and CT vs. H120, respectively. The red words mean these BPs are significantly enriched in three comparisons of the same tissue; the blue words mean these BPs are significantly enriched in only two comparisons of the same tissue; the black words mean these BPs are specifically enriched in each comparison of the tissue. The red boxes mean these BPs are shared among different tissues.
For the KEGG pathway overrepresentation analysis, 25 significantly enriched pathways were detected (FDR = 0.05) in blood (Table 2), all of which are interconnected and directly engaged in innate inflammatory host defense, suggesting that multiple innate immunity and inflammation-related pathways in the blood at H120 can be completely mobilized to respond to acute and mild heat stress response (Bagath et al., 2019). Functional enrichment analysis of the 383, 605, and 319 DEGs in the liver of CT vs. H30, CT vs. H60, and CT vs. H120 comparisons found 15, 24, and 20 significant pathways, respectively (Table 3). Three significantly enriched pathways, namely, metabolism, fatty acid metabolism, and peroxisome proliferator-activated receptor (PPAR) signaling pathways, were shared among all the comparisons. Previous research has suggested that heat stress can cause abnormal liver function and lead to metabolic changes (i.e., carbohydrate metabolism, protein breakdown, and metabolism and nonesterified fatty acid levels in the plasma; Bagath et al., 2019; Li et al., 2019b). Heat stress can promote the synthesis and storage of fatty acids and reduce fat decomposition by increasing insulin concentrations (Ding et al., 2002). Fourteen significantly enriched pathways were detected in at least two comparisons of the liver tissue results, of which the oxidative phosphorylation and thermogenesis pathways (FDR = 1.74E−05 in CT vs. H30 and FDR = 2.35E−06 in CT vs. H60) were the most significantly enriched. During heat stress response process, hypothalamus plays a vital role in adaptive increases in body temperature by inducing thermogenesis (Dimicco and Zaretsky, 2007). In our study, 21 and 28 genes in the liver related to thermogenesis were enriched in the CT vs. H30 and CT vs. H60 comparisons, respectively, indicating that rats mobilize these genes to adapt to the heat stress environment. Among these, eight genes were shared in two comparisons in the liver, including Mt-nd4l (NADH dehdrogenase 4L, mitochondrial), LOC679739 [NADH dehydrogenase (ubiquinone) Fe-S protein 6], Atp5mc1 (ATP synthase membrane subunit c locus 1), Mt-nd2 (NADH dehydrogenase 2, mitochondrial), Acsl5 (acyl-CoA synthetase long-chain family member 5), LOC100361457 (actin, gamma 1 propeptide-like), Mt-nd5 (NADH dehydrogenase 5, mitochondrial), and LOC1009125. The specific mechanisms of these gene regulations of heat stress response need to be further investigated.
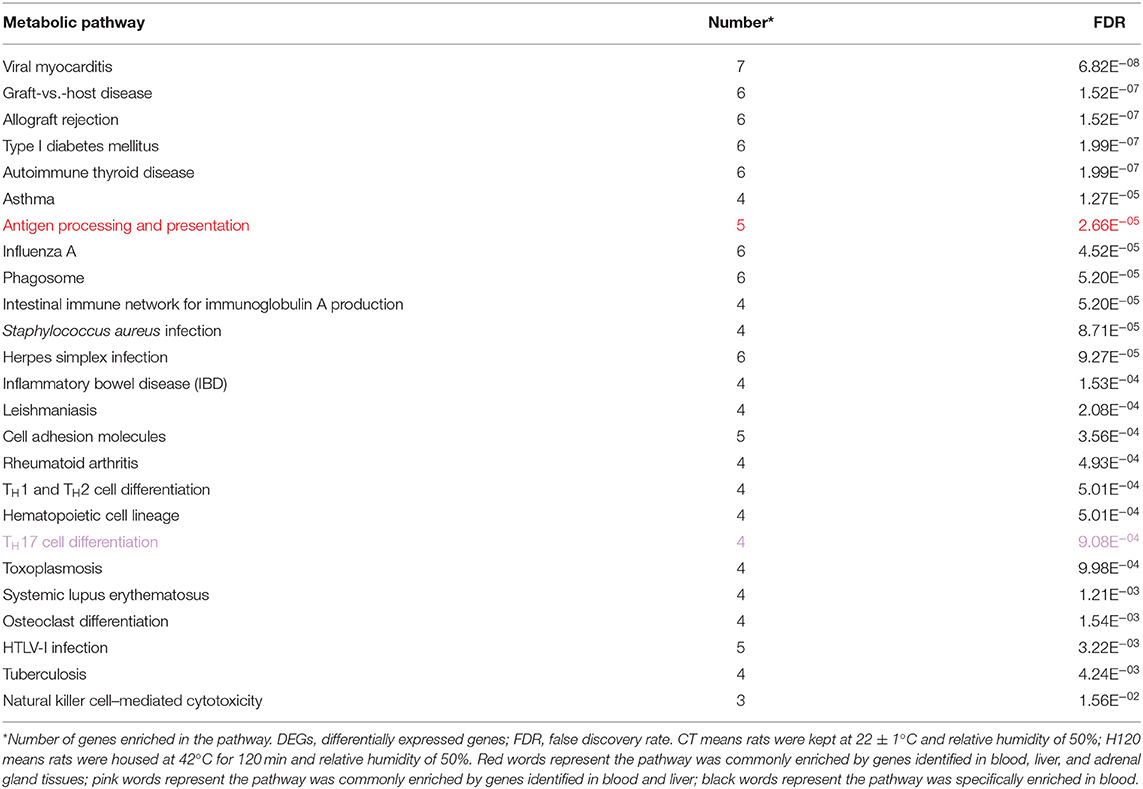
Table 2. Significantly enriched metabolic pathways (FDR = 0.05) using the list of DEGs identified in blood between CT vs. H120.
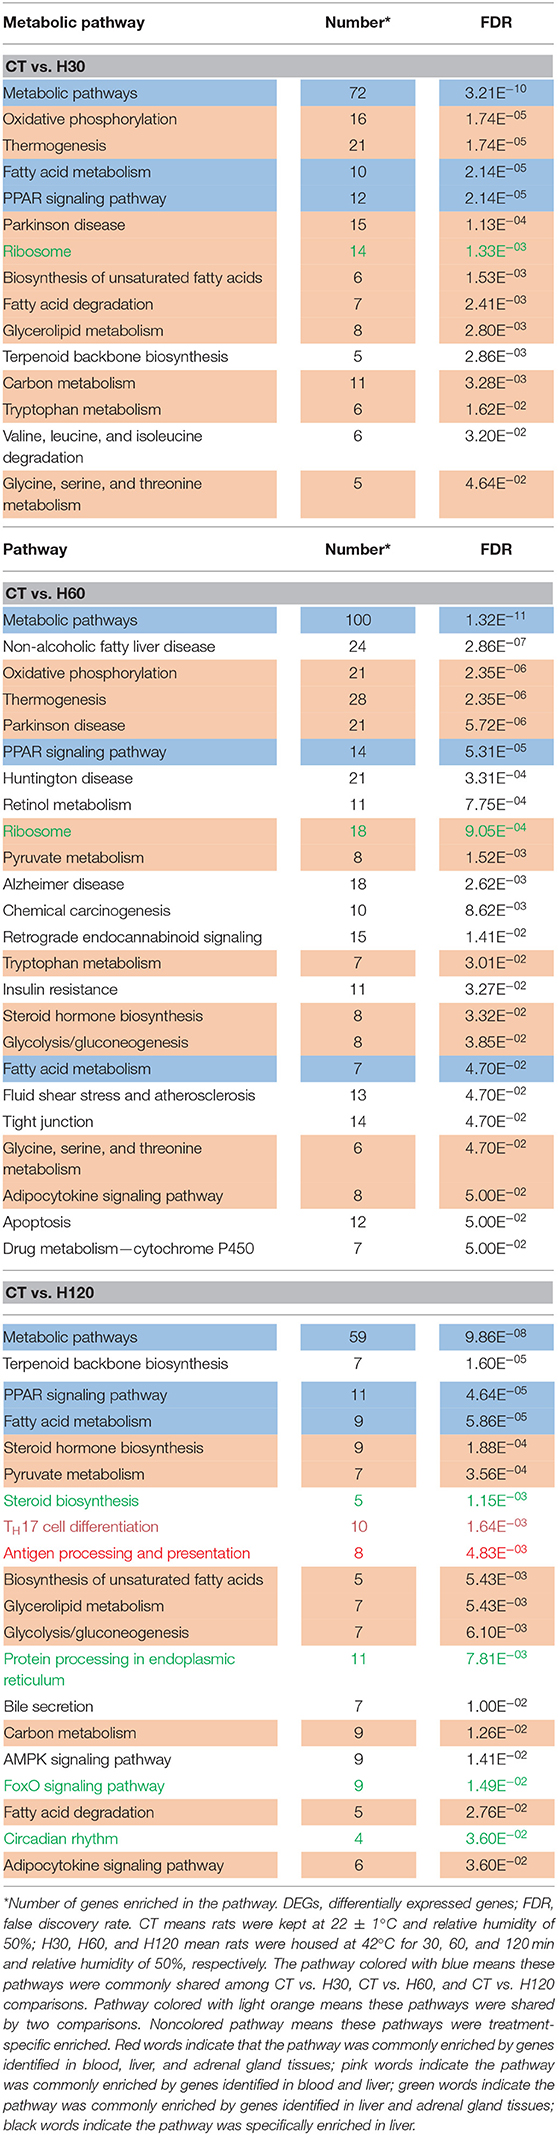
Table 3. Significantly enriched metabolic pathway (FDR = 0.05) using the list of DEGs identified in liver tissue under different heat-stressed conditions.
Compared to the CT group, 8 and 11 pathways were significantly (FDR = 0.05) enriched for DEGs identified in adrenal glands after H30 and H60 exposure, respectively, and no significant pathway was enriched by DEGs identified at H120 (Table 4). Among these, three significantly enriched pathways were shared in CT vs. H30 and CT vs. H60, namely, circadian rhythm, amphetamine addiction, and protein digestion and absorption. Interaction between circadian rhythm and the stress system is essential in a myriad of physiological processes to maintain homeostasis, which plays important roles in health by regulating blood pressure, sleep/wake cycles, and related cellular signaling pathways (Wilking et al., 2013). However, the disruption of intact communication by exogenous factors (i.e., heat stress) may increase the risk of developing metabolic, immune, or neuroendocrine disorders (Rakesh et al., 2014). In mammals, the circadian system is composed of a main pacemaker located in the hypothalamic suprachiasmatic nucleus (SCN) and subordinated clocks throughout the brain and periphery (Ralph et al., 1990). Among the most popular studied mediators of circadian entrainment, glucocorticoids play a critical role in stress response, and their secretion is controlled by the SCN and tissue clocks along the hypothalamus–pituitary–adrenal axis (Oster et al., 2006). As it is well-known, many physiological and metabolic rhythms are synchronized by the adrenal glands (Oster et al., 2006), including the glucocorticoids rhythms (corticosterone in rodent and cortisol in other mammals such as human and cattle) and clock gene rhythms, such as Per1 (period circadian regulator 1), which is involved in the regulation of mitogen-activated protein kinase (MAPK) and cyclic adenosine monophosphate (cAMP) during the heat stress processes (Jerônimo et al., 2017). Therefore, the study of how the molecular circadian rhythms regulate the transcription of genes in adrenal glands will help clarify the influence of heat stress on metabolism and immunity (Pantazopoulos et al., 2018).
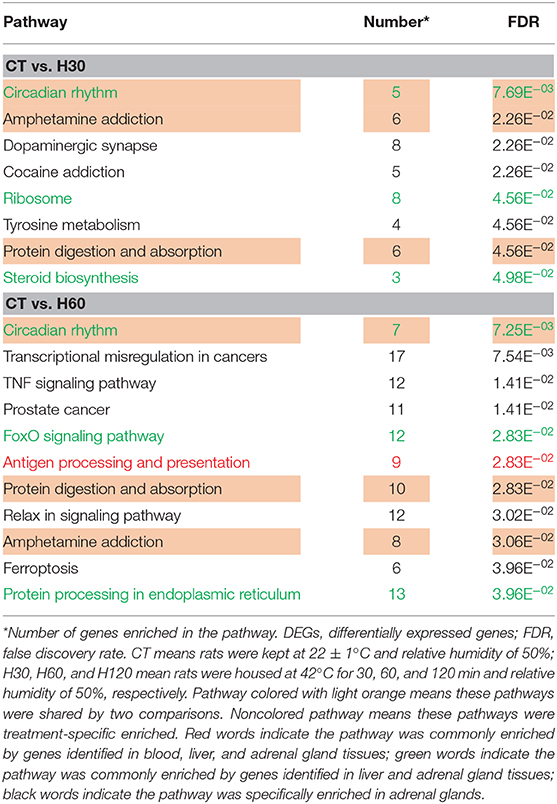
Table 4. Significantly enriched pathway (FDR = 0.05) of DEGs identified in adrenal glands.
Shared and Specific Genes Among Various Treatments and Tissues
Venn diagrams of DEGs identified under the same heat treatment time or in the same tissue were created (Figure 3). A total of 48 DEGs were shared by liver and adrenal gland tissues when H30 was compared to CT, and 21 and 23 of them were up-regulated in the liver and adrenal gland tissues, respectively (Figure 3A, left panel). For CT vs. H60, 117 genes were differentially expressed in both liver and adrenal glands, with ~78 (67.52%) and 86 (73.50%) DEGs, respectively, up-regulated (Figure 3A, central panel). Compared to CT vs. H30 and CT vs. H60, only four genes were commonly identified in the blood, liver, and adrenal gland tissues in CT vs. H120, including Junb (JunB proto-oncogene, AP-1 transcription factor subunit), P4ha1(prolyl 4-hydroxylase subunit α1), Chordc1 (cysteine and histidine-rich domain containing 1) and RT1-Bb (RT1 class II, locus Bb) with FC values ranging from -3.67 to 12.19 (blood), 2.14 to 9.66 (liver), and 2.64 to 9.88 (adrenal glands). Furthermore, the P4ha1 gene had the highest FC value. A heat map of the four shared genes shows that these genes in the liver and adrenal glands were clustered more closely in H120 (Supplementary Figure 2A). The endoplasmic reticulum (ER) can be triggered by heat stress via accumulation of unfolded or misfolded proteins (Alemu et al., 2018). It has been shown that P4ha1 is up-regulated during ER stress (Vonk et al., 2010). In the current study, several genes involved in the pathways of antigen processing and presentation (blood, liver, and adrenal glands), protein processing in the ER (liver and adrenal glands), and protein digestion and absorption (adrenal glands) were identified, indicating the ER stress occurs under heat stress. The up-regulation of P4ha1 was associated with the heat-induced ER stress and could serve as an indicator for heat stress. Figure 3B reveals that 73 and 91 genes were shared under different heat treatments in the liver and adrenal gland tissues, respectively, and had more similar expression mode after heat exposure than the control group (Supplementary Figures 2B,C).
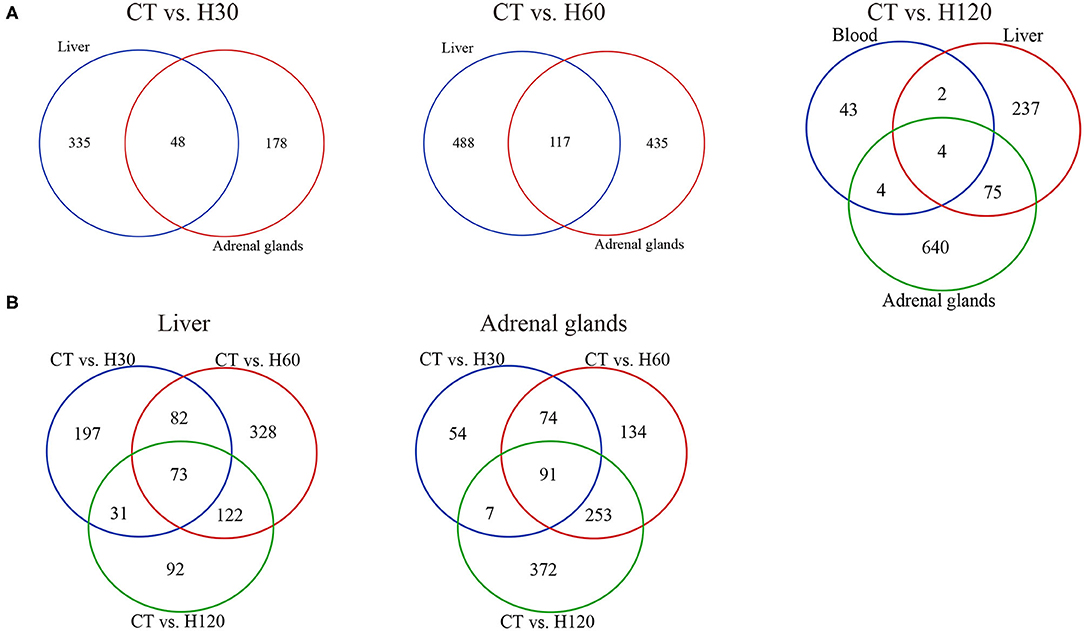
Figure 3. Analysis of shared and specific genes across treatments and tissues. (A) Venn diagram of DEGs in blood, liver, and adrenal gland tissues under the same heat stress conditions. CT means rats were kept at 22 ± 1°C and relative humidity 50%; H30, H60, and H120 mean rats were kept at 42°C for 30, 60, and 120 min, and the relative humidity 50% conditions. (B) Venn diagram of DEGs in comparisons of CT vs. H30, CT vs. H60, and CT vs. H120 in the liver and adrenal gland tissues, respectively.
Temperature-Dependent Gene Expression Patterns Identified by RNA-Seq in the Liver and Adrenal Glands Under Different Heat Stress Times
Based on P < 0.05, five patterns were significantly enriched by 69 DEGs of the liver (Figure 4A). The most significantly (P = 2.3E−13) enriched pattern in the liver was profile 2, indicating that compared to the CT group, 33 DEGs were down-regulated after heat stress. Furthermore, the second significant pattern showed 19 DEGs were up-regulated after heat exposure. Profile 19 reveals that the expression levels of four genes, namely, Tmem140 (transmembrane protein 140), Slc28a2 (solute carrier family 28), Igfbp1 (insulin-like growth factor binding protein 1), and Irf2bp2 (interferon regulatory factor 2 binding protein 2), increased with longer heat stress challenge. Subsequently, GO analysis was performed on these 69 DEGs using PANTHER (Figure 4B), and ~11% of the genes were involved in the BPs of response to stimulus (GO:0050896), of which 4, 7, and 10 genes were engaged in three subgroups of response to stimulus, namely, response to stress (GO:0006950), response to chemical (GO:0042221), and cellular response to stimulus (GO:0051716), respectively. Pathway analysis indicated that these 69 genes were significantly (P < 0.05) enriched in five pathways (Figure 4C).
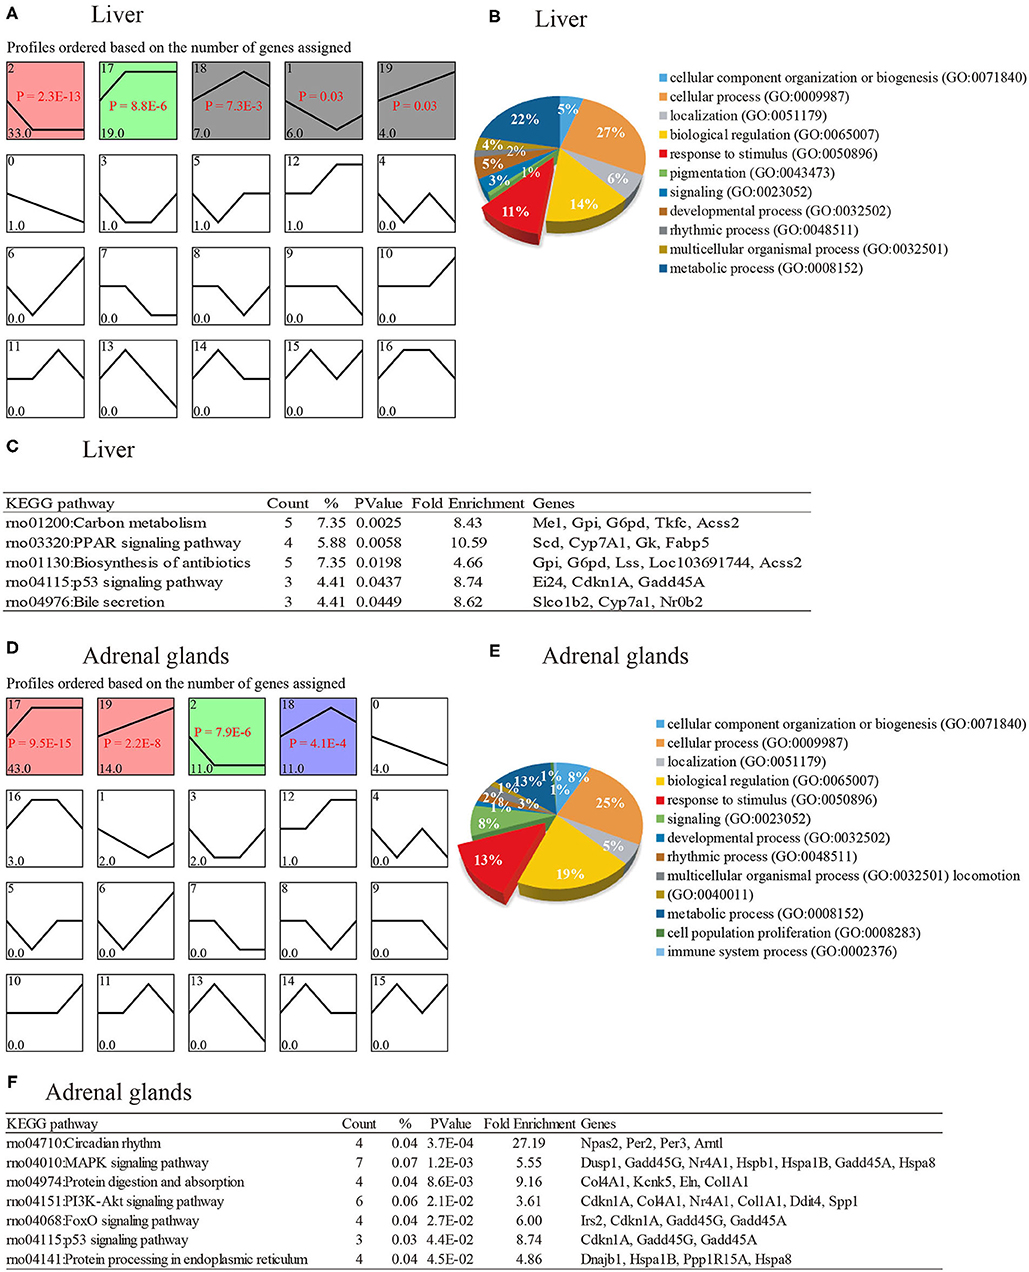
Figure 4. Temperature-dependent gene expression patterns and their functions. CT means rats were kept at 22 ± 1°C and relative humidity 50%; H30, H60, and H120 mean rats were kept at 42°C for 30, 60, and 120 min, and the relative humidity 50% conditions. (A) The expression pattern of 91 genes of liver identified in comparisons of CT vs. H30, CT vs. H60, and CT vs. H120. (B) Pie plot of biological processes (BPs) enriched by genes of the liver, which were significantly (P < 0.05) enriched in patterns. (C) Significantly enriched pathways for genes in liver that were significantly (P < 0.05) enriched in patterns. (D) The expression pattern of 73 genes of the adrenal glands identified in comparisons of CT vs. H30, CT vs. H60, and CT vs. H120. (E) Pie plot of biological processes (BPs) enriched by genes of adrenal glands, which were significantly (P < 0.05) enriched in patterns. (F) Significantly enriched pathways for genes in the adrenal glands that were significantly (P < 0.05) enriched in patterns.
A total of 19 possible expression patterns were detected among the 91 DEGs in the adrenal glands (Figure 4D). Of these, four patterns (profiles 17, 19, 2, and 18), containing 79 DEGs, were significantly enriched (P < 0.05). Among the 79 genes, eight genes, namely, Gpd1 (glycerol-3-phosphate dehydrogenase 1), Dusp1 (dual specificity phosphatase 1), Arntl (aryl hydrocarbon receptor nuclear translocator-like), Hspa1b, Cdkn1a (cyclin-dependent kinase inhibitor 1A), Pim3 (Pim-3 proto-oncogene, serine/threonine kinase), Zfp36l1 (zinc finger protein 36, C3H type-like 1), and Gadd45a (growth arrest and DNA damage–inducible α), were also identified in the liver and were enriched in significant patterns (Figure 4A). Forty-three DEGs in profile 17 were up-regulated after heat stress (P < 0.05). In contrast, 11 DEGs in profile 2 were down-regulated in heat treatment groups compared with the CT group (P < 0.05). The second significant pattern (profile 19), represented by 14 DEGs, shows that the expression of these genes increased with prolonged duration of heat stress. The fourth significant pattern, which included 11 DEGs, indicated that these genes were highly expressed in H60 compared to H30 and H120 conditions. The functional annotation of the 79 genes revealed that 25% of genes were involved in cellular processes (GO: 0009987), followed by 13% of genes involved in the process of response to stimulus (GO:0050896). Furthermore, a total of seven sublevels of response to stimulus were enriched by 19 genes (such as Hspa8 [HSP family A (Hsp70) member 8], Igtp (interferon gamma–induced GTPase), Gadd45g (growth arrest and DNA damage–inducible, gamma), Ddit4 (DNA damage–inducible transcript 4), Emd (emerin), Nr4a1 (nuclear receptor subfamily 4, group A, member 1), Ppp1r15a (protein phosphatase 1, regulatory subunit 15A), Sik1 (salt-inducible kinase 1), Irs2 (insulin receptor substrate 2), Tnfaip6 (TNFα-induced protein 6), Ndrg1 (N-myc downstream regulated 1), Per2 (period circadian regulator 2), Bok (BCL2 family apoptosis regulator BOK), Hspa1b, Amotl2 (angiomotin-like 2), Gadd45a, Ackr3 (atypical chemokine receptor 3), Dusp1 and Per3 (period circadian regulator 2), and the seven sublevel processes included response to external stimulus (GO: 0009605), response to stress (GO:0006950), response to abiotic stimulus (GO:0009628), response to chemical (GO:0042221), response to endogenous stimulus (GO:0009719), immune response (GO:0006955) and cellular response to stimulus (GO:0051716) (Figure 4E). Seven pathways were significantly (P < 0.05) enriched by these 79 genes (Figure 4F), including the most significant pathway circadian rhythm, followed by MAPK signaling pathway and protein digestion and absorption. In addition, validation experiments are needed to further verify whether or not these pathways play a vital role in heat stress response.
Cross-Species Analysis of Candidate Genes
Previous studies have shown that many heat stress responsive genes are orthologous across different mammalian species and have similar functions. For instance, HSP70 termed as Hspa4 in rat, HSPA1A in cattle, and HSPA1 in human, is involved in modulating a variety of physiological processes, including proliferation, apoptosis, and stress responses (Hao et al., 2018). Therefore, in order to further study the importance of potential candidate genes identified in the rat model, a cross-species analysis was performed, including cattle and human, based on gene homology. After combing the 69 and 73 genes in the liver and adrenal glands, respectively, a total of 140 unique genes were retained and converted to 108 cattle genes. Overlapping analysis between cattle genes and SNPs associated with RT, RR, and DS traits, and then retaining the SNP with the smallest P-values for each gene generated 53 unique genes related to the traits. Finally, four [SLCO1B3 (solute carrier organic anion transporter family member 1B3), FADS1 (fatty acid desaturase 1), KCNK5 (potassium two pore domain channel subfamily K member 5), COL1A1 (collagen type Iα 1 chain)], five [CLU (clusterin), FADS1, SPP1 (secreted phosphoprotein 1), PDLIM1 (PDZ and LIM domain 1), NPAS2 (neuronal PAS domain protein 2)], and five [ARNTL (aryl hydrocarbon receptor nuclear translocator-like), CSRNP3 (cysteine and serine-rich nuclear protein 3), NPAS2, NR4A1 (nuclear receptor subfamily 4 group A member 1), MREG (melanoregulin)] genes with significant SNPs for RT, RR, and DS were obtained, respectively. The detailed information related to these gene expression levels in rat tissues and their corresponding cattle genes and SNPs are shown in Supplementary Table 11. In dairy cattle, RT, RR, and DS are usually regarded as valuable physiological indicators for heat stress assessment (Mader et al., 2006; Kovacs et al., 2018).
To further explore the function of candidate genes in humans, a PheWAS analysis was performed for five genes, namely, SLCO1B3, CLU, and ARNTL, which had the most significant SNPs for the RT, RR, and DS traits, and FADS1 and NPAS2, which had significant SNPs identified for at least two traits. Figure 5 indicates that these genes were correlated with many human complex traits. From the endocrine category, we found that SLCO1B3, ARNTL, FADS1, and NPAS2 were the most significant genes related to hormone metabolism (e.g., insulin and thyroid-stimulating hormone; Figure 5). From the perspective of the environment, SLCO1B3 and CLU genes are strongly related to diseases, such as high blood pressure (Alencastro de Azevedo et al., 2012) and Alzheimer disease (Wilson and Zoubeidi, 2017), and ARNT1 and FADS1 are closely related to response to estradiol (Mitsushima et al., 2003) and hepatic metabolites (Zheng et al., 2020).
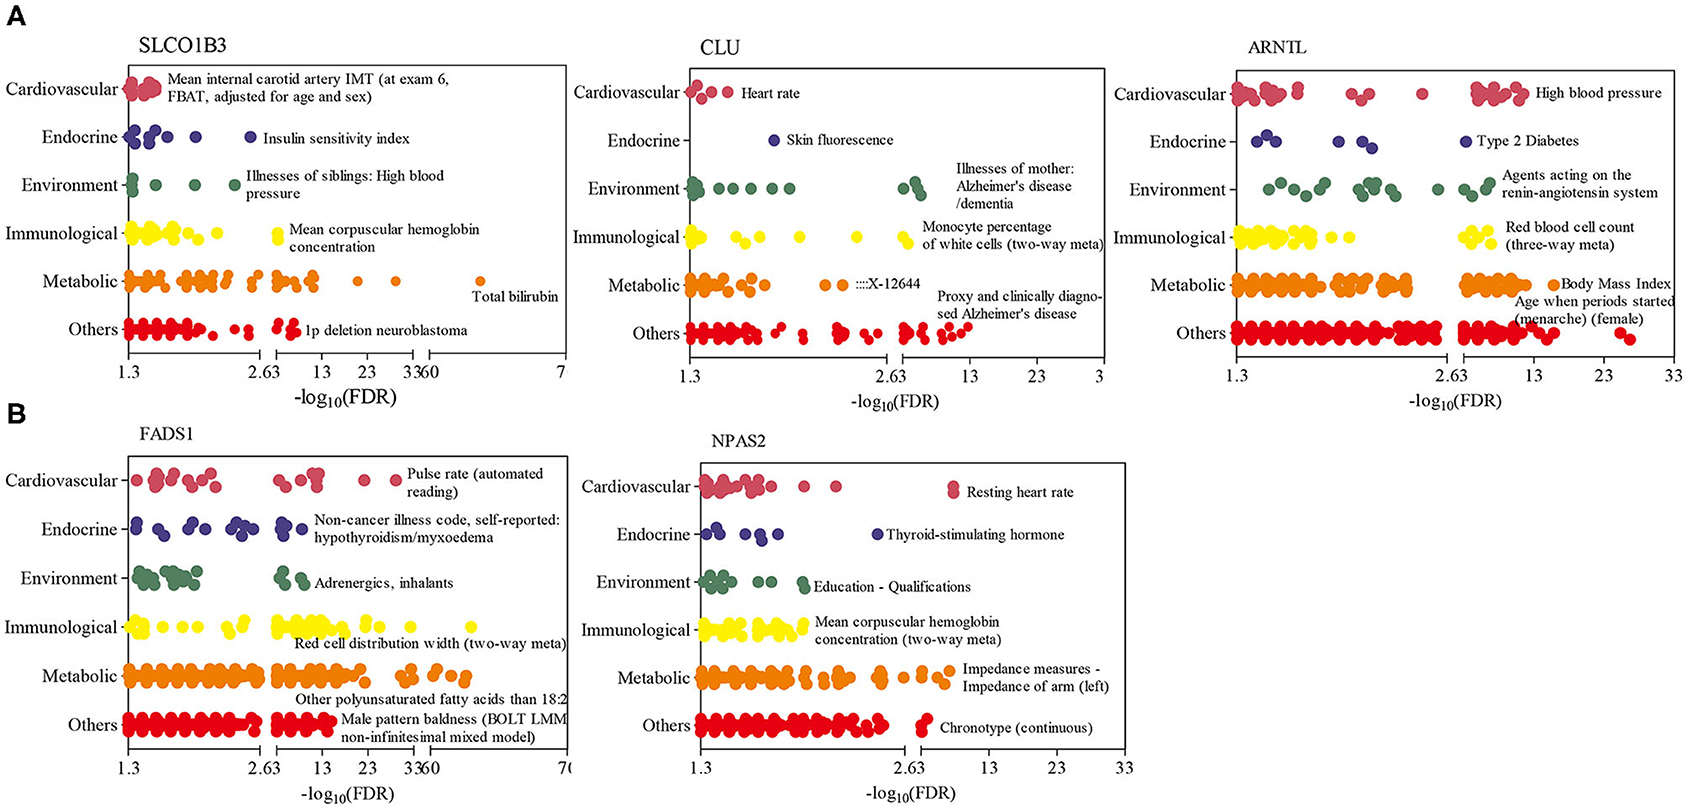
Figure 5. Phenome-wide association studies (PheWAS) results for five genes in humans. (A) PheWAS results of three genes, which had the most significant SNPs for rectal temperature (RT), respiration rate score (RR), and drooling score (DS) traits. (B) PheWAS results of two genes with SNPs identified for at least two SNP traits. The human complex traits were summarized mainly from six aspects, including cardiovascular, endocrinal, environmental, immunological, metabolic, and others (e.g., neurological, psychiatric, activities, respiratory). Only the name of the most significant trait in each aspect has been reported.
The SLCO1B3 gene encodes a liver-specific member of the organic anion transporter family, which encodes a protein that transports a variety of endogenous and exogenous compounds, including hormones and their conjugates, in addition to anticancer drugs (Sun et al., 2020). Accumulated data indicate that the abnormal expression and function of SLCO1B3 are related to resistance to anticancer drugs, and defective SLCO1B3 causes hyperbilirubinemia, rotor type (HBLRR), SLC transporter disorders, and metabolism of lipids and steroids disorders (Alencastro de Azevedo et al., 2012; Woo et al., 2017). Therefore, more investigations have been carried out to identify the potential SLCO1B3-related mechanisms of cancer drug resistance. However, the function of SLCO1B3 (Slco1b2 in rats) has not been reported in heat stress studies. Its regulatory mechanism in cancer, critical role in bile acid, bilirubin, and hormone transport may be helpful when exploring its potential mechanism related to heat stress response.
The CLU encoding protein is a secreted chaperone that can be found in the cell cytosol under stress conditions. CLU is involved in basic BPs, such as cell death, neurodegenerative disorder, and tumor progression (Bertacchini et al., 2019; Seo et al., 2019). Previous studies also demonstrated that the CLU protein can interact with HSP90AA1 and enhance the effect of HSP90AA1 on the activation of the Eph receptor B1 (ERK), AKT serine/threonine kinase 1 (AKT), and nuclear factor kappa B (NF-κB) families, in addition to epithelial-to-mesenchymal transition and migration in breast cancer cells (Tian et al., 2019). The CLU protein is mainly produced by rat Sertoli cells and protects surviving cells during heat stress by binding to toxic compounds or dissolving cellular debris released by the degenerating cells (Clark and Griswold, 1997). Furthermore, another heat stress experiment (43°C) performed on the scrotums of rats found that the apoptotic index in the treatment with siRNA targeting the CLU (>70% reduction in the expression of CLU mRNA) was markedly higher than that of the control group, suggesting that an increase in the secretion of CLU by Sertoli cells protects the testis from heat stress–induced injury (Matsushita et al., 2016). In the current study, CLU was up-regulated with FC ranging from 2.27 to 2.93 in adrenal glands after H30, H60, and H120 exposure, indicating that CLU may protect adrenal glands from heat stress–induced injury by inhibiting cell apoptosis. However, the detailed regulatory mechanism of CLU in animals remains largely unknown.
The ARNTL gene, also named as BMAL1, in which the encoding protein can form a heterodimer with circadian locomotor output cycles kaput (CLOCK) and, then, the BMAL1: CLOCK heterodimer, activates the transcription of genes, such as Period (PER1, PER2, and PER3) and Cryptochrome (CRY1, CRY2) by binding E-box enhancer elements (Tamaru and Takamatsu, 2018). The CLOCK system has the function of invoking daily time-dependent adaptive responses via interaction with various stress protection systems (Tamaru and Ikeda, 2016). The circadian CLOCK interacts with BMAL1, and heat shock factor-1 (HSF1) during heat stress and oxidative stress was previously reported (Tamaru et al., 2011). In addition, the CLOCK system also controls the expression of stress resistance genes (i.e., PER2 and BMAL1) (Zhang et al., 2014) and activates various adaptive protection pathways that control antioxidant and cell survival responses to protect cells from stressors (Kawamura et al., 2018). In summary, the ARNTL gene was identified in heat-stressed rats and cattle and also functions as an important biomarker for several diseases in humans (Engin, 2017; Maiese, 2017). Therefore, ARNTL is a good candidate gene for future heat stress studies.
The FADS1 gene–coding protein belongs to the FADS gene family. Variants in FADS1 have been associated with cardiometabolic risk factor (O'Neill and Minihane, 2017), plasma high sensitivity C-reactive protein (Roke et al., 2013), and oxylipin synthesis (Hester et al., 2014). NPAS2 is a circadian clock gene and is involved in the circadian clock pathway and metabolism of lipids (Yuan et al., 2020). A study has shown that the BMAL1/NPAS2 complex significantly induces the transcription of Fabp3 under cold stress (Chappuis et al., 2013). Up to now, no heat stress study has been conducted focusing on the FADS1 and NPAS2 genes; thus, this study provided new insights into the functions of FADS1 and NPAS2 in the heat stress response and the circadian adaptive system.
Five genes, including Slco1b2, Clu, Arntl, Fads1, and Npas2, were proposed as potential novel candidates for heat stress response in mammals. However, it is necessary to validate them by studying the expression changes in rats and other species at alternate temperatures and more time points. In addition, in a previous study in our research group, RNA-Seq analysis was performed on bovine granulosa cells at 38°C (control), 39, 40, and 41°C conditions, which revealed many DEGs associated with heat stress (Khan et al., 2020). Therefore, the RNA-Seq results from the rat study and bovine granulosa cells will be further integrated and analyzed to identify more important bovine heat stress response biomarkers.
Conclusions
Transcriptome profiles of blood, liver, and adrenal tissues of female Sprague–Dawley rats were generated, and valuable transcriptional genetic markers under heat stress conditions were identified. Four genes (Junb, P4hal, Chordcl, and RT1-Bb) differentially expressed in the blood, liver, and adrenal gland tissues under the H120 treatment, and 69 (liver) and 73 (adrenal glands) genes identified under various heat treatment conditions are suggested as key candidate genes for future studies. In particular, five genes (Slco1b2, Clu, Arntl, Fads1, and Npas2) were considered as novel candidates for heat stress response. This study provides valuable datasets and important findings from a rat model as background for future studies in both livestock and humans and for the mitigation of adverse consequences of rising global temperatures.
Data Availability Statement
The RNA-Sequencing datasets generated during the current study were available in the Sequence Read Archive (SRA) at the National Center for Biotechnology Information (NCBI) with BioProject accession number PRJNA690189.
Ethics Statement
The animal study was reviewed and approved by Institutional Animal Care and Use Committee from the China Agricultural University (Beijing, China). The in vivo rat experiments were performed at the College of Animal Science and Technology (China Agricultural University, Beijing, China). The Institutional Animal Care and Use Committee approved all the experimental procedures, which complied with the China Physiological Society's guiding principles for research involving animals and adhered to the high standard (best practice) of veterinary care as stipulated in the Guide for Care and Use of Laboratory Animals.
Author Contributions
YW and JD participated in the design of the study. JD collected samples, performed all the experiments, analyzed the data, and drafted the manuscript. YW and YY guided the experimental implementation. AC provided training on the bioinformatics and functional analysis to the first author, contributed to the analyses, and results interpretation. LB and FS gave editorial assistance. LB, FS, YW, YY, and AC edited the final version of the manuscript and provided valuable suggestions. All authors reviewed and approved the final draft.
Funding
This work was supported by the fund of Modern Agroindustry Technology Research System of China (No. CARS-36) and the program for Changjiang Scholar and Innovation Research Team in University of China (No. IRT_15R62). The JD also acknowledges the scholarship provided by the China Scholarship Council (CSC).
Conflict of Interest
The authors declare that the research was conducted in the absence of any commercial or financial relationships that could be construed as a potential conflict of interest.
Supplementary Material
The Supplementary Material for this article can be found online at: https://www.frontiersin.org/articles/10.3389/fgene.2021.651979/full#supplementary-material
Supplementary Figure 1. The principal component analysis (PCA) of samples in each comparison of tissue. CT means rats were kept at 22 ± 1°C and relative humidity 50%; H30, H60, and H120 mean rats were kept at 42°C for 30, 60, and 120 min, and the relative humidity 50% conditions.
Supplementary Figure 2. Expression patterns of shared genes identified in varies conditions. (A) Heat map of four shared DEGs of blood, liver, and adrenal gland tissues in CT vs. H120. (B) Heat map of 73 shared DEGs of liver identified in comparisons of CT vs. H30, CT vs. H60, and CT vs. H120. (C) Heat map of 91 shared DEGs of adrenal glands identified in comparisons of CT vs. H30, CT vs. H60, and CT vs. H120.
Supplementary Table 1. Quality of sequencing reads of liver and adrenal glands in the H30 and H60 groups.
Supplementary Table 2. Descriptive statistics of reads generated by 48 RNA-Seq libraries alignment to reference genome.
Supplementary Table 3. The statistics of differentially expressed genes (DEGs) with P < 0.05 and |fold change| >2 in blood in comparison of CT vs. H120.
Supplementary Table 4. Statistics of differentially expressed genes (DEGs) with P < 0.01, FDR-adjusted P = 0.05 and |fold change| >2 in liver in comparison of CT vs. H30.
Supplementary Table 5. Statistics of differentially expressed genes (DEGs) with P < 0.01, FDR-adjusted P = 0.05 and |fold change| >2 in liver in comparison of CT vs. H60.
Supplementary Table 6. Statistics of differentially expressed genes (DEGs) with P < 0.01, FDR-adjusted P = 0.05 and |fold change| >2 in liver in comparison of CT vs. H120.
Supplementary Table 7. Statistics of differentially expressed genes (DEGs) with P < 0.01, FDR-adjusted P = 0.05 and |fold change| >2 in adrenal glands in comparison of CT vs. H30.
Supplementary Table 8. Statistics of differentially expressed genes (DEGs) with P < 0.01, FDR-adjusted P = 0.05 and |fold change| >2 in adrenal glands in comparison of CT vs. H60.
Supplementary Table 9. Statistics of differentially expressed genes (DEGs) with P < 0.01, FDR-adjusted P = 0.05 and |fold change| >2 in adrenal glands in comparison of CT vs. H120.
Supplementary Table 10. Significantly enriched biological processes (BPs) from differentially expressed genes (DEGs) identified in blood, liver, and adrenal glands.
Supplementary Table 11. Detailed information of genes in rat tissues and their overlapped cow single-nucleotide polymorphisms (SNPs) (P < 0.05).
References
Abravaya, K., Myers, M. P., Murphy, S. P., and Morimoto, R. I. (1992). The human heat shock protein hsp70 interacts with HSF, the transcription factor that regulates heat shock gene expression. Genes Dev. 7, 1153–1164. doi: 10.1101/gad.6.7.1153
Alemu, T. W., Pandey, H. O., Salilew Wondim, D., Gebremedhn, S., Neuhof, C., Tholen, E., et al. (2018). Oxidative and endoplasmic reticulum stress defense mechanisms of bovine granulosa cells exposed to heat stress. Theriogenology 110, 130–141. doi: 10.1016/j.theriogenology.2017.12.042
Alencastro de Azevedo, L., Reverbel da Silveira, T., Carvalho, C. G., Martins de Castro, S., Giugliani, R., and Matte, U. (2012). UGT1A1, SLCO1B1, and SLCO1B3 polymorphisms vs. neonatal hyperbilirubinemia: is there an association? Pediatr. Res. 72, 169–173. doi: 10.1038/pr.2012.60
Allison, D. B., Cui, X., Page, G. P., and Sabripour, M. (2006). Microarray data analysis: from disarray to consolidation and consensus. Nat. Rev. Genet. 7, 55–65. doi: 10.1038/nrg1749
Armstrong, D. V. (1994). Heat stress interaction with shade and cooling. J. Dairy Sci. 77, 2044–2050. doi: 10.3168/jds.S0022-0302(94)77149-6
Ashburner, M., Ball, C. A., Blake, J. A., Botstein, D., Butler, H., Cherry, J. M., et al. (2000). Gene ontology: tool for the unification of biology. Nat. Genet. 25, 25–29. doi: 10.1038/75556
Asselstine, V., Miglior, F., Suarez-Vega, A., Fonseca, P. A. S., Mallard, B., Karrow, N., et al. (2019). Genetic mechanisms regulating the host response during mastitis. J. Dairy Sci. 102, 9043–9059. doi: 10.3168/jds.2019-16504
Azhar, S., Nomoto, A., and Reaven, E. (2002). Hormonal regulation of adrenal microvillar channel formation. J. Lipid Res. 43, 861–871. doi: 10.1016/S0022-2275(20)30459-4
Bagath, M., Krishnan, G., Devaraj, C., Rashamol, V. P., Pragna, P., Lees, A. M., et al. (2019). The impact of heat stress on the immune system in dairy cattle: a review. Res. Vet. Sci. 126, 94–102. doi: 10.1016/j.rvsc.2019.08.011
Baler, R., Zou, J., and Voellmy, R. (1996). Evidence for a role of Hsp70 in the regulation of the heat shock response in mammalian cells. Cell Stress Chaperones. 1, 33–39. doi: 10.1379/1466-1268(1996)001<0033:EFAROH>2.3.CO;2
Belhadj-Slimen, I., Najar, T., Ghram, A., and Abdrrabba, M. (2016). Heat stress effects on livestock: molecular, cellular and metabolic aspects, a review. J. Anim. Physiol. Anim. Nutr. 100, 401–412. doi: 10.1111/jpn.12379
Bertacchini, J., Mediani, L., Beretti, F., Guida, M., Ghalali, A., Brugnoli, F., et al. (2019). Clusterin enhances AKT2-mediated motility of normal and cancer prostate cells through a PTEN and PHLPP1 circuit. J. Cell. Physiol. 234, 11188–11199. doi: 10.1002/jcp.27768
Blake, M. J., Udelsman, R., Feulner, G. J., Norton, D. D., and Holbrook, N. J. (1991). Stress-induced heat shock protein 70 expression in adrenal cortex: an adrenocorticotropic hormone-sensitive, age-dependent response. Proc. Natl. Acad. Sci. U. S. A. 88, 9873–9877. doi: 10.1073/pnas.88.21.9873
Bohmanova, J., Misztal, I., and Cole, J. B. (2007). Temperature-humidity indices as indicators of milk production losses due to heat stress. J. Dairy Sci. 90, 1947–1956. doi: 10.3168/jds.2006-513
Brito, L. F., Oliveira, H. R., McConn, B. R., Schinckel, A. P., Arrazola, A, Marchant-Forde, J. N., et al. (2020). Large-scale phenotyping of livestock welfare in commercial production systems: a new frontier in animal breeding. Front. Genet. 11:793. doi: 10.3389/fgene.2020.00793
Cánovas, A., Pena, R. N., Gallardo, D., Ramirez, O., Amills, M., and Quintanilla, R. (2012). Segregation of regulatory polymorphisms with effects on the gluteus medius transcriptome in a purebred pig population. PLoS One 7:e35583. doi: 10.1371/journal.pone.0035583
Cánovas, A., Reverter, A., DeAtley, K. L., Ashley, R. L., Colgrave, M. L., Fortes, M. R., et al. (2014b). Multi-tissue omics analyses reveal molecular regulatory networks for puberty in composite beef cattle. PLoS One 9:e102551. doi: 10.1371/journal.pone.0102551
Cánovas, A., Rincon, G., Bevilacqua, C., Islas-Trejo, A., Brenaut, P., Hovey, R. C., et al. (2014a). Comparison of five different RNA sources to examine the lactating bovine mammary gland transcriptome using RNA-Sequencing. Sci. Rep. 4:5297. doi: 10.1038/srep05297
Cánovas, A., Rincon, G., Islas-Trejo, A., Jimenez-Flores, R., Laubscher, A., and Medrano, J. F. (2013). RNA sequencing to study gene expression and single nucleotide polymorphism variation associated with citrate content in cow milk. J. Dairy Sci. 96, 2637–2648. doi: 10.3168/jds.2012-6213
Cardoso, T. F., Cánovas, A., Canela-Xandri, O., Gonzalez-Prendes, R., Amills, M., and Quintanilla, R. (2017). RNA-seq based detection of differentially expressed genes in the skeletal muscle of Duroc pigs with distinct lipid profiles. Sci. Rep. 7:40005. doi: 10.1038/srep40005
Cardoso, T. F., Quintanilla, R., Castello, A., Gonzalez-Prendes, R., Amills, M., and Cánovas, A. (2018). Differential expression of mRNA isoforms in the skeletal muscle of pigs with distinct growth and fatness profiles. BMC Genomics 19:145. doi: 10.1186/s12864-018-4515-2
Chappuis, S., Ripperger, J. A., Schnell, A., Rando, G., Jud, C., and Wahli, W. (2013). Role of the circadian clock gene Per2 in adaptation to cold temperature. Mol. Metab. 2, 184–193. doi: 10.1016/j.molmet.2013.05.002
Cheshire, W. P. Jr. (2016). Thermoregulatory disorders and illness related to heat and cold stress. Auton. Neurosci. 196, 91–104. doi: 10.1016/j.autneu.2016.01.001
Clark, A. M., and Griswold, M. D. (1997). Expression of clusterin/sulfated glycoprotein-2 under conditions of heat stress in rat Sertoli cells and a mouse Sertoli cell line. J. Androl. 18, 257–263.
Cohn, E. J. (2015). Blood - a brief survey of its chemical components and of their natural functions and clinical uses. Blood 126:2531. doi: 10.1182/blood-2015-10-676718
De Rensis, F., Garcia-Ispierto, I., and Lopez-Gatius, F. (2015). Seasonal heat stress: clinical implications and hormone treatments for the fertility of dairy cows. Theriogenology 84, 659–666. doi: 10.1016/j.theriogenology.2015.04.021
Dikmen, S., and Hansen, P. J. (2009). Is the temperature-humidity index the best indicator of heat stress in lactating dairy cows in a subtropical environment? J. Dairy Sci. 92, 109–116. doi: 10.3168/jds.2008-1370
Dimicco, J. A., and Zaretsky, D. V. (2007). The dorsomedial hypothalamus: a new player in thermoregulation. Am. J. Physiol. Regul. 292, R47–R63. doi: 10.1152/ajpregu.00498.2006
Ding, W., Wang, L., Qiu, P., Kostich, M., Greene, J., and Hernandez, M. (2002). Domain-oriented functional analysis based on expression profiling. BMC Genomics 3:32. doi: 10.1186/1471-2164-3-32
Dou, J., Khan, A., Khan, M. Z., Mi, S., Wang, Y., Yu, Y., et al. (2020). Heat stress impairs the physiological responses and regulates genes coding for extracellular exosomal proteins in rat. Genes (Basel) 11:306. doi: 10.3390/genes11030306
Dou, J., Montanholi, Y. R., Wang, Z., Li, Z., Yu, Y., Martell, J. E., et al. (2019). Corticosterone tissue-specific response in Sprague Dawley rats under acute heat stress. J. Therm. Biol. 81, 12–19. doi: 10.1016/j.jtherbio.2019.02.004
Engin, A. (2017). Circadian rhythms in diet-induced obesity. Adv. Exp. Med. Biol. 960, 19–52. doi: 10.1007/978-3-319-48382-5_2
Ernst, J., and Bar-Joseph, Z. (2006). STEM: a tool for the analysis of short time series gene expression data. BMC Bioinform. 7:191. doi: 10.1186/1471-2105-7-191
García, N., and Chávez, E. (2007). Mitochondrial DNA fragments released through the permeability transition pore correspond to specific gene size. Life Sci. 81, 1160–1166. doi: 10.1016/j.lfs.2007.08.019
Garner, J. B., Chamberlain, A. J., Vander Jagt, C., Nguyen, T. T. T., Mason, B. A., and Marett, L. C. (2020). Gene expression of the heat stress response in bovine peripheral white blood cells and milk somatic cells in vivo. Sci. Rep. 10:19181. doi: 10.1038/s41598-020-75438-2
Gaudet, P., Livstone, M. S., Lewis, S. E., and Thomas, P. D. (2011). Phylogenetic-based propagation of functional annotations within the Gene Ontology consortium. Brief. Bioinform. 12, 449–462. doi: 10.1093/bib/bbr042
Greene, J. S., Kalkstein, L. S., Kim, K. R., Choi, Y. J., and Lee, D. G. (2016). The application of the European heat wave of 2003 to Korean cities to analyze impacts on heat-related mortality. Int. J. Biometeorol. 60, 231–243. doi: 10.1007/s00484-015-1020-z
Han, J., Shao, J., Chen, Q., Sun, H., Guan, L., and Li, Y. (2019). Transcriptional changes in the hypothalamus, pituitary, and mammary gland underlying decreased lactation performance in mice under heat stress. FASEB J. 33, 12588–12601. doi: 10.1096/fj.201901045R
Hao, Y., Feng, Y., Li, J., and Gu, X. (2018). Role of MAPKs in HSP70's protection against heat stress-induced injury in rat small intestine. BioMed Res. Int. 2018:1571406. doi: 10.1155/2018/1571406
Hester, A. G., Murphy, R. C., Uhlson, C. J., Ivester, P., Lee, T. C., Sergeant, S., et al. (2014). Relationship between a common variant in the fatty acid desaturase (FADS) cluster and eicosanoid generation in humans. J. Biol. Chem. 289, 22482–22489. doi: 10.1074/jbc.M114.579557
Hubbard, A. H., Zhang, X., Jastrebski, S., Singh, A., and Schmidt, C. (2019). Understanding the liver under heat stress with statistical learning: an integrated metabolomics and transcriptomics computational approach. BMC Genomics 20:502. doi: 10.1186/s12864-019-5823-x
Jeon, H. J., Han, S. R., Lim, K. H., Won, K. A., Bae, Y. C., and Ahn, D. K. (2011). Intracisternal administration of NR2 subunit antagonists attenuates the nociceptive behavior and p-p38 MAPK expression produced by compression of the trigeminal nerve root. Mol. Pain 7:46. doi: 10.1186/1744-8069-7-46
Jerônimo, R., Moraes, M. N., de Assis, L. V. M., Ramos, B. C., Rocha, T., and Castrucci, A. M. L. (2017). Thermal stress in Danio rerio: a link between temperature, light, thermo-TRP channels, and clock genes. J. Therm. Biol. 68, 128–138. doi: 10.1016/j.jtherbio.2017.02.009
Johnson, R. J., Sanchez-Lozada, L. G., Newman, L. S., Lanaspa, M. A., Diaz, H. F., Lemery, J., et al. (2019). Climate change and the kidney. Ann. Nutr. Metab. 3, 38–44. doi: 10.1159/000500344
Kadzere, C. T., Murphy, M. R., Silanikove, N., and Maltz, E. (2002). Heat stress in lactating dairy cows: a review. Livestock Prod. Sci. 77, 59–91. doi: 10.1016/S0301-6226(01)00330-X
Kawamura, G., Hattori, M., Takamatsu, K., Tsukada, T., Ninomiya, Y., Benjamin, I., et al. (2018). Cooperative interaction among BMAL1, HSF1, and p53 protects mammalian cells from UV stress. Commun. Biol. 1:204. doi: 10.1038/s42003-018-0209-1
Khan, A., Dou, J., Wang, Y., Jiang, X., Khan, M. Z., Luo, H., et al. (2020). Evaluation of heat stress effects on cellular and transcriptional adaptation of bovine granulosa cells. J. Anim. Sci. Biotechnol. 11:25. doi: 10.1186/s40104-019-0408-8
Kiddle, S. J., Voyle, N., and Dobson, R. J. B. (2018). A blood test for Alzheimer's disease: progress, challenges, and recommendations. J. Alzheimers Dis. 64, S289–S297. doi: 10.3233/JAD-179904
Koko, V., Djordjeviae, J., Cvijiae, G., and Davidoviae, V. (2004). Effect of acute heat stress on rat adrenal glands: a morphological and stereological study. J. Exp. Biol. 207, 4225–4230. doi: 10.1242/jeb.01280
Kovacs, L., Kezer, F. L., Ruff, F., Jurkovich, V., and Szenci, O. (2018). Heart rate, cardiac vagal tone, respiratory rate, and rectal temperature in dairy calves exposed to heat stress in a continental region. Int. J. Biometeorol. 62, 1791–1797. doi: 10.1007/s00484-018-1581-8
Le Masson, F., and Christians, E. (2011). HSFs and regulation of Hsp70.1 (Hspa1b) in oocytes and preimplantation embryos: new insights brought by transgenic and knockout mouse models. Cell Stress Chaperones 16, 275–285. doi: 10.1007/s12192-010-0239-1
Lee, J., Lee, S., Son, J., Lim, H., Kim, E., and Choi, I. (2020). Analysis of circulating-microRNA expression in lactating Holstein cows under summer heat stress. PLoS One 15:e0231125. doi: 10.1101/2020.03.18.996777
Lees, A. M., Lees, J. C., Lisle, A. T., Sullivan, M. L., and Gaughan, J. B. (2018). Effect of heat stress on rumen temperature of three breeds of cattle. Int. J. Biometeorol. 62, 207–215. doi: 10.1007/s00484-017-1442-x
Leon, L. R., DuBose, D. A., and Mason, C. W. (2005). Heat stress induces a biphasic thermoregulatory response in mice. Am. J. Physiol. Regul. Integr. Comp. Physiol. 288, R197–204. doi: 10.1152/ajpregu.00046.2004
Li, G., Chen, S., Chen, J., Peng, D., and Gu, X. (2020). Predicting rectal temperature and respiration rate responses in lactating dairy cows exposed to heat stress. J. Dairy Sci. 103, 5466–5484. doi: 10.3168/jds.2019-16411
Li, J. Y., Yong, Y. H., Gong, D. L., Shi, L., Wang, X. M., Gooneratne, R., et al. (2019a). Proteomic analysis of the response of porcine adrenal gland to heat stress. Res. Vet. Sci. 122, 102–110. doi: 10.1016/j.rvsc.2018.11.004
Li, Y., Kong, L., Deng, M., Lian, Z., Han, Y., Sun, B., et al. (2019b). Heat stress-responsive transcriptome analysis in the liver tissue of hu sheep. Genes (Basel) 10:395. doi: 10.3390/genes10050395
Locke, M., and Tanguay, R. M. (1996). Diminished heat shock response in the aged myocardium. Cell Stress Chaperones 1, 251–260. doi: 10.1379/1466-1268(1996)001<0251:DHSRIT>2.3.CO;2
Lucy, M. C., and Safranski, T. J. (2017). Heat stress in pregnant sows: thermal responses and subsequent performance of sows and their offspring. Mol. Reprod. Dev. 84, 946–956. doi: 10.1002/mrd.22844
Luo, H., Luiz, F. B., Li, X., Su, G., Dou, J., Xu, W., et al. (2020). Genetic parameters for rectal temperature, respiration rate, and drooling score in Holstein cattle and its relationship with various fertility, production, body conformation, and health traits. Journal of dairy science. 104, 4390–4403. doi: 10.3168/jds.2020-19192
Ma, L., Yang, Y., Zhao, X., Wang, F., Gao, S., and Bu, D. (2019). Heat stress induces proteomic changes in the liver and mammary tissue of dairy cows independent of feed intake: An iTRAQ study. PLoS One 14:e0209182. doi: 10.1371/journal.pone.0209182
Mader, T. L., Davis, M. S., and Brown-Brandl, T. (2006). Environmental factors influencing heat stress in feedlot cattle. J. Anim. Sci. 84, 712–719. doi: 10.2527/2006.843712x
Maiese, K. (2017). Moving to the rhythm with clock (circadian) genes, autophagy, mTOR, and SIRT1 in degenerative disease and cancer. Curr. Neurovasc. Res. 14, 299–304. doi: 10.2174/1567202614666170718092010
Matsushita, K. M. H., Chiba, K., and Fujisawa, M. (2016). Clusterin produced by Sertoli cells inhibits heat stress-induced apoptosis in the rat testis. Andrologia 48, 11–19. doi: 10.1111/and.12404
Meaney, M. J., Bhatnagar, S., Larocque, S., McCormick, C., Shanks, N., and Sharma, S. (1993). Individual differences in the hypothalamic-pituitary-adrenal stress response and the hypothalamic CRF system. Ann. N.Y. Acad. Sci. 697, 70–85. doi: 10.1111/j.1749-6632.1993.tb49924.x
Medici, V., Kieffer, D. A., Shibata, N. M., Chima, H., Kim, K., Cánovas, A., et al. (2016). Wilson disease: epigenetic effects of choline supplementation on phenotype and clinical course in a mouse model. Epigenetics 11, 804–818. doi: 10.1080/15592294.2016.1231289
Mi, H., Muruganujan, A., Ebert, D., Huang, X., and Thomas, P. D. (2019). PANTHER version 14: more genomes, a new PANTHER GO-slim and improvements in enrichment analysis tools. Nucleic Acids Res. 47, D419–D426. doi: 10.1093/nar/gky1038
Mitsushima, D., Funabashi, T., and Kimura, F. (2003). Estrogen increases messenger RNA and immunoreactivity of aryl-hydrocarbon receptor nuclear translocator 2 in the rat mediobasal hypothalamus. Biochem. Biophys. Res. Commun. 307, 248–253. doi: 10.1016/S0006-291X(03)01171-9
Mortazavi, A., Williams, B. A., McCue, K., Schaeffer, L., and Wold, B. (2008). Mapping and quantifying mammalian transcriptomes by RNA-Seq. Nat. Methods 5, 621–628. doi: 10.1038/nmeth.1226
Nisenblat, V., Bossuyt, P. M., Shaikh, R., Farquhar, C., Jordan, V., Scheffers, C. S., et al. (2016). Blood biomarkers for the non-invasive diagnosis of endometriosis. Cochrane Database Syst. Rev. 5:CD012179. doi: 10.1002/14651858.CD012179
Ogneva, I. V., Biryukov, N. S., Leinsoo, T. A., and Larina, I. M. (2014). Possible role of non-muscle alpha-actinins in muscle cell mechanosensitivity. PLoS One 9:e96395. doi: 10.1371/journal.pone.0096395
O'Neill, C. M., and Minihane, A. M. (2017). The impact of fatty acid desaturase genotype on fatty acid status and cardiovascular health in adults. Proc. Nutr. Soc. 76, 64–75. doi: 10.1017/S0029665116000732
Oster, H., Damerow, S., Kiessling, S., Jakubcakova, V., Abraham, D., Tian, J., et al. (2006). The circadian rhythm of glucocorticoids is regulated by a gating mechanism residing in the adrenal cortical clock. Cell Metab. 4, 163–173. doi: 10.1016/j.cmet.2006.07.002
Pantazopoulos, H., Gamble, K., Stork, O., and Amir, S. (2018). Circadian rhythms in regulation of brain processes and role in psychiatric disorders. Neural Plast. 4, 163–173. doi: 10.1155/2018/5892657
Polsky, L., and von Keyserlingk, M. A. G. (2017). Invited review: effects of heat stress on dairy cattle welfare. J. Dairy Sci. 100, 8645–8657. doi: 10.3168/jds.2017-12651
Quinlan, A. R., and Hall, I. M. (2010). BEDTools: a flexible suite of utilities for comparing genomic features. Bioinformatics 26, 841–842. doi: 10.1093/bioinformatics/btq033
Rakesh, V., Stallings, J. D., and Reifman, J. (2014). A virtual rat for simulating environmental and exertional heat stress. J. Appl. Physiol. 117, 1278–1286. doi: 10.1152/japplphysiol.00614.2014
Ralph, M. R., Foster, R. G., Davis, F. C., and Menaker, M. (1990). Transplanted suprachiasmatic nucleus determines circadian period. Science 247, 975–978. doi: 10.1126/science.2305266
Rigotti, A., Trigatti, B. L., Penman, M., Rayburn, H., Herz, J., and Krieger, M. (1997). A targeted mutation in the murine gene encoding the high density lipoprotein (HDL) receptor scavenger receptor class B type I reveals its key role in HDL metabolism. Proc. Natl. Acad. Sci. U. S. A. 94, 12610–12615. doi: 10.1073/pnas.94.23.12610
Robinson, M. D., McCarthy, D. J., and Smyth, G. K. (2010). edgeR: a Bioconductor package for differential expression analysis of digital gene expression data. Bioinformatics 26, 139–140. doi: 10.1093/bioinformatics/btp616
Roke, K., Ralston, J., Abdelmagid, S., Nielsen, D. E., Badawi, A., El-Sohemy, A., et al. (2013). Variation in the FADS1/2 gene cluster alters plasma n-6 PUFA and is weakly associated with hsCRP levels in healthy young adults. Prostaglandins Leukot. Essent. Fatty Acids 89, 257–263. doi: 10.1016/j.plefa.2013.06.003
Saeed, M., Abbas, G., Alagawany, M., Kamboh, A. A., Abd, El-Hack, M. E., Khafaga, A. F., et al. (2019). Heat stress management in poultry farms: a comprehensive overview. J. Therm. Biol. 84, 414–425. doi: 10.1016/j.jtherbio.2019.07.025
Seo, H. Y., Lee, S. H., Lee, J. H., Kang, Y. N., Choi, Y. K., Hwang, J. S., et al. (2019). Clusterin attenuates hepatic fibrosis by inhibiting hepatic stellate cell activation and downregulating the Smad3 signaling pathway. Cells. 8:1442. doi: 10.3390/cells8111442
Sun, R., Ying, Y., Tang, Z., Liu, T., Shi, F., Li, H., et al. (2020). The emerging role of the SLCO1B3 protein in cancer resistance. Protein Peptide Lett. 27, 17–29. doi: 10.2174/0929866526666190926154248
Sweett, H., Fonseca, P. A. S., Suarez-Vega, A., Livernois, A., and Cánovas, A. (2020). Genome-wide association study to identify genomic regions and positional candidate genes associated with male fertility in beef cattle. Sci. Rep. 10:20102. doi: 10.1038/s41598-020-75758-3
Tamaru, T., Hattori, M., Honda, K., Benjamin, I., Ozawa, T., and Takamatsu, K. (2011). Synchronization of circadian Per2 rhythms and HSF1-BMAL1:CLOCK interaction in mouse fibroblasts after short-term heat shock pulse. PLoS ONE 6:e24521. doi: 10.1371/journal.pone.0024521
Tamaru, T., and Ikeda, M. (2016). Circadian adaptation to cell injury stresses: a crucial interplay of BMAL1 and HSF1. J. Physiol. Sci. 66, 303–306. doi: 10.1007/s12576-016-0436-5
Tamaru, T., and Takamatsu, K. (2018). Circadian modification network of a core clock driver BMAL1 to harmonize physiology from brain to peripheral tissues. Neurochem. Int. 119, 11–16. doi: 10.1016/j.neuint.2017.12.013
Tamura, Y., Matsunaga, Y., Kitaoka, Y., and Hatta, H. (2017). Effects of heat stress treatment on age-dependent unfolded protein response in different types of skeletal muscle. J. Gerontol. A Biol. Sci. Med. Sci. 72, 299–308. doi: 10.1093/gerona/glw063
Thompson, S. M., Jondal, D. E., Butters, K. A., Knudsen, B. E., Anderson, J. L., and Roberts, L. R. (2018). Heat stress and thermal ablation induce local expression of nerve growth factor inducible (VGF) in hepatocytes and hepatocellular carcinoma: preclinical and clinical studies. Gene Expr. 19, 37–47. doi: 10.3727/105221618X15305531034617
Tian, Y., Wang, C., Chen, S., Liu, J., Fu, Y., and Luo, Y. (2019). Extracellular Hsp90α and clusterin synergistically promote breast cancer epithelial-to-mesenchymal transition and metastasis via LRP1. J. Cell Sci. 132:jcs228213. doi: 10.1242/jcs.228213
Volodina, O., Ganesan, S., Pearce, S. C., Gabler, N. K., Baumgard, L. H., Rhoads, R. P., et al. (2017). Short-term heat stress alters redox balance in porcine skeletal muscle. Physiol. Rep. 5:e13267. doi: 10.14814/phy2.13267
Vonk, L. A., Doulabi, B. Z., Huang, C. L., Helder, M. N., Everts, V., and Bank, R. A. (2010). Endoplasmic reticulum stress inhibits collagen synthesis independent of collagen-modifying enzymes in different chondrocyte populations and dermal fibroblasts. Biochem. Cell Biol. 88, 539–552. doi: 10.1139/O09-174
Wang, J., Xue, X., Liu, Q., Zhang, S., Peng, M., Zhou, J., et al. (2019). Effects of duration of thermal stress on growth performance, serum oxidative stress indices, the expression and localization of ABCG2 and mitochondria ROS production of skeletal muscle, small intestine and immune organs in broilers. J. Therm. Biol. 85:102420. doi: 10.1016/j.jtherbio.2019.102420
Watanabe, K., Stringer, S., Frei, O., Mirkov, M. U., de Leeuw, C., Polderman, T. J. C., et al. (2020). Author correction: a global overview of pleiotropy and genetic architecture in complex traits. Nat. Genet. 52:353. doi: 10.1038/s41588-019-0571-z
Wickramasinghe, S., Cánovas, A., Rincon, G., and Medrano, J. F. (2014). RNA-Sequencing: a tool to explore new frontiers in animal genetics. Livestock Sci. 166, 206–216. doi: 10.1016/j.livsci.2014.06.015
Wilking, M., Ndiaye, M., Mukhtar, H., and Ahmad, N. (2013). Circadian rhythm connections to oxidative stress: implications for human health. Antioxid. Redox Signal. 19, 192–208. doi: 10.1089/ars.2012.4889
Wilson, M. R., and Zoubeidi, A. (2017). Clusterin as a therapeutic target. Expert Opin Ther Target 21, 201–213. doi: 10.1080/14728222.2017.1267142
Woo, H. I., Kim, S. R., Huh, W., Ko, J. W., and Lee, S. Y. (2017). Association of genetic variations with pharmacokinetics and lipid-lowering response to atorvastatin in healthy Korean subjects. Drug Des. Dev. Ther. 11, 1135–1146. doi: 10.2147/DDDT.S131487
Xu, Y., Lai, X., Li, Z., Zhang, X., and Luo, Q. (2018). Effect of chronic heat stress on some physiological and immunological parameters in different breed of broilers. Poult. Sci. 97, 4073–4082. doi: 10.3382/ps/pey256
Yuan, P., Yang, T., Mu, J., Zhao, J., Yang, Y., Yan, Z., et al. (2020). Circadian clock gene NPAS2 promotes reprogramming of glucose metabolism in hepatocellular carcinoma cells. Cancer Lett. 469, 498–509. doi: 10.1016/j.canlet.2019.11.024
Zhang, R., Lahens, N. F., Ballance, H. I., Hughes, M. E., and Hogenesch, J. B. (2014). A circadian gene expression atlas in mammals: implications for biology and medicine. Proc. Natl. Acad. Sci. U. S. A. 111, 16219–16224. doi: 10.1073/pnas.1408886111
Keywords: heat stress response, RNA-sequencing, thermal tolerance, rats' transcriptome, mammals
Citation: Dou J, Cánovas A, Brito LF, Yu Y, Schenkel FS and Wang Y (2021) Comprehensive RNA-Seq Profiling Reveals Temporal and Tissue-Specific Changes in Gene Expression in Sprague–Dawley Rats as Response to Heat Stress Challenges. Front. Genet. 12:651979. doi: 10.3389/fgene.2021.651979
Received: 11 January 2021; Accepted: 02 March 2021;
Published: 09 April 2021.
Edited by:
Naoyuki Kataoka, The University of Tokyo, JapanReviewed by:
Makoto Kashima, Aoyama Gakuin University, JapanArgyris Papantonis, University Medical Center Göttingen, Germany
Copyright © 2021 Dou, Cánovas, Brito, Yu, Schenkel and Wang. This is an open-access article distributed under the terms of the Creative Commons Attribution License (CC BY). The use, distribution or reproduction in other forums is permitted, provided the original author(s) and the copyright owner(s) are credited and that the original publication in this journal is cited, in accordance with accepted academic practice. No use, distribution or reproduction is permitted which does not comply with these terms.
*Correspondence: Yachun Wang, d2FuZ3lhY2h1bkBjYXUuZWR1LmNu