
95% of researchers rate our articles as excellent or good
Learn more about the work of our research integrity team to safeguard the quality of each article we publish.
Find out more
ORIGINAL RESEARCH article
Front. Genet. , 28 May 2021
Sec. Genomics of Plants and the Phytoecosystem
Volume 12 - 2021 | https://doi.org/10.3389/fgene.2021.651785
This article is part of the Research Topic Pan-Genome Level Genotype and Phenotype Prediction: Advances in Precision Agriculture View all 15 articles
 Qing Wang1,2†Ning Yan1,2†Hao Chen1,2Sirui Li3Haiyan Hu4
 Yu Lin1,2Haoran Shi1,2Kunyu Zhou1,2Xiaojun Jiang1,2Shifan Yu1,2Caixia Li2Guangdeng Chen5Zisong Yang6
 Yaxi Liu1,2*
Aegilops tauschii is the diploid progenitor of the D subgenome of hexaploid wheat (Triticum aestivum L.). Here, the phenotypic data of kernel length (KL), kernel width (KW), kernel volume (KV), kernel surface area (KSA), kernel width to length ratio (KWL), and hundred-kernel weight (HKW) for 223 A. tauschii accessions were gathered across three continuous years. Based on population structure analysis, 223 A. tauschii were divided into two subpopulations, namely T-group (mainly included A. tauschii ssp. tauschii accessions) and S-group (mainly included A. tauschii ssp. strangulata). Classifications based on cluster analysis were highly consistent with the population structure results. Meanwhile, the extent of linkage disequilibrium decay distance (r2 = 0.5) was about 110 kb and 290 kb for T-group and S-group, respectively. Furthermore, a genome-wide association analysis was performed on these kernel traits using 6,723 single nucleotide polymorphism (SNP) markers. Sixty-six significant markers, distributed on all seven chromosomes, were identified using a mixed linear model explaining 4.82–13.36% of the phenotypic variations. Among them, 15, 28, 22, 14, 21, and 13 SNPs were identified for KL, KW, KV, KSA, KWL, and HKW, respectively. Moreover, six candidate genes that may control kernel traits were identified (AET2Gv20774800, AET4Gv20799000, AET5Gv20005900, AET5Gv20084100, AET7Gv20644900, and AET5Gv21111700). The transfer of beneficial genes from A. tauschii to wheat using marker-assisted selection will broaden the wheat D subgenome improve the efficiency of breeding.
Aegilops tauschii (2n = 2× = 14, DD) is the diploid progenitor of the D subgenome of hexaploid wheat (Triticum aestivum L., 2n = 6× = 42, AABBDD) and a vital genetic resource for the improvement of wheat quality and yield (Dvořák et al., 1998; Ogbonnaya et al., 2013). The A. tauschii has a rich genetic diversity and multiple biological and abiotic resistances, including excellent genetic resources such as stress resistance (Qin et al., 2016), disease resistance (Zhang et al., 2019), and improved yield, which are uncommon in ordinary hexaploid wheat.
Hexaploid wheat arose through natural hybridization and chromosome doubling between a cultivated allotetraploid (2n = 4× = 28, AABB) and A. tauschii (Dvořák et al., 1998; Matsuoka, 2011). However, common wheat descends from a small number of spontaneous interspecific hybrids (Cox, 1997). Thus, there is scope for A. tauschii to improve wheat and increase wheat yield by artificially synthesizing hexaploids. After several collaborative long-time research efforts, the International Center for Maize and Wheat Improvement (CIMMYT) have synthesized hexaploid wheat lines by crossing elite tetraploid durum with A. tauschii (Ogbonnaya et al., 2013). The A. tauschii has several yield traits or components that may be transferred to synthetic hexaploid wheat when used as a paternal parent. Furthermore, it has previously been used to introgress yield traits into wheat, such as the large-kernel wheat Chuanmai 42 (Zhang et al., 2004) and heavy panicle Shumai 830 (Hao et al., 2019). With the rapid development of scientific research technology, identification of the linked markers in the genetic background of A. tauschii can enable targeted introgressions, thus making it economical.
Single nucleotide polymorphism (SNP) is a third-generation genetic marker technology. SNPs are abundant and have traits such as high frequency and good genetic stability. Currently, SNP genetic studies are widely used for kernel yield, disease resistance, and stress resistance. Genome-wide association study (GWAS) based on linkage disequilibrium (LD) has been widely adopted to identify loci significantly associated with important and complex morphological traits in several species, including A. tauschii (Liu et al., 2015a,b), rice (Chen et al., 2014), wheat (Lin Y. et al., 2017, 2019, 2020a; Liu Y. et al., 2017), and maize (Lu et al., 2010, 2011 Yang et al., 2014). Moreover, only a few GWAS have reported kernel size traits in A. tauschii. For example, using 193 A. tauschii accessions worldwide, 58 SSR were identified in three environments for seven grain traits (Zhao et al., 2015). Using 5,249 SNPs, a GWAS was performed for 114 A. tauschii germplasm, and a total of 17 SNPs associated with grain size traits distributed over all the seven chromosomes (Arora et al., 2017). However, this study aimed to investigate marker-trait associations for kernel size traits using SNPs in a core collection of 223 A. tauschii of diverse origin. Moreover, our objective was to scan candidate gene responses to kernel size traits. These identified genes and SNPs will provide an important research framework for cloning kernel trait genes in A. tauschii.
A total of 223 A. tauschii accessions were collected by Triticeae Research Institute, Sichuan Agricultural University. These A. tauschii accessions were originally obtained from 17 different countries (Supplementary Table 1). According to morphological classification criteria (Zhao et al., 2018), 135 and 88 A. tauschii accessions were classified as A. tauschii ssp. tauschii and A. tauschii ssp. strangulata, respectively (Supplementary Table 1).
All A. tauschii were planted in Wenjiang, Chongzhou, and Wenjiang in 2017, 2018, and 2019, respectively. Each accession was planted in three rows. Each row’s length was 1.5 m, and the space between the rows was 0.6 m, as a previous study described (Liu et al., 2015b). Spikes were harvested at physiological maturity and threshed by hand. Fifty kernels of each A. tauschii plant were used to evaluate six traits with three repetitions. Kernel length (KL), kernel width (KW), kernel width to length ratio (KWL), kernel surface area (KSA), and kernel volume (KV) were evaluated in all three environments, and hundred-kernel weight (HKW) was evaluated in 2018 and 2019. Kernel morphologic traits, including KL, KW, KWL, KSA, and KV, were scanned using an Epson XL scanner system (11,000 ×) (Seiko Epson Corporation, Nagano-ken, Japan) and analyzed using the Win-SEEDLE Pro 2012a image analysis system (Régent Instruments, Quebec, Canada) software. Hundred-kernel weight was calculated as two times the weight of 50 kernels.
Analysis of variance (ANOVA) was conducted using the “car” package in the software R 3.5.1 R Core Team (2014). As HKW was only calculated in two environments, ANOVA could not be conducted for HKW. In this study, we established selection indices involving multiple kernel traits, and a series of linear regressions were performed for all traits. We built a series of linear regressions to explain HKW and chose our predictive variables through a stepwise selection process.
The broad-sense heritability was calculated using the Smith et al. (1998) method as previous studies described (Liu Y. et al., 2017; Lin et al., 2020b; Lin Y. et al., 2021). Meanwhile, to reduce the environmental impact on kernel traits, best linear unbiased predictors (BLUP) of each trait across environments were calculated using SAS 9.2 (SAS Institute Inc., Cary, NC). Descriptive analysis, Pearson’s correlation, linear regression, and clustering analyses were performed based on BLUP values for each trait using SPSS 20 (IBM, United States). Moreover, three different categories were calculated based on traits, i.e., low-, mid-, and high-performing genotypes corresponding to below, between, and above X ± SD (Standard Deviation), respectively (Zar, 2010; Abdel-Ghani et al., 2012), where X represent mean values of each trait. Meanwhile, Shannon–Weaver diversity index (H’) was calculated based on BLUP values for six kernel traits using the formula.
Where Pi is the number of materials in the i level of a specific trait in the total percentage of copies, and Ln is the natural logarithm (Hutcheson, 1970).
Genomic DNA from each A. tauschii samples was extracted from the young leaves using the CTAB method (Murray and Thompson, 1980). All A. tauschii samples were genotyped by Illumina 10K SNP array, and the gathered SNPs were mapped onto the A. tauschii reference genome v4.0 (Aet v4.01) to obtain the physical location (Luo et al., 2017). Then, the mapped SNPs with minor allele frequency (MAF) >5% and missing data <20% were retained for further analysis. Finally, a total of 6,723 polymorphic markers were obtained and used for population structure, kinship, and association analysis. Genetic diversity was evaluated using polymorphism information content (PIC), as PIC = 1−Σ(Pi)2, where Pi is the proportion of the population carrying the allele (Botstein et al., 1980).
Population structure was analyzed using the Bayesian inference program STRUCTURE 2.3.4 based on the linkage ancestry model (Pritchard et al., 2000; Falush et al., 2007). A total of 10,000 burn-in iterations followed by 10,000 Markov Chain Monte Carlo iterations for K = 1–10 clusters were used to identify the optimal range of K, performing 10 runs per K. The optimal value of K was determined using STRUCTURE HARVESTER (Earl and vonHoldt, 2012) based on the Evanno method (Evanno et al., 2005). The CLUMPP (Jakobsson and Rosenberg, 2007) was used to determine the best comparison among five repeated samples. Kinship was estimated using 6,723 markers in TASSEL 3.0 (Bradbury et al., 2007). The LD squared allele frequency correlation (r2), which contains both mutational and recombination history, as evaluated for linked/syntenic loci (p < 0.001). The LD analyses was conducted separately for the T-group and S-group, respectively. The LD estimates between marker pairs were obtained using TASSEL 3.0, the mean r2 over different genetic distances was calculated for the T-group and S-group, respectively.
Genome-wide association analysis was performed based on 6,723 SNPs using mean value of each environment and the BLUP values of each trait in Tassel 3.0 based on a mixed linear model (MLM) (Bradbury et al., 2007). The significance threshold was set at p -value < 0.001, correspondingly −log10(p) = 3.00 as previous studies (Liu J. et al., 2017; Ye et al., 2019; Fu et al., 2020). Manhattan and Quantile-Quantile plots of GWAS results were plotted in R 3.5.1 (R Core Team., 2014).
Based on Aet v4.0, putative genes in 10 Kb upstream and downstream of the significant SNPs were selected and then annotated using KEGG Orthology Based Annotation System 3.0 (KOBAS 3.0) (Xie et al., 2011; Arora et al., 2017; Wu et al., 2017). Arabidopsis and rice were used as background species. Candidate genes were identified according to the homologous function.
A total of 6,723 polymorphic SNPs was mapped on the A. tauschii reference genome Aet v4.0 with MAF >5%, missing data <20%. The 6,723 SNPs were evenly distributed on seven chromosomes of A. tauschi (Supplementary Figure 1). The number of SNPs ranged from 784 for chromosome 4D to 1,231 for chromosome 2D (Supplementary Table 2). The marker density ranged from 0.53 to 0.70 Mb for each chromosome (chromosomes 2 and 6D, respectively) (Supplementary Table 2). The PIC ranged from 0.10 to 0.50, with an average value of 0.42 for the whole subgenome (Supplementary Table 2), indicating a high polymorphism of SNPs.
Based on the population structure analysis, K = 2 was selected. Thus, the whole panel was divided into two groups (Supplementary Table 1). Group 1 (S-group) contained 84 A. tauschii, including 83 A. tauschii ssp. strangulata and one A. tauschii ssp. tauschii. Group 2 (T-group) contained 139 A. tauschii, including 137 of A. tauschii ssp. tauschii and two A. tauschii ssp. strangulata. Meanwhile, the LD analyses were conducted separately for the T-group and S-group two lineages. The mean r2 values gradually decreased with increasing pairwise distance. The extent of LD decay distance (r2 = 0.5) was about 110 and 290 kb for T-group and S-group, respectively (Supplementary Figure 2).
The ANOVA results for 223 A. tauschii samples are listed in Table 1. All kernel traits showed significant (p < 0.001) differences among genotypes and environments, except for HKW. The coefficients of variation of the six kernel traits among three environments ranged from 8.49 to 48.99% (Supplementary Table 3). The heritability ranged from 0.74 for KL to 0.87 for KW, indicating medium to high heritability (Table 2). Based on BLUP values, coefficient of variation of six kernel traits ranged from 5.13 to 23.49% (Table 2). The minimum, maximum, and average values of KL, KW, KV, KSA, KWL, and HKW in the S-group were significantly (p < 0.01) higher than those in the T-group (Supplementary Table 4), and there were significant differences between the two subspecies (Figure 1). Results indicated that the six kernel traits in S-group exhibited higher H’ values than those in T-group, and S-group subspecies had a wider diversity range than those in T-group subspecies. Regarding the phenotypic distribution of six kernel traits based on BLUP values, all traits frequency distribution was continuous (Supplementary Figure 3), indicating that kernel traits were quantitative and controlled by multiple genes.
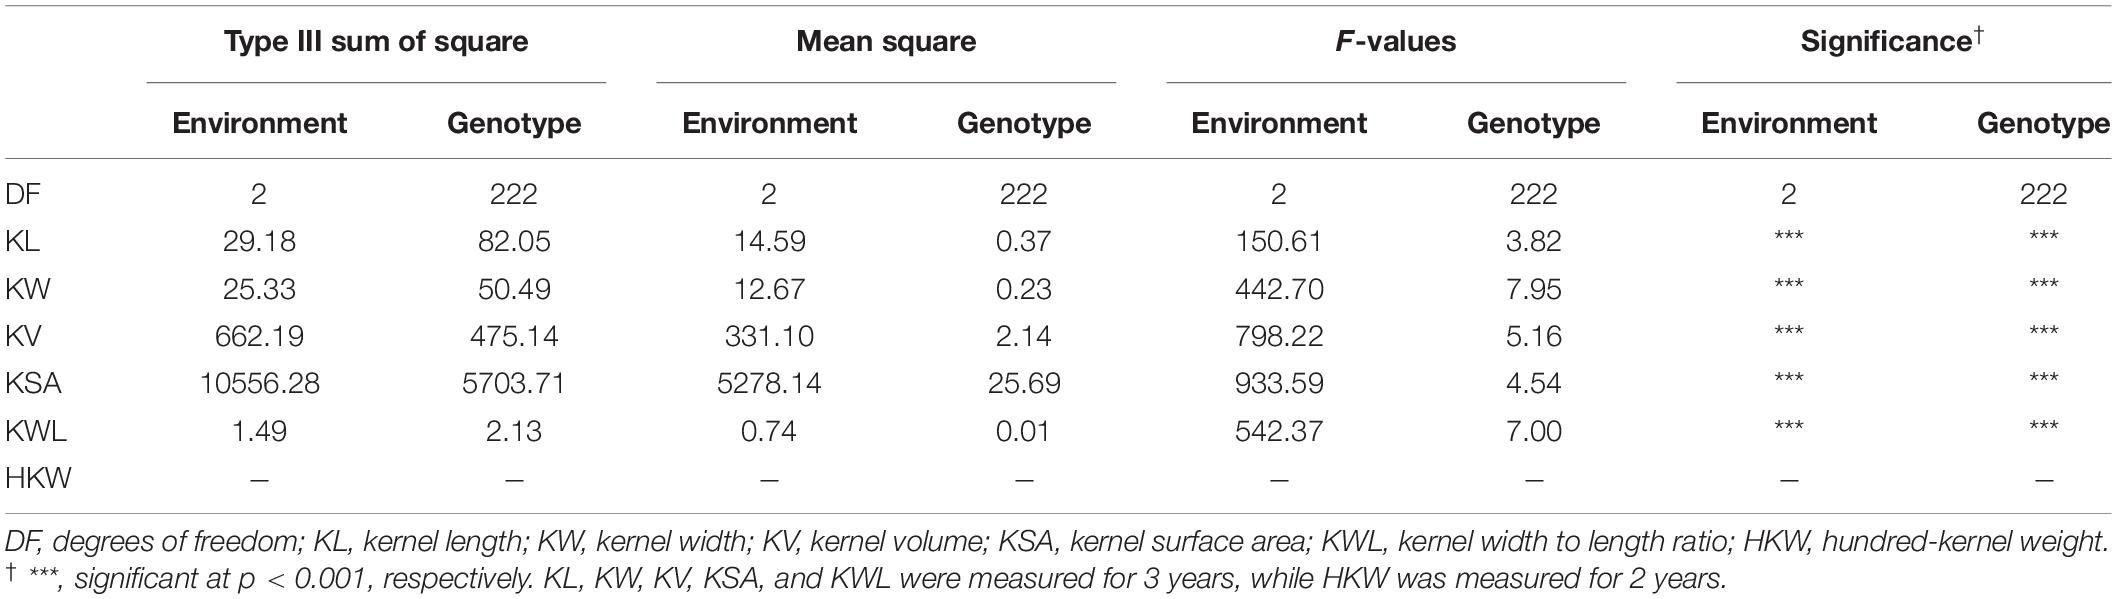
Table 1. The analysis of variance of six kernel traits of 223 Aegilops tauschii among three environments.
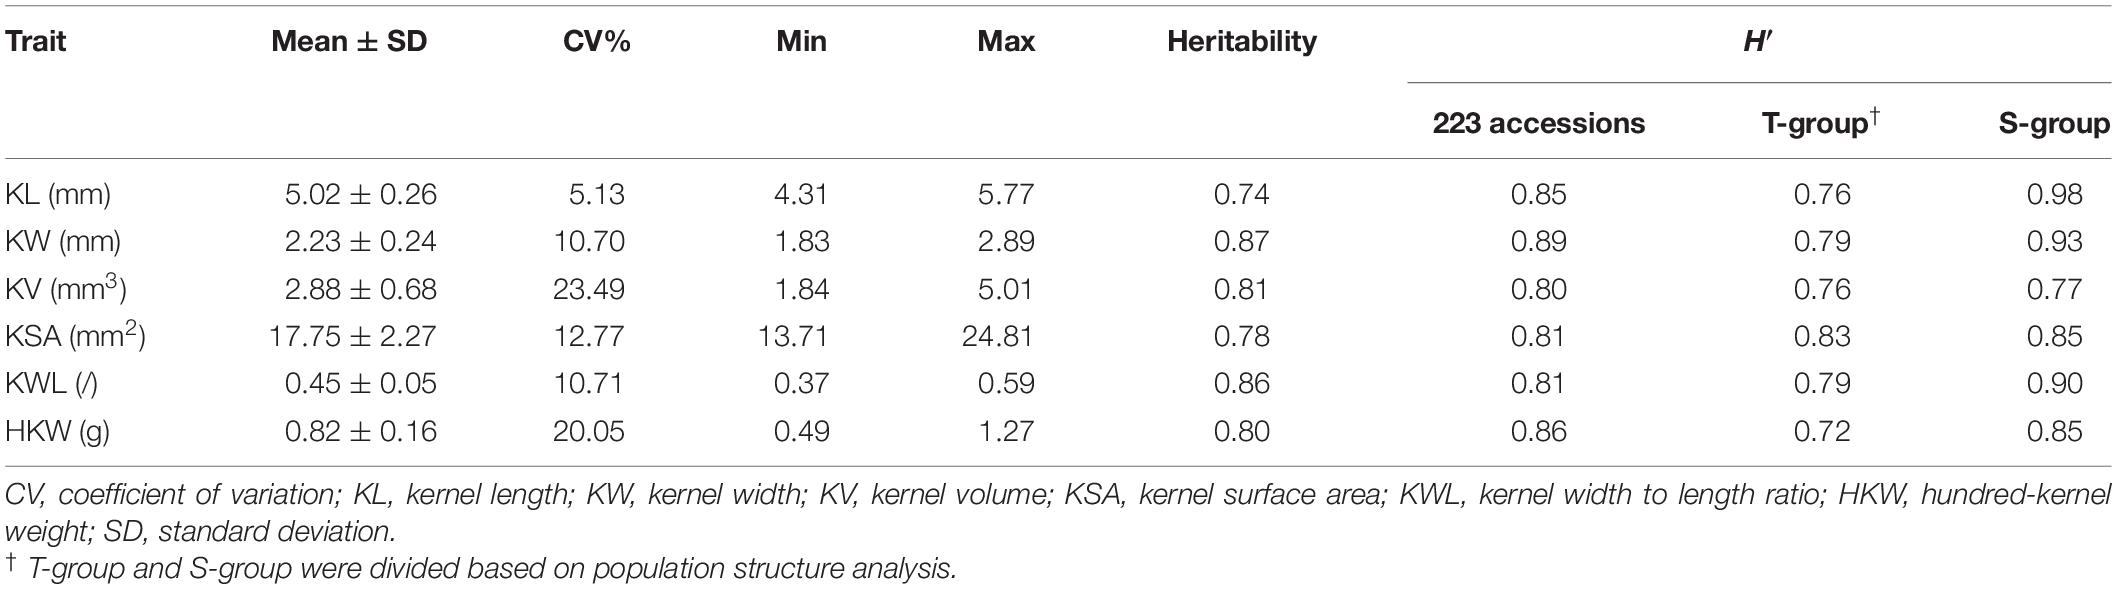
Table 2. Descriptive analysis, coefficient of variation, heritability, and Shannon–Weaver diversity index (H′) of six kernel traits based on BLUP values among the 223 Aegilops tauschii.
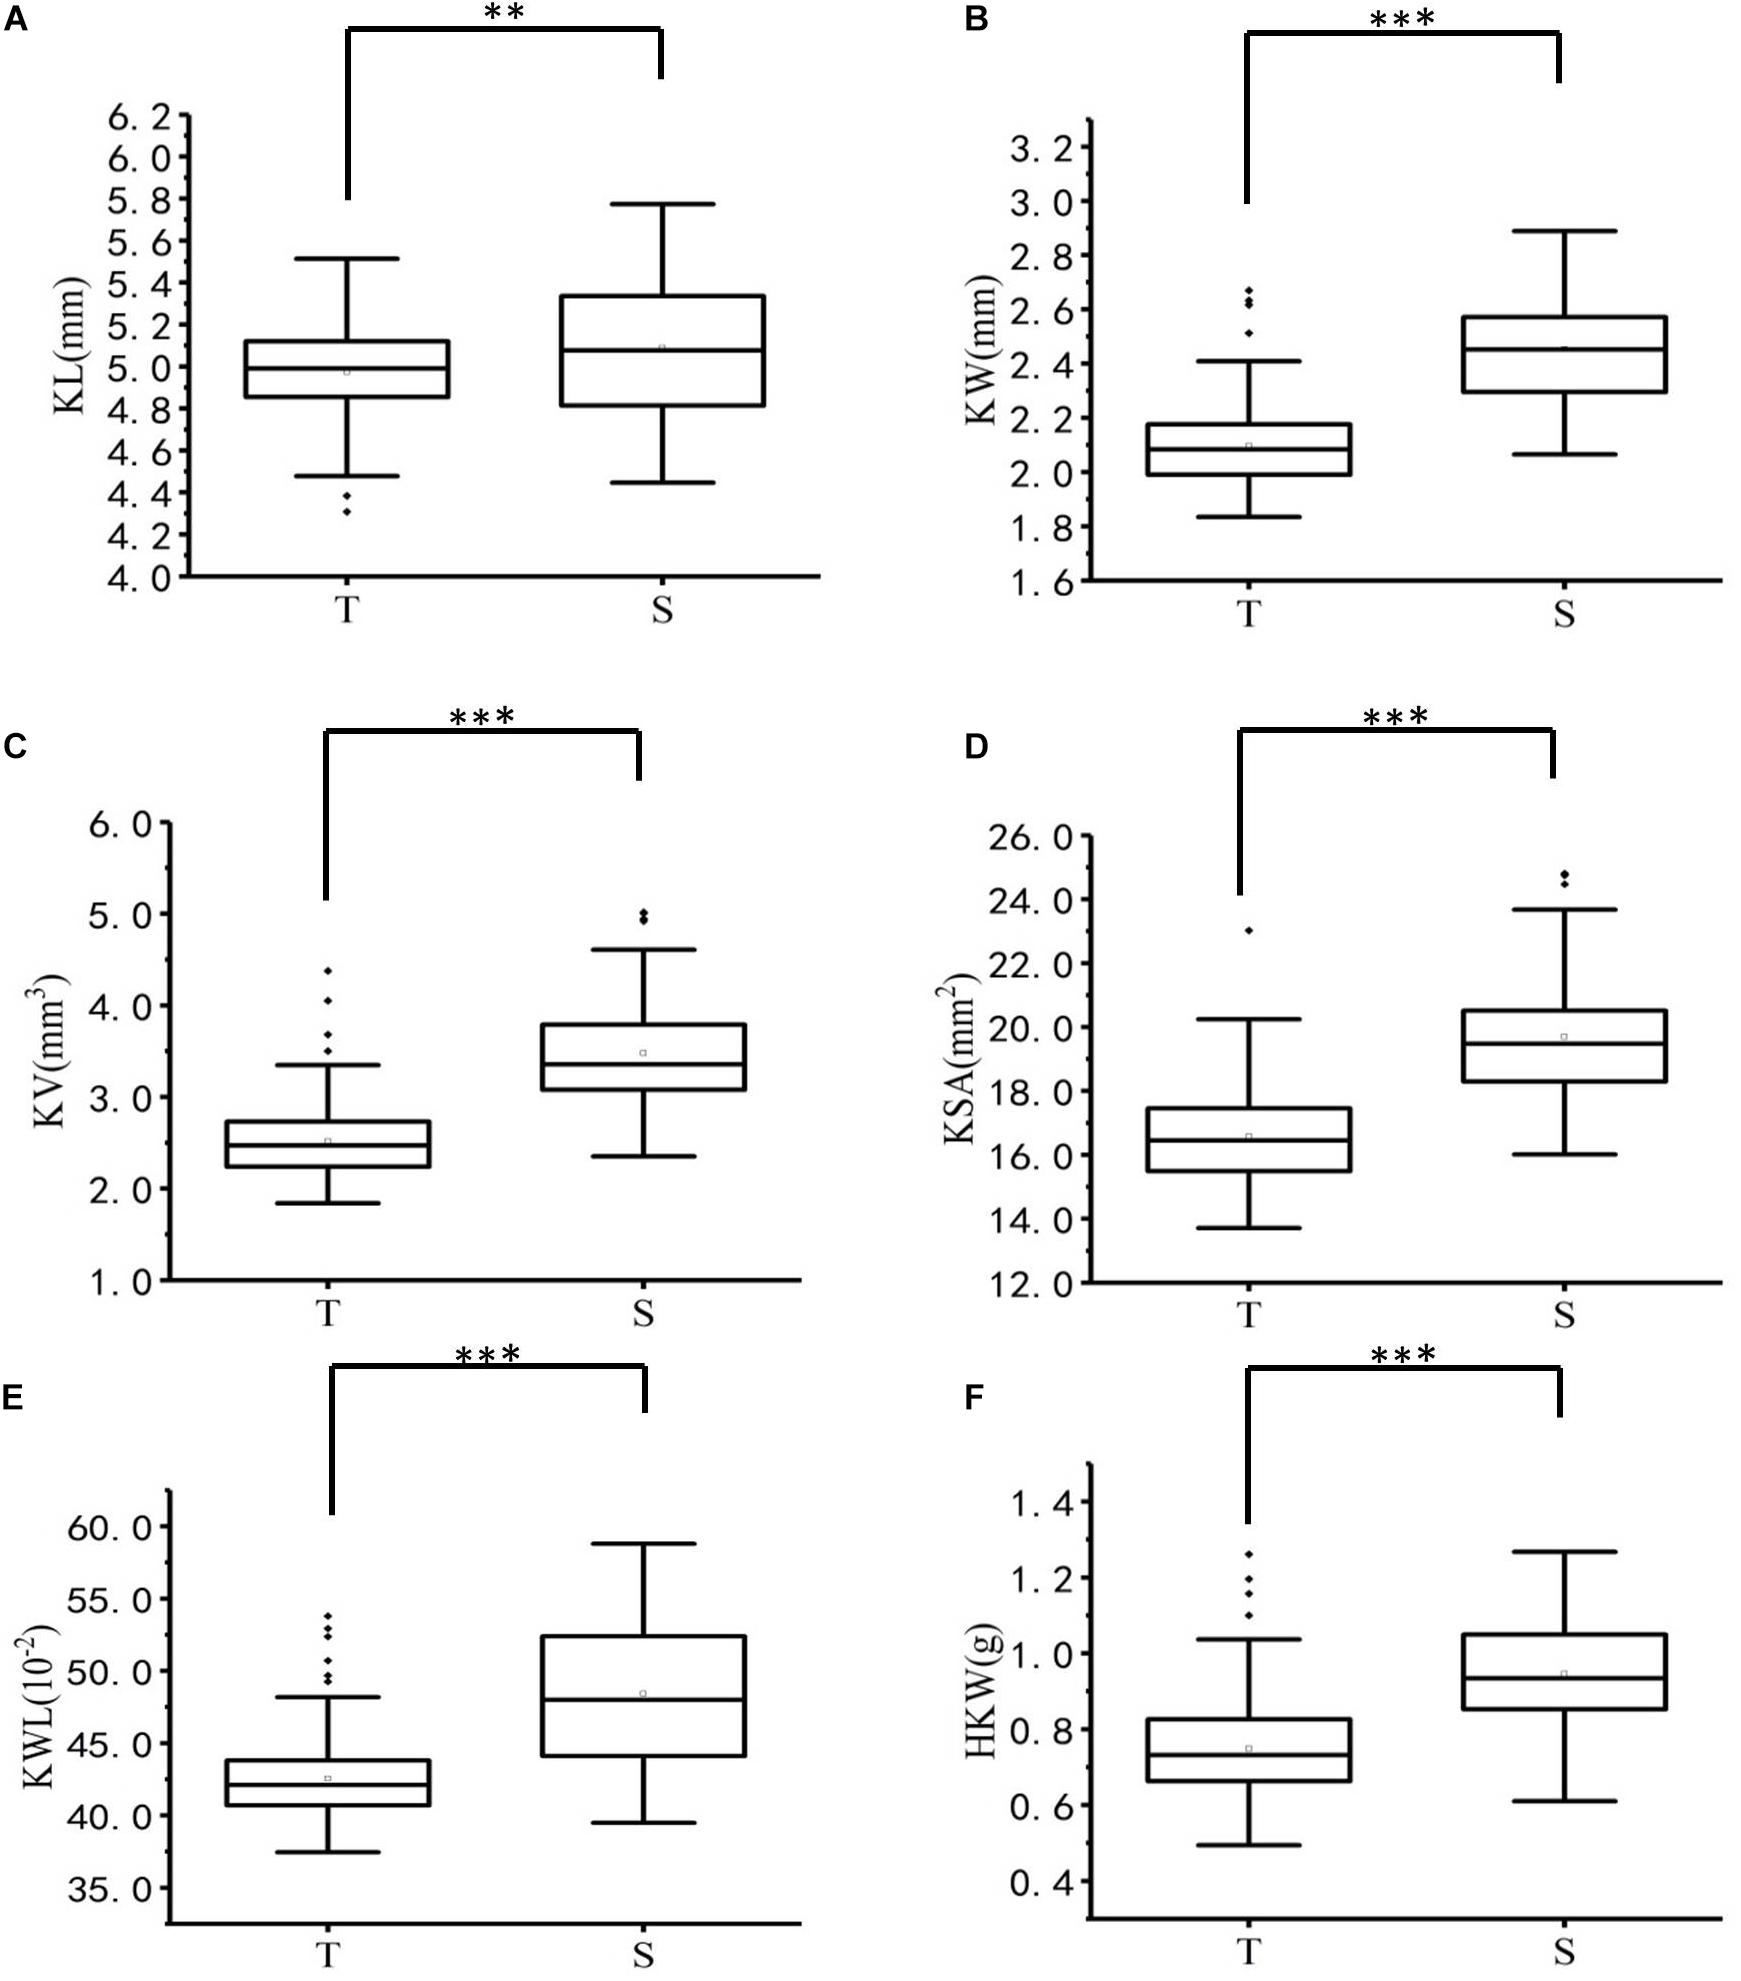
Figure 1. Boxplots of six kernel characters of T-group and S-group. ∗∗, and ∗∗∗ denote significance at p < 0.01 and p < 0.001, respectively. (A) KL, kernel length (mm), (B) KW, kernel width (mm), (C) KV, kernel volume (mm3), (D) KSA, kernel surface area (mm2), (E) KWL, kernel width to length ratio (%), (F) HKW, hundred-kernel weight (g).
Based on the BLUP value, correlation analysis for each trait showed significant correlations among traits, with correlation coefficients ranging from 0.27 (between KL and KW) to 0.98 (between KSA and KV) (Table 3). All correlations were positive, except for that between KL and KWL. KW showed medium-to-high correlations with KV, KSA, KWL, and HKW, while KL showed low-to-medium correlations with KV, KSA, KWL, and HKW (Table 3). Additionally, KW and KL showed a medium-to-high correlation with HKW. These results indicated that KW and KL were the major determinants of kernel architecture and weight in A. tauschii, showing that the same loci may orchestrate the control of these traits, indicating that SNPs identified in our study may play pleiotropic effects. The final model based on HKW phenotypic variation explained 76.8% of variability with KV, KL, KSA, and KW, verifying the above results (Supplementary Table 5). Meanwhile, cluster analysis (Ward’s method) grouped the 223 A. tauschii into two clusters (Supplementary Table 1). Results showed a high consistency of classification results by population structure.
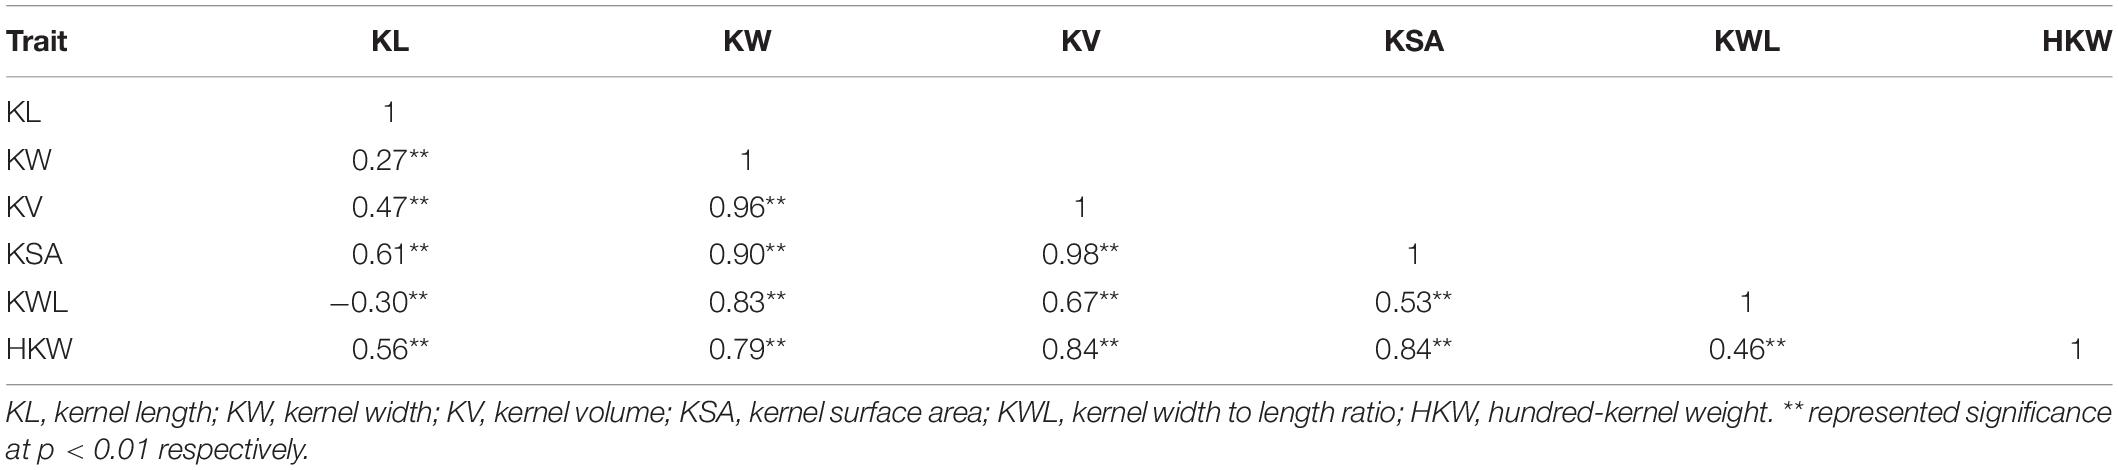
Table 3. The correlation analysis of the six kernel traits based on best linear unbiased prediction (BLUP) values.
GWAS was performed on all six traits using 6,723 SNPs among three environments. A total of 141 significant SNPs were identified for six kernel traits with phenotypic variation explained (PVE) ranging from 4.82 to 17.14% (Supplementary Table 6). The highest number of markers was detected for KV(78), which was followed by kernel volume KW (43), KSA (42), KWL (34), KL (26), HKW (21) (Supplementary Table 6). Based on BLUP values, GWAS was performed on all six traits using 6,723 SNPs by MLM. A total of 66 significant SNPs was identified for six kernel traits with phenotypic variation explained (PVE) ranging from 4.82 to 13.36% (Table 4 and Supplementary Table 6), and these markers were distributed on all seven chromosomes (Figures 2, 3, Table 4, and Supplementary Table 6). In order to reduce environment effects, significant SNPs detected using BLUP values were used for further analysis.
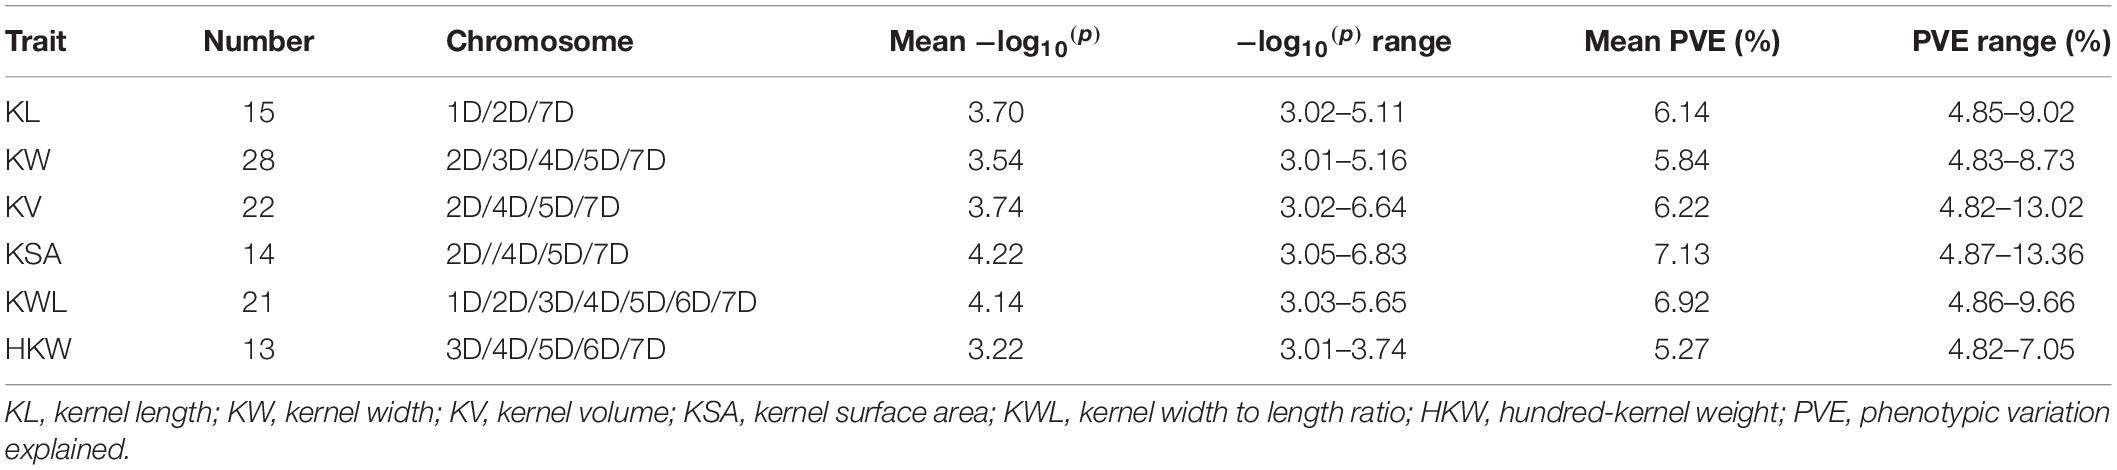
Table 4. Significant SNP markers identified for six kernel-related traits by genome-wide association study based on best linear unbiased prediction (BLUP) values.
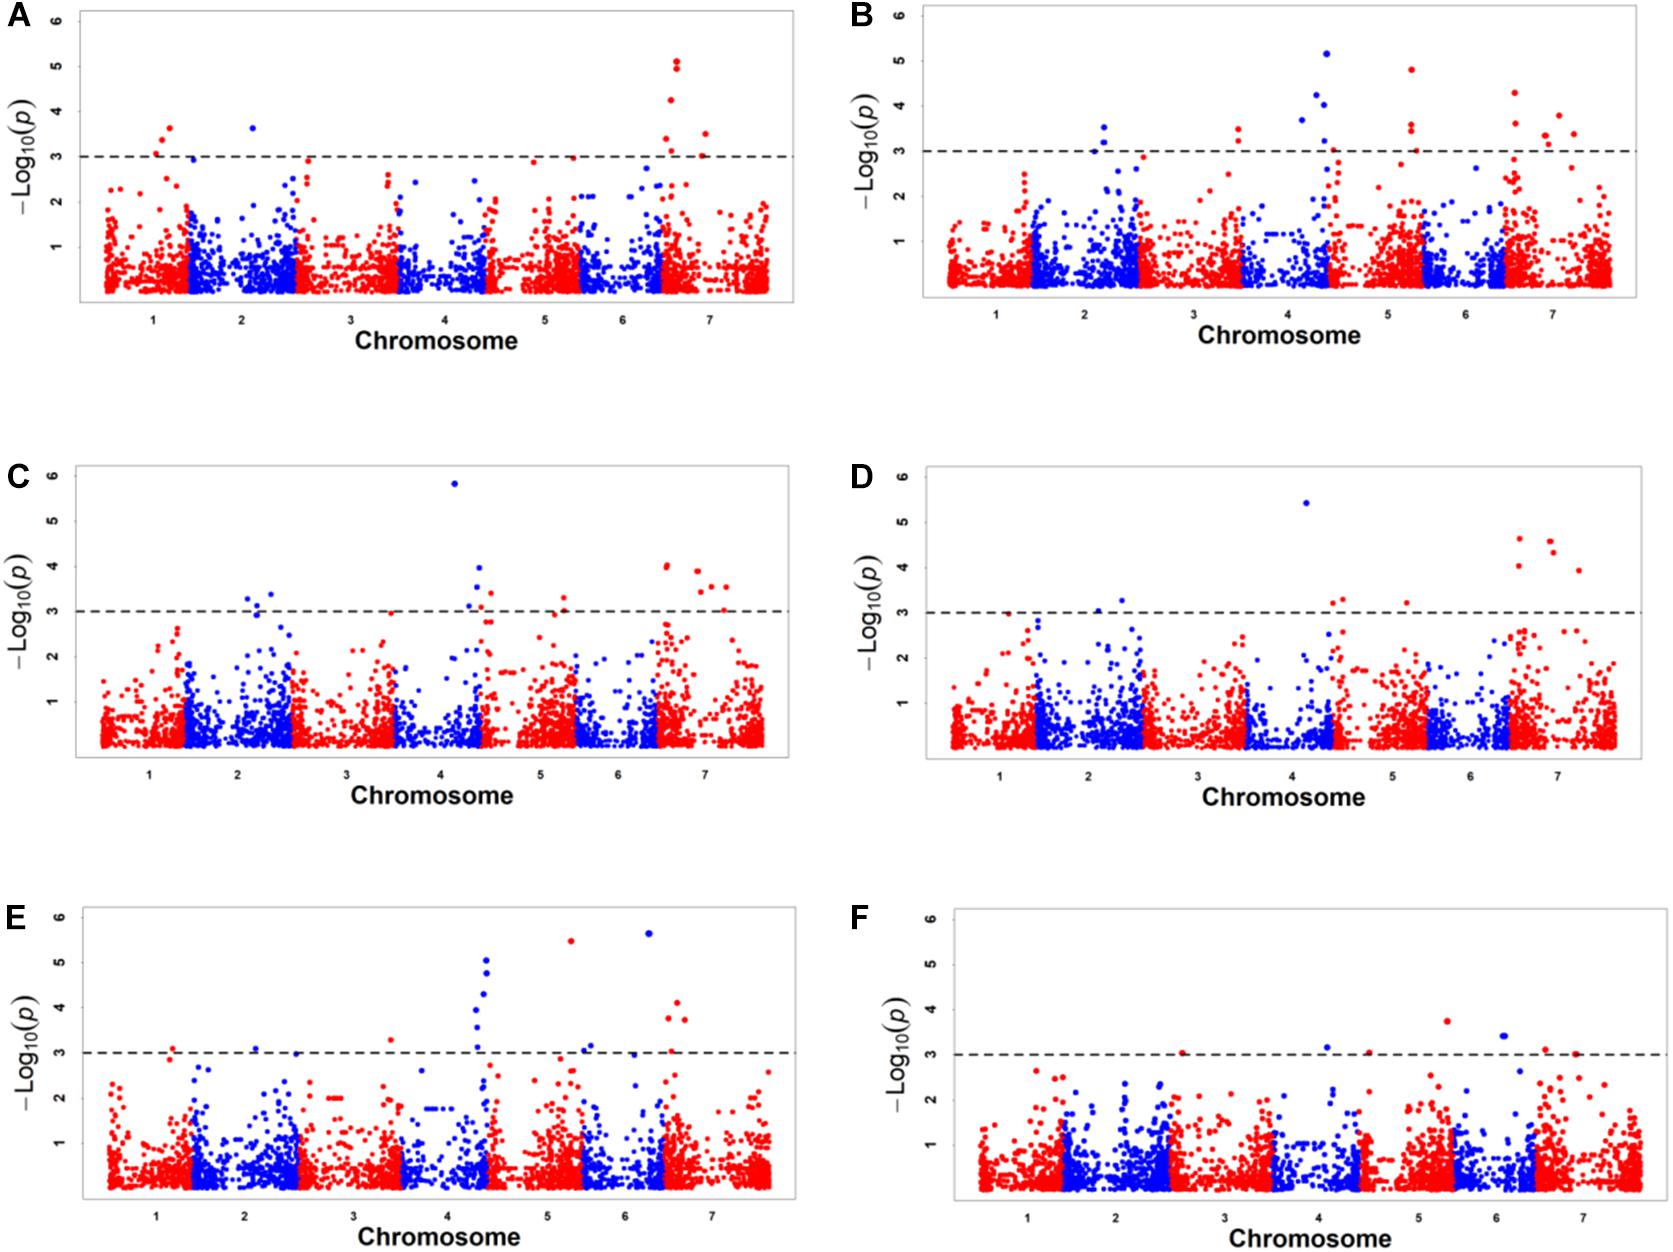
Figure 2. Manhattan plots of genome-wide association study results for six kernel traits based on BLUP value. (A) KL, kernel length, (B) KW, kernel width, (C) KV, kernel volume, (D) KSA, kernel surface area, (E) KWL, kernel width to length ratio, (F) HKW, hundred-kernel weight.
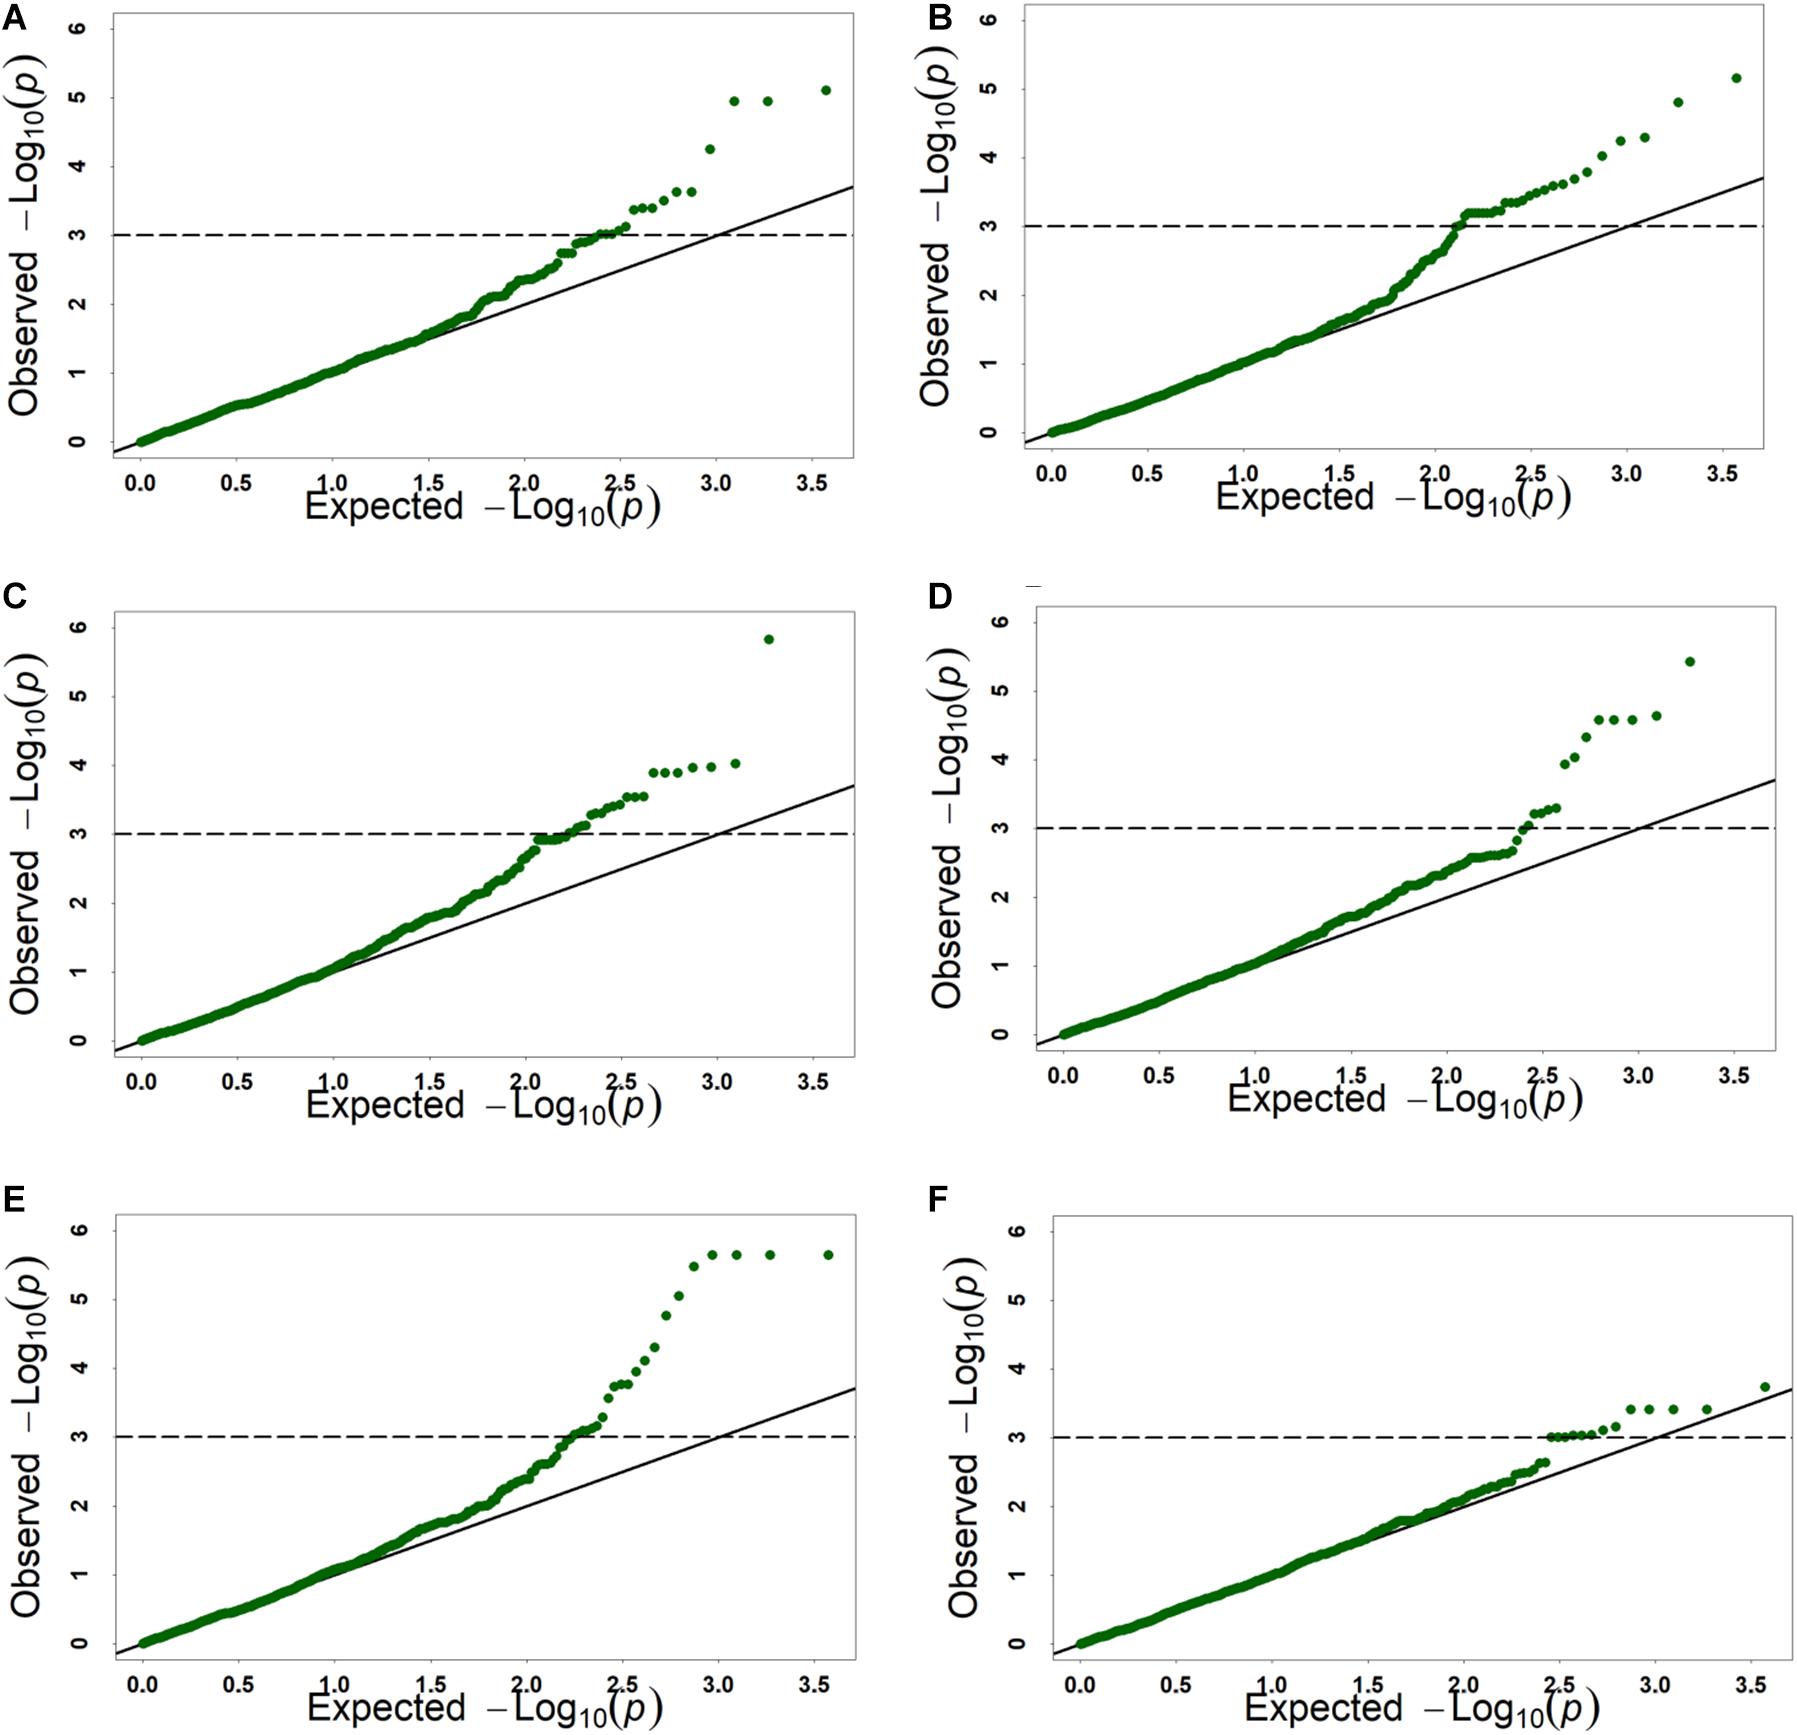
Figure 3. The Q-Q plots of genome-wide association study results for six kernel traits based on BLUP value. (A) KL, kernel length, (B) KW, kernel width, (C) KV, kernel volume, (D) KSA, kernel surface area, (E) KWL, kernel width to length ratio, (F) HKW, hundred-kernel weight.
Based on BLUP values, 15 significant SNPs for KL were detected with PVE, ranging from 4.85 to 9.02%, these SNPs were distributed on chromosomes 1D, 2D, and 7D (Table 4 and Supplementary Table 6). For KW, 28 significant SNPs were detected with PVE, ranging from 4.83 to 8.73%. These SNPs were distributed on chromosomes 2D, 3D, 4D, 5D, and 7D. For KV, 22 significant SNPs were detected with PVE, ranging from 4.82 to 13.02%. These SNPs were distributed on chromosomes 2D, 4D, 5D, and 7D. For KSA, 14 significant SNPs were detected with PVE, ranging from 4.87 to 13.36%. These SNPs were distributed on chromosomes 2D, 4D, 5D, and 7D. For KWL, 21 significant SNPs were detected with PVE, ranging from 4.86 to 9.66%. A total of 13 significant SNPs were detected for HKW with PVE ranging from 4.82 to 7.05%. These SNPs were distributed on chromosomes 3D, 4D, 5D, 6D, and 7D. These SNPs were distributed on all seven chromosomes (Table 4 and Supplementary Table 6). The contig17143_54, located on chromosome 5D at 538.15 Mb, was strongly associated with KV with 13.02% PVE (Supplementary Table 6). The contig 17143_54, located on chromosome 5D at 538.15 Mb, was most significant for KSA with 13.36% PVE, while contig67633_66, located on chromosome 6D at 406.04 Mb, was most significant with KL with 9.66% PVE. Twenty-six loci of six kernel traits showed pleiotropy, e.g., contig17143_54, located on chromosome 5D at 538.15 Mb, was significantly related to KW, KSA, KV, and HKW; GDRF1KQ01CJ4KM_378, located on chromosome 7D at 246.23 Mb, was significantly related to HKW, KSA, KL, KV, KW, and F1BEJMU01CNNGZ_79, located on chromosome 4D at 453.78 Mb, was significantly related to KW, KWL, KV.
Based on Aet v4.0, putative genes in 10 Kb upstream and downstream of the significant SNPs were homologous comparison using KOBAS 3.0. A total of 38 predicted genes were selected. Thirty-six and 38 genes were homologous to arabidopsis and rice, respectively (Supplementary Table 7). Six predicted genes, included AET2Gv20774800, AET4Gv20799000, AET5Gv20005900, AET5Gv20084100, AET7Gv20644900, and AET5Gv21111700, were homologous to MST1 (Takeda et al., 2001; Mao et al., 2011), MAC3B (Monaghan et al., 2009; Li S. et al., 2018), ETR1 (Yin et al., 2017), ZAR1 (Guo et al., 2013; Yu et al., 2016), NAC047 (Kunieda et al., 2008; Mathew et al., 2016), EXPA7 (Lizana et al., 2010; Jadamba et al., 2020), respectively (Table 5). These genes (MST1, MAC3B, ETR1, ZAR1, NAC047, EXPA7) could affect embryo development, cause seed surface atrophy, increase the number of cells to increase organ size, or affect kernel size through ethylene response. Thus, the six A. tauschii genes maybe directly or indirectly regulate kernel growth or regulate kernel size.
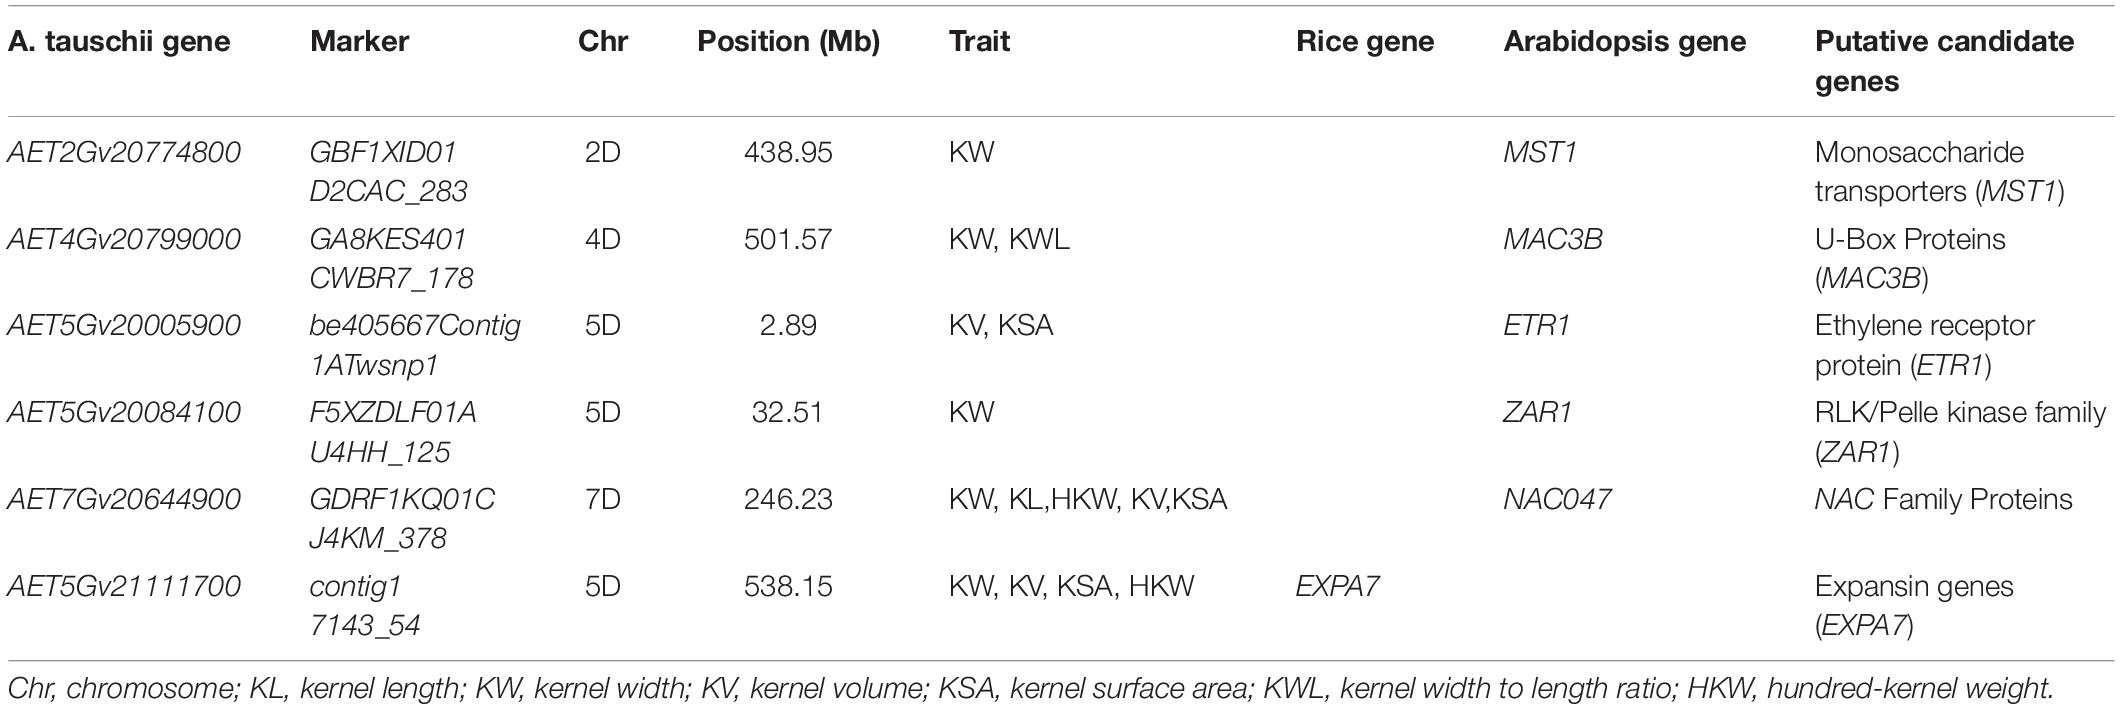
Table 5. Candidate genes identified for six kernel traits.
The improvement of common wheat has gone through the cross between landraces and main popularized varieties to the cross between elite varieties now. However, wheat has been affected by domestication and selection of long-term backbone parents, and genetic “evolutionary bottlenecks” have appeared, which leads to a decrease in yield. Wheat kernel traits are the most important factor affecting yield, and excellent kernel traits greatly increase yield. However, A. tauschii is one of the ancestral species of hexaploid wheat and the donor species of D subgenome. It has a lot of valuable genes and a rich genetic diversity, and a vital genetic resource for the improvement of wheat quality and yield (Dvořák et al., 1998; Ogbonnaya et al., 2013). The purpose of this research is to dig out the excellent genes that regulate kernel size in A. tauschii, and lay a foundation for the transfer of common wheat and the broadening of genetic diversity. There have been many successful cases of introducing A. tauschii genes into wheat through hybridization. Such as Chuanmai 42, Shumai 969, and Shumai 830 etc. thereinto, Chuanmai 42 is a large and heavy spike cultivar with a large kernel (Zhang et al., 2004; Duan et al., 2006), and Shumai 830, is also a heavy spike cultivar (Hao et al., 2019). These successful wheat varieties suggest the considerable potential of A. tauschii for wheat improvement, especially for breeding cultivars with large and heavy spikes. However, the aim of this study was to discover genes in A. tauschii that regulate kernel size, introducing the significant target markers that affect kernel traits directly into wheat would accelerate the breeding of target varieties and save time.
In this study, 223 A. tauschii were divided into T-group and S-group subgroups through population STRUCTURE. T-group and S-group representing A. tauschii ssp. tauschii and A. tauschii ssp. strangulata, respectively. The results of this study are completely consistent with previous studies (Arora et al., 2017). Population structure is one of the most important factors affecting LD (Flint-Garcia et al., 2003). Thus, the LD analyses was conducted separately for the T-group and S-group, respectively. Only one previous study reported LD decay distance in A. tauschii. The LD decay distance was reported at 9.8 and 2.7 cM for T-group and S-group, respectively (Arora et al., 2017). This study firstly reported the LD decay distance based on physical distance. The LD decay distance was highest in the T-group (approximately 110 kb) and S-group (approximately 290 kb), the average LD decay distance was approximately 200 kb. In wheat, the LD decay distance was 250 kb for D subgenome, consistent with our results (Long et al., 2019).
The present study aimed to identify significant markers for kernel size trait in A. tauschii, the D subgenome donor of hexaploid wheat. Significant (p < 0.001) differences were noted among genotypes and environments; A. tauschii showed high diversity, indicating high research and utilization value, and it could make a major contribution to broadening the genetic diversity of the wheat D subgenome. In the present study, heritabilities of kernel traits were medium to high. In previous studies, moderate or high heritabilities were also observed in A. tauschii (Arora et al., 2017), consistent with our study. In some reports in wheat, moderate to high heritability were also observed (Kuchel et al., 2007; Liu Y. et al., 2017). These results indicated that the kernel size-related traits was more controlled by genetic factors. We used correlation and linear regression analyses revealed a significant positive correlation between KL, KW, KV, and HKW, and HKW increased with increasing KL, KW, and KV. Previous studies have found that, in the tetraploid and hexaploid wheat, TaGW2-A1 mutations could increase KW and KL, thereby increasing yield by increasing TKW (Simmonds et al., 2016). The correlations between these trait points to a causal relationship between kernel size and weight because longer and wider kernels can accumulate more starch and, therefore, have greater kernel weight (Duan and Sun, 2005). Our study showed the consistent results. Thus, in the process of breeding, breeders could pay attention to discovering varieties with long or wide kernels. The identified A. tauschii accessions with long or wide kernels could be used in further breeding through SHW to broaden the genetic diversity of wheat.
In the present study, cluster analysis results were highly consistent (83%) with the population structure results. Similar results have been reported in A. tauschii and wheat (Liu et al., 2015b; Liu Y. et al., 2017). A previous cluster analysis performed using 29 morphological traits in 322 A. tauschii showed 72% consistency with the population structure results (Liu et al., 2015b). This result may be caused by an intermediate type between A. tauschii ssp. tauschii and A. tauschii ssp. strangulata subspecies (Zhao et al., 2018). Indeed, Kihara et al. (1965) reported that intermediate forms and hybrids existed between the two subspecies. Due to the presence of intermediate type or hybrids, there may be uncertainty in morphological identification, resulting in differences between morphology- and genotype-based identification. Besides, morphological traits may also be more easily affected by the ecological environment. Plant growth will be affected to varying degrees in different ecological environments, affecting plant growth and, ultimately, kernel size (Wang et al., 2009; Liu et al., 2015b). Thus, the morphological traits clustering is roughly correct, but there will be some classification errors. Compared with genotype data classification results, cluster analysis could correctly classify most A. tauschii.
For GWAS results, the threshold is set to Bonferroni correction method a = 0.01 or 0.05. Because MLM is too strict and can lead to over-correction. The Bonferroni correction method a = 1 to reduce negative errors caused by overcorrection (Yang et al., 2014). The p-value was 1.49 × 10⁻⁴ for the 6,723 SNPs, with a corresponding −log10(p) = 3.80. However, only 22 significant SNPs were identified. This is due to overcorrection caused by MLM. In addition, −log10(p) = 3.00 is also commonly set as a threshold (Liu J. et al., 2017; Ye et al., 2019; Fu et al., 2020) to reduce the negative false rate. Meanwhile, it has also been successfully applied in GWAS in wheat (Liu J. et al., 2017; Ye et al., 2019; Fu et al., 2020). This indicates that this threshold is a frequently used empirical value and the results are reliable. In this study, the threshold setting as −log10(p) = 3.00, 66 significant loci were identified for kernel traits using 6,723 SNPs markers by GWAS. To the best of our knowledge, to date, only two studies have reported QTL for kernel characteristic traits in A. tauschii based on GWAS (Zhao et al., 2015; Arora et al., 2017). Owing to the lack of publicly available marker sequence information, our results were compared to those of previous studies based on chromosomes. In previous studies for KL, significant loci were identified on chromosomes 1D, 2D, 5D, and 6D (Zhao et al., 2015; Arora et al., 2017), while in this study, 11 significant markers were identified on chromosome 7D; these may represent novel loci. For KW, we detected 28 significant markers on chromosomes 2D, 3D, 4D, 5D, and 7D. Significant markers on these chromosomes were also found in previous studies (Zhao et al., 2015; Arora et al., 2017). For KSA, 14 significant markers were identified on chromosomes 2D, 4D, 5D, and 7D, and loci on chromosome 4D may be novel according to a comparison with previous research (Zhao et al., 2015). For HKW, loci were identified on all chromosomes in previous studies, except for 7D (Zhao et al., 2015; Arora et al., 2017). In this study, significant markers were identified on chromosome 7D, as well as on chromosomes 3D, 4D, 5D, and 6D. Besides, 21 significant markers for KWL were identified on all seven chromosomes, and 22 for KV were identified on chromosomes 2D, 4D, 5D, and 7D. GWAS is an important and effective approach for wheat breeding by helping in the design of hybrid crosses. The identified significant markers/variants can be designed for use as molecular markers in wheat breeding directly.
To further serve the breeding of target varieties with desirable kernel traits, six candidate genes were identified based on homologous functions in arabidopsis and rice. AET2Gv20774800 was flanking the SNP marker GBF1XID01D2CAC_283. This gene was homologous to the MST1 gene in arabidopsis; they are also called sulfurtransferases 1 (STR1). Of note, a mutation of STR1 alone resulted in a shrunken seed phenotype. The shrunken seed phenotype was associated with delayed/arrested embryo development (Mao et al., 2011). In addition, the MST1 family gene OsMST5 plays an important role in early seed development in rice (Takeda et al., 2001). AET5Gv20084100 was flanking SNP marker F5XZDLF01AU4HH_125 for KW on chromosome 5D. It was homologous to the ZAR1 gene in arabidopsis, which belongs to the RLK/Pelle kinase family (Yu et al., 2016). Maize ARGOS1 (ZAR1) transgenic alleles increase hybrid maize yield, as ZAR1 increased plant and organ size primarily through increasing cell numbers (Guo et al., 2013). AET5Gv20005900 was flanking SNP marker be405667Contig1ATwsnp1 for KV and KSA on chromosome 5D, and it was homologous to ETR1 in arabidopsis, respectively. In Rice, a reduction of ETR2 expression could increase the thousand-seed weight (Wuriyanghan et al., 2009). However, enhanced ethylene response also may be related to a larger or heavier kernel (Yin et al., 2017). The starch and protein of rice kernel determine factors of seed dry weight and size (Duan and Sun, 2005; Yin et al., 2017). Thus, AET5Gv20005900 may presumably affect starch accumulation in A. tauschii, finally affecting kernel size. The AET4Gv20799000 gene related to KW and KWL was predicted on the 4D chromosome. It was homologous to the MAC3B gene in arabidopsis, which belongs to the U-box family. U-box is a ubiquitin ligase activity-related protein domain in plants (Li and Li, 2014; Li S. et al., 2018). Ubiquitin ligases have been identified as key factors of seed size control in plants (Li N. et al., 2018). For example, grain width gene GW2 encodes a RING-type E3 ubiquitin ligase and controls kernel width and weight in rice (Matsuoka and Ashikari, 2007). Finally, AET7Gv20644900 was homologous to NAC047 in arabidopsis and belonged to the NAC gene family. It was reported that NAC2 regulates embryogenesis, affecting seed shapes in arabidopsis (Kunieda et al., 2008; Mathew et al., 2016). As NAC2 and NAC047 belong to the same family, we speculate that these candidate genes may affect embryo development, kernel size, and yield. The genes identified by GWAS can be speeds up selective breeding using CRISPR-Cas9 system, which is a powerful tool for rapid and effective genetic improvement and allows several QTL/genes to be edited precisely and simultaneously or even novel alleles to be created.
This in-depth study of A. tauschii provides new insight into its potential role in wheat improvement. Six kernel traits, including KL, KW, KWL, KSA, KV, and HKW, were evaluated among 223 A. tauschii over 3 years. H’ was in the range 0.80-0.89, showing that A. tauschii had high diversity. Kernel traits showed medium to high heritability (0.74-0.87), and correlation and linear regressions analyses showed that HKW increased with increasing KL, KW, and KV. Kernel size traits affected kernel weight and, subsequently, yield. Our research results revealed that there are favorable varieties with longer and wider kernels in both subspecies of A. tauschii. Based on BLUP values, a total of 66 significant SNPs was identified using GWAS, and six candidate genes were identified as potential genetic drivers of these yield-related traits. The identified SNPs/genes will speed up the wheat breeding by MAS and genome-editing technology. It is expected that the excellent target gene from the D subgenome can be successfully introduced into wheat, so as to increase the yield of wheat and broaden the genomic resources of wheat.
The raw data supporting the conclusions of this article will be made available by the authors, without undue reservation.
QW and NY drafted and revised the manuscript and contributed to data analysis. HC, HH, YL, HS, KZ, XJ, and SY performed the phenotypic evaluation and helped with data analysis. SL helped to perform linkage disequilibrium analysis and revise the manuscript. CL, GC, and ZY helped to draft the manuscript. YL designed and coordinated the study and revised the manuscript. All authors have read and approved the final manuscript for publication.
This study was supported by the National Natural Science Foundation of China (91731305 and 31771794), the National Key Research and Development Program of China (2016YFD0101004 and 2017YFD0100900), the International Science and Technology Cooperation Program of the Bureau of Science and Technology of Chengdu China (No. 2015DFA306002015-GH03-00008-HZ), and the Sichuan Science and Technology Program (2019YFN0150).
The authors declare that the research was conducted in the absence of any commercial or financial relationships that could be construed as a potential conflict of interest.
The Supplementary Material for this article can be found online at: https://www.frontiersin.org/articles/10.3389/fgene.2021.651785/full#supplementary-material
Supplementary Figure 1 | The distribution of 6723 SNP markers on seven chromosomes of Aegilops tauschii.
Supplementary Figure 2 | Linkage disequilibrium (LD) decay plot for T-group and S-group.
Supplementary Figure 3 | Frequency distribution of six kernel trait in Aegilops tauschii.
Supplementary Table 1 | Genotype classification, morphological classification and cluster analysis of 223 Aegilops tauschii accessions.
Supplementary Table 2 | Distribution of SNP markers on chromosomes and polymorphism information content (PIC) of diverse chromosomes.
Supplementary Table 3 | Descriptive analysis, coefficient of variation of six kernel traits among environments.
Supplementary Table 4 | Comparison of six kernel characters between T-group and S-group.
Supplementary Table 5 | Multiple linear stepwise regression to explain hundred-kernel weight (HKW) from other kernel traits based on BLUP values.
Supplementary Table 6 | Through genome-wide association analysis of various environmental traits in 223 materials, significant SNPs were identified for kernel traits.
Supplementary Table 7 | Genes Homologous annotation using KOBAS 3.0.
Supplementary Table 8 | The six kernel traits measured in multiple trials.
Abdel-Ghani, A. H., Kumar, B., Reyes-Matamoros, J., Gonzalez-Portilla, P. J., Jansen, C., Martín, J. S., et al. (2012). Genotypic variation and relationships between seedling and adult plant traits in maize (Zea mays L.) inbred lines grown under contrasting nitrogen levels. Euphytica 189, 123–133. doi: 10.1007/s10681-012-0759-0
Arora, S., Singh, N., Kaur, S., Bains, N. S., Uauy, C., and Poland, J. (2017). Genome-wide association study of grain architecture in wild wheat Aegilops tauschii. Front. Plant Sci. 8:886. doi: 10.3389/fpls.2017.00886
Botstein, D., White, R. L., Skolnick, M., and Davis, R. W. (1980). Construction of a genetic linkage map in man using restriction fragment length polymorphisms. Am. J. Hum. Genet. 323, 314–331. doi: 10.1016/0165-1161(81)90274-0
Bradbury, P., Zhang, Z., Kroon, D., Casstevens, T. M., Ramdoss, Y., and Buckler, E. (2007). TASSEL: software for association mapping of complex traits in diverse samples. Bioinformatics 2319, 2633–2635. doi: 10.1093/bioinformatics/btm308
Chen, W., Gao, Y., Xie, W., Gong, L., Lu, K., Wang, W., et al. (2014). Genome-wide association analyses provide genetic and biochemical insights into natural variation in rice metabolism. Nat. Genet. 46, 714–721. doi: 10.1038/ng.3007
Cox, T. S. (1997). Deepening the wheat gene pool. J. Crop Product. 1, 1–25. doi: 10.1300/J144v01n01_01
Duan, M., and Sun, S. (2005). Profiling the expression of genes controlling rice grain quality. Plant Mol. Biol. 59, 165–178. doi: 10.1007/s11103-004-7507-3
Duan, X., Zhang, Y., and Yang, W. (2006). A breakthrough high-yield, high-quality wheat variety Chuanmai 42 with high resistance to stripe rust [in China]. Sichuan Agric. Sci. Technol. 1:13.
Dvořák, J., Luo, M., Yang, Z., and Zhang, H. (1998). The structure of the Aegilops tauschii genepool and the evolution of hexaploid wheat. Theor. Appl. Genet. 97, 657–670. doi: 10.1007/s001220050942
Earl, D., and vonHoldt, B. (2012). STRUCTURE HARVESTER: a website and program for visualizing STRUCTURE output and implementing the evanno method. Conserv. Genet. Resour. 4, 359–361. doi: 10.1007/s12686-011-9548-7
Evanno, G., Regnaut, S., and Goudet, J. (2005). Detecting the number of clusters of individuals using the software STRUCTURE: a simulation study. Mol. Ecol. 148, 2611–2620. doi: 10.1111/J.1365-294X.2005.02553.X
Falush, D., Stephens, M., and Pritchard, J. (2007). Inference of population structure using multilocus genotype data: dominant markers and null alleles. Mol. Ecol. Notes 7, 574–578. doi: 10.1111/j.1471-8286.2007.01758.x
Flint-Garcia, S., Thornsberry, J., and Buckler, E. (2003). Structure of linkage disequilibrium in plants. Annu. Rev. Plant Biol. 54, 357–374.
Fu, L., Wu, J., Yang, S., Jin, Y., Liu, J., Yang, M., et al. (2020). Genome-wide association analysis of stem water-soluble carbohydrate content in bread wheat. Theor. Appl. Genet. 133, 2897–2914. doi: 10.1007/s00122-020-03640-x
Guo, M., Rupe, M. A., Wei, J., Winkler, C., Goncalves-Butruille, M., Weers, B. P., et al. (2013). Maize ARGOS1 (ZAR1) transgenic alleles increase hybrid maize yield. J. Exp. Bot. 65, 249–260. doi: 10.1093/jxb/ert370
Hao, M., Zhang, L., Zhao, L., Dai, S., Li, A., Yang, W., et al. (2019). A breeding strategy targeting the secondary gene pool of bread wheat: introgression from a synthetic hexaploid wheat. Theor. Appl. Genet. 132, 2285–2294. doi: 10.1007/s00122-019-03354-9
Hutcheson, K. (1970). A test for comparing diversities based on the shannon formula. J. Theor. Biol. 29, 151–154. doi: 10.1016/0022-5193(70)90124-4
Jadamba, C., Kang, K., Paek, N., Lee, S. I., and Yoo, S. (2020). Overexpression of rice expansin7 (Osexpa7) confers enhanced tolerance to salt stress in rice. Int. J. Mol. Sci. 21:454. doi: 10.3390/ijms21020454
Jakobsson, M., and Rosenberg, N. (2007). CLUMPP: a cluster matching and permutation program for dealing with label switching and multimodality in analysis of population structure. Bioinformatics 2314, 1801–1806. doi: 10.1093/bioinformatics/btm233
Kihara, H., Yamashita, K., and Tanaka, M. (1965). Morphological, Physiological, Genetical and Cytological Studies in Aegilops and Triticum Collected From Pakistan, Afghanistan and Iran. Kyoto: Comity of the Kyoto University Scientific Expedition to the Karakorum and Hindukush.
Kuchel, H., Williams, K., Langridge, P., Eagles, H. A., and Jefferies, S. (2007). Genetic dissection of grain yield in bread wheat. I. QTL analysis. Theor. Appl. Genet. 115, 1029–1041. doi: 10.1007/s00122-007-0629-7
Kunieda, T., Mitsuda, N., Ohme-Takagi, M., Takeda, S., Aida, M., Tasaka, M., et al. (2008). NAC family proteins NARS1/NAC2 and NARS2/NAM in the outer integument regulate embryogenesis in Arabidopsis. Plant Cell Online 20, 2631–2642. doi: 10.1105/tpc.108.060160
Li, N., and Li, Y. (2014). Ubiquitin-mediated control of seed size in plants. Front. Plant Sci. 5:332. doi: 10.3389/fpls.2014.00332
Li, N., Xu, R., Duan, P., and Li, Y. (2018). Control of grain size in rice. Plant Reproduct. 31, 237–251. doi: 10.1007/s00497-018-0333-6
Li, S., Liu, K., Zhou, B., Li, M., Zhang, S., Zeng, L., et al. (2018). MAC3A and MAC3B, two core subunits of the MOS4-associated complex, positively influence miRNA biogenesis. Plant Cell 30, 481–494. doi: 10.1105/tpc.17.00953
Lin, Y., Chen, G., Hu, H., Yang, X., Zhang, Z., Jiang, X., et al. (2020a). Phenotypic and genetic variation in phosphorus-deficiency-tolerance traits in Chinese wheat landraces. BMC Plant Biol. 20:330. doi: 10.1186/s12870-020-02492-3
Lin, Y., Jiang, X., Hu, H., Zhou, K., Wang, Q., Yu, S., et al. (2021). Qtl mapping for grain number per spikelet in wheat using a high-density genetic map. Crop J. doi: 10.1016/j.cj.2020.12.006
Lin, Y., Jiang, X., Tao, Y., Yang, X., Wang, Z., Wu, F., et al. (2020b). Identification and validation of stable quantitative trait loci for grain filling rate in common wheat (Triticum aestivum L.). Theor. Appl. Genet. 133, 2377–2385. doi: 10.1007/s00122-020-03605-0
Lin, Y., Liu, S., Liu, Y., Liu, Y., Chen, G., and Xu, J. (2017). Genome-wide association study of pre-harvest sprouting resistance in Chinese wheat founder parents. Genet. Mol. Biol. 40, 620–629. doi: 10.1590/1678-4685-GMB-2016-0207
Lin, Y., Yi, X., Tang, S., Chen, W., Wu, F., Yang, X., et al. (2019). Dissection of phenotypic and genetic variation of drought-related traits in diverse chinese wheat landraces. Plant Genome 12, 1–14. doi: 10.3835/plantgenome2019.03.0025
Liu, J., He, Z., Rasheed, A., Wen, W., Yan, J., Zhang, P., et al. (2017). Genome-wide association mapping of black point reaction in common wheat (Triticum aestivum L.). BMC Plant Biol. 17:220. doi: 10.1186/s12870-017-1167-3
Liu, Y., Lin, Y., Gao, S., Li, Z., Ma, J., Deng, M., et al. (2017). A genome wide association study of 23 agronomic traits in Chinese wheat landraces. Plant J. 91, 861–873. doi: 10.1111/tpj.13614
Liu, Y., Wang, L., Deng, M., Li, Z., Lu, Y., Wang, J., et al. (2015a). Genome-wide association study of phosphorus-deficiency-tolerance traits in Aegilops tauschii. Theor. Appl. Genet. 128, 2203–2212. doi: 10.1007/s00122-015-2578-x
Liu, Y., Wang, L., Mao, S., Liu, K., Lu, Y., Wang, J., et al. (2015b). Genome-wide association study of 29 morphological traits in Aegilops tauschii. Sci. Rep. 5:15562. doi: 10.1038/sre15562
Lizana, X. C., Riegel, R., Gómez, L. D., Herrera, J. C., Isla, A., McQueen-Mason, S. J., et al. (2010). Expansins expression is associated with grain size dynamics in wheat (Triticum aestivum L.). J. Exp. Bot. 61, 1147–1157. doi: 10.1093/jxb/erp380
Long, L., Mao, X., Wang, J., Chang, X., Reynolds, M., and Jing, R. (2019). Genetic dissection of drought and heat-responsive agronomic traits in wheat. Plant Cell Environ. 42, 2540–2553. doi: 10.1111/pce.13577
Lu, Y., Xu, J., Yuan, Z., Hao, Z., Xie, C., Li, X., et al. (2011). Comparative LD mapping using single SNPs and haplotypes identifies QTL for plant height and biomass as secondary traits of drought tolerance in maize. Mol. Breed. 30, 407–418. doi: 10.1007/s11032-011-9631-5
Lu, Y., Zhang, S., Shah, T., Xie, C., Hao, Z., Li, X., et al. (2010). Joint linkage–linkage disequilibrium mapping is a powerful approach to detecting quantitative trait loci underlying drought tolerance in maize. Proc. Natl. Acad. Sci U.S.A. 107, 19585–19590. doi: 10.1073/pnas.1006105107
Luo, M., Gu, Y., Puiu, D., Wang, H., Twardziok, S., Deal, K., et al. (2017). Genome sequence of the progenitor of the wheat D genome Aegilops tauschii. Nature 551, 498–502. doi: 10.1038/nature24486
Mao, G., Wang, R., Guan, Y., Liu, Y., and Zhang, S. (2011). Sulfurtransferases 1 and 2 play essential roles in embryo and seed development in Arabidopsis thaliana. J. Biol. Chem. 286, 7548–7557. doi: 10.1074/jbc.M110.182865
Mathew, I. E., Das, S., Mahto, A., and Agarwal, P. (2016). Three rice NAC transcription factors heteromerize and are associated with seed size. Front. Plant Sci. 7:1638. doi: 10.3389/fpls.2016.01638
Matsuoka, M., and Ashikari, M. (2007). A quantitative trait locus regulating rice grain width. Nat. Genet. 39, 583–584. doi: 10.1038/ng0507-583
Matsuoka, Y. (2011). Evolution of polyploid triticum wheats under cultivation: the role of domestication, natural hybridization and allopolyploid speciation in their diversification. Plant Cell Physiol. 525, 750–764. doi: 10.1093/pcp/pcr018
Monaghan, J., Xu, F., Gao, M., Zhao, Q., Palma, K., Long, C., et al. (2009). Two Prp19-Like U-Box proteins in the MOS4-associated complex play redundant roles in plant innate immunity. PLoS Pathog. 5:e1000526. doi: 10.1371/journal.ppat.1000526
Murray, M. G., and Thompson, W. F. (1980). Rapid isolation of high molecular weight plant DNA. Nucleic Acids Res. 819, 4321–4325. doi: 10.1093/nar/8.19.4321
Ogbonnaya, F., Abdalla, O., Mujeeb-Kazi, A., Kazi, A. G., Xu, S., Gosman, N., et al. (2013). Synthetic hexaploids: harnessing species of the primary gene pool for wheat improvement. Plant Breed. Rev. 37, 35–122. doi: 10.1002/9781118497869.CH2
Pritchard, J., Stephens, M., and Donnelly, P. (2000). Inference of population structure using multilocus genotype data. Genetics 1552, 945–959. doi: 10.1093/genetics/155.2.945
Qin, P., Lin, Y., Hu, Y., Liu, K., Mao, S., Li, Z., et al. (2016). Genome-wide association study of drought-related resistance traits in Aegilops tauschii. Genet. Mol. Biol. 39, 398–407. doi: 10.1590/1678-4685-GMB-2015-0232
R Core Team (2014). R: A Language and Environment for Statistical Computing. MSOR Connections, 1. Vienna: R Core Team.
Simmonds, J., Scott, P. J., Brinton, J., Mestre, T. C., Bush, M., Blanco, A. D., et al. (2016). A splice acceptor site mutation in TaGW2-A1 increases thousand grain weight in tetraploid and hexaploid wheat through wider and longer grains. Theor. Appl. Genet. 129, 1099–1112. doi: 10.1007/s00122-016-2686-2
Smith, S. E., Kuehl, R. O., Ray, I., Hui, R., and Soleri, D. (1998). Evaluation of simple methods for estimating broad-sense heritability in stands of randomly planted genotypes. Crop Sci. 38, 1125–1129. doi: 10.2135/cropsci1998.0011183X003800050003x
Takeda, T., Toyofuku, K., Matsukura, C., and Yamaguchi, J. (2001). Sugar transporters involved in flowering and grain development of rice. J. Plant Physiol. 158, 465–470. doi: 10.1078/0176-1617-00358
Wang, R. X., Zhang, X. Y., Ling, W., Wang, R., Huang, L., Yang, G. X., et al. (2009). QTL analysis of grain size and related traits in winter wheat under different ecological environments. Entia Agric. Sin. 42, 398–407.
Wu, F., Yang, X., Wang, Z., Deng, M., Ma, J., Chen, G., et al. (2017). Identification of major quantitative trait loci for root diameter in synthetic hexaploid wheat under phosphorus-deficient conditions. J. Appl. Genet. 58, 437–447. doi: 10.1007/s13353-017-0406-5
Wuriyanghan, H., Zhang, B., Cao, W., Ma, B., Lei, G., Liu, Y., et al. (2009). The ethylene receptor ETR2 delays floral transition and affects starch accumulation in rice[W]. Plant Cell Online 21, 1473–1494. doi: 10.1105/tpc.108.065391
Xie, C., Mao, X., Huang, J., Ding, Y., Wu, J., Dong, S., et al. (2011). KOBAS 2.0: a web server for annotation and identifycation of enriched pathways and diseases. Nucleic Acids Res. 39(suppl_2), W316–W322. doi: 10.1093/nar/gkr483
Yang, N., Lu, Y., Yang, X., Huang, J., Zhou, Y., Ali, F., et al. (2014). Genome wide association studies using a new nonparametric model reveal the genetic architecture of 17 agronomic traits in an enlarged maize association panel. PLoS Genet. 10:e1004573. doi: 10.1371/journal.pgen.1004573
Ye, X., Li, J., Cheng, Y., Yao, F., Long, L., Wang, Y., et al. (2019). Genome-wide association study reveals new loci for yield-related traits in Sichuan wheat germplasm under stripe rust stress. BMC Genom. 20:640. doi: 10.1186/s12864-019-6005-6
Yin, C., Zhao, H., Ma, B., Chen, S., and Zhang, J. (2017). Diverse roles of ethylene in regulating agronomic traits in rice. Front. Plant Sci. 8:1676. doi: 10.3389/fpls.2017.01676
Yu, T., Shi, D., Jia, P., Tang, J., Li, H., Liu, J., et al. (2016). The arabidopsis receptor kinase ZAR1 is required for zygote asymmetric division and its daughter cell fate. PLoS Genet. 12:e1005933. doi: 10.1371/journal.pgen.1005933
Zhang, C., Huang, L., Zhang, H., Hao, Q., Lyu, B., Wang, M., et al. (2019). An ancestral NB-LRR with duplicated 3′UTRs confers stripe rust resistance in wheat and barley. Nat. Commun. 10:4023. doi: 10.1038/s41467-019-11872-9
Zhang, Y., Yang, W. Y., Hu, X. R., Yu, Y., Zou, Y. C., and Li, Q. M. (2004). Anaylsis of agronomic characters of new wheat variety Chuanmai 42 derived from synthetics (Triticum duru Aegilops tauschii). Southwest China J. Agric. Sci. 17, 141–145.
Zhao, J., Wang, H., Zhang, X., Du, X., Li, A., and Kong, L. (2015). Association analysis of grain traits with SSR markers between Aegilops tauschii and hexaploid wheat (Triticum aestivum L.). J. Integr. Agric. 14, 1936–1948. doi: 10.1016/s2095-3119(15)61070-x
Keywords: Aegilops tauschii, candidate gene, genetic diversity, GWAS, kernel traits, SNP
Citation: Wang Q, Yan N, Chen H, Li S, Hu H, Lin Y, Shi H, Zhou K, Jiang X, Yu S, Li C, Chen G, Yang Z and Liu Y (2021) Genome-Wide Association Study of Kernel Traits in Aegilops tauschii. Front. Genet. 12:651785. doi: 10.3389/fgene.2021.651785
Received: 11 January 2021; Accepted: 04 May 2021;
Published: 28 May 2021.
Edited by:
Penghao Wang, Murdoch University, AustraliaReviewed by:
Yong Jia, Murdoch University, AustraliaCopyright © 2021 Wang, Yan, Chen, Li, Hu, Lin, Shi, Zhou, Jiang, Yu, Li, Chen, Yang and Liu. This is an open-access article distributed under the terms of the Creative Commons Attribution License (CC BY). The use, distribution or reproduction in other forums is permitted, provided the original author(s) and the copyright owner(s) are credited and that the original publication in this journal is cited, in accordance with accepted academic practice. No use, distribution or reproduction is permitted which does not comply with these terms.
*Correspondence: Yaxi Liu, bGl1eWF4aUBzaWNhdS5lZHUuY24=; orcid.org/0000-0001-6814-7218
†These authors have contributed equally to this work
Disclaimer: All claims expressed in this article are solely those of the authors and do not necessarily represent those of their affiliated organizations, or those of the publisher, the editors and the reviewers. Any product that may be evaluated in this article or claim that may be made by its manufacturer is not guaranteed or endorsed by the publisher.
Research integrity at Frontiers
Learn more about the work of our research integrity team to safeguard the quality of each article we publish.