 Zheying Zhang
 Huifang Zhu1
 Jiateng Zhong
- 1Department of Pathology, School of Basic Medical Sciences, Xinxiang Medical University, Xinxiang, China
- 2Department of Pathology, The First Affiliated Hospital of Xinxiang Medical University, Xinxiang, China
- 3Synthetic Biology Engineering Laboratory of Henan Province, School of Life Sciences and Technology, Xinxiang Medical University, Xinxiang, China
Colorectal cancer (CRC) is one of the most prevalent malignant tumors worldwide. Colon adenocarcinoma (COAD) is the most common pathological type of CRC and several biomarkers related to survival have been confirmed. Yet, the predictive effect of a single gene biomarker is not enough. The tricarboxylic acid (TCA) cycle and carbon metabolism play an important role in tumors. Thus, we aimed to identify new gene signatures from the TCA cycle and carbon metabolism to better predict the survival of COAD. This study performed mRNA expression profiling in large COAD cohorts (n = 417) from The Cancer Genome Atlas (TCGA) database. Univariate Cox regression and multivariate Cox regression analysis were performed, and receiver operating characteristic (ROC) curve was used to screen the variable combinations model which is most relevant to patient prognosis survival mostly. Univariable or multivariate analysis results showed that SUCLG2, SUCLG1, ACLY, SUCLG2P2, ATIC and ACO2 have associations with survival in COAD. Combined with clinical variables, we confirmed model 1 (AUC = 0.82505), most relevant to patient prognosis survival. Model 1 contains three genes: SUCLG2P2, SUCLG2 and ATIC, in which SUCLG2P2 and SUCLG2 were low-expressed in COAD, however, ATIC was highly expressed, and the expressions above are related to stages of CRC. Pearson analysis showed that SUCLG2P2, SUCLG2 and ATIC were correlated in normal COAD tissues, while only SUCLG2P2 and SUCLG2 were correlated in tumor tissues. Finally, we verified the expressions of these three genes in COAD samples. Our study revealed a possible connection between the TCA cycle and carbon metabolism and prognosis and showed a TCA cycle and carbon metabolism related gene signature which could better predict survival in COAD patients.
Introduction
Colorectal cancer (CRC) is one of the most common malignant tumors. More than 1.2 million patients are diagnosed with colorectal cancer each year, in which over 600,000 people died, and the damage to humans is increasing. In the United States and other Western countries, the incidence of colorectal cancer is the third highest among all types of tumors, the second highest among men, and the third highest among women (Siegel et al., 2017). Although some progress has been made in the detection and treatment of colorectal cancer in recent years, the therapeutic effect has not improved, and the specific molecular mechanisms of its occurrence and metastasis are not understood. Colon adenocarcinoma (COAD) is the most common pathological type of CRC. It is therefore of great scientific importance and clinical value to reveal the pathogenesis of COAD and to find molecular markers and drug targets of the disease.
Any type of activity in life is based on a corresponding material and energy basis, the tumor is not an exception, all kinds of biological characteristics, are closely linked to metabolism (Phan et al., 2014). If we can selectively control certain metabolic pathways in tumors, it may be possible to block the corresponding malignant phenotype. The group containing one carbon atom in the organism is named one carbon unit, which includes methyl (-CH3), alkenyl (-CH2), alkynyl (-ch =), formyl (-CHO) and iminomethyl (-ch = NH) (Ducker and Rabinowitz, 2017). The metabolism related to the generation and transfer of one carbon unit is called one carbon metabolism (Newman and Maddocks, 2017). One carbon metabolism is closely related to other metabolic processes in vivo. One carbon unit is an important precursor of nucleic acid (pyrimidine, purine) synthesis. It participates in the methylation of DNA, RNA, protein, lipid, neurotransmitter and glutathione synthesis through adenosylmethionine (SAM), which has an important impact on the epigenetic and redox status of cells (Yang and Vousden, 2016; Zeng et al., 2019). The tricarboxylic acid (TCA) cycle is a common metabolic pathway in aerobic organisms (Anderson et al., 2018). TCA cycle is the final metabolic pathway of the three nutrients (carbohydrate, lipid and amino acid), and the hub of carbohydrate, lipid and amino acid metabolism (Cappel et al., 2019). The TCA cycle is the main path to generate energy ATP. It regulates energy production in mitochondrial respiration and plays an important role in carbohydrate metabolism (Che-Othman et al., 2020). More and more studies have shown that the key enzyme activities of one carbon metabolism and TCA cycle are related to a variety of tumors (Vander Heiden and DeBerardinis, 2017; Anderson et al., 2018; Rizzo et al., 2018; May et al., 2019; Nie et al., 2020).
In this study, we used bioinformatics analysis guided by public databases to search for differentially expressed genes of carbon metabolism and the tricarboxylic acid cycle pathway. Univariate Cox regression, multivariate Cox regression analysis and receiver operating characteristic (ROC) curve were used to screen the gene combinations which were most relevant to patient prognosis survival. And the expression of genes in COAD tissues was verified. This study may reveal new research directions and therapeutic targets and provide a basis for the diagnosis and treatment of COAD.
Materials and Methods
Data Mining From TCGA
The gene expression FPKM data of COAD patients were downloaded from the TCGA portal1, along with their clinical data such as age, sex, tumor stage, TNM classification and survival status (project ID: TCGA = COAD). A total of 524 cases were downloaded from the TCGA database. Cases with a survival time of fewer than 30 days survival status and empty value were deleted, and there are 417 cases, which contained 379 tumor samples and 38 normal samples.
Tissue Samples
We collected 20 pairs of COAD samples and adjacent normal tissues at the First Affiliated Hospital of Xinxiang Medical College (Xinxiang, China). All cases were pathologically confirmed as adenocarcinomas. This study is approved by the Ethics Committee of Xinxiang Medical University, and all aspects of the study follow the Declaration of Helsinki. All patients provided signed informed consent forms. The COAD tissues and adjacent normal tissues were immediately frozen in liquid nitrogen for 5 min, and stored at −80°C.
Extraction of TCA Cycle and One Carbon Metabolism Genes
From the GSEA website2, we downloaded the c2.cp.kegg.v7.2 symbol file for finding the TCA and one carbon metabolism pathway genes (Subramanian et al., 2005). The expression levels of TCA and one carbon metabolism pathway genes were extracted from the expression matrix. A total of 47 genes were extracted (Supplementary Data 1).
Differential Expression Analysis
We conducted differential expression analysis using the limma packages for TCGA data by R software. Differentially expressed genes (DEGs) were screened out using the cutoffs of FDR < 0.05 and |logFC| > 0.6 for the comparison between tumor and non-tumor samples. Accordingly, DEGs of the TCA cycle and one carbon metabolism genes were identified. Then heatmap and volcano plot were drawn by R software. Perl scripts were used to merge differentially expressed genes files and survival information files.
Searching for Prognostic Models and Construct Nomograms
We used the ROC curve to determine the accuracy of different variables in predicting patient survival. By comparing different models, we found the optimal prediction combination. And a nomogram was drawn. ROC curve and nomogram were performed using the statistical software EmpowerStats (3, X&Y Solutions, Inc., Boston, MA, United States) (Zhao et al., 2019). In addition, we tested the correlation of SUCLG2P2, SUCLG2 and ATIC which were screened out by area under curve (AUC) to clinical features by using EmpowerStats software with p < 0.05 being considered meaningfully.
Bioinformational Analysis of SUCLG2 and ATIC Expression From Public Database
We used driverDBV3 database4 to detect the SUCLG2 and ATIC expression levels in different cancer types (Liu et al., 2020). GEPIA5 is a newly developed online web server for analyzing the RNA sequencing expression data from The Cancer Genome Atlas (TCGA) and the Genotype-Tissue Expression (GTEx) projects (Tang et al., 2017). We used GEPIA to analyze SUCLG2 and ATIC mRNA expression levels. UALCAN database6 used TCGA level 3 RNA-seq and clinical data from 31 cancer types (Chandrashekar et al., 2017). It can analyze the effect of gene expression levels and clinicopathologic features. UALCAN also provides a protein expression analysis using data from Clinical Proteomic Tumor Analysis Consortium (CPTAC) dataset. UALCAN was used to analyze SUCLG2 and ATIC expression levels according to cancer types or pathological stages.
Survival Analysis of SUCLG2P2, SUCLG2, and ATIC
EmpowerStats software was used to analyze the survival of SUCLG2P2, SUCLG2 and ATIC from TCGA data downloaded. GEPIA database was also used to analyze the relationship between SUCLG2P2, SUCLG2, ATIC and survival in COAD patients. TISIDB database7 was used to analyze the survival of SUCLG2 and ATIC in different cancers (Ru et al., 2019).
Analysis of SUCLG2P2, SUCLG2, and ATIC Co-expressed Genes
In this study, the GEPIA database was used to get the co-expressed genes of SUCLG2P2, SUCLG2 and ATIC in COAD. These co-expressed genes were imported into the String database to gain interactions value among co-expressed genes. Cytoscape software was used to construct co-expression networks (Shannon et al., 2003).
Reverse Transcription-Quantitative Polymerase Chain Reaction
We extracted RNA using TRIzol reagent and RNA reverse transcription of cDNA (Takara Co., Ltd., Dalian, China) according to the manufacturer’s instruction. Reverse transcription-quantitative polymerase chain reaction (RT-qPCR) analysis was performed using SYBR Green I (Takara Co., Ltd.) in triplicate. The results were normalized to the expression of GAPDH. The primer sequences used were listed in Supplementary Table 1. GAPDH was used as an internal control.
Statistical Analysis
Continuous variables were expressed as means with standard deviations. Categorical variables were expressed as frequencies with proportions. Student’s t-test and Pearson’s Chi-square test were used to determine between-group differences in means and proportions. A Cox proportional hazard model was used for univariate and multivariate analyses. All the analyses were performed using the statistical software packages R8 and EmpowerStats (see text footnote 3, X&Y Solutions, Inc., Boston, MA, United States). P < 0.05 was considered statistically significant.
Results
Screening and Identification of DEGs in the TCA and One Carbon Metabolism Pathway From TCGA Datasets
We extracted the expression levels of TCA and one carbon metabolism pathway genes from the expression matrix. We analyzed the differences between the normal group and the tumor group using the cutoffs of FDR < 0.05 and |logFC| > 0.6. A total of 18 different genes were screened out (Table 1). Then heatmap and volcano plot showed that there are six up-regulated and 12 down-regulated genes (Figures 1A,B).
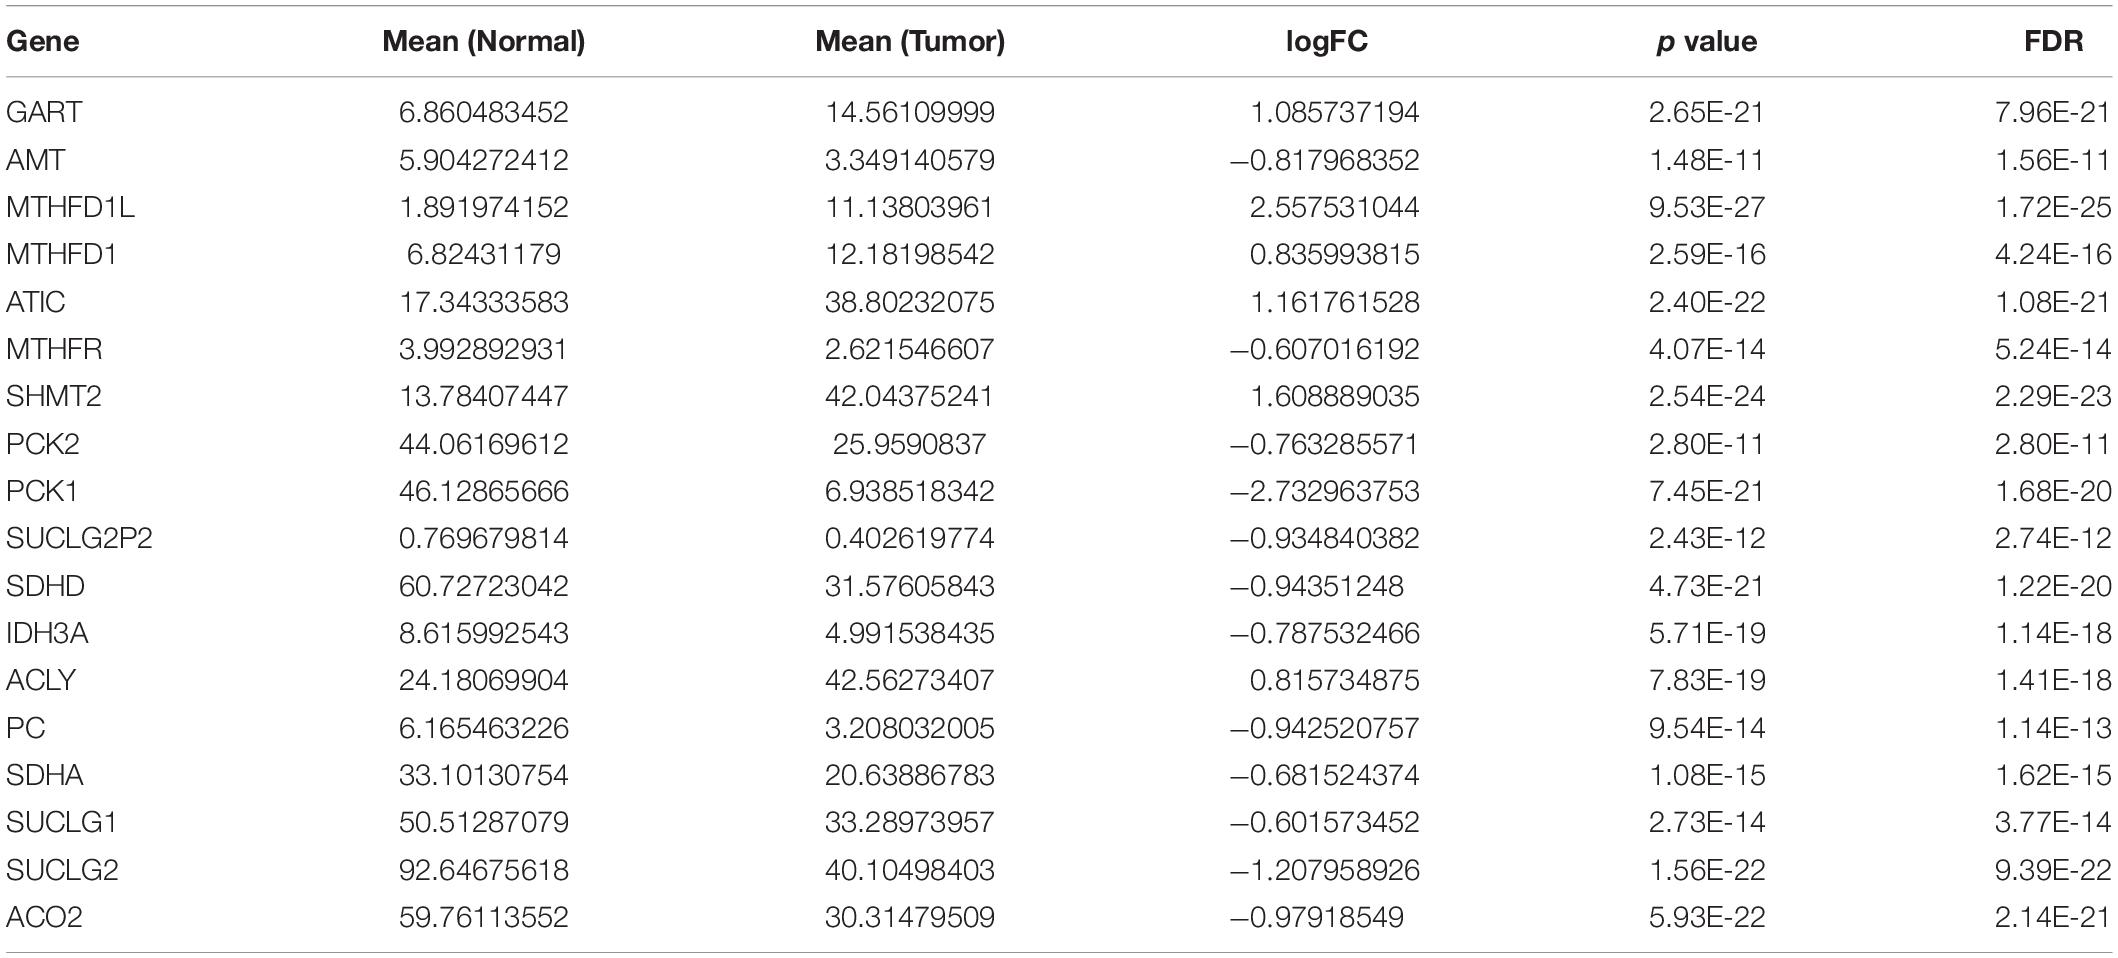
Table 1. Eighteen DEGs in the TCA and one carbon metabolism pathway from TCGA datasets between tumor and normal tissues.
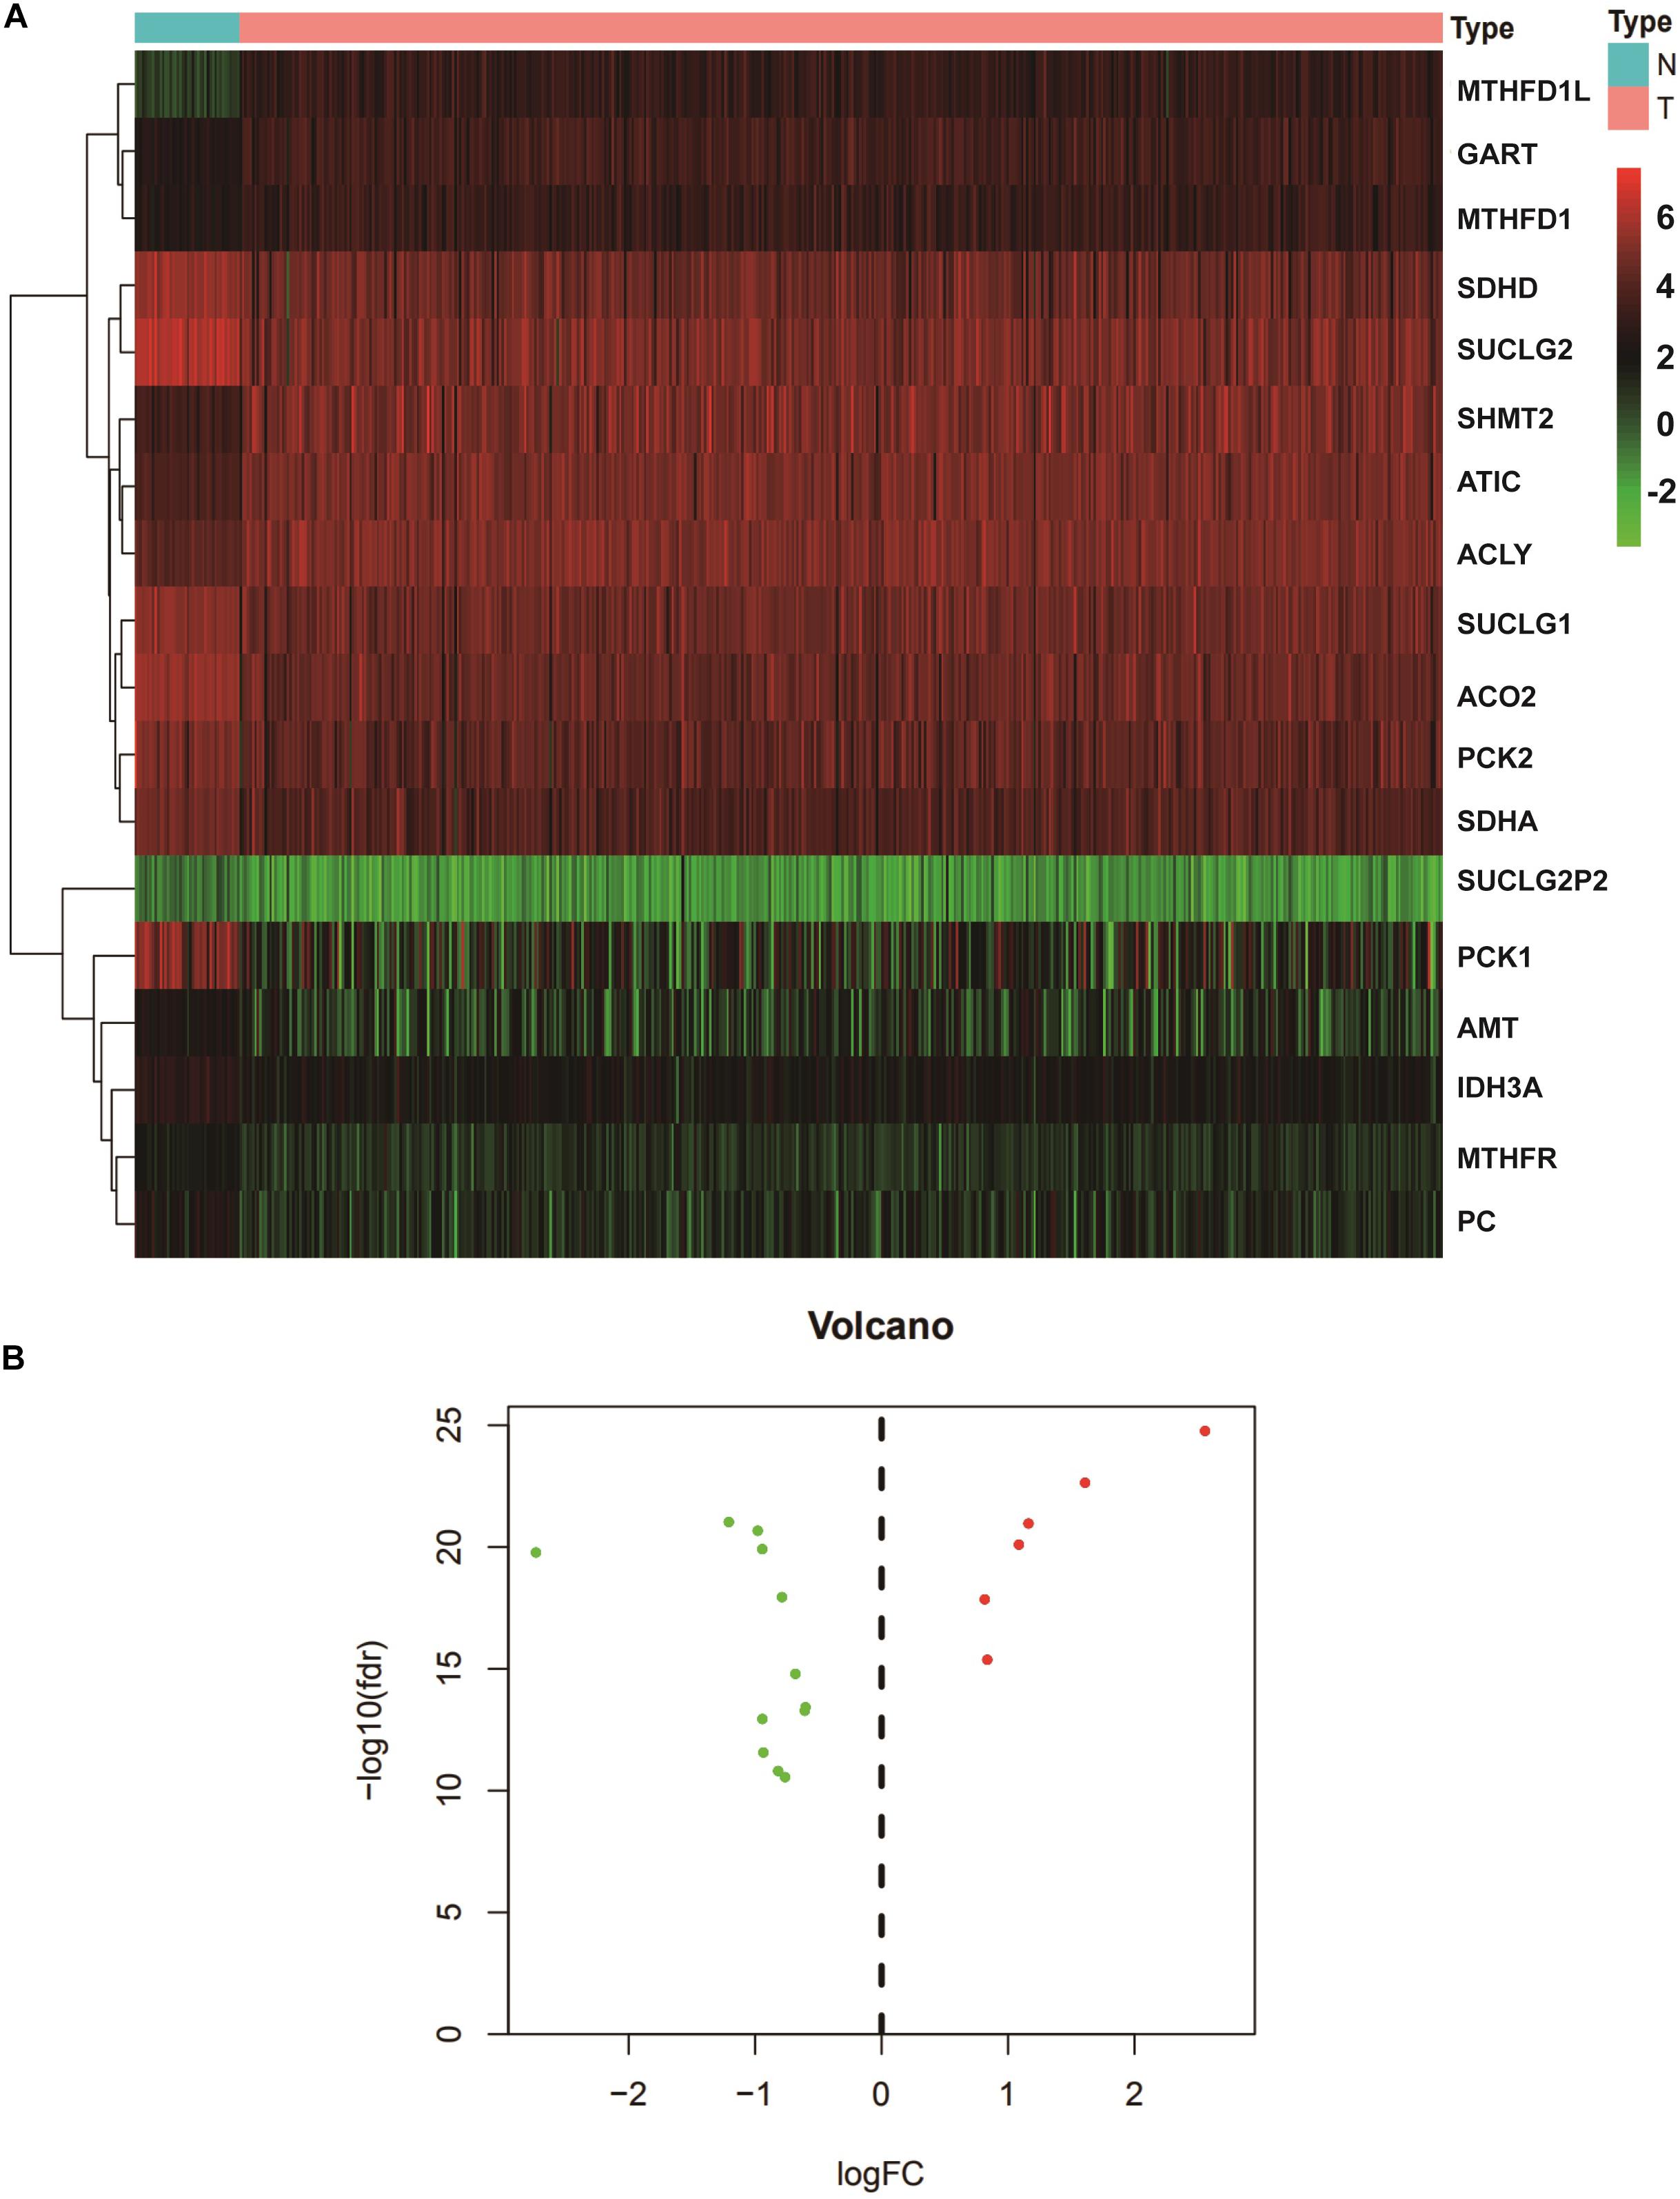
Figure 1. Identification of DEGs in the TCA and one carbon metabolism pathway from TCGA datasets. (A) The heatmap of DEGs in COAD. From red to green, the expression of genes decreased gradually. (B) Volcano plot of DEGs. The green represented the down-regulated genes, red represented up-regulated genes. N, normal; T, tumor. DEGs, Differentially expressed genes; COAD, Colon adenocarcinoma.
Characteristics of the Study Participants
A total of 417 samples were analyzed in this study, of which 379 were tumor samples and 38 were normal (Supplementary Data 2). Table 2 shows the main baseline characteristics of the study participants. Variables including age, gender, tumor stage, TNM classification and differential genes were screened out. The variable tumor type was analyzed as column stratification. The results showed that the three variables SUCLG2P2, ACO2 genes and clinicopathological parameter stage were different between the normal group and the tumor group.
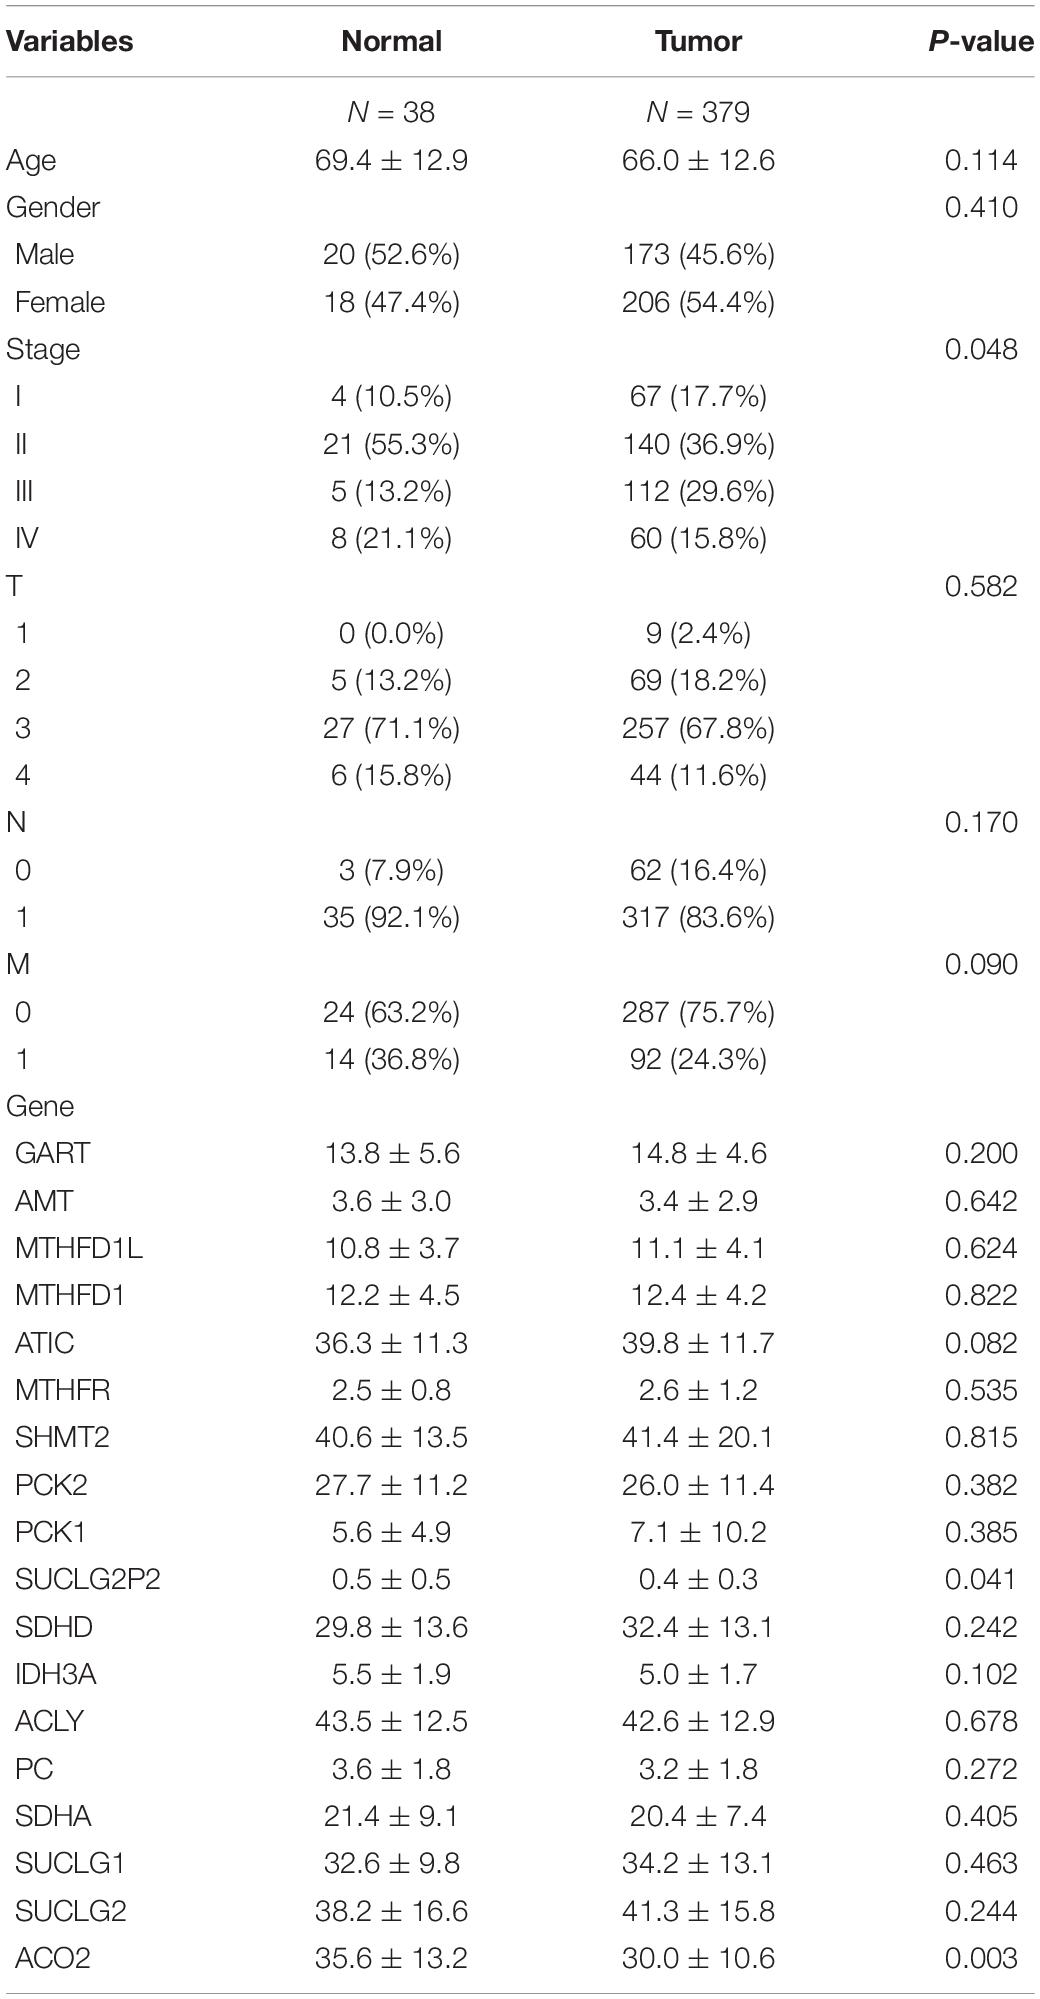
Table 2. The characteristics of patients in the TCGA-COAD cohort.
Identification and Selection of Prognostic Related Variables
In our study, clinicopathological parameter sage, tumor stage, lymphatic, hematogenous metastases and SUCLG2, SUCLG1, ACLY, SUCLG2P2, ATIC and ACO2 genes were found to be associated with survival in univariable or multivariate analysis. In all the variables above, only lymphatic metastatic was associated with survival in both univariate and multivariate analyses. Clinicopathological parameters stage and hematogenous metastases, genes SUCLG2P2 and SUCLG2 approached significance on univariate analysis but were not predictive of survival on multivariate analysis. On the contrary, clinicopathological parameters Age, Lymphatic metastases and SUCLG1, ACLY, ATIC and ACO2 genes approached significance on multivariate analysis but univariate analysis. The P value of the relationship between SUCLG2P2 expression and prognosis was very close to 0.05. GART, AMT, MTHFD1L, MTHFD1, MTHFR, SHMT2, PCK2, PCK1, SDHD, IDH3A, PC, SDHA were not associated with survival (Table 3).
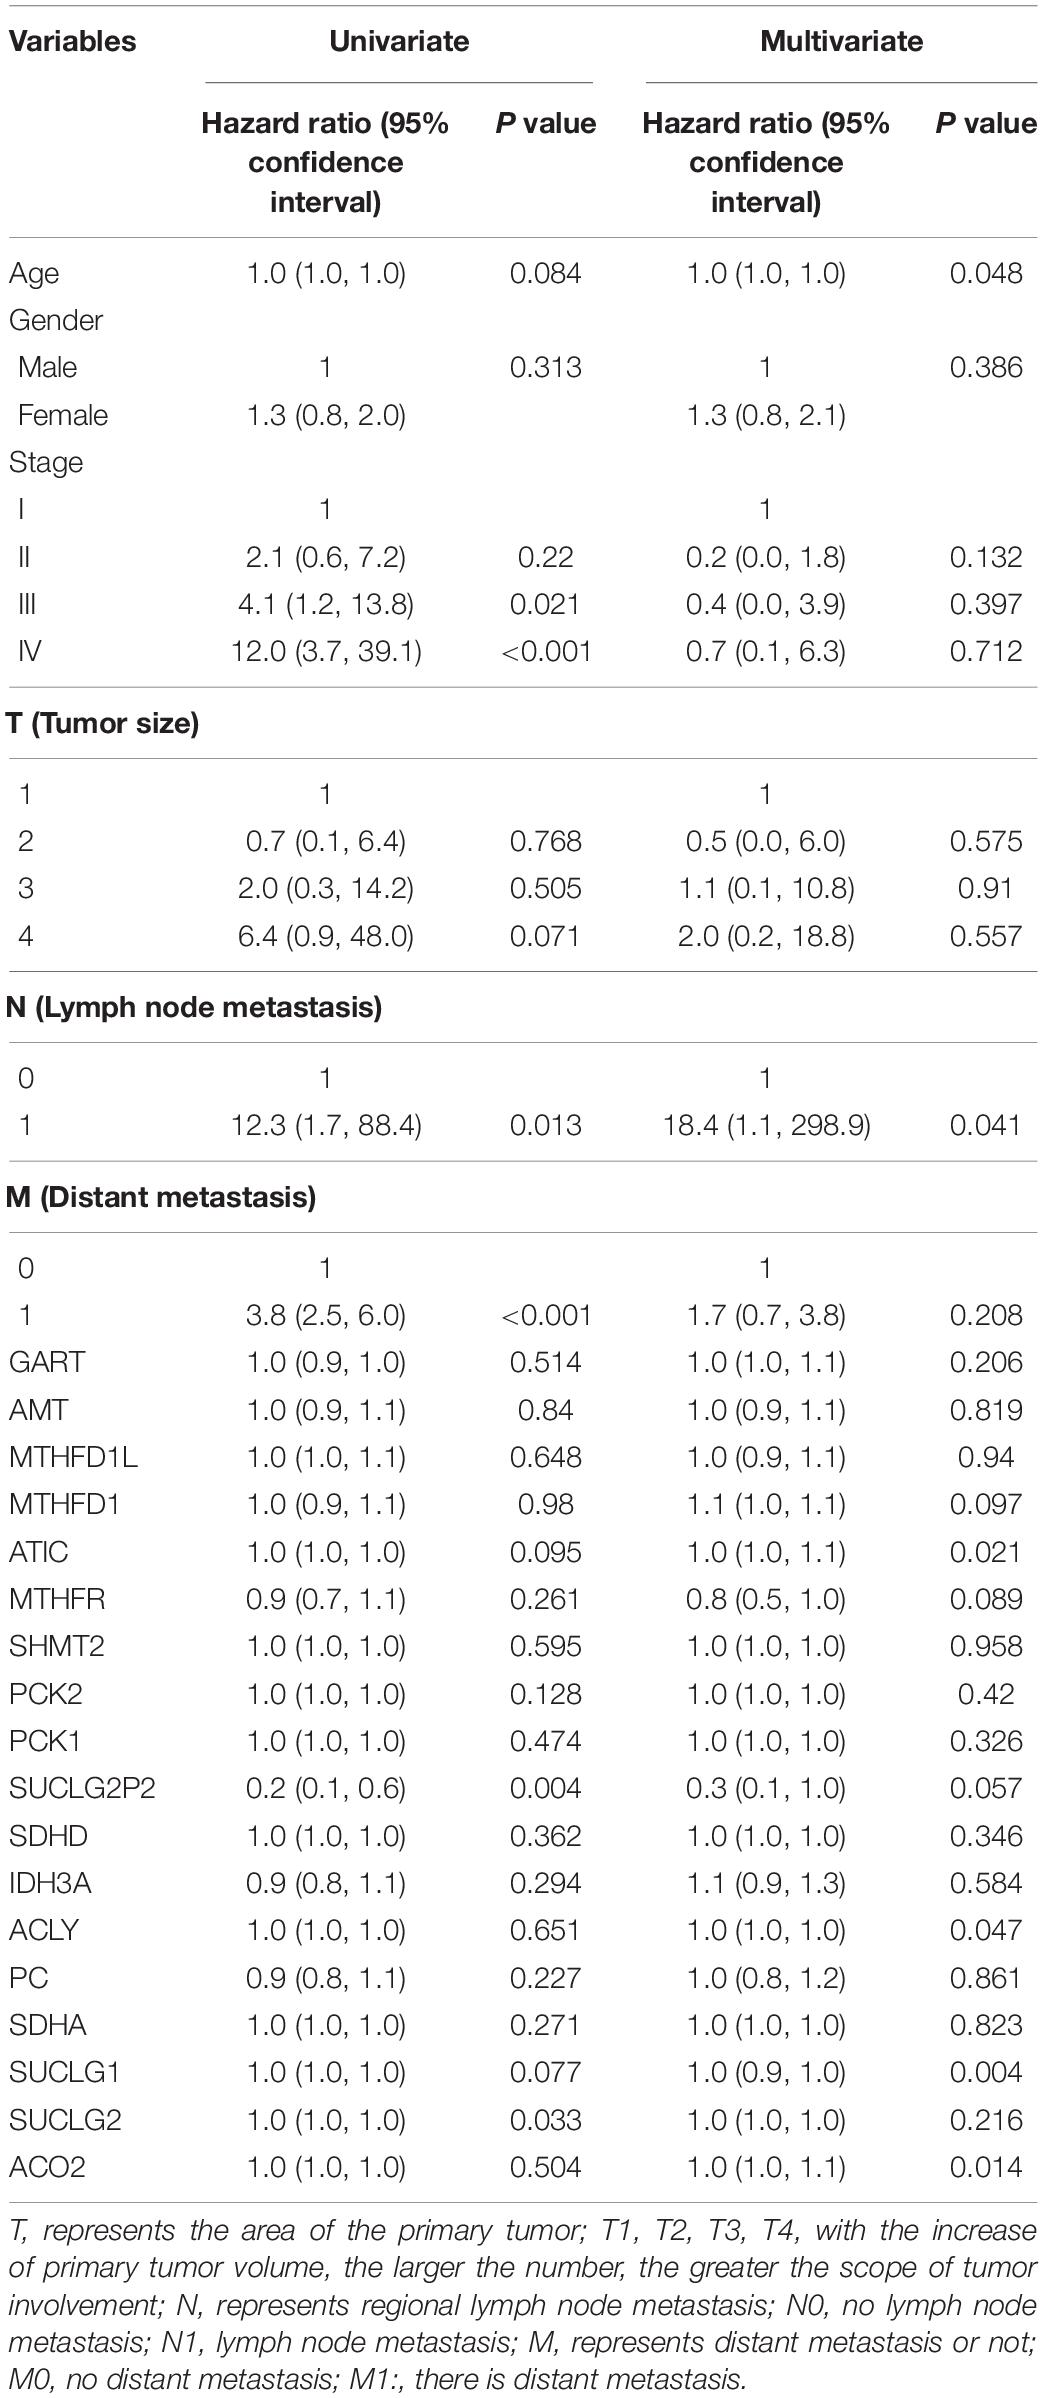
Table 3. Univariate and Multivariable Cox hazard regression analysis for prognostic factors.
Searching for Prognostic Models and Construct Nomogram
Receiver operating characteristic curve is a curve drawn according to a series of different dichotomies, taking true positive rate (sensitivity) as the ordinate and false positive rate (specificity) as the abscissa, which can reflect the relationship between sensitivity and specificity. We used the ROC curve to determine the accuracy of different variables in predicting patient survival. By comparing different models, we found the optimal prediction combination (Model 1: 0.02421∗AGE − 1.88612∗(STAGE = 2) − 1.27190∗(STAGE = 3) − 0.75931∗(STAGE = 4) − 0.90448∗(T = 2) − 0.09615∗(T = 3) + 0.68434∗(T = 4) + 0.45887∗(M = 1) + 2.99163∗(N = 1) + 0.015 06∗ATIC − 0.92401∗SUCLG2P2 − 0.01040∗SUCLG2). The AUC is 0.82505. Compared with model 2 which is composed of a single clinical variable (AUC = 0.77841), the AUC value increased significantly (Figure 2A). ROC curves were performed for the molecular markers of colon cancer in clinical use and SUCLG2P2, SUCLG2 and ATIC genes, and we found that the AUC values were significantly lower than those of model 1 (Figure 2B). We create a new variable based on the formula in Model 1, the new variable model 1 is bisected and trisected. The Kaplan–Meier curve and log-rank test further indicated a significant difference in survival time among the third group (P < 0.0001) (Figures 2C,D). The variables in model 1 were used as the basis of the nomogram (Figure 2E). We also analyzed the relationship between the three selected genes (SUCLG2P2, SUCLG2 and ATIC) and clinical data. The results showed that SUCLG2P2 had an obvious correlation with clinicopathological parameters stage and distant metastasis, while SUCLG2 and ATIC had no obvious correlation with clinical data (Table 4).
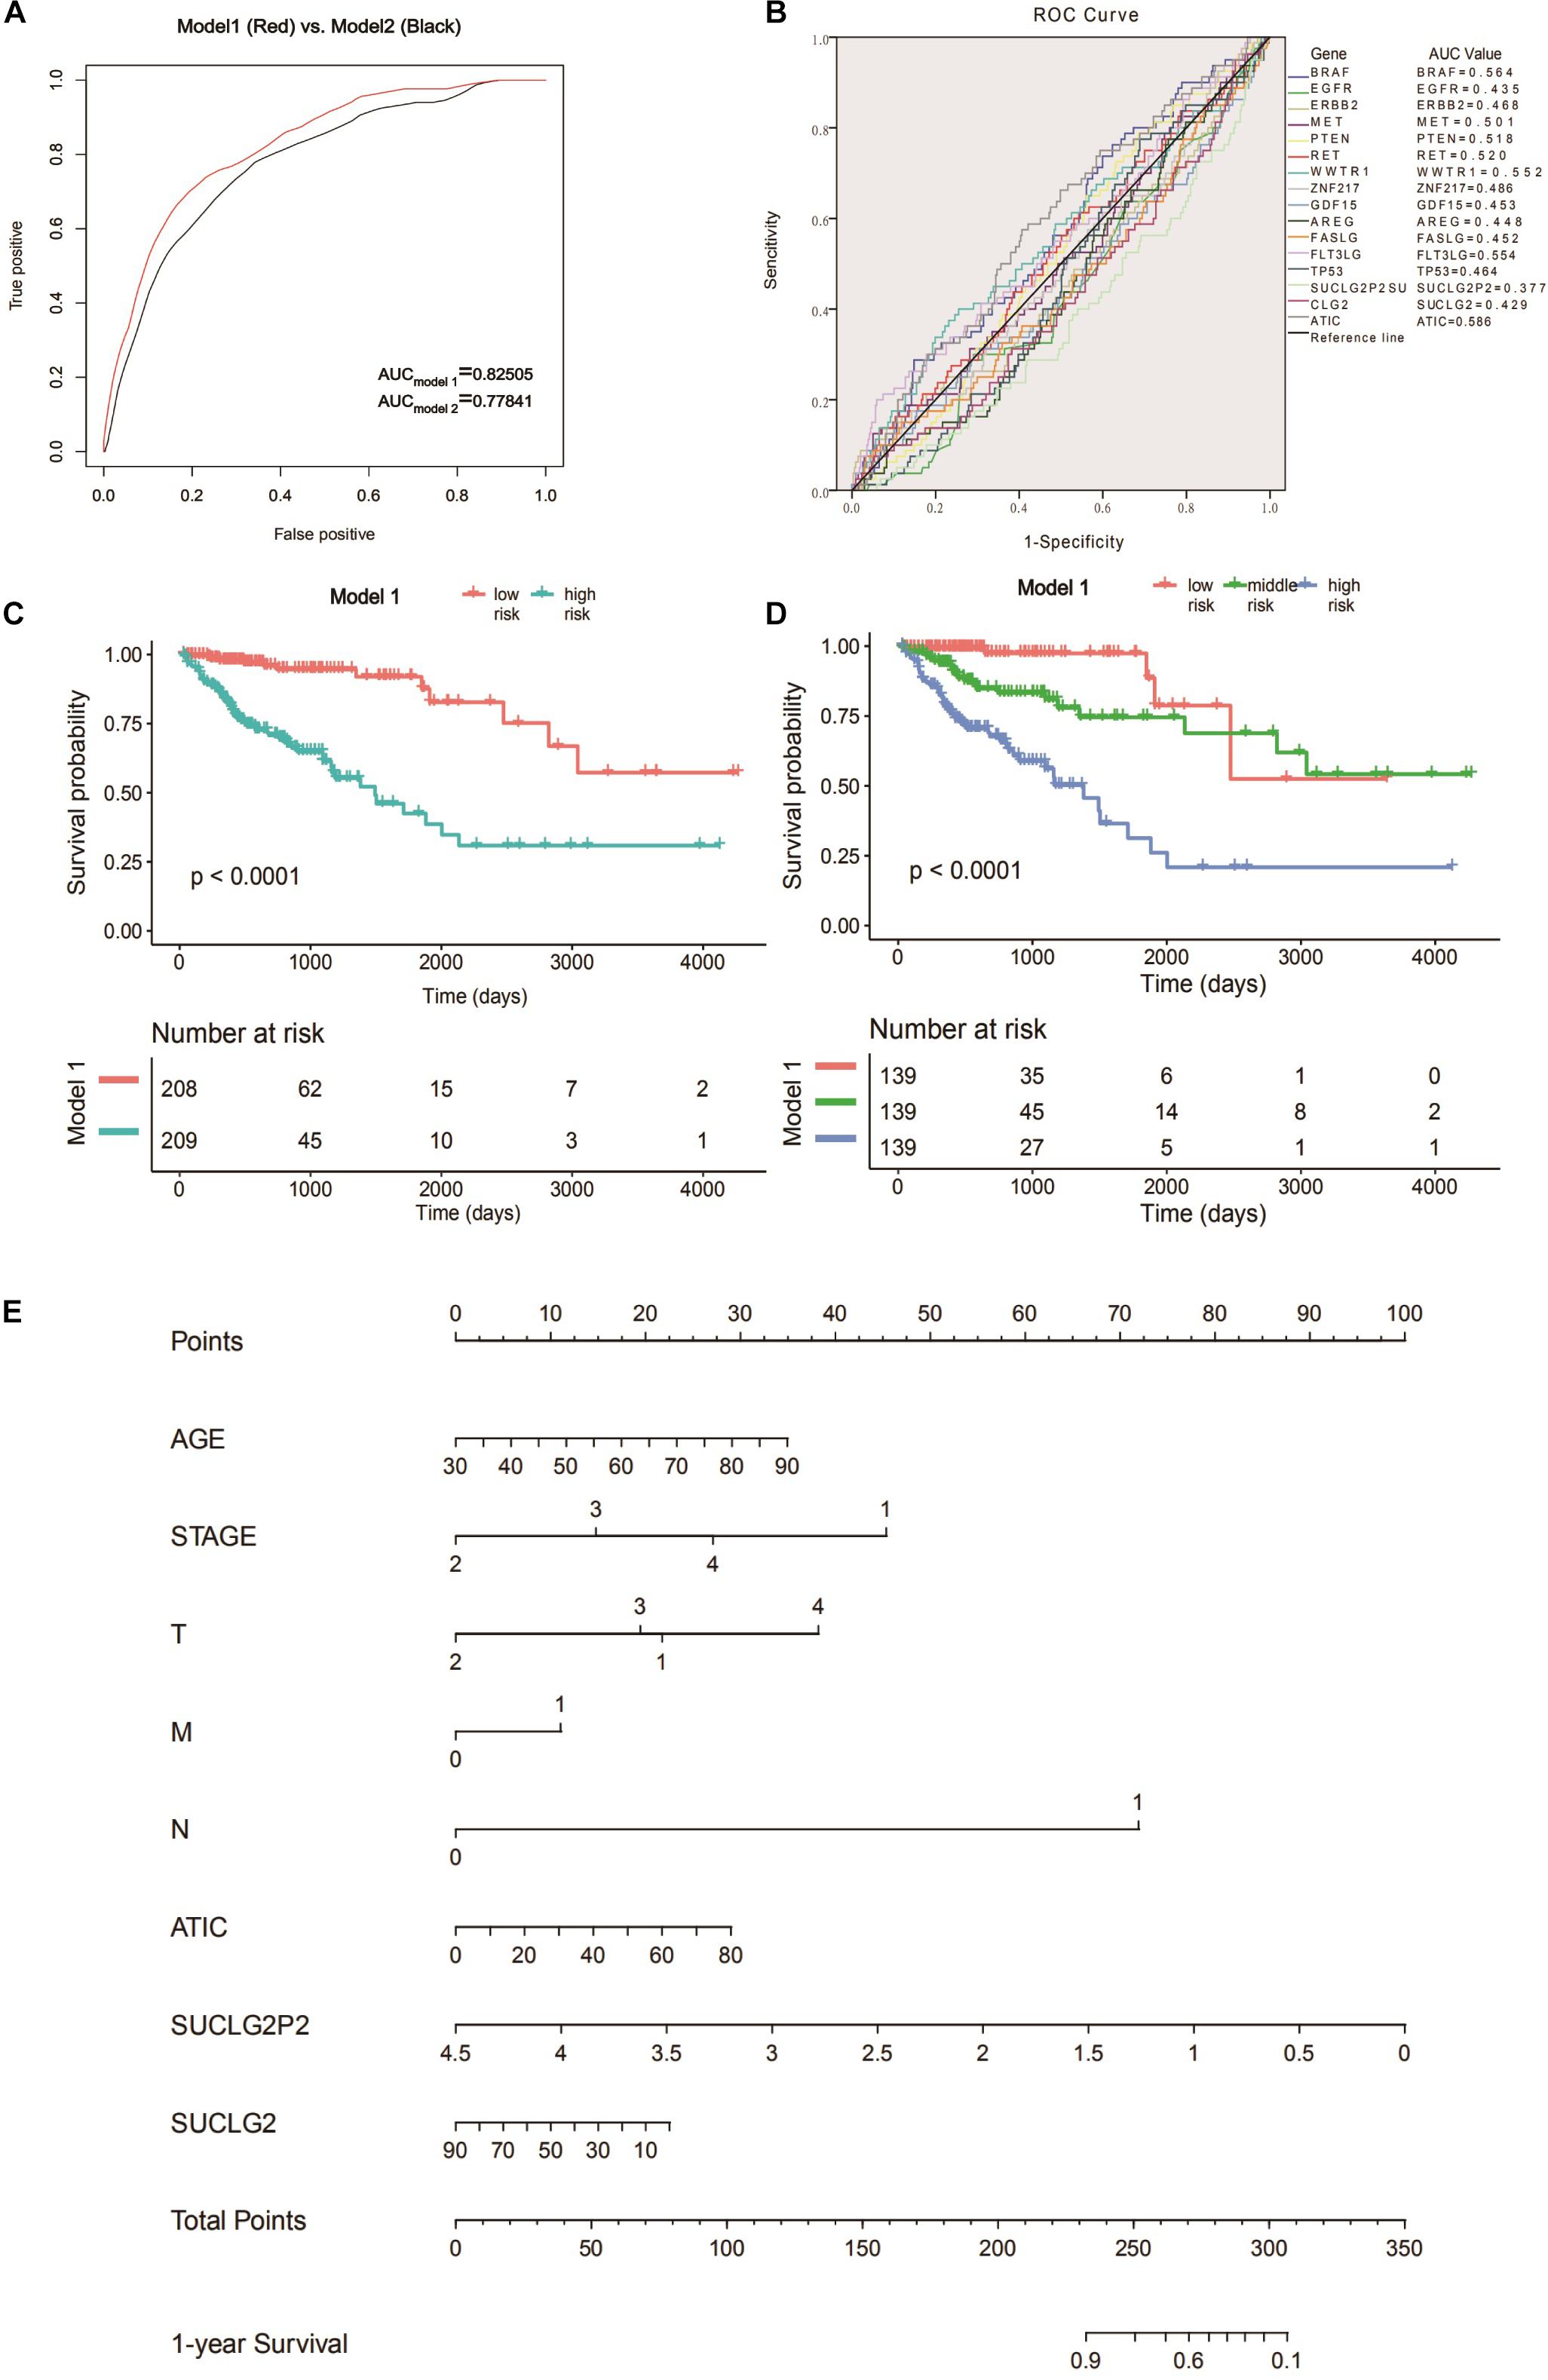
Figure 2. Searching for prognostic models and construct nomogram. (A) The ROC analysis of model 1 and model 2 for survival prediction. (B) ROC curves were performed for the clinically commonly used molecular markers of colon cancer and the three screened genes. (C) Survival curve of low- and high-risk groups stratified by model 1. (D) Survival curve of low- middle -risk and high-risk groups stratified by model 1. (E) Nomogram for predicting 1-year survival for COAD patients based on model 1. ROC, receiver operating characteristic.
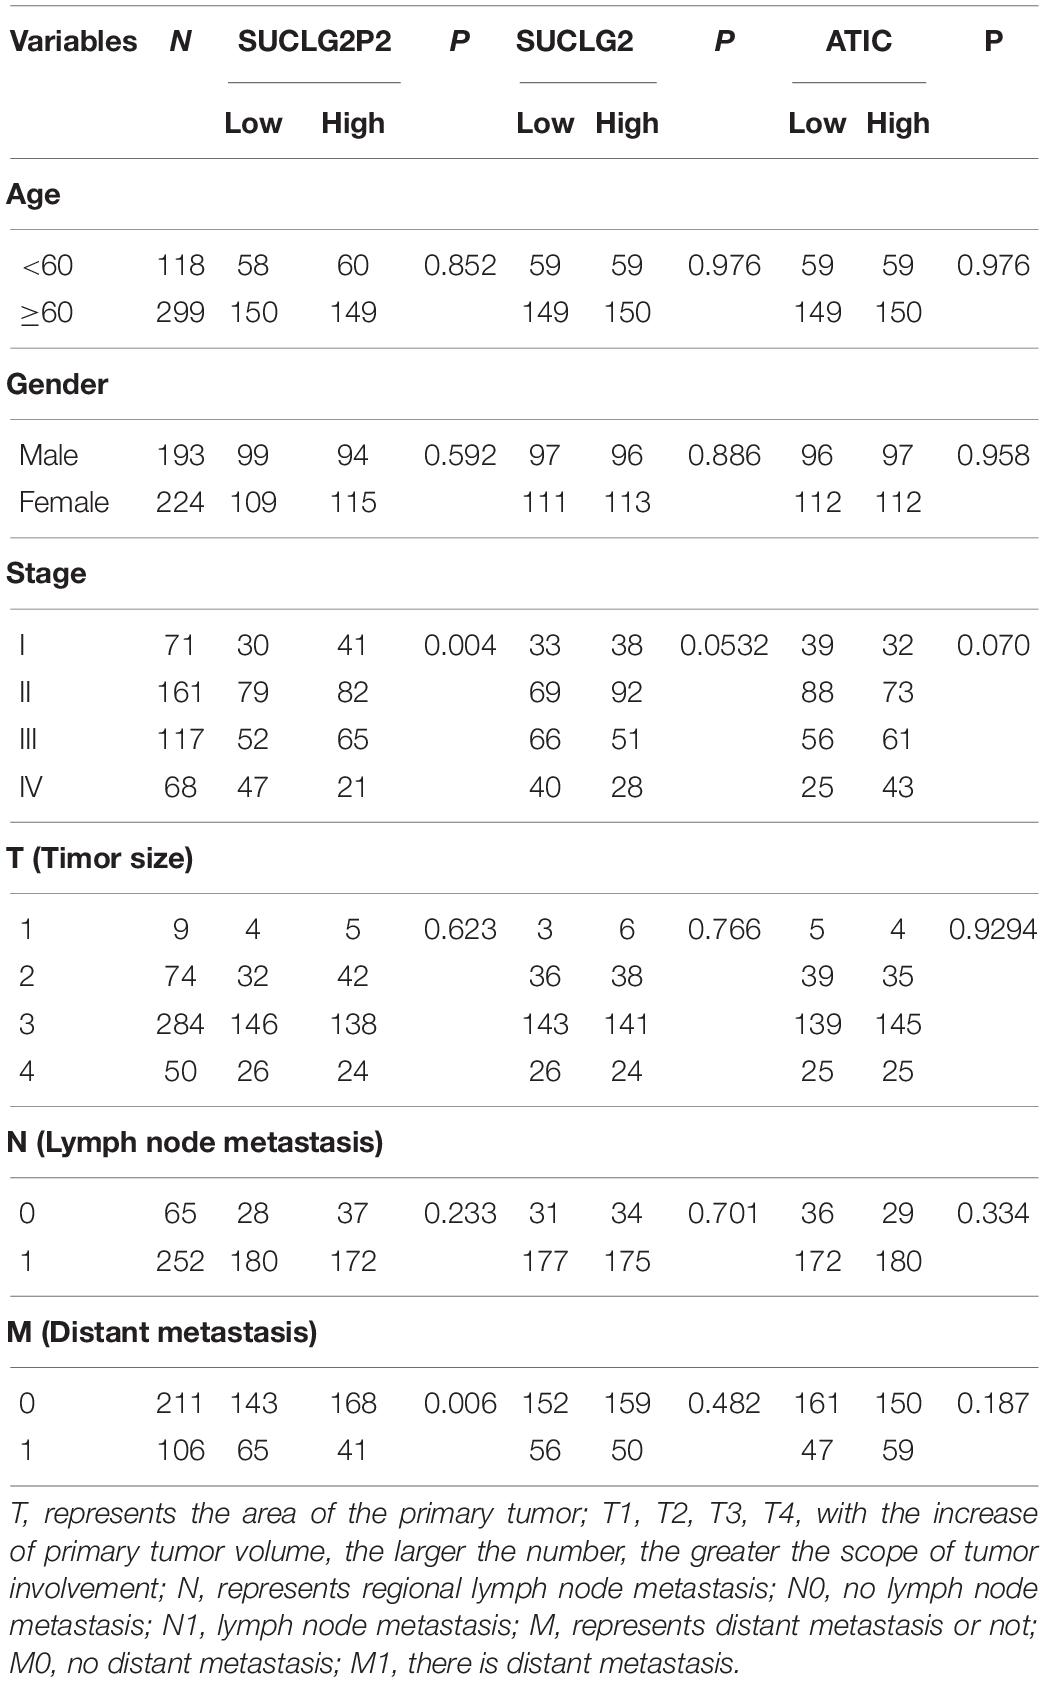
Table 4. Association between SUCLG2P2, SUCLG2 and ATIC genes and clinicopathological parameters of colon cancer patients.
Bioinformational Analysis of SUCLG2P2, SUCLG2 and ATIC Expression From Public Database (driverDBV3, TCGA, GEPIA, UACLAN)
To determine differences of SUCLG2 and ATIC expression in tumor and normal tissues, the SUCLG2 and ATIC mRNA levels in different tumors and normal tissues of many cancer types were analyzed using the driverDBV3 database. The analysis revealed that the SUCLG2 expression was lower in most tumors compared to the normal tissues, but higher in glioblastoma. The ATIC is contrary to the expression of SUCLG2, which is expressed in most tumors (Figure 3A). Furthermore, we compared the three genes in COAD. Analyzing the downloaded TCGA data showed that the expression of ATIC was up-regulated in the tumor, and that of SUCLG2P2 was consistent with that of SUCLG2, the mRNA expression of SUCLG2P2 and SUCLG2 were down-regulated in the tumor (Figure 3B). We analyzed the expression of SUCLG2 and ATIC genes in the online public database (GEPIA and UACLAN), because none of the public databases contained the SUCLG2P2 gene, only the results of SUCLG2 and ATIC were got. The results are consistent with the analysis results of downloaded TCGA data (Figures 3C,D). Moreover, the expression of SUCLG2 and ATIC was related to the clinicopathological parameter stage (Figure 3E).
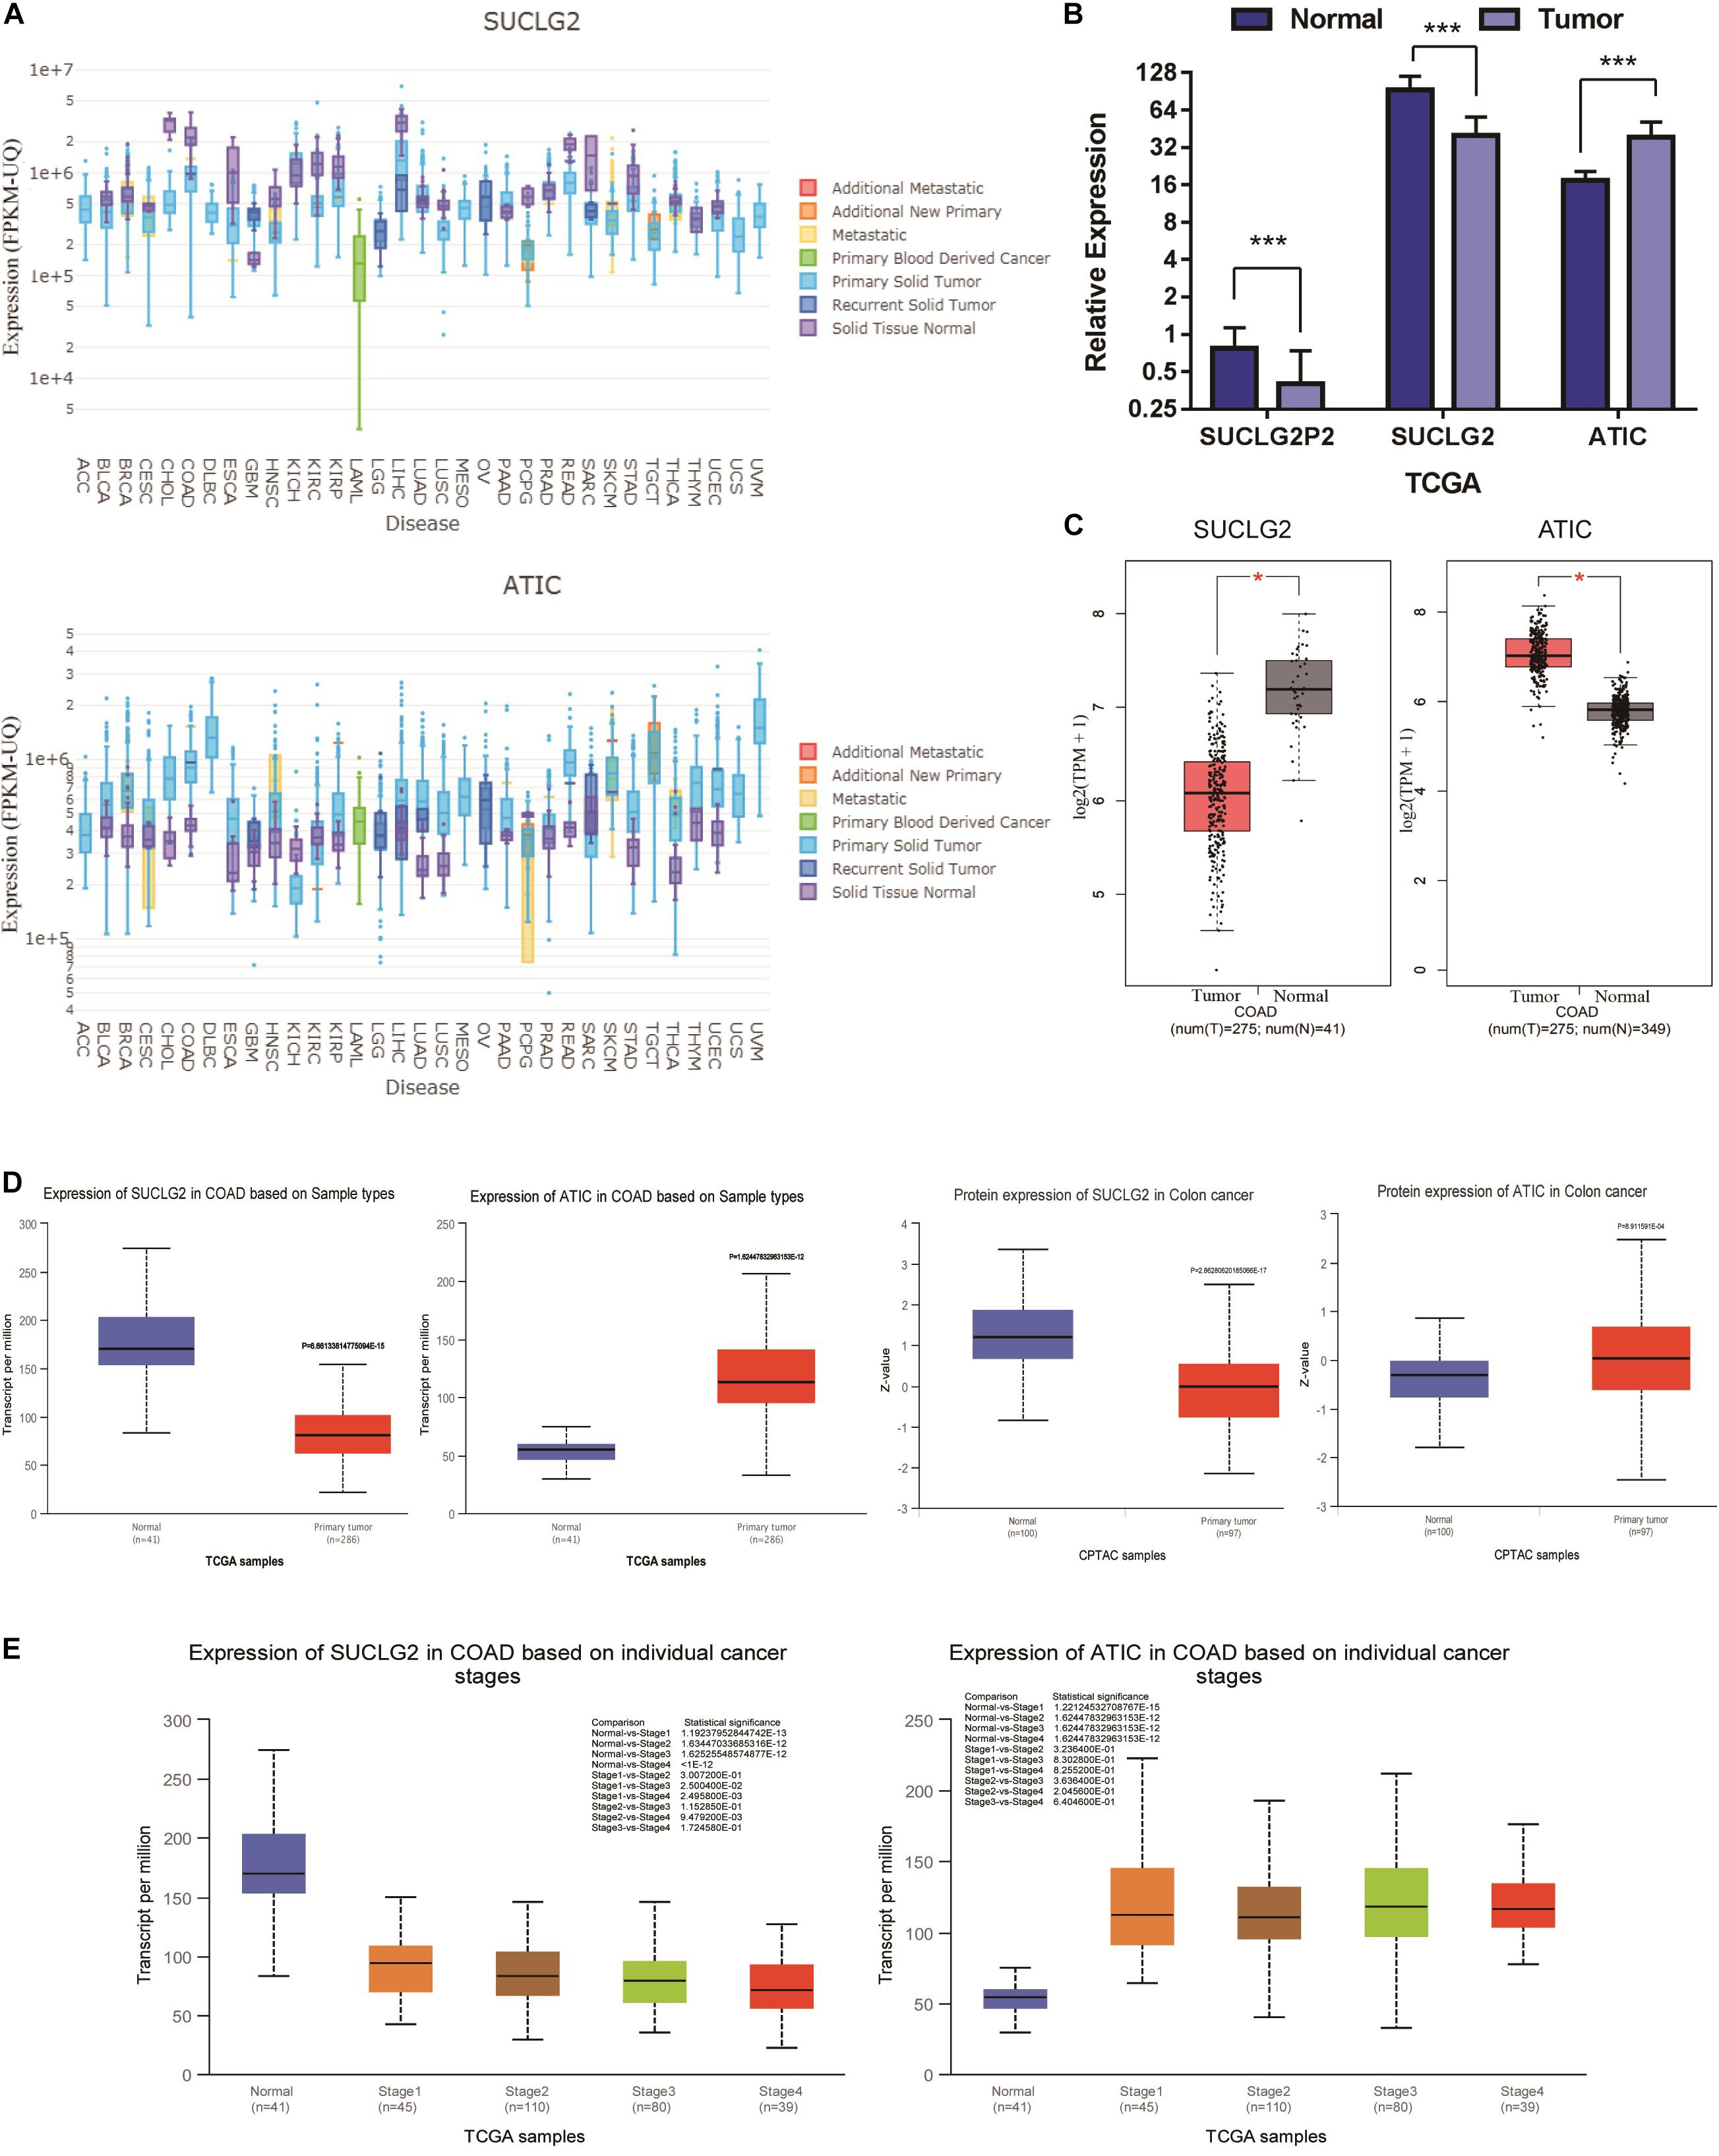
Figure 3. Bioinformational analysis of SUCLG2P2, SUCLG2 and ATIC expression from public Database. (A) The mRNA expression of SUCLG2 and ATIC in pan-cancer. (B) The mRNA expression of SUCLG2P2, SUCLG2 and ATIC in COAD, data is downloaded from TCGA. (C) The mRNA expression of SUCLG2 and ATIC in COAD from GEPIA database. (D) The mRNA and protein expression of SUCLG2 and ATIC in COAD from UACLAN database. (E) The mRNA expression of SUCLG2 and ATIC in different stage of COAD from UACLAN database. ***P < 0.001.
Survival Analyses of SUCLG2P2, SUCLG2, and ATIC From Public Database (TCGA, GEPIA, TISIDB)
Survival analyses in the TCGA downloaded data were conducted between high and low expression groups through Kaplan–Meier analysis with the log-rank test. The results showed that SUCLG2 were closely related to survival, the P value of the relationship between SUCLG2P2 expression and survival was very close to 0.05 and ATIC had no obvious correlation with prognosis (Figure 4A). The results are consistent with the analysis of the online database GEPIA (Figure 4B). In the online TISIDB database, we analyzed the relationship between ATIC and SUCLG2 and prognosis in a variety of tumors (The database does not contain the data of SUCLG2P2). High expression of SUCLG2 in ACC, COAD, KIRC, LIHC and SKCM showed a higher survival rate, while low survival rate in PAAD (Figure 4C). The survival rate of ATIC with high expression in BLCA, KIRP, LUAD, LIHC and PAAD was low (Figure 4D).
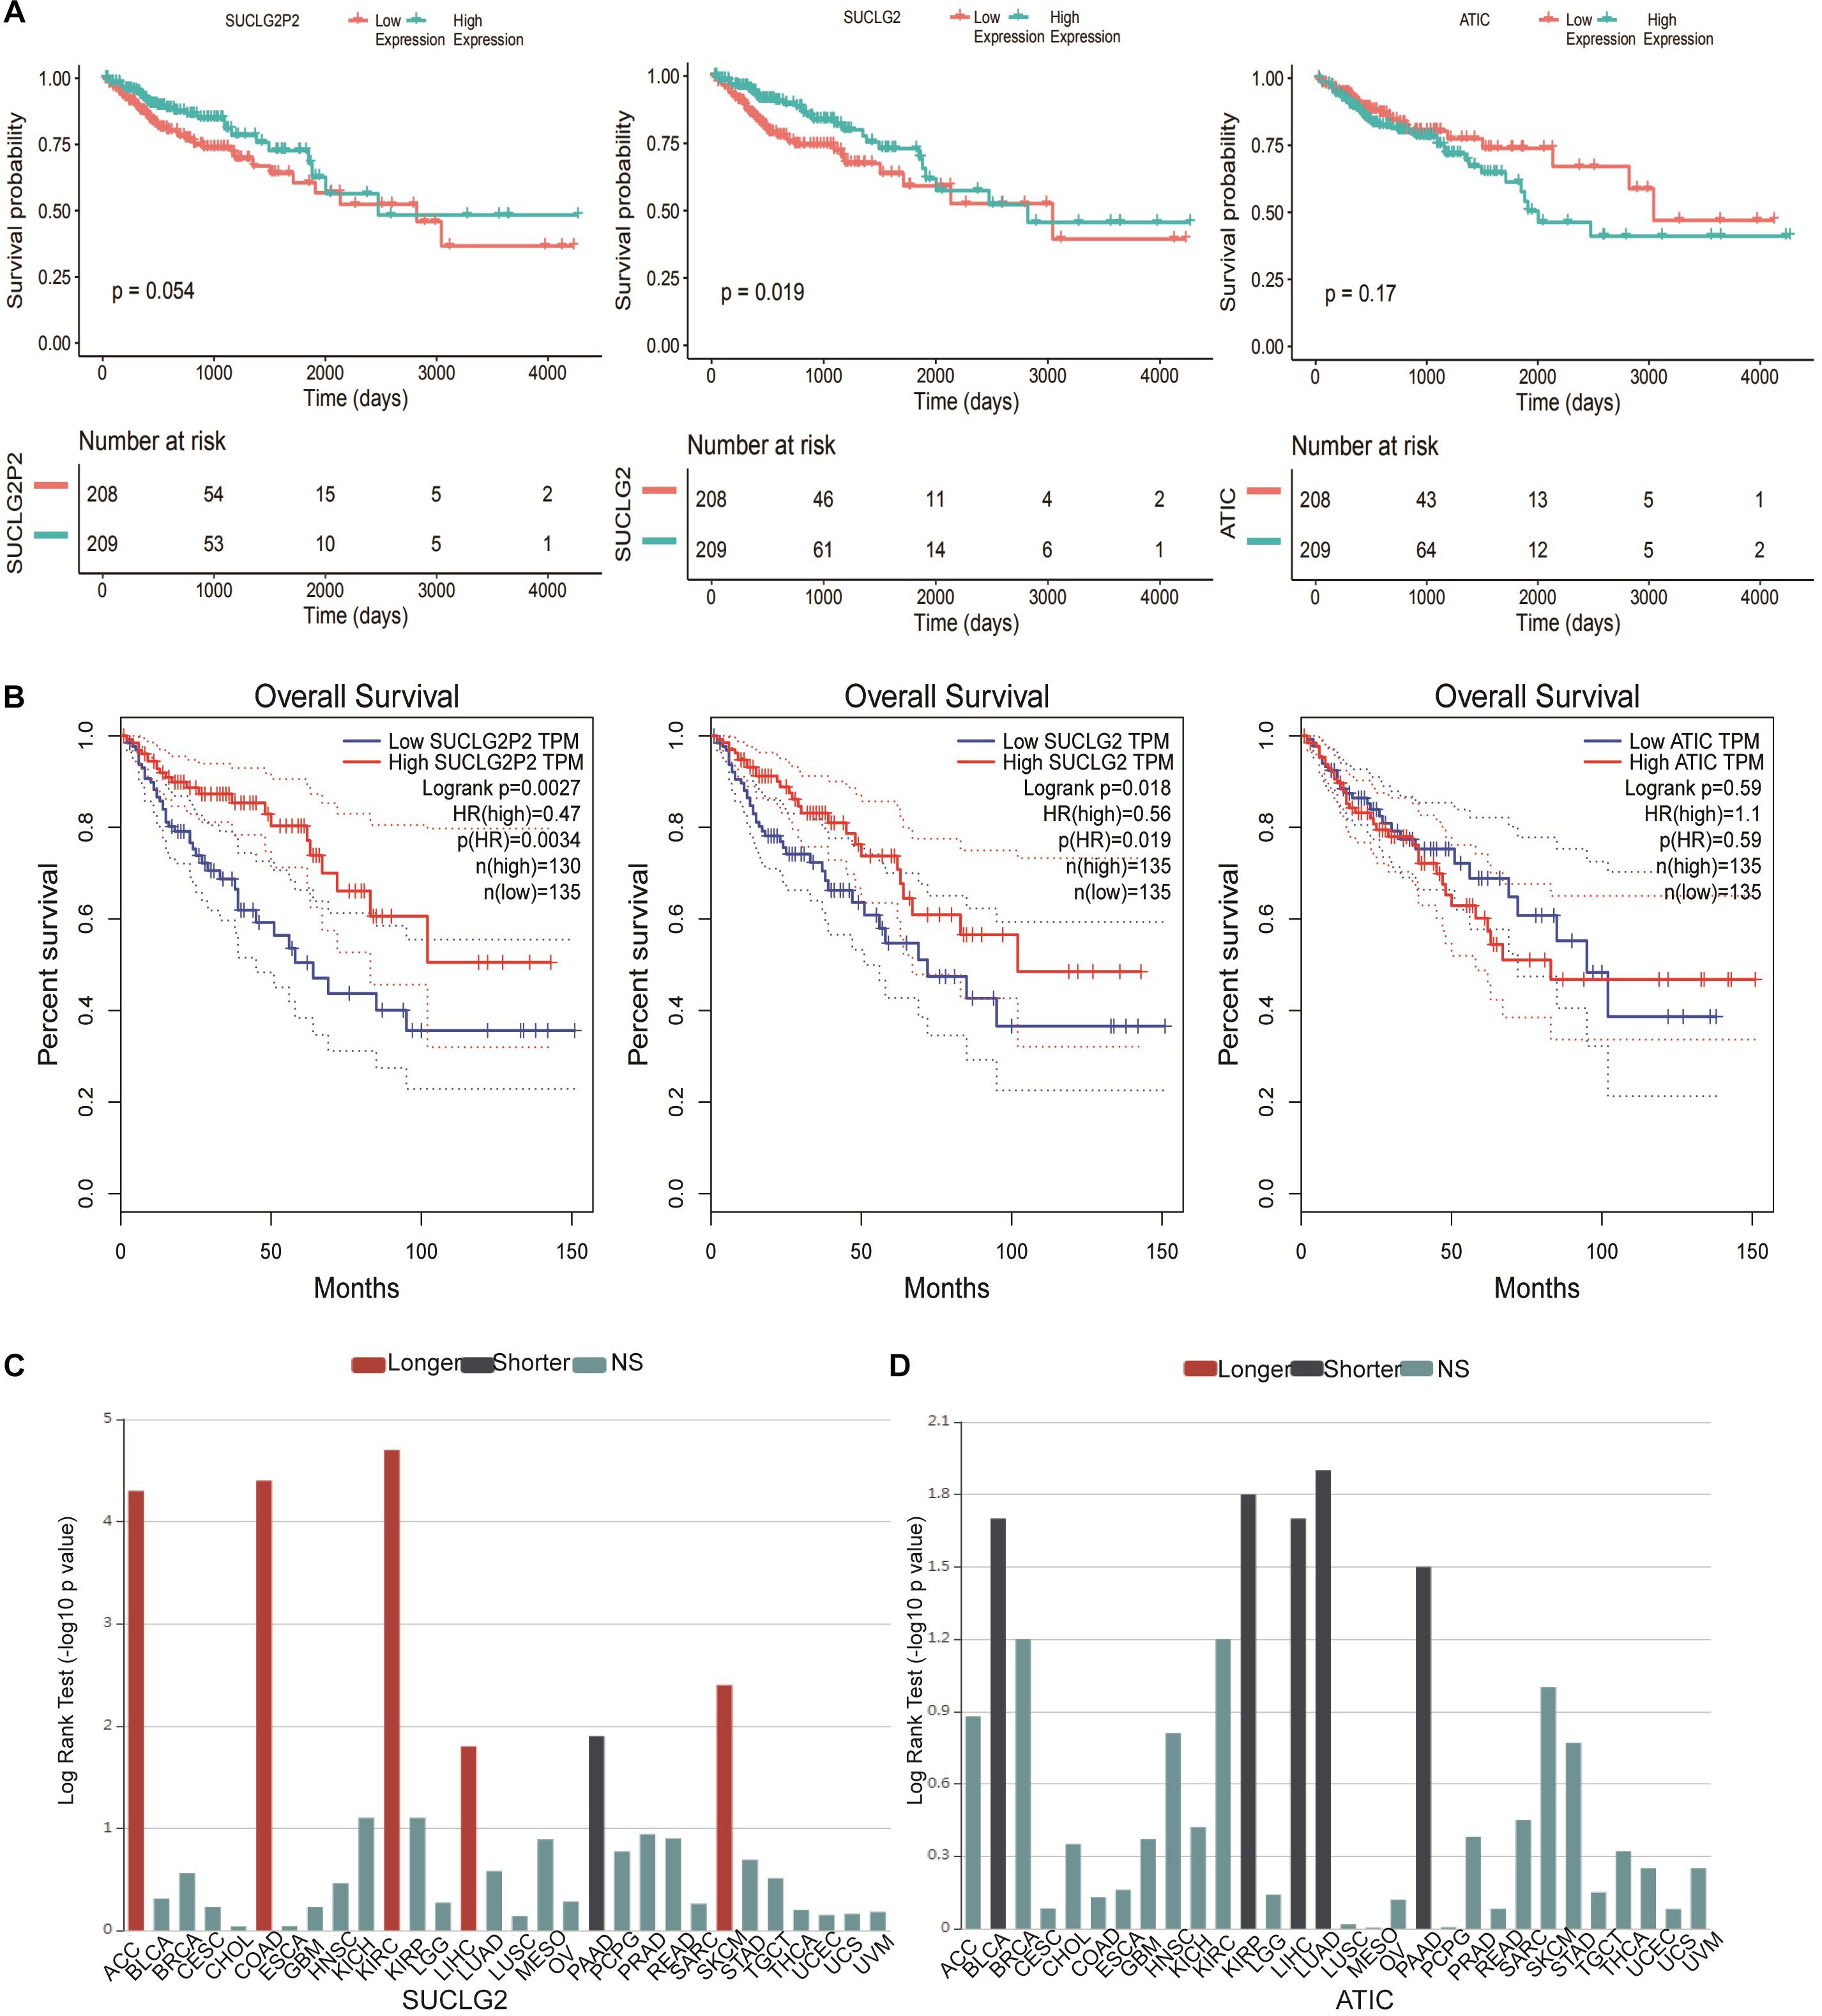
Figure 4. Survival analyses of SUCLG2P2, SUCLG2 and ATIC expression from public Database. (A) Kaplan–Meier survival curves comparing the high and low expression of three genes in COAD from TCGA downloaded data. (B) Kaplan–Meier survival curves from GEPIA database. (C) Kaplan–Meier survival curves of SUCLG2 in different types of cancer in the TISIDB database. (D) Kaplan–Meier survival curves of ATIC in different types of cancer in the TISIDB database. Longer represented longer survival time, Shorter represented shorter survival time, NS represented no statistical difference.
Correlation, Co-expression and Methylation Analysis of SUCLG2P2, SUCLG2, and ATIC Genes (GEPIA, STRING, MEXPRESS)
Correlation analysis revealed that there was a strong positive correlation among three genes in normal tissues. There was no correlation between SUCLG2P2 and ATIC, SUCLG2 and ATIC in tumor tissues (Figure 5A). Networks describing the co-expression of SUCLG2P2, SUCLG2, ATIC and similar genes can provide a deeper understanding of the associations between SUCLG2P2, SUCLG2 and ATIC and co-expression gene regulation. As shown in the network, there are interactions among the co-expressed genes of the three genes, connecting the three genes, and there may be a mutual regulatory relationship among the three genes (Figure 5B). Moreover, we take a methylation analysis to detect if the change in gene expression relating to methylation. By comparing the methylation states of the three genes, it was found that the expression of SUCLG2P2 had little relationship with methylation. SUCLG2 gene had methylation in the promoter region and also had methylation among genes, and gene expression was closely related to methylation. The methylation region of the ATIC gene was in the promoter region mainly, which was correlated with expression (Supplementary Figures 1–3). Because SUCLG2 and SUCLG2P2 have the highest correlation, and SUCLG2P2 is a pseudogene of SUCLG2 and is positively correlated. We considered the combination of SUCLG2 and SUCLG2P2 with common miRNA to achieve consistent expression and exert a tumor suppressor effect to affect the prognosis of patients. Based on the analysis results of the starBase v2.0 website, we screened out miRNA hsa-miR-588 that can bind to both SUCLG2 and SUCLG2P2 (Supplementary Figure 4).
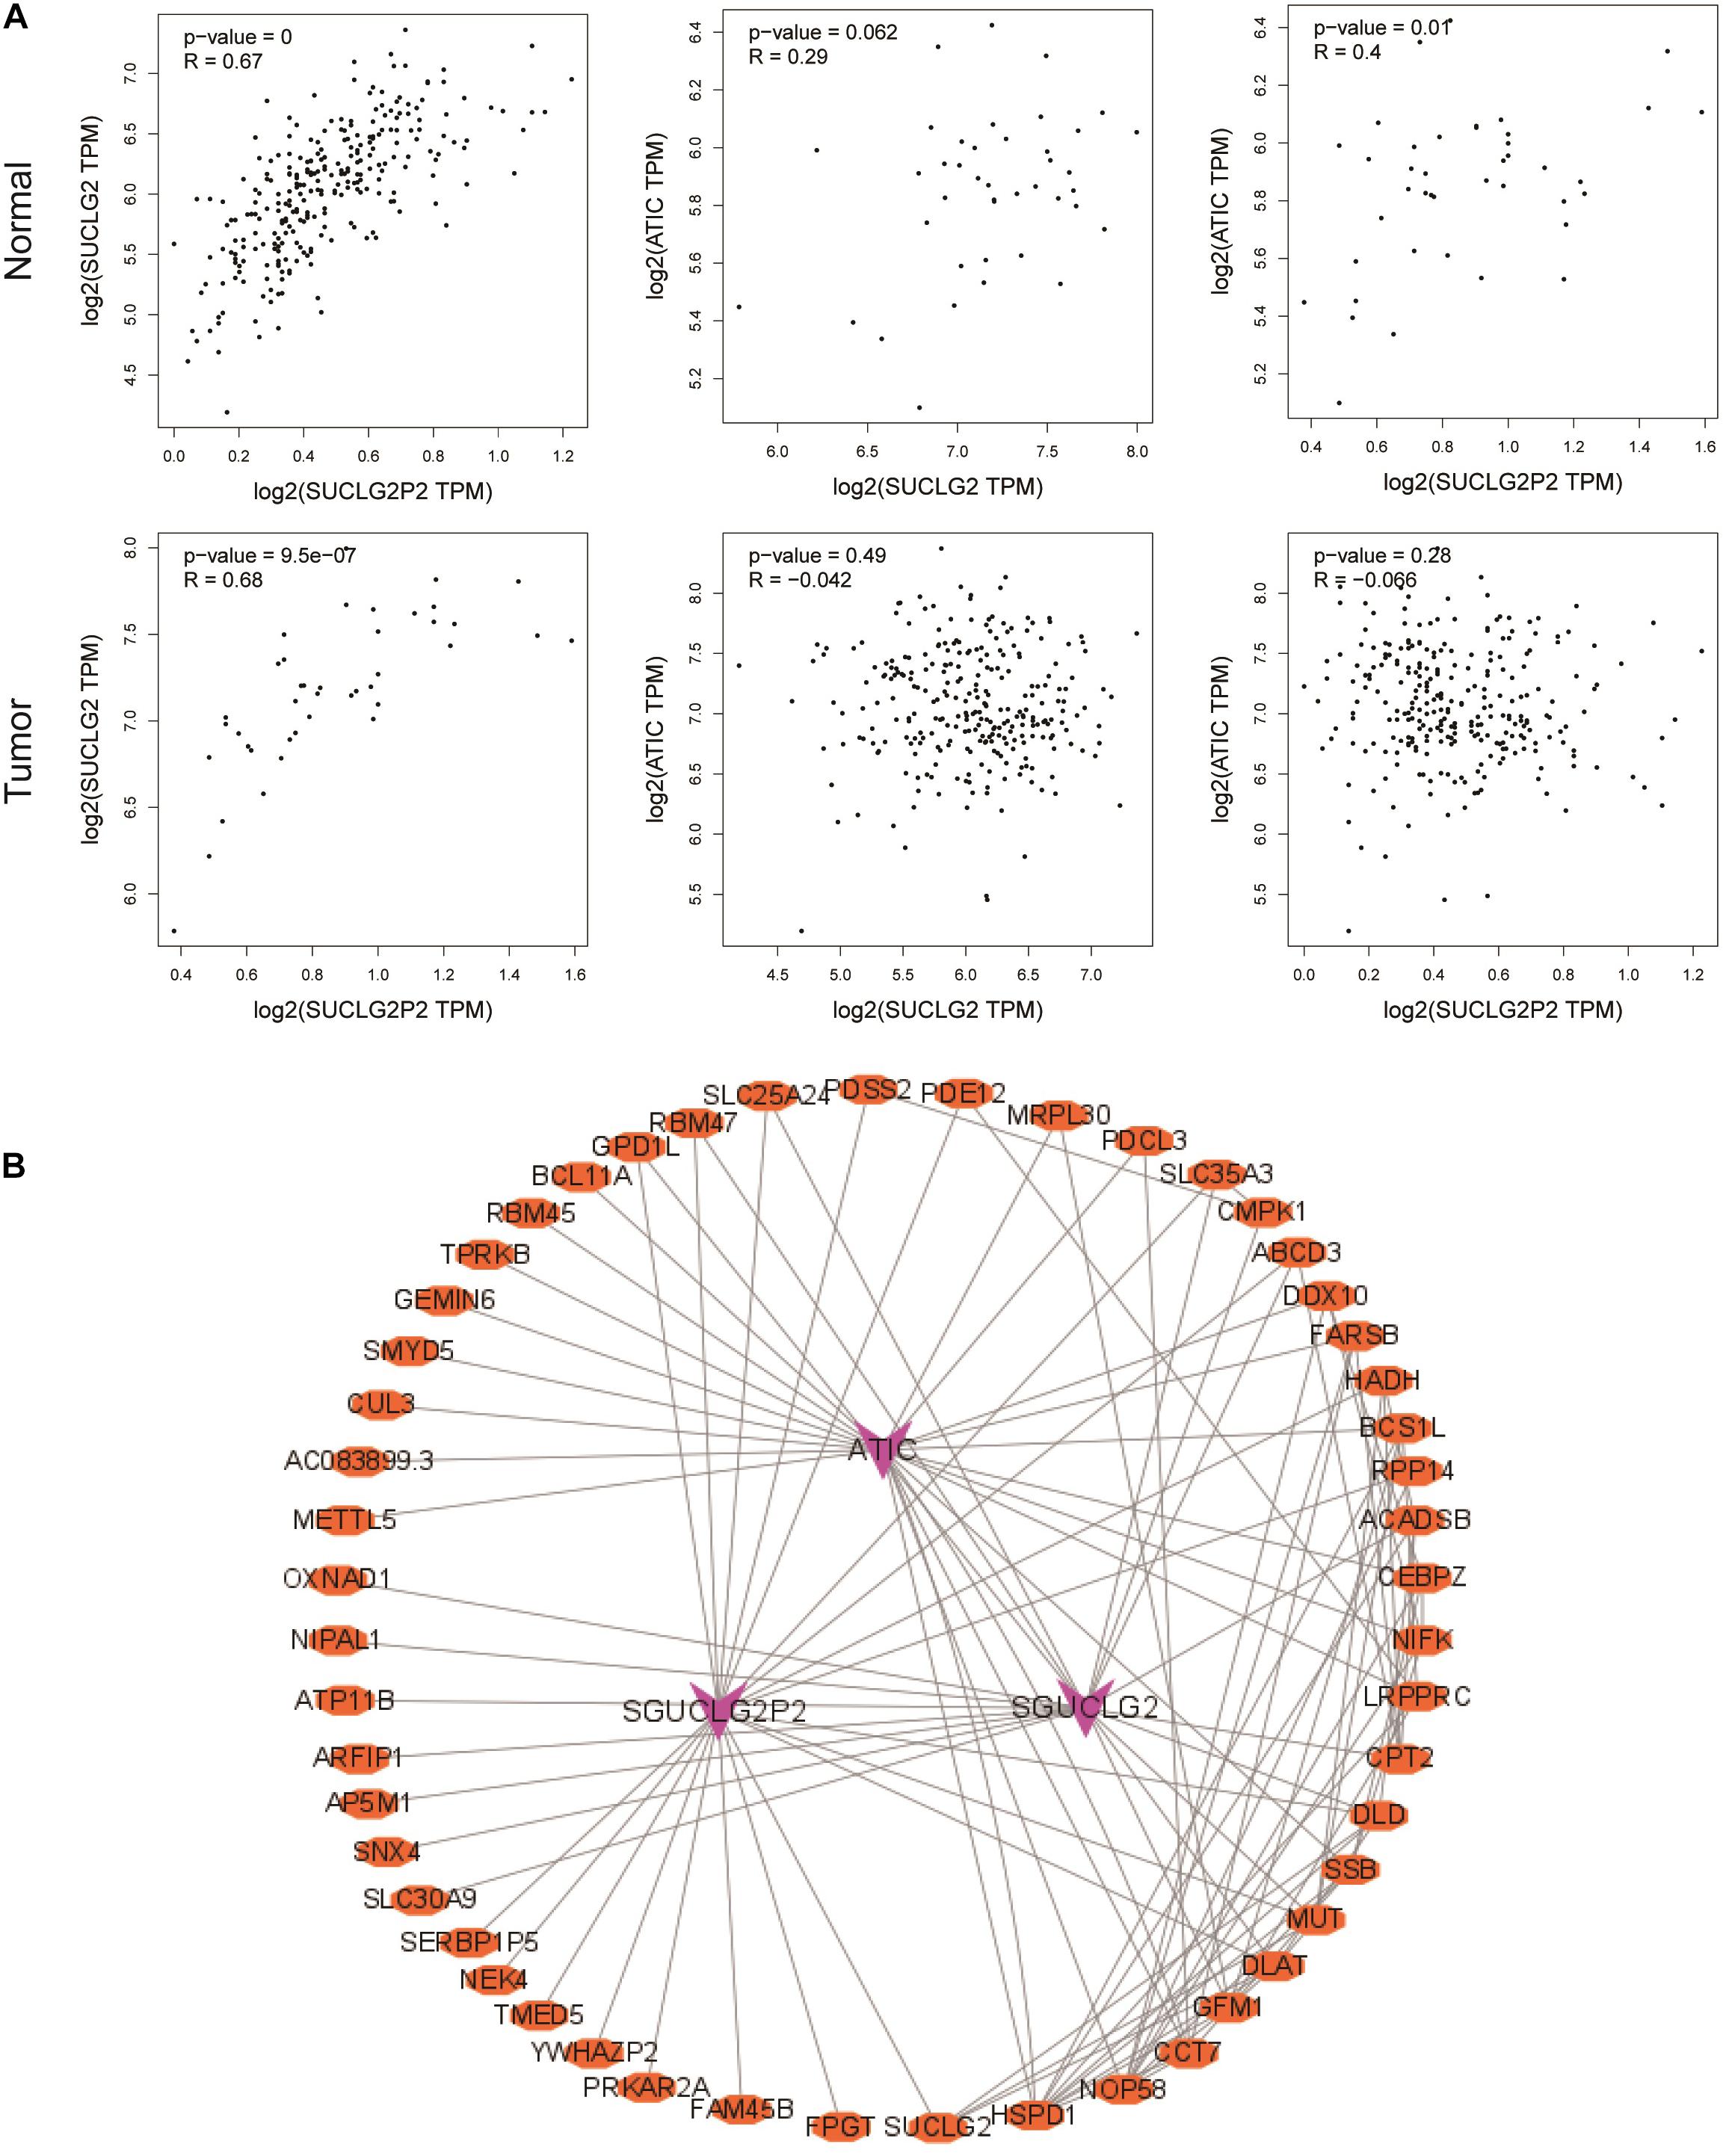
Figure 5. Correlation and co-expression analysis of SUCLG2P2, SUCLG2 and ATIC genes. (A) Pearman analysis of the correlation between SUCLG2P2, SUCLG2 and ATIC in normal tissue and tumor tissue from GEPIA database. (B) The co-expression network of three genes was constructed by Cytoscape software.
RT-qPCR Was Used to Verify the mRNA Expression of SUCLG2P2, SUCLG2, and ATIC in CRC Tissues
We also confirmed the expression levels of SUCLG2P2, SUCLG2 and ATIC mRNA in tumor and non-tumor tissues from 10 patients with CRC. The RT-qPCR analysis showed significantly lower SUCLG2P2 mRNA expression in eight out of 10 CRC specimens compared with the adjacent control mucosa tissues (P < 0.01; Figures 6A,B). SUCLG2 mRNA expression levels in all samples were lower in tumor tissues (P < 0.001; Figures 6C,D). In contrast, all the mRNA expression levels of ATIC increased in tumor tissues (P < 0.001; Figures 6E,F). It is consistent with the results of public database analysis and proves the accuracy of the expression of the three genes.
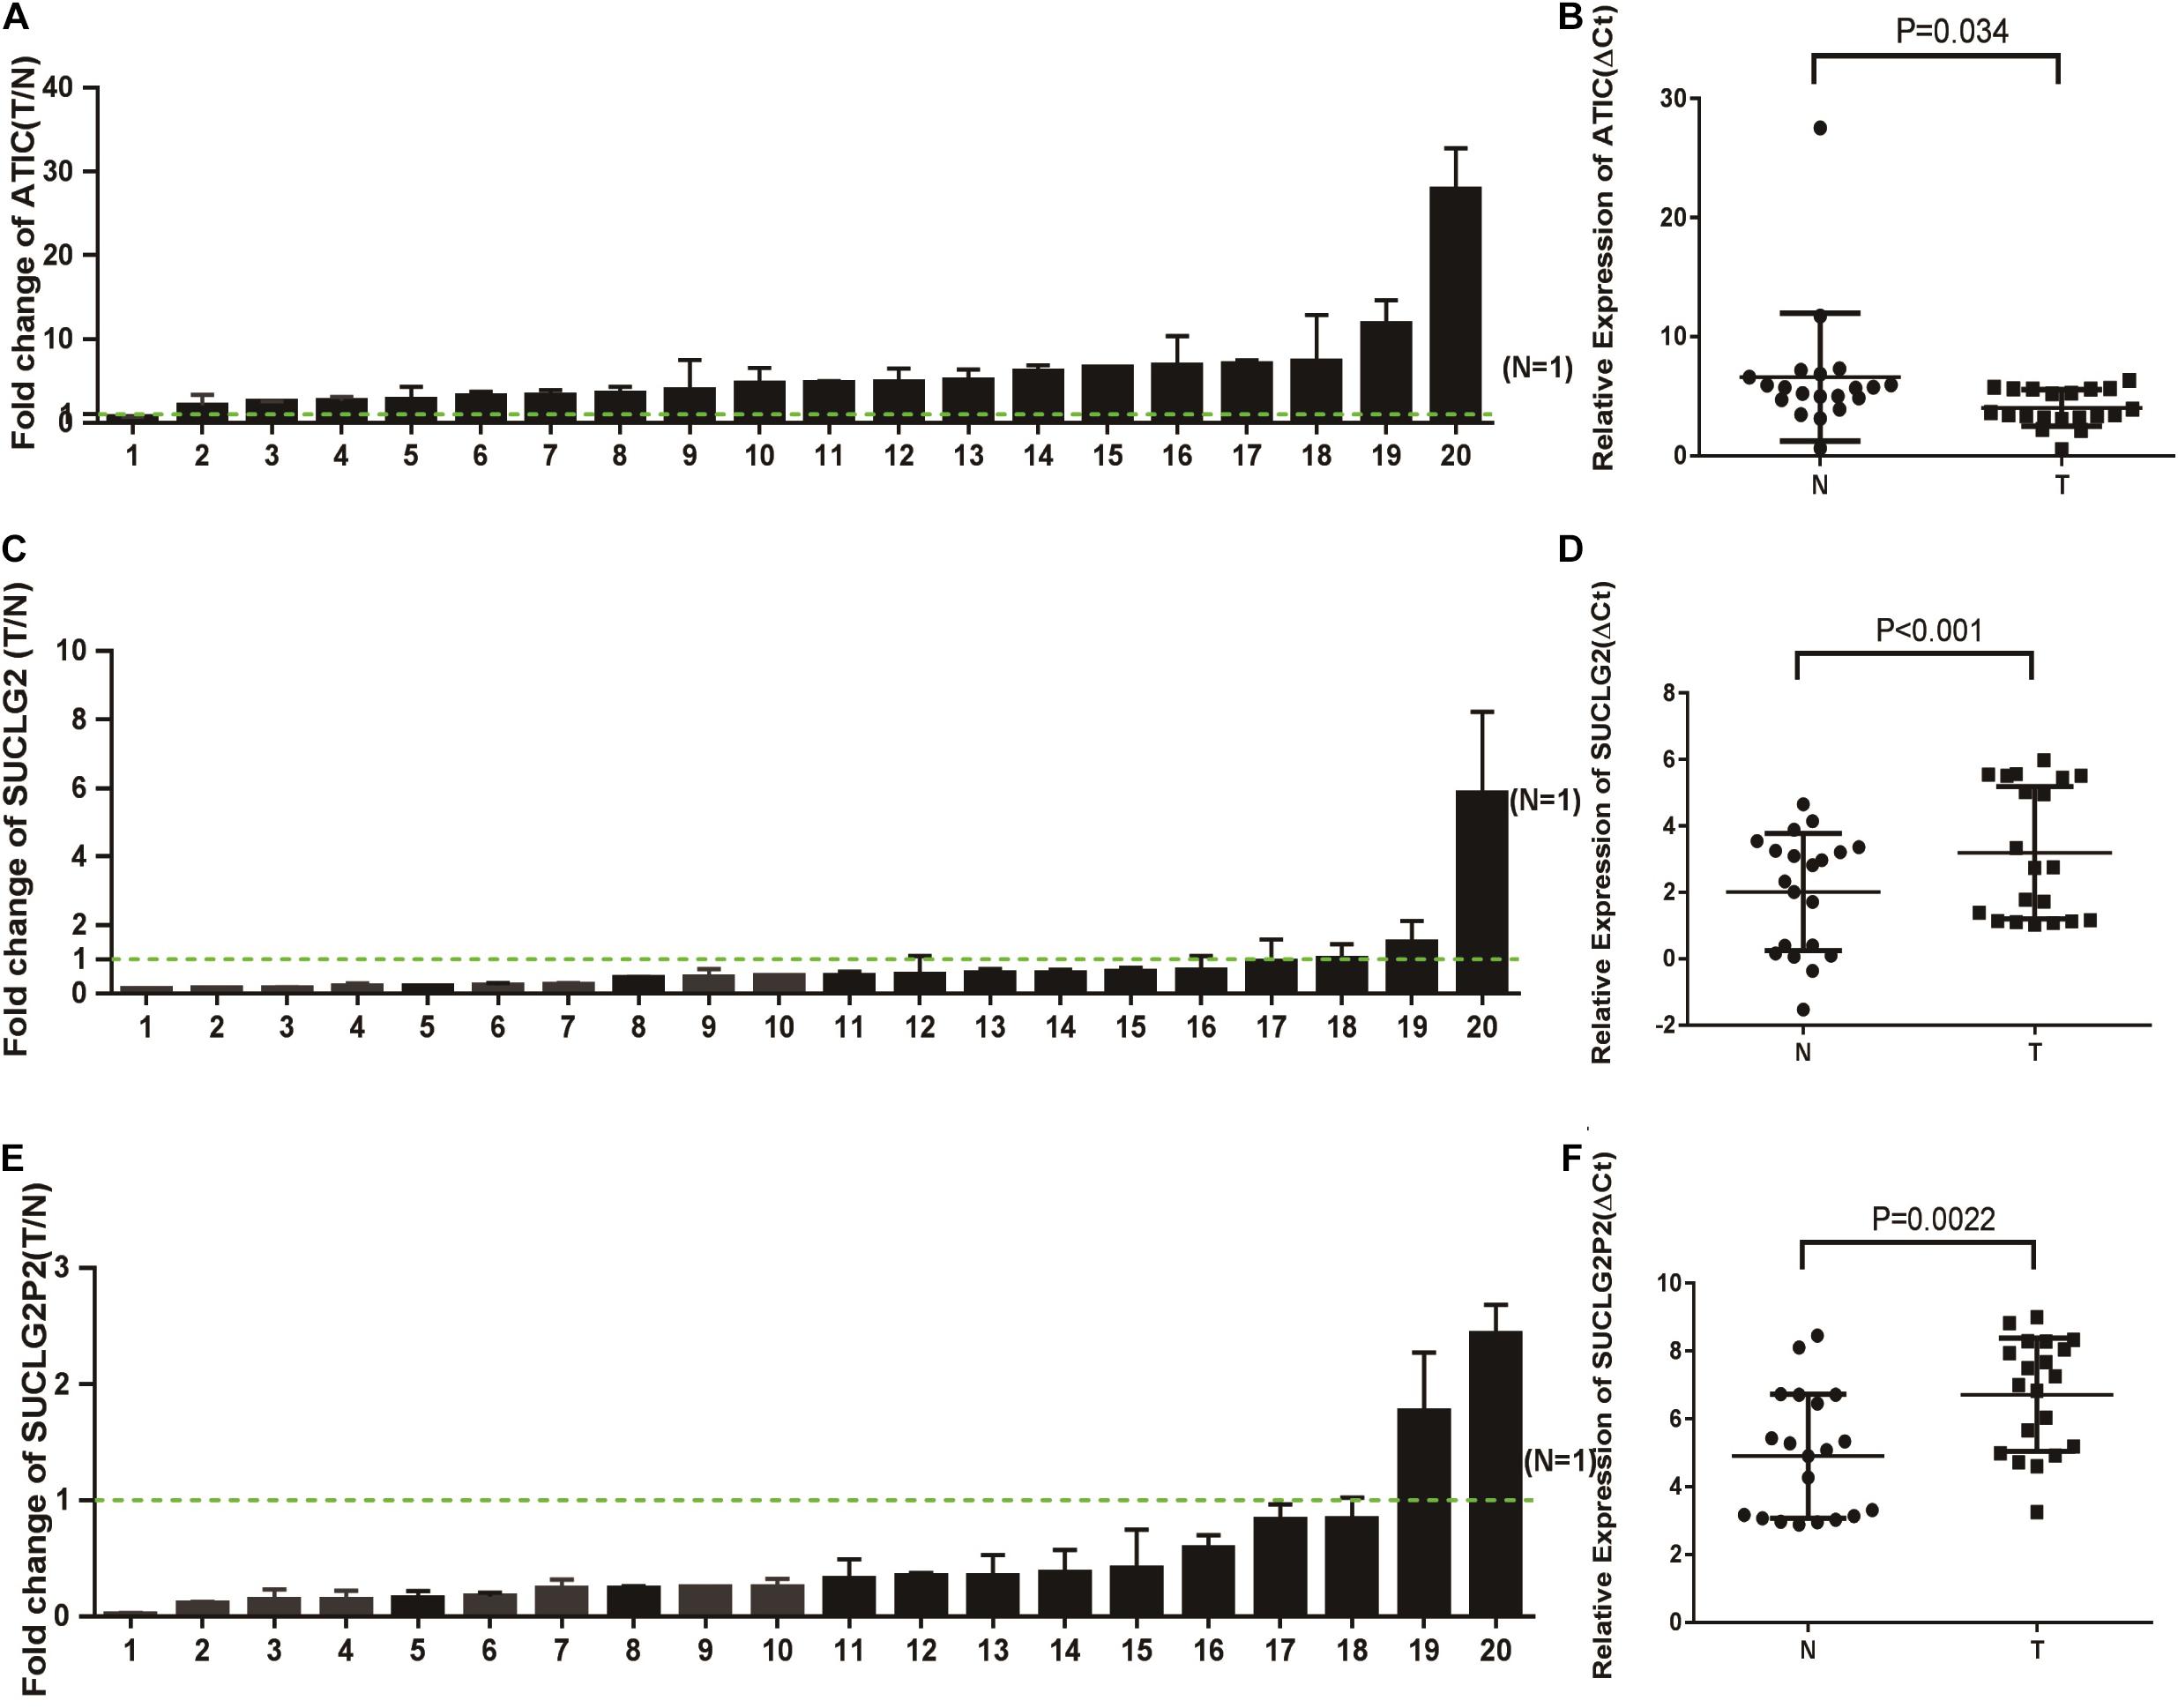
Figure 6. The mRNA expression of SUCLG2P2, SUCLG2 and ATIC in COAD tissues. (A) RT-qPCR analysis of ATIC expression in 20 paired CRC tissues (T) and adjacent normal tissues (N). ATIC expression level was normalized to GAPDH, and the results are presented as the fold change in tumor tissues relative to the matched adjacent normal tissues. Error bars indicate mean ± standard deviation (SD) of three independent experiments. Green dashed line represents T/N = 1. (B) The value of ΔCt was used to show the expression level of ATIC [ΔCt = Ct (ATIC) – Ct (GAPDH)] in the 20 paired human CRC tissues and adjacent normal tissues (P < 0.01). (C) RT-qPCR analysis of SUCLG2 expression in 20 paired CRC tissues (T) and adjacent normal tissues (N). (D) The value of ΔCt was used to show the expression level of SUCLG2 [ΔCt = Ct (SUCLG2) – Ct (GAPDH)] in the 20 paired human CRC tissues and adjacent normal tissues (P < 0.001). (E) RT-qPCR analysis of SUCLG2P2 expression in 20 paired CRC tissues (T) and adjacent normal tissues (N). (F) The value of ΔCt was used to show the expression level of SUCLG2P2 [ΔCt = Ct (SUCLG2P2) – Ct (GAPDH)] in the 20 paired human COAD tissues and adjacent normal tissues (P < 0.001).
Discussion
Cancer metabolism has been a hot topic in cancer progression and clinical treatment. Before, it was thought that cancer cells preferred aerobic glycolysis to the TCA cycle for faster energy gain, known as the Warburg effect. In recent years, increasing studies have shown that the TCA cycle also plays an important role in tumors. Because of the Warburg effect, the energy supply of tumor cells is reduced through mitochondria. But, out of their need for rapid proliferation, tumor cells increased their demand for biosynthetic precursors and nicotinamide adenine dinucleotide phosphate (NADPH), which came from the TCA cycle. The group containing one carbon atom is named one carbon group or one carbon unit, also known as methyl groups, which comes from glycine, histidine, serine, tryptophan, methionine, etc. Metabolism related to the generation and transfer of one carbon unit is called one carbon unit metabolism. The one-carbon metabolism comprises two cycles of folic acid and methionine, thus making cells produce a carbon unit that can synthesize important anabolic precursors and methylation reactions (Ducker and Rabinowitz, 2017). One carbon unit involved the synthesis of nucleotides, S-adenosylmethionine (SAM), glutathione, and other cellular processes that are important for the rapid proliferation of tumor cells (Newman and Maddocks, 2017). By reducing folic acid in food or using anti-folic acid preparations, cells cannot get enough carbon units, the synthesis of purine, pyrimidine and other nucleotides is blocked, DNA and RNA synthesis is impaired, and the growth and proliferation of tumor cells are inhibited (Shuvalov et al., 2017; Fernandez-Villa et al., 2019). Both TCA and carbon metabolism play an important role in tumors.
We used the TCGA database to analyze genes differentially expressed in the TCA cycle and one carbon metabolism pathway in colon cancer, and then performed univariate and multivariate Cox regression analysis on these genes. Univariate analysis showed that SUCLG2P2 and SUCLG2 were correlated with survival, while no correlation was found in multivariate analysis. The possible reason is that SUCLG2P2 and SUCLG2 are correlated with survival, and there is a collinear relationship between them. Thus, in the univariate analysis, there may be significant differences between the factors SUCLG2P2 and SUCLG2, but SUCLG2P2 and SUCLG2 may not be the factors directly affecting survival. Multivariate analysis showed that SUCLG1, ACLY, ATIC and ACO2 were associated with survival, while univariate analysis showed no correlation with survival. The possible reason is that SUCLG1, ACLY, ATIC and ACO2 may be associated with other confounding factors. In univariate analysis, the actual effect of this factor is masked by the effect of other confounding factors. After eliminating the influence of other factors through multivariate analysis, SUCLG1, ACLY, ATIC and ACO2 are considered to be independent effect factors on the outcome event.
We made different combinations of the six variables of clinical data and the six screened genes to select an optimal model for prognosis evaluation (Model 1, AUC = 0.82505). Model 1 includes three genes besides clinical data. The three genes are SUCLG2P2, SUCLG2 and ATIC. Although other genes are also associated with prognosis, we finally chose SUCLG2P2, SUCLG2 and ATIC to build model 1 because we did various combinations and found that only the ROC curve where these three variables were combined had the highest AUC value. We analyzed the expressions of these three genes in different tumors. The expression of SUCLG2 was low in most tumors, especially in colon cancer. The expression of SUCLG2P2 was also low in colon cancer, but the expression of ATIC was high in most tumors, including colon cancer. We used 20 pairs of COAD tissue and adjacent tissue samples to verify the expression of three genes, which was consistent with the data analysis results. The relationship between the expression of three genes and survival was also analyzed. We found that patients with high expression of SUCLG2P2 and SUCLG2 had a longer survival time, while patients with high expression of ATIC had a shorter survival time. These results state that the three genes may play an important role in the occurrence and development of colon cancer. Through the correlation analysis between the three genes and clinical data, we found that only SUCLG2P2 was related to clinicopathological parameter stage and distant metastasis, indicating that SUCLG2P2 may have a more important function in colon cancer.
SUCLG2 is a protein coding gene that is located on chromosome 3 and has many transcripts. This gene encodes a GTP-specific beta subunit of succinyl-CoA synthetase. Succinyl-CoA synthetase catalyzes the reversible reaction involving the formation of succinyl-CoA and succinate. GTP-specific succinyl-CoA synthetase functions in the TCA, coupling the hydrolysis of succinyl-CoA to the synthesis of GTP and thus represents the only step of substrate-level phosphorylation in the TCA (Huang and Fraser, 2016). SUCLG2 plays an important role not only in neurometabolic disorders and Alzheimer’s disease (Ramirez et al., 2014; Chinopoulos et al., 2019), but also in tumors (Lin et al., 2020). It has been reported that rs35494829 of the SUCLG2 gene is associated with colon cancer (Cho et al., 2020). Besides, it has been reported that the interaction between tumor and microenvironment is inhibited by metformin through SUCLG2 (Hart et al., 2019). The results of correlation analysis between SUCLG2P2 and SUCLG2 showed that there was a significant correlation between them, and both of them were downregulated in colon cancer, which also had a high degree of homology, indicating that they may have similar mechanisms in promoting the occurrence of colon cancer, which is our further research direction. SUCLG2P2 is a pseudogene located on chromosome 12. The transcript is 1,296 bp long and has one exon, which is highly homologous with SUCLG2. There are many SNPs on the gene, and there are no other reports on the expression function of the gene. Combined with our experimental results, the low expression of SUCLG2P2 in many tumors, especially low expression in colon cancer, could be used as a diagnostic marker. SUCLG2P2 is highly homologous with SUCLG2, and is associated with colon cancer stage, metastasis and survival. It may also play an important role in the development of colon cancer. ATIC gene encodes a bifunctional protein that catalyzes the last two steps of the de novo purine biosynthetic pathway. It is a bifunctional enzyme that catalyzes the last two steps of purine biosynthesis (Asby et al., 2015). It is a sensitive target for chemotherapy (Liu et al., 2018). It has also been reported that it promotes the proliferation and migration of hepatocellular carcinoma by regulating the AMPK/mTOR/S6K1 signaling pathway (Li et al., 2017). Correlation analysis showed that ATIC had no correlation with SUCLG2P2 and SUCLG2 in tumor tissues, but had a correlation with normal tissues. It suggested that there may be a regulatory role between them under normal physiological conditions, yet, they are blocked in tumors. Because SUCLG2 and SUCLG2P2 have the highest correlation, and SUCLG2P2 is a pseudogene of SUCLG2, and is positively correlated. We considered the combination of SUCLG2 and SUCLG2P2 with common miRNA to achieve consistent expression and exert a tumor suppressor effect to affect the prognosis of patients. We screened out miRNA hsa-miR-588 that can bind to both SUCLG2 and SUCLG2P2. hsa-miR-588 is a tumor suppressor gene (Qian et al., 1993; Yu et al., 1993; Liu R. et al., 2020; Liu Z. et al., 2020). When the expression of SUCLG2P2 decreases in colon cancer, the combined hsa-miR-588 decreases, which increases the binding of hsa-miR-588 to SUCLG2, which in turn leads to an increase in SUCLG2 degradation and a decrease in SUCLG2 expression. In colon cancer, the expressions of SUCLG2 and SUCLG2P2 are reduced, the competitive binding hsa-miR-588 is reduced, hsa-miR-588 is increased, and hsa-miR-588 exerts a tumor suppressor effect. Thus, SUCLG2 and SUCLG2P2 may affect the prognosis of patients through hsa-miR-588. We also analyzed the relationship between the expression and methylation of the three genes. There was no significant methylation in SUCLG2P2, but there was significant methylation in both SUCLG2 and ATIC. The decreased expression of SUCLG2P2 may be regulated by other factors.
Conclusion
In conclusion, the expressions of SUCLG2P2, SUCLG2 and ATIC in colon cancer and normal tissues were different, and they were related to survival. The model constructed by these three genes and clinical data has a good predictive ability for predicting the survival of patients. Our results suggest that SUCLG2P2, SUCLG2 and ATIC may be biomarkers or therapeutic targets for COAD. Yet, future experiments are necessary to unveil the molecular basis of SUCLG2P2, SUCLG2 and ATIC functions in COAD.
Data Availability Statement
The original contributions presented in the study are included in the article/Supplementary Material, further inquiries can be directed to the corresponding author.
Ethics Statement
The studies involving human participants were reviewed and approved by the Ethics Committee of Xinxiang Medical University. The patients provided their written informed consent to participate in this study.
Author Contributions
JZ and ZZ designed the work and wrote this manuscript. HZ and WG performed the experiments. QL and DZ collected the samples. WS and RY modified the manuscript. All authors contributed to the article and approved the submitted version.
Funding
This work is supported by National Natural Science Foundation of China (grant nos. 81802470, 31800658, 81702891 and U1804173), the Xinxiang Medical College research funding (grant no. XYBSKYZZ201632), the Department of Science and Technology of Henan Province (grant nos. 182102310336 and 182300410381), Joint construction project of Henan Medical Science and technology research plan (no. LHGJ20190452), and Natural Science Foundation of Henan Province (no. 202300410326).
Conflict of Interest
The authors declare that the research was conducted in the absence of any commercial or financial relationships that could be construed as a potential conflict of interest.
Publisher’s Note
All claims expressed in this article are solely those of the authors and do not necessarily represent those of their affiliated organizations, or those of the publisher, the editors and the reviewers. Any product that may be evaluated in this article, or claim that may be made by its manufacturer, is not guaranteed or endorsed by the publisher.
Supplementary Material
The Supplementary Material for this article can be found online at: https://www.frontiersin.org/articles/10.3389/fgene.2021.647152/full#supplementary-material
Supplementary Figure 1 | Methylation analysis of SUCLG2P2 gene from MEXPRESS database.
Supplementary Figure 2 | Methylation analysis of SUCLG2 gene from MEXPRESS database.
Supplementary Figure 3 | Methylation analysis of ATIC gene from MEXPRESS database.
Supplementary Figure 4 | Prediction of miRNA binding sites of SUCLG2 and SUCLG2P2. (A) Schematic diagram of binding sites between SUCLG2 and Hsa-miRNA-588 in TargetScanHuman Database. (B) Schematic diagram of binding sites between SUCLG2 and Hsa-miRNA-588 in starBase v2.0 Database. (C) Schematic diagram of binding sites between SUCLG2P2 and Hsa-miRNA-588 in starBase v2.0 Database.
Footnotes
- ^ https://portal.gdc.cancer.gov/
- ^ http://www.gsea-msigdb.org/gsea/downloads.jsp
- ^ http://www.empowerstats.com
- ^ http://driverdb.tms.cmu.edu.tw/
- ^ http://gepia.cancer-pku.cn/
- ^ http://ualcan.path.uab.edu/
- ^ http://cis.hku.hk/TISIDB/
- ^ http://www.R-project.org
References
Anderson, N. M., Mucka, P., Kern, J. G., and Feng, H. (2018). The emerging role and targetability of the TCA cycle in cancer metabolism. Protein Cell. 9, 216–237. doi: 10.1007/s13238-017-0451-1
Asby, D. J., Cuda, F., Beyaert, M., Houghton, F. D., Cagampang, F. R., and Tavassoli, A. (2015). AMPK Activation via Modulation of De Novo Purine Biosynthesis with an Inhibitor of ATIC Homodimerization. Chem. Biol. 22, 838–848. doi: 10.1016/j.chembiol.2015.06.008
Cappel, D. A., Deja, S., Duarte, J. A. G., Kucejova, B., Inigo, M., Fletcher, J. A., et al. (2019). Pyruvate-Carboxylase-Mediated Anaplerosis Promotes Antioxidant Capacity by Sustaining TCA Cycle and Redox Metabolism in Liver. Cell Metab. 29:e1298. doi: 10.1016/j.cmet.2019.03.014
Chandrashekar, D. S., Bashel, B., Balasubramanya, S. A. H., Creighton, C. J., Ponce-Rodriguez, I., Chakravarthi, B., et al. (2017). UALCAN: a Portal for Facilitating Tumor Subgroup Gene Expression and Survival Analyses. Neoplasia 19, 649–658. doi: 10.1016/j.neo.2017.05.002
Che-Othman, M. H., Jacoby, R. P., Millar, A. H., and Taylor, N. L. (2020). Wheat mitochondrial respiration shifts from the tricarboxylic acid cycle to the GABA shunt under salt stress. N. Phytol. 225, 1166–1180. doi: 10.1111/nph.15713
Chinopoulos, C., Batzios, S., van den Heuvel, L. P., Rodenburg, R., Smeets, R., Waterham, H. R., et al. (2019). Mutated SUCLG1 causes mislocalization of SUCLG2 protein, morphological alterations of mitochondria and an early-onset severe neurometabolic disorder. Mol. Genet. Metab. 126, 43–52.
Cho, S., Song, N., Choi, J. Y., and Shin, A. (2020). Effect of Citric Acid Cycle Genetic Variants and Their Interactions with Obesity, Physical Activity and Energy Intake on the Risk of Colorectal Cancer: results from a Nested Case-Control Study in the UK Biobank. Cancers 12:2939.
Ducker, G. S., and Rabinowitz, J. D. (2017). One-Carbon Metabolism in Health and Disease. Cell Metab. 25, 27–42. doi: 10.1016/j.cmet.2016.08.009
Fernandez-Villa, D., Aguilar, M. R., and Rojo, L. (2019). Folic Acid Antagonists: antimicrobial and Immunomodulating Mechanisms and Applications. Int. J. Mol. Sci. 20:4996.
Hart, P. C., Kenny, H. A., Grassl, N., Watters, K. M., Litchfield, L. M., Coscia, F., et al. (2019). Mesothelial Cell HIF1alpha Expression Is Metabolically Downregulated by Metformin to Prevent Oncogenic Tumor-Stromal Crosstalk. Cell Rep. 29:e4086. doi: 10.1016/j.celrep.2019.11.079
Huang, J., and Fraser, M. E. (2016). Structural basis for the binding of succinate to succinyl-CoA synthetase. Acta Crystallogr. D Struct. Biol. 72, 912–921. doi: 10.1107/S2059798316010044
Li, M., Jin, C., Xu, M., Zhou, L., Li, D., and Yin, Y. (2017). Bifunctional enzyme ATIC promotes propagation of hepatocellular carcinoma by regulating AMPK-mTOR-S6 K1 signaling. Cell Commun. Signal. 15:52.
Lin, S. R., Wen, Y. C., Yeh, H. L., Jiang, K. C., Chen, W. H., Mokgautsi, N., et al. (2020). EGFR-upregulated LIFR promotes SUCLG2-dependent castration resistance and neuroendocrine differentiation of prostate cancer. Oncogene 39, 6757–6775. doi: 10.1038/s41388-020-01468-9
Liu, R., Ju, C., Zhang, F., Tang, X., Yan, J., Sun, J., et al. (2020). LncRNA GSEC promotes the proliferation, migration and invasion by sponging miR-588/EIF5A2 axis in osteosarcoma. Biochem. Biophys. Res. Commun. 532, 300–307. doi: 10.1016/j.bbrc.2020.08.056
Liu, S. H., Shen, P. C., Chen, C. Y., Hsu, A. N., Cho, Y. C., Lai, Y. L., et al. (2020). DriverDBv3: a multi-omics database for cancer driver gene research. Nucl. Acids Res. 48, D863–D870.
Liu, X., Paila, U. D., Teraoka, S. N., Wright, J. A., Huang, X., Quinlan, A. R., et al. (2018). Identification of ATIC as a Novel Target for Chemoradiosensitization. Int. J. Radiat. Oncol. Biol. Phys. 100, 162–173. doi: 10.1016/j.ijrobp.2017.08.033
Liu, Z., Mo, H., Sun, L., Wang, L., Chen, T., Yao, B., et al. (2020). Long noncoding RNA PICSAR/miR-588/EIF6 axis regulates tumorigenesis of hepatocellular carcinoma by activating PI3K/AKT/mTOR signaling pathway. Cancer Sci. 111, 4118–4128. doi: 10.1111/cas.14631
May, J. L., Kouri, F. M., Hurley, L. A., Liu, J., Tommasini-Ghelfi, S., Ji, Y., et al. (2019). IDH3alpha regulates one-carbon metabolism in glioblastoma. Sci. Adv. 5:eaat0456. doi: 10.1126/sciadv.aat0456
Newman, A. C., and Maddocks, O. D. K. (2017). One-carbon metabolism in cancer. Br. J. Cancer 116, 1499–1504. doi: 10.1038/bjc.2017.118
Nie, H., Ju, H., Fan, J., Shi, X., Cheng, Y., Cang, X., et al. (2020). O-GlcNAcylation of PGK1 coordinates glycolysis and TCA cycle to promote tumor growth. Nat. Commun. 11:36. doi: 10.1038/s41467-019-13601-8
Phan, L. M., Yeung, S. C., and Lee, M. H. (2014). Cancer metabolic reprogramming: importance, main features, and potentials for precise targeted anti-cancer therapies. Cancer Biol. Med. 11, 1–19. doi: 10.7497/j.issn.2095-3941.2014.01.001
Qian, L., Lin, L., Du, Y., Hao, X., Zhao, Y., and Liu, X. (2016). MicroRNA-588 suppresses tumor cell migration and invasion by targeting GRN in lung squamous cell carcinoma. Mol. Med. Rep. 14, 3021–3028. doi: 10.3892/mmr.2016.5643
Ramirez, A., van der Flier, W. M., Herold, C., Ramonet, D., Heilmann, S., Lewczuk, P., et al. (2014). SUCLG2 identified as both a determinator of CSF Abeta1-42 levels and an attenuator of cognitive decline in Alzheimer’s disease. Hum. Mol. Genet. 23, 6644–6658. doi: 10.1093/hmg/ddu372
Rizzo, A., Napoli, A., Roggiani, F., Tomassetti, A., Bagnoli, M., and Mezzanzanica, D. (2018). One-Carbon Metabolism: biological Players in Epithelial Ovarian Cancer. Int. J. Mol. Sci. 19:2092. doi: 10.3390/ijms19072092
Ru, B., Wong, C. N., Tong, Y., Zhong, J. Y., Zhong, S. S. W., Wu, W. C., et al. (2019). TISIDB: an integrated repository portal for tumor-immune system interactions. Bioinformatics 35, 4200–4202. doi: 10.1093/bioinformatics/btz210
Shannon, P., Markiel, A., Ozier, O., Baliga, N. S., Wang, J. T., Ramage, D., et al. (2003). Cytoscape: a software environment for integrated models of biomolecular interaction networks. Genome Res. 13, 2498–2504. doi: 10.1101/gr.1239303
Shuvalov, O., Petukhov, A., Daks, A., Fedorova, O., Vasileva, E., and Barlev, N. A. (2017). One-carbon metabolism and nucleotide biosynthesis as attractive targets for anticancer therapy. Oncotarget 8, 23955–23977. doi: 10.18632/oncotarget.15053
Siegel, R. L., Miller, K. D., and Jemal, A. (2017). Cancer Statistics, 2017. Cancer J. Clin. 67, 7–30. doi: 10.3322/caac.21387
Subramanian, A., Tamayo, P., Mootha, V. K., Mukherjee, S., Ebert, B. L., Gillette, M. A., et al. (2005). Gene set enrichment analysis: a knowledge-based approach for interpreting genome-wide expression profiles. Proc. Natl. Acad. Sci. U. S. A. 102, 15545–15550. doi: 10.1073/pnas.0506580102
Tang, Z., Li, C., Kang, B., Gao, G., Li, C., and Zhang, Z. (2017). GEPIA: a web server for cancer and normal gene expression profiling and interactive analyses. Nucl. Acids Res. 45, W98–W102. doi: 10.1093/nar/gkx247
Vander Heiden, M. G., and DeBerardinis, R. J. (2017). Understanding the Intersections between Metabolism and Cancer Biology. Cell 168, 657–669. doi: 10.1016/j.cell.2016.12.039
Yang, M., and Vousden, K. H. (2016). Serine and one-carbon metabolism in cancer. Nat. Rev. Cancer 16, 650–662. doi: 10.1038/nrc.2016.81
Yu, M., Zhang, X., Li, H., Zhang, P., and Dong, W. (2017). MicroRNA-588 is downregulated and may have prognostic and functional roles in human breast cancer. Med. Sci. Monit. 30, 5690–5696. doi: 10.12659/msm.905126
Zeng, J. D., Wu, W. K. K., Wang, H. Y., and Li, X. X. (2019). Serine and one-carbon metabolism, a bridge that links mTOR signaling and DNA methylation in cancer. Pharmacol. Res. 149:104352.
Keywords: TCA cycle, one carbon metabolism, colon adenocarcinoma, prognostic, signature
Citation: Zhang Z, Zhu H, Li Q, Gao W, Zang D, Su W, Yang R and Zhong J (2021) Gene Expression Profiling of Tricarboxylic Acid Cycle and One Carbon Metabolism Related Genes for Prognostic Risk Signature of Colon Carcinoma. Front. Genet. 12:647152. doi: 10.3389/fgene.2021.647152
Received: 06 January 2021; Accepted: 24 August 2021;
Published: 13 September 2021.
Edited by:
Leonard H. Augenlicht, Albert Einstein College of Medicine, United StatesReviewed by:
Vedbar Singh Khadka, University of Hawaii, United StatesWenge Li, Albert Einstein College of Medicine, United States
Copyright © 2021 Zhang, Zhu, Li, Gao, Zang, Su, Yang and Zhong. This is an open-access article distributed under the terms of the Creative Commons Attribution License (CC BY). The use, distribution or reproduction in other forums is permitted, provided the original author(s) and the copyright owner(s) are credited and that the original publication in this journal is cited, in accordance with accepted academic practice. No use, distribution or reproduction is permitted which does not comply with these terms.
*Correspondence: Jiateng Zhong, anR6aG9uZ0B4eG11LmVkdS5jbg==