
95% of researchers rate our articles as excellent or good
Learn more about the work of our research integrity team to safeguard the quality of each article we publish.
Find out more
ORIGINAL RESEARCH article
Front. Genet. , 30 March 2021
Sec. Livestock Genomics
Volume 12 - 2021 | https://doi.org/10.3389/fgene.2021.645107
This article is part of the Research Topic Multi-Layered Genome-Wide Association/Prediction in Animals View all 10 articles
 Xinting Yang1†
 Jiahong Sun1†
 Guiping Zhao1
 Wei Li1
 Xiaodong Tan1
 Maiqing Zheng1Furong Feng2Dawei Liu2
 Jie Wen1
 Ranran Liu1*
Background: Carcass traits are crucial characteristics of broilers. However, the underlying genetic mechanisms are not well understood. In the current study, significant loci and major-effect candidate genes affecting nine carcass traits related to meat production were analyzed in 873 purebred broilers using an imputation-based genome-wide association study.
Results: The heritability estimates of nine carcass traits, including carcass weight, thigh muscle weight, and thigh muscle percentage, were moderate to high and ranged from 0.21 to 0.39. Twelve genome-wide significant SNPs and 118 suggestively significant SNPs of 546,656 autosomal variants were associated with carcass traits. All SNPs for six weight traits (body weight at 42 days of age, carcass weight, eviscerated weight, whole thigh weight, thigh weight, and thigh muscle weight) were clustered around the 24.08 Kb region (GGA24: 5.73–5.75 Mb) and contained only one candidate gene (DRD2). The most significant SNP, rs15226023, accounted for 4.85–7.71% of the estimated genetic variance of the six weight traits. The remaining SNPs for carcass composition traits (whole thigh percentage and thigh percentage) were clustered around the 42.52 Kb region (GGA3: 53.03–53.08 Mb) and contained only one candidate gene (ADGRG6). The most significant SNP in this region, rs13571431, accounted for 11.89–13.56% of the estimated genetic variance of two carcass composition traits. Some degree of genetic differentiation in ADGRG6 between large and small breeds was observed.
Conclusion: We identified one 24.08 Kb region for weight traits and one 42.52 Kb region for thigh-related carcass traits. DRD2 was the major-effect candidate gene for weight traits, and ADGRG6 was the major-effect candidate gene for carcass composition traits. Our results supply essential information for causative mutation identification of carcass traits in broilers.
For global meat consumption, chicken meat is the second largest and provide almost 1/3 of meat resource1. Improvements in the weight and carcass traits are major goals in modern broiler breeding programs. In particular, thigh development and meat production are closely related to the efficiency of the broiler industry. These traits have moderate to high heritability and are controlled by multiple genes (Claire D’Andre et al., 2013; Flisar et al., 2014).
Many studies have been performed to identify quantitative trait loci (QTLs), genes, and/or causative mutation. In pigs, a causative mutation of IGF2 has a major effect on muscle growth (Van Laere et al., 2003). In large dog breeds, variants in IRS4, ACSL4, and IGSF1 were strongly associated with skeletal size and body mass (Plassais et al., 2017). In mice and humans, changes in the Neurobeachin abundance or activity significantly affect the body weight (Olszewski et al., 2012). A non-synonymous FGD3 variant was identified as a positional candidate for disproportional tall stature, accounting for a carcass weight QTL and skeletal dysplasia in Japanese Black cattle (Takasuga et al., 2015). Many QTL and genes have been found in chickens, including LCORL1 and LDB2 (Gu et al., 2011; Liu et al., 2013, 2015). Recently, multiple haplotypes at the distal end of chromosome 1 were identified as a major-effect QTL for chicken growth traits (Wang et al., 2020). However, the genetic mechanisms of carcass traits are not well understood.
An imputation-based genome-wide association study was conducted to identify significant loci and candidate genes affecting multiple weight and carcass composition traits in fast-growing white-feathered broilers.
Chickens were obtained from a fast-growing white-feathered broiler line B. The chickens were produced and raised by Foshan Gaoming Xinguang Agricultural and Animal Industrials Co., Ltd. (Foshan, China). In generation 5 (G5), 873 breeders (412 males and 462 females) were randomly selected and slaughtered at 42 day of age. All birds were raised in stair-step cages under the same recommended environmental (Li et al., 2009) and nutritional conditions (Feeding Standard of Chickens, China, NY 33-2004).
In addition, thirty Chahua and 24 Daweishan mini chickens were used for the phylogenetic and selective sweep analysis. Chahua chickens are similar to red junglefowl. The blood samples were supplied by the Aquatic Animal Husbandry Association of Yulin City in the Guangxi Zhuang Autonomous Region. The individuals are small, and the body weight rarely exceeds 1 kg. The blood samples of the Daweishan mini chickens were obtained from the Yunnan Agricultural University. The Daweishan mini chickens are a small-sized Chinese indigenous breed similar to junglefowl distributing in the tropical and subtropical zone in Yunnan Province. The typical characteristics of Daweishan Mini chickens are a slow growth rate and low body weight compared with Chinese indigenous chickens of the same age (Rong et al., 2011).
The weight traits and carcass composition traits were measured in line B as follows: body weight at 42 day of age (BW42), carcass weight (CW), eviscerated weight (EW), whole thigh weight (WThW, weight including feet, and single), thigh weight (ThW, weight with bone, and single), thigh muscle weight (ThMW, single), and the WThW, ThW, and ThMW as percentages of BW42 (WThP, ThP, and ThMP). In addition, the same method (Li D. et al., 2020) was used to calculate the feed intake from 28 to 42 days of age (FI).
A linear mixed model (LMM) was fitted using the residual maximum likelihood (REML). The ASReml software (Gilmour et al., 2009) was used to estimate the variance components of the carcass traits of 873 broilers. The Wald F-statistics showed that the fixed effect of sex was statistically significant (P < 0.05). The variance components were estimated using a univariate mixed liner animal model. The animal model was expressed as follows:
where Y is the vector of observations; b is the vector of the fixed effects; u is the vector of the additive genetic effects, with u , where A is the additive genetic relationship matrix (GRM), and is the additive genetic variance; e is the vector of the random residual effects; and X and Z are the incidence matrices assigning observations to effects. The fixed effect in the model was sex.
The phenotypic variance is the sum of all variance components and is defined as follows:
The heritability is the ratio of the additive genetic variance to the phenotypic variance and is defined as follows:
where is the phenotypic variance, is the additive variance, and is the residual fraction.
A bivariate animal model was fitted to estimate the phenotypic and genetic correlations between carcass traits using the ASReml software package. The description of the model terms was the same as that for the univariate mixed linear animal model.
A likelihood ratio test (LRT) was used to determine the significance of the heritability and the genetic correlations. The LRT compares the likelihood of a full model with that of a nested model (without the additive genetic component) and was used to test for nonzero additive genetic variance.
Genomic DNA was extracted from blood samples using the phenol-chloroform method. The 873 broilers were genotyped with the customized chicken 55 K SNP array obtained from Beijing Compass Biotechnology Co., Ltd. (Beijing, China; Liu et al., 2019). A total of 873 broilers (412 males and 462 females) were used for genotype imputation for the target panel. The following quality control criteria were used for the target panel: individual call percentage ≥90%, SNP call percentage ≥90%, and minor allele frequency (MAF) ≥0.05. In addition, the SNPs located on the sex chromosomes and GGA16 were removed. We used 41,204 autosome variants and 873 broilers in the subsequent analyses.
Whole-genome sequences (WGS) of 230 broilers (101 males and 129 females) from the same line in G7 were used for the reference panel (Li D. et al., 2020). Briefly, an average depth of 10× was acquired, and variant calling and SNP filtering were performed according to a standardized bioinformatics pipeline. The quality control criteria of the reference panel included the individual call percentage ≥90%, SNP call percentage ≥90%, and MAF ≥ 0.05. After filtering, 9,760,228 autosome variants remained for 230 birds.
For the Chahua and Daweishan mini chickens, genome resequencing was conducted on the Illumina NovaSeq 6000 platform with an average depth of approximately 10× coverage. The sequencing was performed by Annoroad Gene Technology Co., Ltd. (Beijing, China). Variant calling was performed according to a standardized bioinformatics pipeline (DePristo et al., 2011; Van der Auwera et al., 2013). Specifically, clean sequencing data were aligned to the chicken reference genome (GRCg6a/galGal6; ftp://ftp.ncbi.nlm.nih.gov/genomes/all/GCF/000/002/315/GCF_000002315.6_GRCg6a/) with the Burrows-Wheeler Aligner (BWA)-MEM algorithm (Li, 2013). Then, PCR duplicates were removed with Picard-tools v1.1152. Variant calling was then performed via the HaplotypeCaller in GVCF mode with joint genotyping on all samples. We used ANNOVAR software (Wang et al., 2010) and the existing genome annotation file (gff) to annotate each detected SNP. Finally, the SNPs were filtered with the GATK Variant Filtration protocol. The filtering settings were as follows: variant confidence score < 30.0, QualByDepth < 2.0, ReadPosRankSum < −8.0, total depth of coverage < 4.0, and FisherStrand > 60.0. In addition, quality control was conducted using the following criteria: individual call rate ≥ 90%, SNP call rate ≥ 90%, and MAF ≥ 0.05. After filtering, a total of 9,235,705 autosome variants remained for the 54 sequenced birds.
Genotype imputation of the 55 K genotypes of the broilers to the imputed WGS level was performed with Beagle 5.0 (Browning et al., 2018). The effective population size (Ne) affects the accuracy of genotype imputation (Van den Berg et al., 2019) because it is much smaller in livestock than in humans (Hall, 2016). We used SNeP software (Barbato et al., 2015) to estimate the Ne; SNeP estimates the Ne using the following equation:
where NT(t) is the effective population size estimated t generations ago, f(ct) is the mapping function used to estimate the recombination rate (ct) t generations ago, is the linkage disequilibrium (LD) estimate adjusted for the sampling bias (, where N is the population sample size), and “a” is a constant accounting for mutation. The results showed that the Ne was 432 before the 13th generation.
The reference panel was pre-phased with Beagle 5.0 (default settings, except that the Ne was 432; Browning et al., 2018). Then the imputation from 55 K to the WGS level was executed in Beagle 5.0 with the default parameters, except that the Ne was 432. To assess the imputation accuracy, the allelic R2 values for each variant and the genotype concordance rate for a random 2% SNPs were determined. The allelic R2 was calculated as the estimated squared correlation of the imputed sequence genotype on the true sequence, which was given by Beagle 5.0. The genotype concordance rate was calculated by comparing the imputed and real genotypes for a randomly masked 2% of the SNPs analyzed with both panels. We applied the following post-imputation filtering criteria for each SNP: allelic R2 ≥ 0.8 and MAF ≥ 0.05. Finally, 6,546,656 autosomal variants and 873 samples remained for the subsequent genome−wide association study (GWAS; Supplementary Table 1).
The GWAS was performed using the univariate LMM implemented in GEMMA version 0.98.1 software3 (Zhou and Stephens, 2012). Due to the high genetic correlation between the weight traits and carcass composition traits, we fitted a multivariate linear mixed model (MLMM) for the weight traits and carcass composition traits. The genotype was the fixed effect, and the additive polygenic effect was the random effect. Sex was considered a covariate for all traits.
The univariate LMM had the following form:
where y represents the vector of the phenotypic values; W represents the vector of the covariates, including a column of 1 s; α represents the vector of the corresponding coefficients, including the intercept; x represents the vector of the marker genotypes; β represents the effect size of the marker; u represents the vector of the random polygenic effects; ϵ represents the vector of errors; τ−1 represents the variance of the residual errors; λ represents the ratio between the two variance components; K represents the centered relatedness matrix estimated from 6,546,656 variants, and In represents the identity matrix. MVNn denotes the n-dimensional multivariate normal distribution. The Wald test was used as a criterion to select the SNPs associated with the carcass traits.
The MLMM had the following form:
where Y is an n × d matrix of d phenotypes for n individuals; W = (w1, ⋅⋅⋅, wc) is an n × c matrix of covariates, including a column of 1 s; A is a c × d matrix of the corresponding coefficients, including the intercept; x is an n-vector of the marker genotypes; β is a d vector of the marker effect sizes for the d phenotypes; U is an n × d matrix of the random effects; E is an n × d matrix of the errors; K is the centered relatedness matrix estimated from 6,546,656 variants, In ×n is a n × n identity matrix, Vg is a d × d symmetric matrix of the genetic variance components, Ve is a d × d symmetric matrix of the environmental variance components, and MNn×d (0, V1, V2) denotes the normal distribution of the n × d matrix with mean 0, a row covariance matrix V1 (n by n), and a column covariance matrix V2 (d by d). The Wald test was used as a criterion to select the SNPs associated with the carcass traits.
The threshold P-value of the 5% Bonferroni genome-wide significance was 7.63e-9 (0.05/6,546,656), and that of the significance of the “suggestive association” that allows a one-time false positive effect in the GWAS test was 1.52e-7 (1/6,546,656). It was calculated using the same method. Manhattan and quantile-quantile (Q-Q) plots were constructed for each trait using the CMplot package4 in R (version 4.0.0). LD blocks of the target regions were identified using the Haploview version 4.2 software (Barrett et al., 2005). The SNP positions were updated using the newest release from the University of California-Santa Cruz (UCSC; GRCg6a/galGal6 genome version). The identification of genes in the genome-wide significant and suggestive regions was performed using the UCSC annotation of the GRCg6a/galGal6 genome version5. Boxplots were produced with the ggplot2 package in R (version 4.0.0).
A Bayesian approach called Bayes Cπ (Habier et al., 2011) was used to obtain the average proportion of genetic variance and phenotypic variance explained by each 1-Mb genomic non-overlapping window (n = 1,024). The Bayesian analyses were performed using the hibayes package6 in R (version 4.0.0). The number of iterations after the burn-in phase was 20,000, and that of the burn-in period was 10,000. Sex was fitted as a fixed covariate for all traits.
The estimation of SNP effect size was performed using MLMM analysis with the genotype data used to compute the GRM in DISSECT (Canela-Xandri et al., 2015)7. The approach is based on fitting the equation:
where y is the vector of the phenotypes, β is the vector of fixed effects that included sex, u is the vector of the SNP effects distributed as , I is the identity matrix, and ϵ is the vector of the residual effects distributed as ∼N(0,Iσ2). W is a genotype matrix defined by the equation:
where sik is the number of copies of the reference allele for the SNP k of the individual i, and pk is the frequency of the reference allele for the SNP k. In this model, the variance of y is:
where A is the GRM, is the genetic variance, and σ2 is the residual variance. The variance components were estimated using the REML.
Using data from 80 white-feathered broilers with different-parents, 30 Chahua chickens, and 24 Daweishan mini chickens, the pair-wise genetic distance matrices were calculated based on whole-genome SNPs, two candidate genes, and five randomly selected 100 Kb regions, respectively. A total of eight neighbor-joining trees were then constructed using MEGA X (Kumar et al., 2018). The defaults were used for all parameters.
Selective sweep analysis was performed on 80 white-feathered broilers with different parents, 30 Chahua chickens, and 24 Daweishan mini chickens. The population differentiation index (FST) was calculated as described by Weir and Cockerham (1984) and was implemented in the VCFtools v0.1.14 program (Danecek et al., 2011). The average FST values were plotted in 20-kb overlapping genomic bins (for more than 10 SNPs) with a 10-kb step-size.
The nucleotide diversity (π) of each population was estimated using a 20-kb sliding window (for more than 10 SNPs) with a 10-kb step across the whole genome, and the ratio (πChahuaandMINI/πBline) was computed. The log2(πratio) was defined as .
The heterozygosity HP was calculated only in the line B chickens as: , where ∑nMAJ is the sum of the major allele frequencies, and ∑nMIN is the sum of the minor allele frequencies within a window. The HP value was Z-transformed as follows: , where μHP is the overall average heterozygosity and σHP is the standard deviation for all windows.
The cross-population extended haplotype homozygosity (XP-EHH; Sabeti et al., 2007) was calculated for each SNP in the dataset using Selscan v-1.3.0 (Szpiech and Hernandez, 2014). Prior to the XP-EHH test, Beagle 5.0 software (Browning et al., 2018) was used to estimate missing genotypes and reconstructing the haplotypes from the unphased SNP genotype data.
The overall experimental workflow is depicted in Supplementary Figure 1.
The descriptive statistics of the carcass traits are listed in Table 1. At 42 days of age, the body weight (BW42), carcass weight (CW), and eviscerated weight (EW) were 1912.74 ± 196.49, 1728.24 ± 180.26, and 1229.60 ± 145.98. The whole thigh weight (WThW, weight including feet), thigh weight (ThW, weight with bone), and thigh muscle weight (ThMW) were 249.47 ± 31.13, 213.37 ± 26.65, and 157.19 ± 20.20. The whole thigh percentage (WThP), thigh percentage (ThP), and thigh muscle percentage (ThMP) were 13.03 ± 0.74, 11.15 ± 0.67, and 8.21 ± 0.54. Feed intake from 28 to 42 days of age was 1775.98 ± 147.83. The coefficients of variation of these traits in the population ranged from 5.64 to 12.85%.
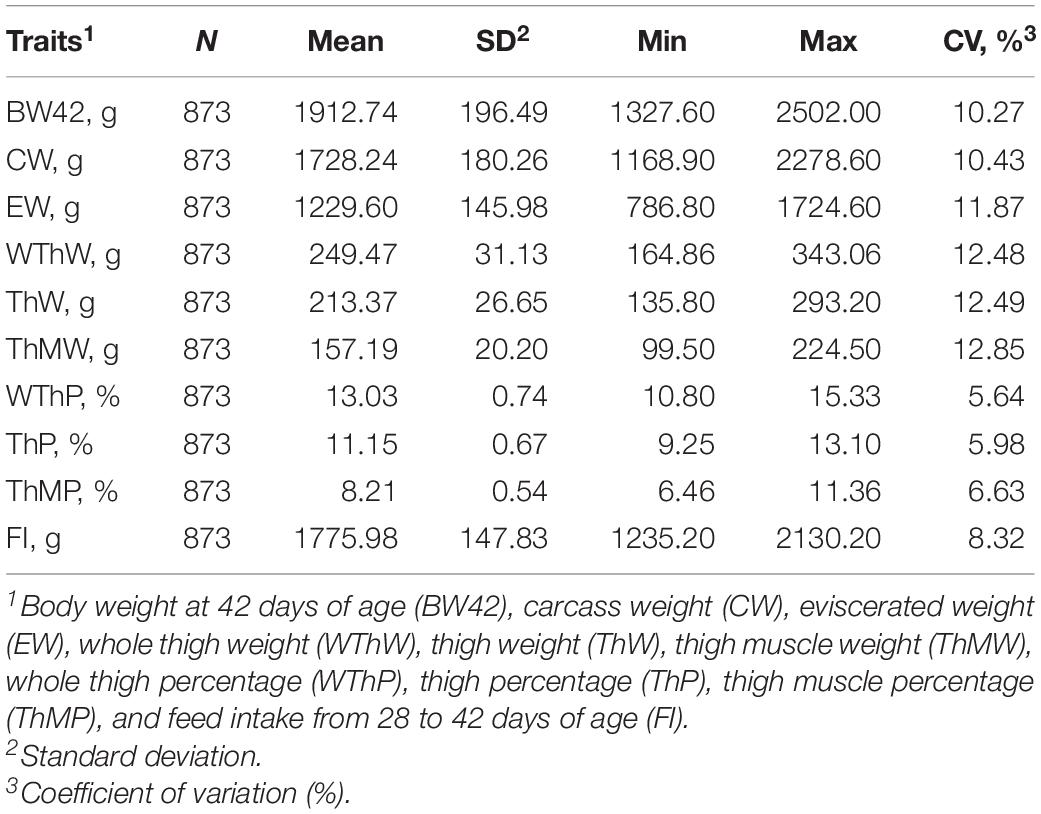
Table 1. Descriptive statistics of the carcass traits of broilers.
The heritabilities and the phenotypic and genetic correlations for the carcass traits are presented in Table 2. The WThP and ThP had moderate heritabilities (0.21–0.22). The heritabilities of the other carcass traits were higher (0.30 to 0.39). All weight traits showed strong positive genetic correlations (0.78–0.99) and phenotypic correlations (0.71–0.99). All carcass composition traits showed strong positive genetic correlations (0.76–0.94) and phenotypic correlations (0.81–0.98).
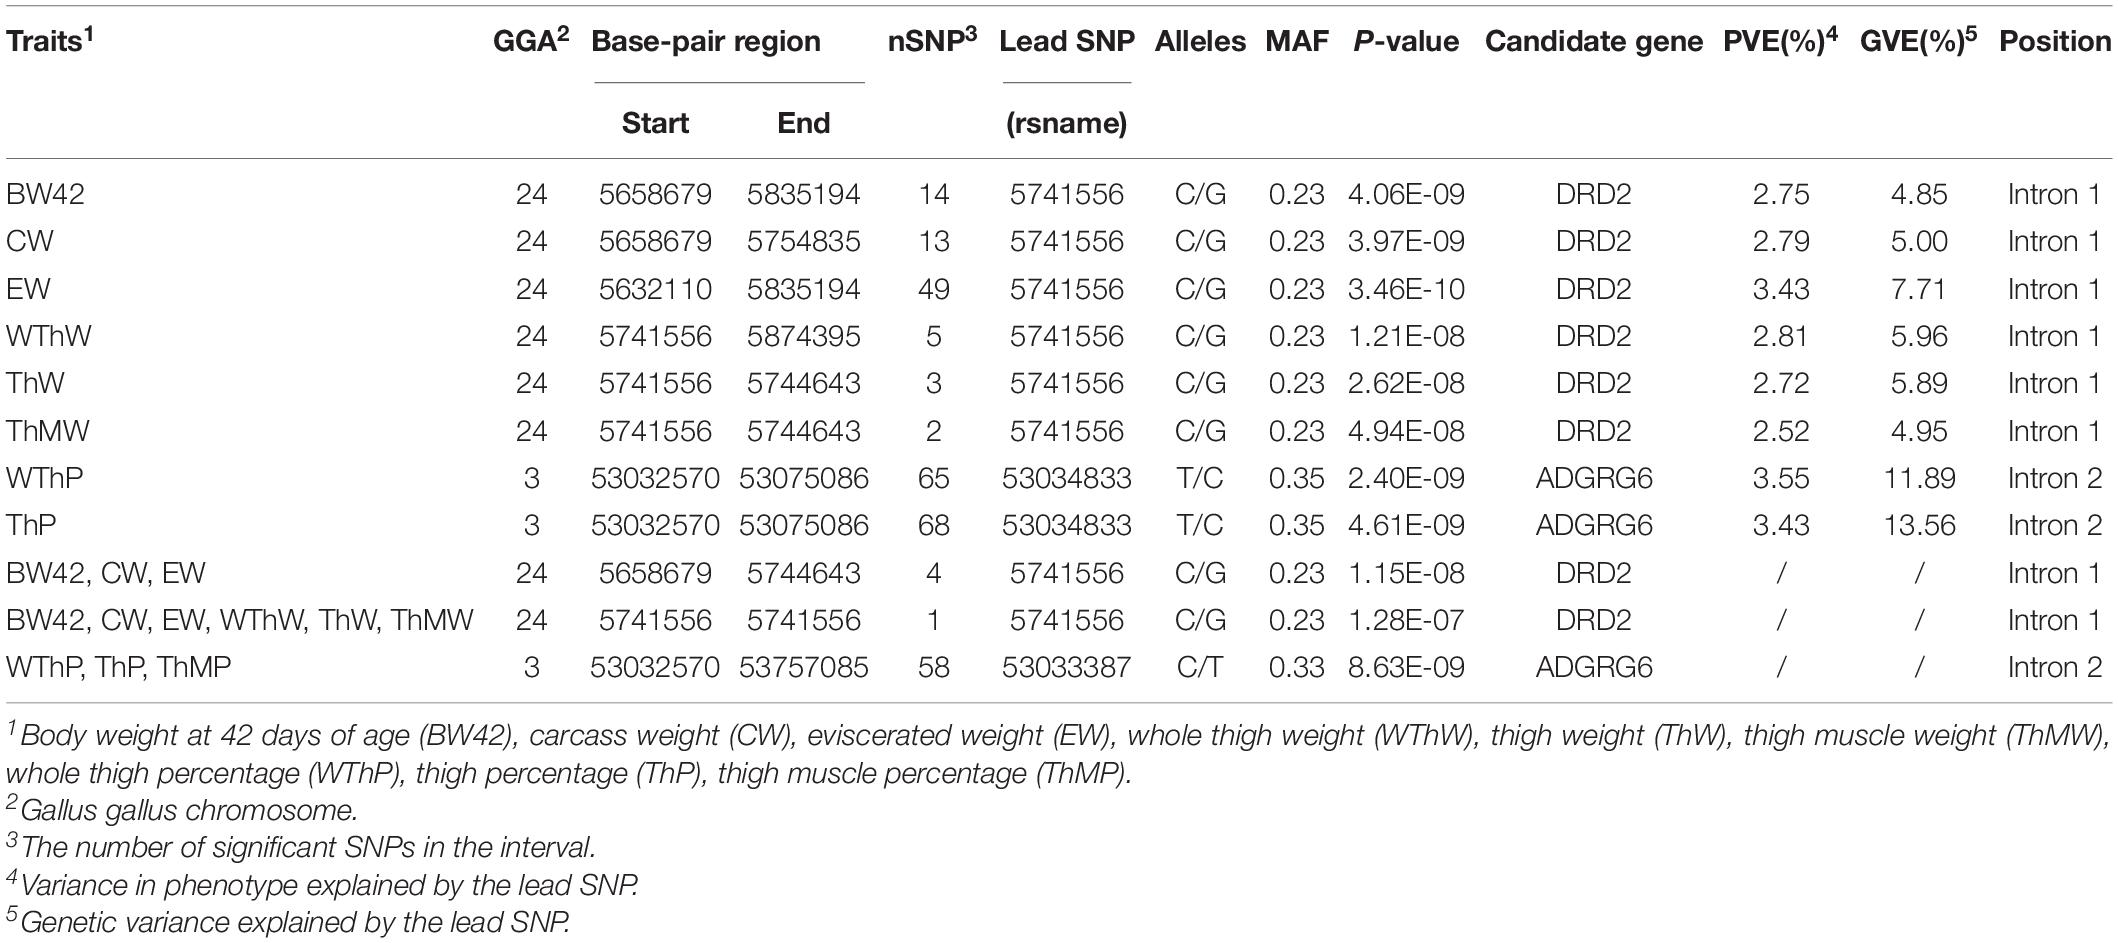
Table 2. Overview of the significant QTLs of univariate GWAS and multivariate GWAS associated with target traits.
The proportion of SNP markers on each chromosome based on different datasets are shown in Figure 1A. The numbers of SNPs in the different MAF classes for different datasets are shown in Figure 1B. In general, the proportion of SNP markers on each chromosome and the MAF distribution of the four datasets showed the same trends. Consistency was observed in the distribution of SNPs between the 55 K array data and the imputed WGS data after filtering and between the WGS data and imputed WGS data before filtering (MAF ≥ 0.05).
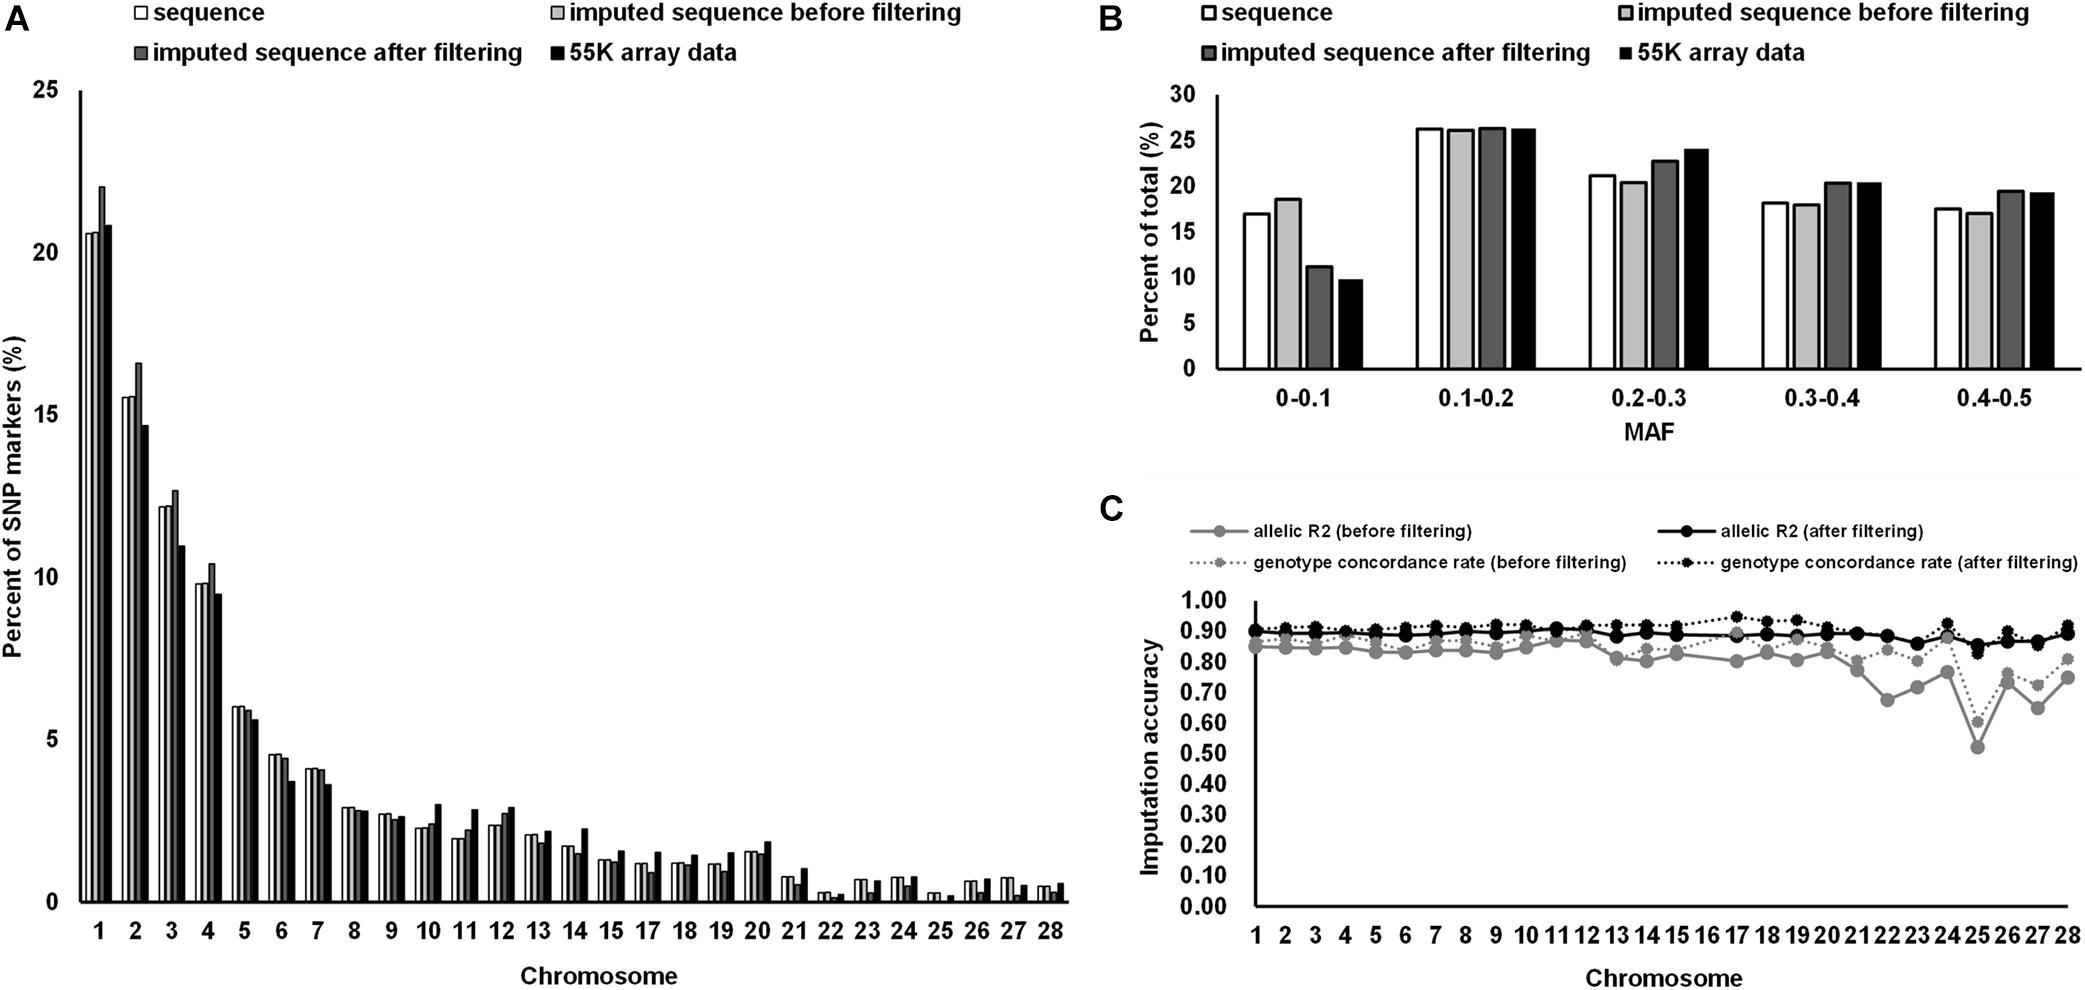
Figure 1. Distribution of SNP markers and imputation accuracy. (A) Percentage of SNPs on the chromosome for the 55 K array data of 873 birds, WGS data of 230 birds, and imputed WGS data of 873 birds after imputation and post-imputation filtering. (B) Percentage of SNPs in each MAF class for different datasets. (C) The imputation accuracy of the imputed WGS data of 873 birds after imputation and post-imputation filtering. MAF, minor allele frequency.
The allelic R2 values and the average genotype concordance rate were used to evaluate the imputation accuracy of the imputed WGS data (Figure 1C). At the chromosome level, the allelic R2 values of the imputed sequence before filtering ranged from 0.52 to 0.87, whereas the genotype concordance rate fluctuated between 0.60 and 0.89. After post-imputation filtering, the allelic R2 values and the genotype concordance rate reached an average of 0.89 and 0.91, respectively. The distribution of the SNPs used in the GWAS after post-imputation filtering is summarized in Supplementary Table 1.
The Manhattan and Q-Q plots of the univariate GWAS results are presented in Figure 2A and Table 2. We detected 12 genome-wide significant SNPs and 118 suggestively significant SNPs. All SNPs for the weight traits (BW42, CW, EW, WThW, ThW, and ThMW) were clustered around the 242.29 Kb region (GGA24: 5.63–5.87 Mb). The most significant SNP, rs15226023, accounted for 4.85–7.71% of the genetic variance of the six weight traits. The remaining SNPs for the carcass composition traits (WThP and ThP) were clustered around the 42.52 Kb region (GGA3: 53.03–53.08 Mb). The most significant SNP in this region, rs13571431, accounted for 11.89 and 13.56% of the genetic variance of WThP and ThP, respectively.
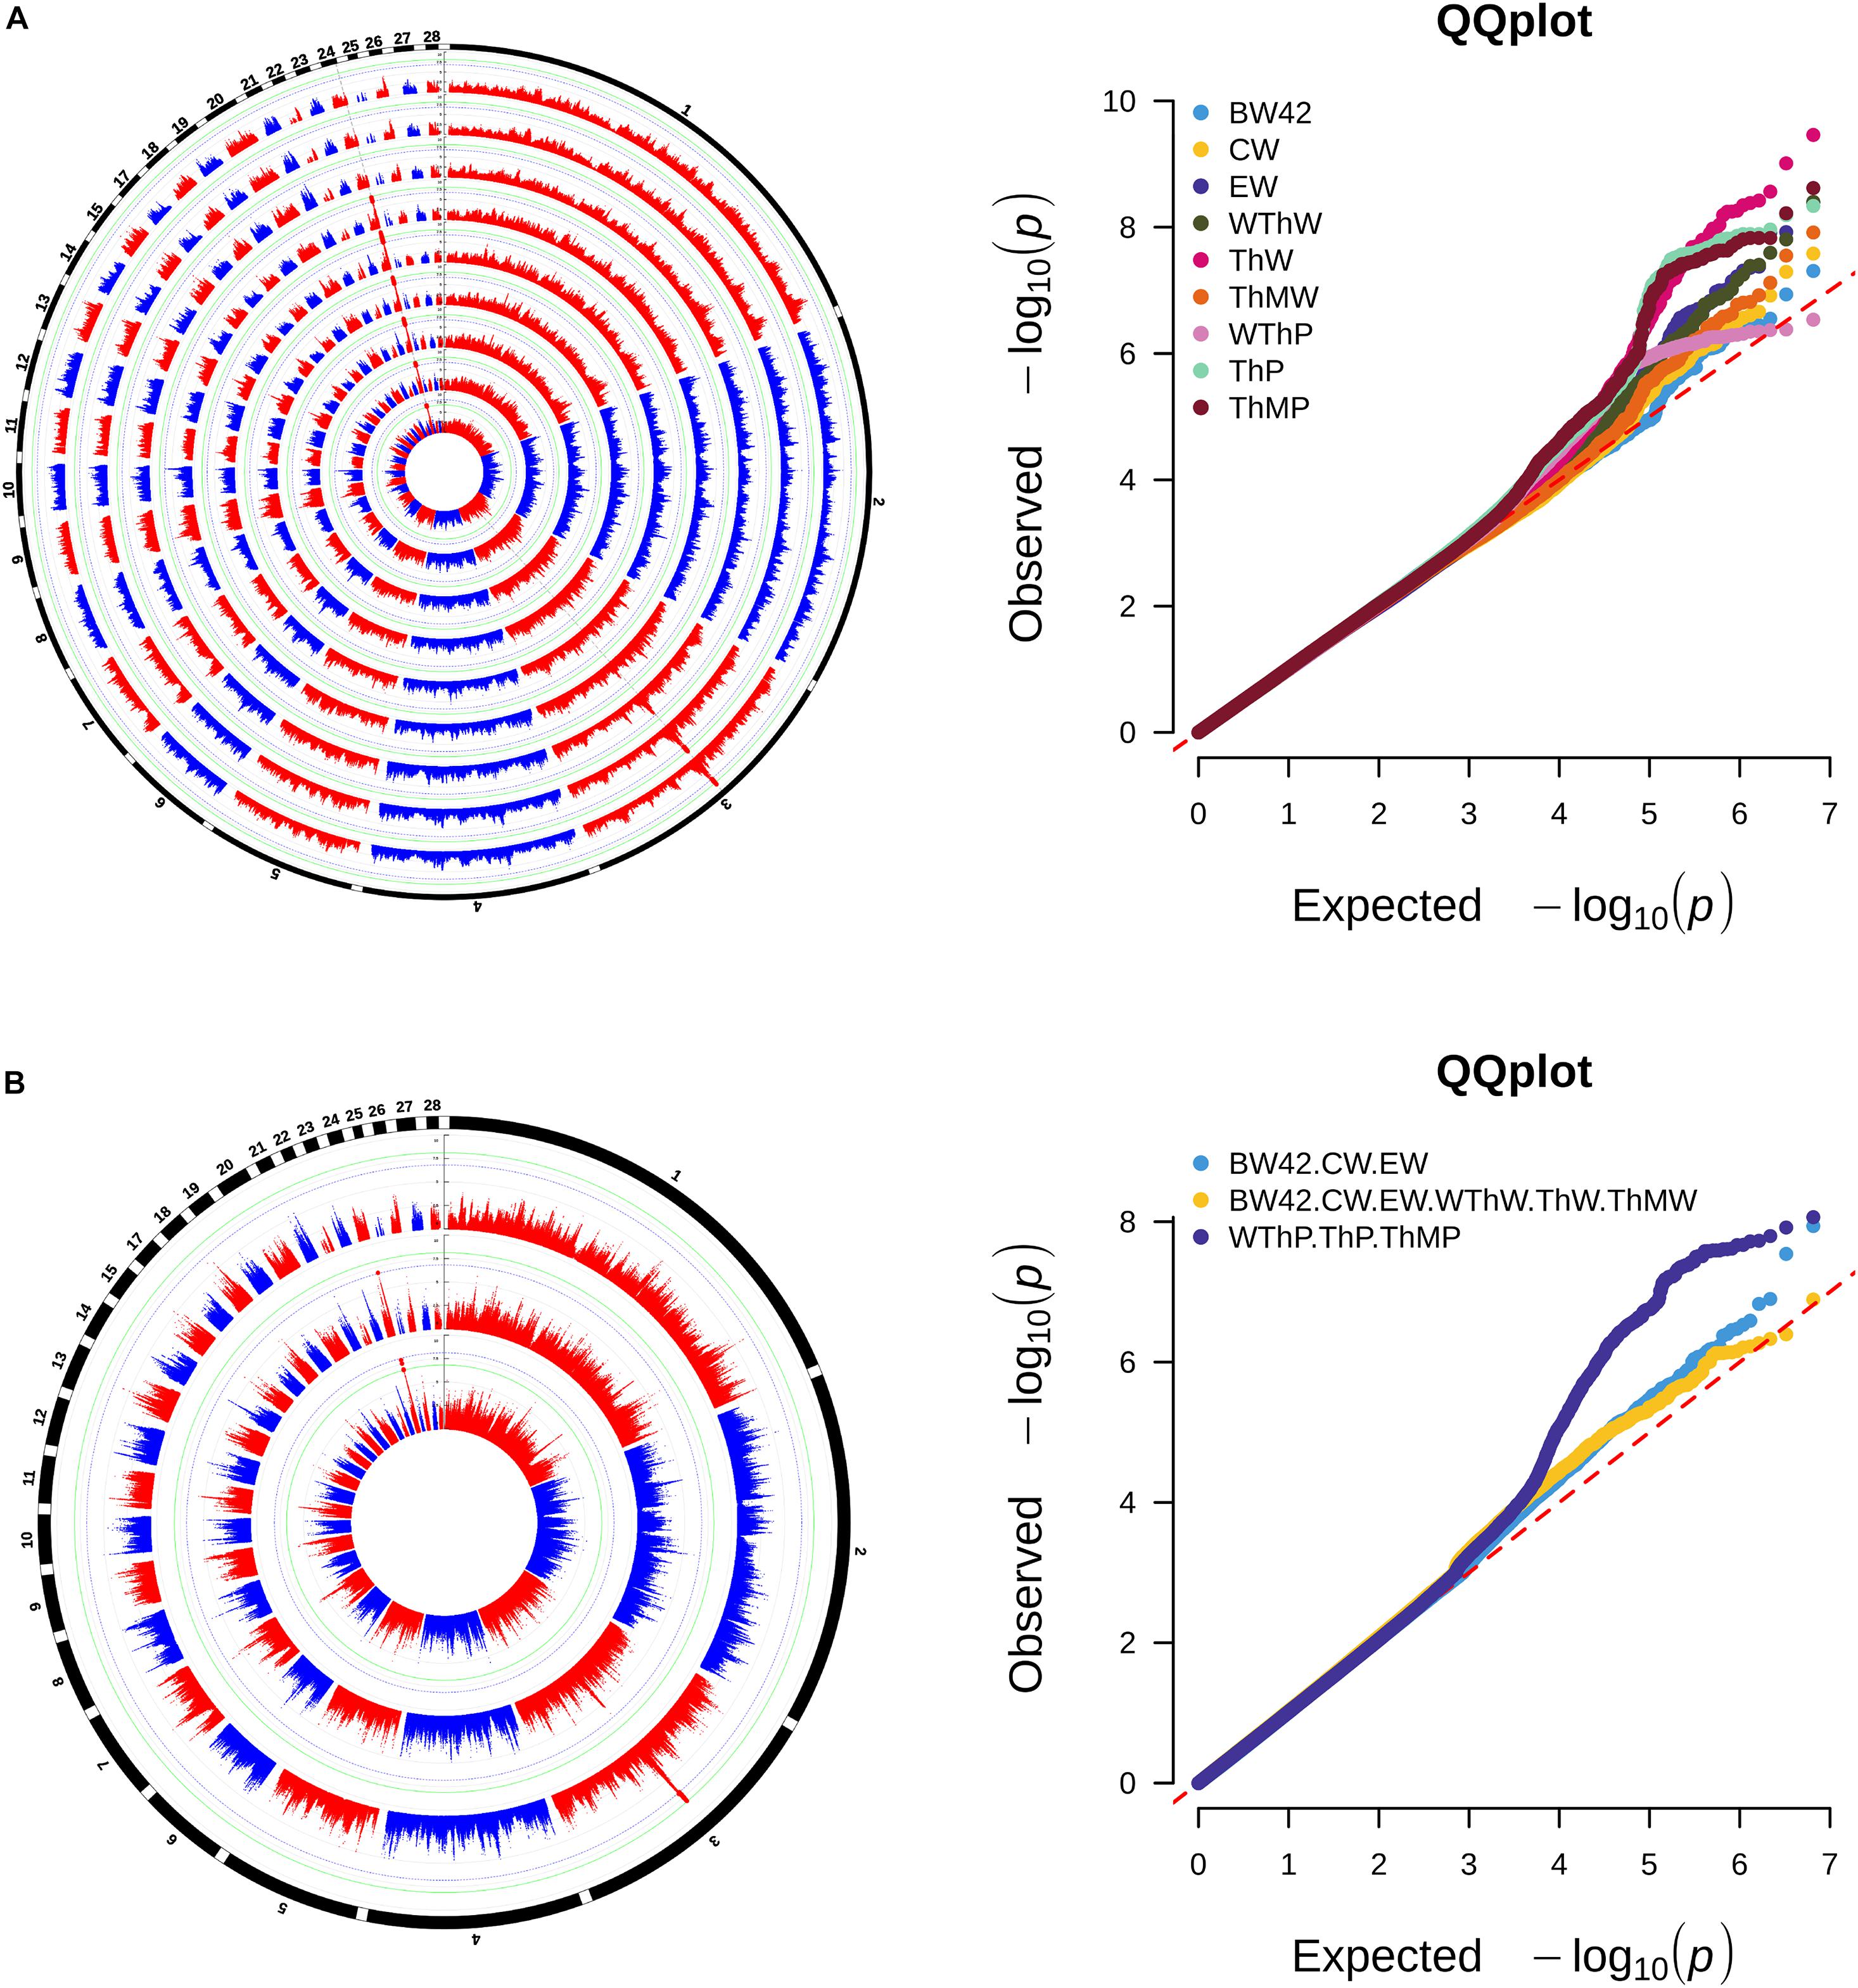
Figure 2. Manhattan and quantile-quantile plots of univariate GWAS (A) and multivariate GWAS (B) for carcass traits. Each dot represents an SNP in the dataset. The circle Manhattan plots from the inside to the outside are BW42, CW, EW, WThW, ThW, ThMW, WThP, ThP, and ThMP. The horizontal blue and green lines indicate the thresholds for genome-wide significance (P-value = 7.64e-9) and suggestive significance (P-value = 1.53e-7), respectively.
The consistent significant loci were detected using the multivariate GWAS and univariate GWAS. The Manhattan and Q-Q plots of the multivariate GWAS are presented in Figure 2B and Table 2.
Based on r2 ≥ 0.8, the empirical confidence interval of the QTL in the GGA24 for the weight traits was 24.08 kb (GGA24: 5.73–5.75 Mb), and the unique gene DRD2 was located in the region (Figure 3A). Another QTL in the GGA3 for carcass composition traits was 42.52 kb (GGA3: 53.03–53.08 Mb), and the unique gene ADGRG6 was located in the region (Figure 3B).
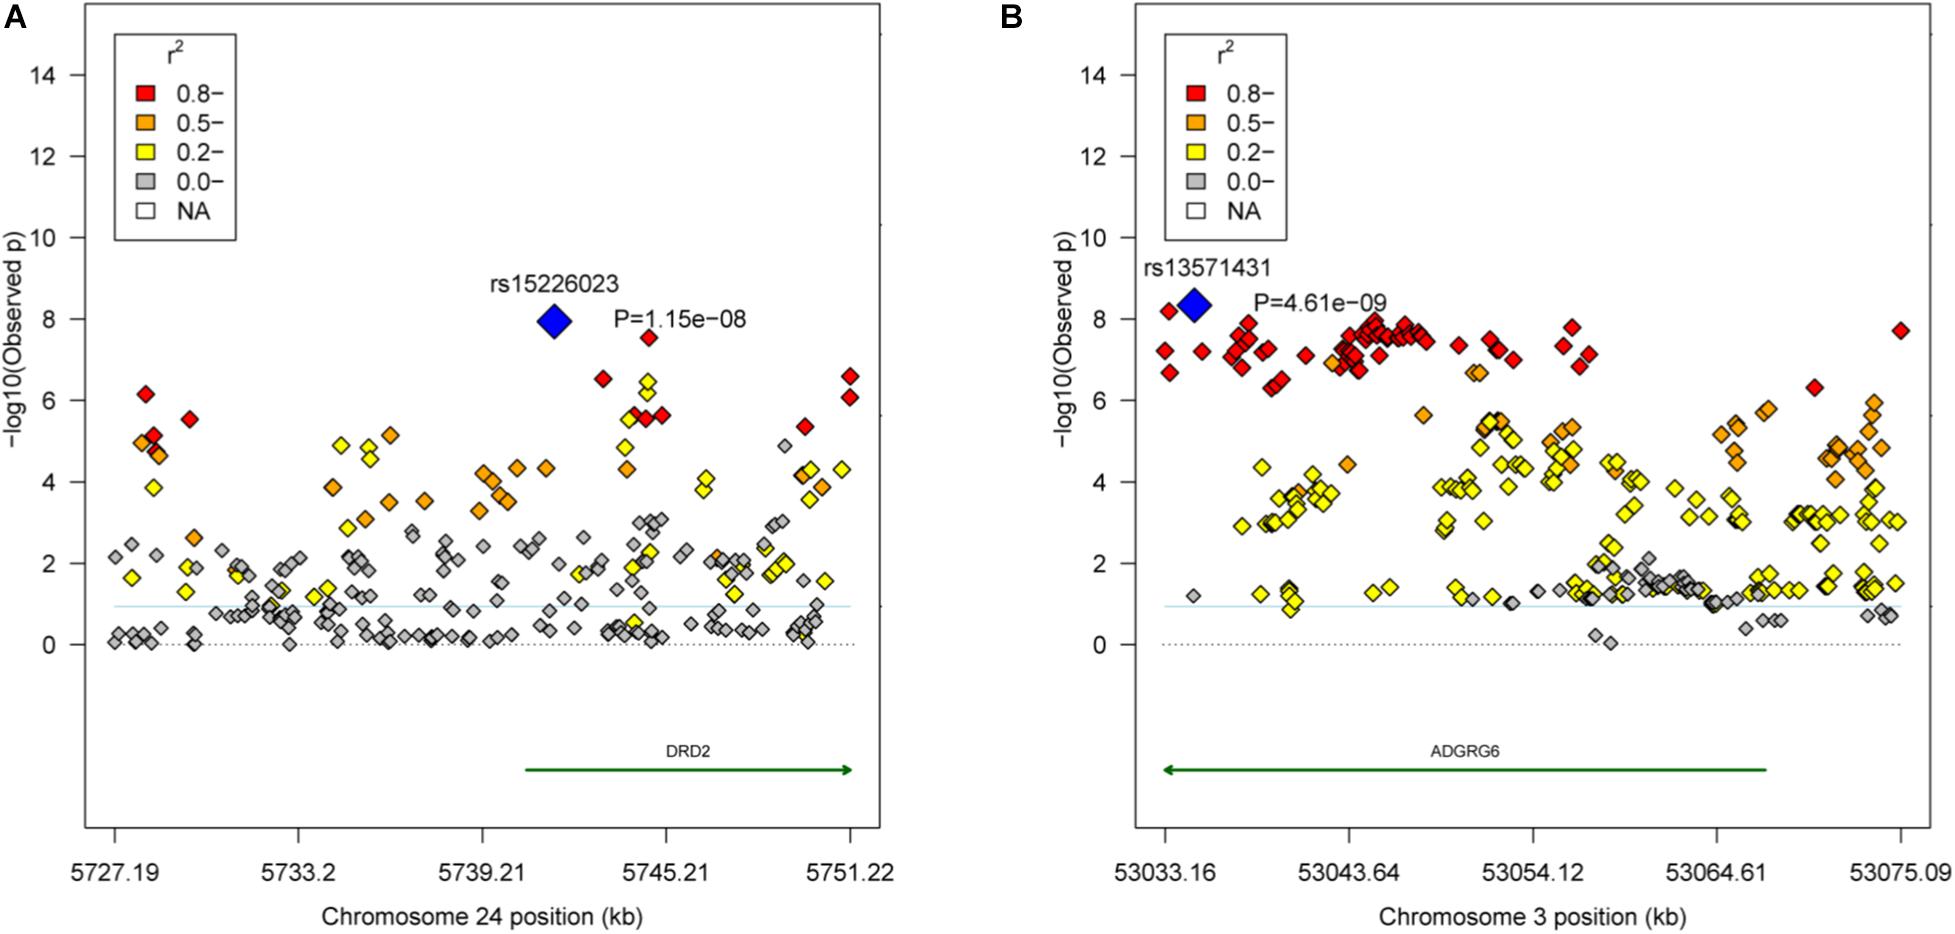
Figure 3. Regional association plots of the candidate areas. (A) The QTL region GGA24: 5.73–5.75 Mb associated with the weight traits. The blue dot represents the lead SNP rs15226023. (B) The QTL region GGA3: 53.03–53.08 Mb associated with the carcass composition traits. The blue dot represents the lead SNP rs13571431. Different levels of linkage disequilibrium (LD) between the lead SNP and the surrounding SNPs are shown in different colors (red: r2 ≥ 0.8; orange: 0.5 ≤ r2 < 0.8; yellow: 0.2 ≤ r2 < 0.5; and gray: r2 < 0.2). The gene annotations were obtained from the University of California Santa Cruz (UCSC) Genome Browser (http://genome.ucsc.edu).
For the weight traits, the 24.83 Kb region in GGA24 (GGA24: 5.73–5.75 Mb) in the significant region was detected by LD analysis (Supplementary Figure 2A). This LD block covered the exon1 and intron1 of DRD2 and had a positive effect (β < 0) on all weight traits (Supplementary Figure 2B). Interestingly, this LD block also had a positive effect (β < 0) on FI (Supplementary Figure 2B).
For WThP and ThP, one 42.52 kb strong LD block in GGA3 (GGA3: 53.03–53.08 Mb) was detected by LD analysis and contained 69 significant SNPs (Supplementary Figure 3A). This LD block covered exon1, intron1, exon2, and intron2 of ADGRG6 and had a negative effect (β < 0) on all carcass composition traits (Supplementary Figure 3B).
The effects of the significant LD block resulted in significant differences in the carcass traits, as shown in Supplementary Figures 2, 3. The lowest and highest phenotypic values belonged to homozygotes, whereas heterozygotes had intermediate values. Broilers with homozygous mutations of the LD block on GGA24 (GGA24: 5.73–5.75 Mb) had higher carcass weights and higher FIs than those with homozygous wild type. Broilers with homozygous mutations of the LD block on GGA3 (GGA3: 53.03–53.08 Mb) had lower WThP, ThP, and ThMP than those with homozygous wild type.
The Manhattan plots of the genetic variance and phenotypic variance explained by each 1-Mb window on different chromosomes for all traits are shown in Figures 4A,B, respectively. The genetic variance and phenotypic variance explained by the top 1-Mb windows for all traits are listed in Table 3. Among a total of 2014 windows, the top window explained 0.95–4.41% of the genetic variance and 0.29–1.13% of the phenotypic variance of the weight traits. For the carcass composition traits, the top window explained 2.00–3.00% of the genetic variance and 0.39–0.45% of the phenotypic variance. The top windows for all traits overlapped with the significant regions obtained from the GWAS.
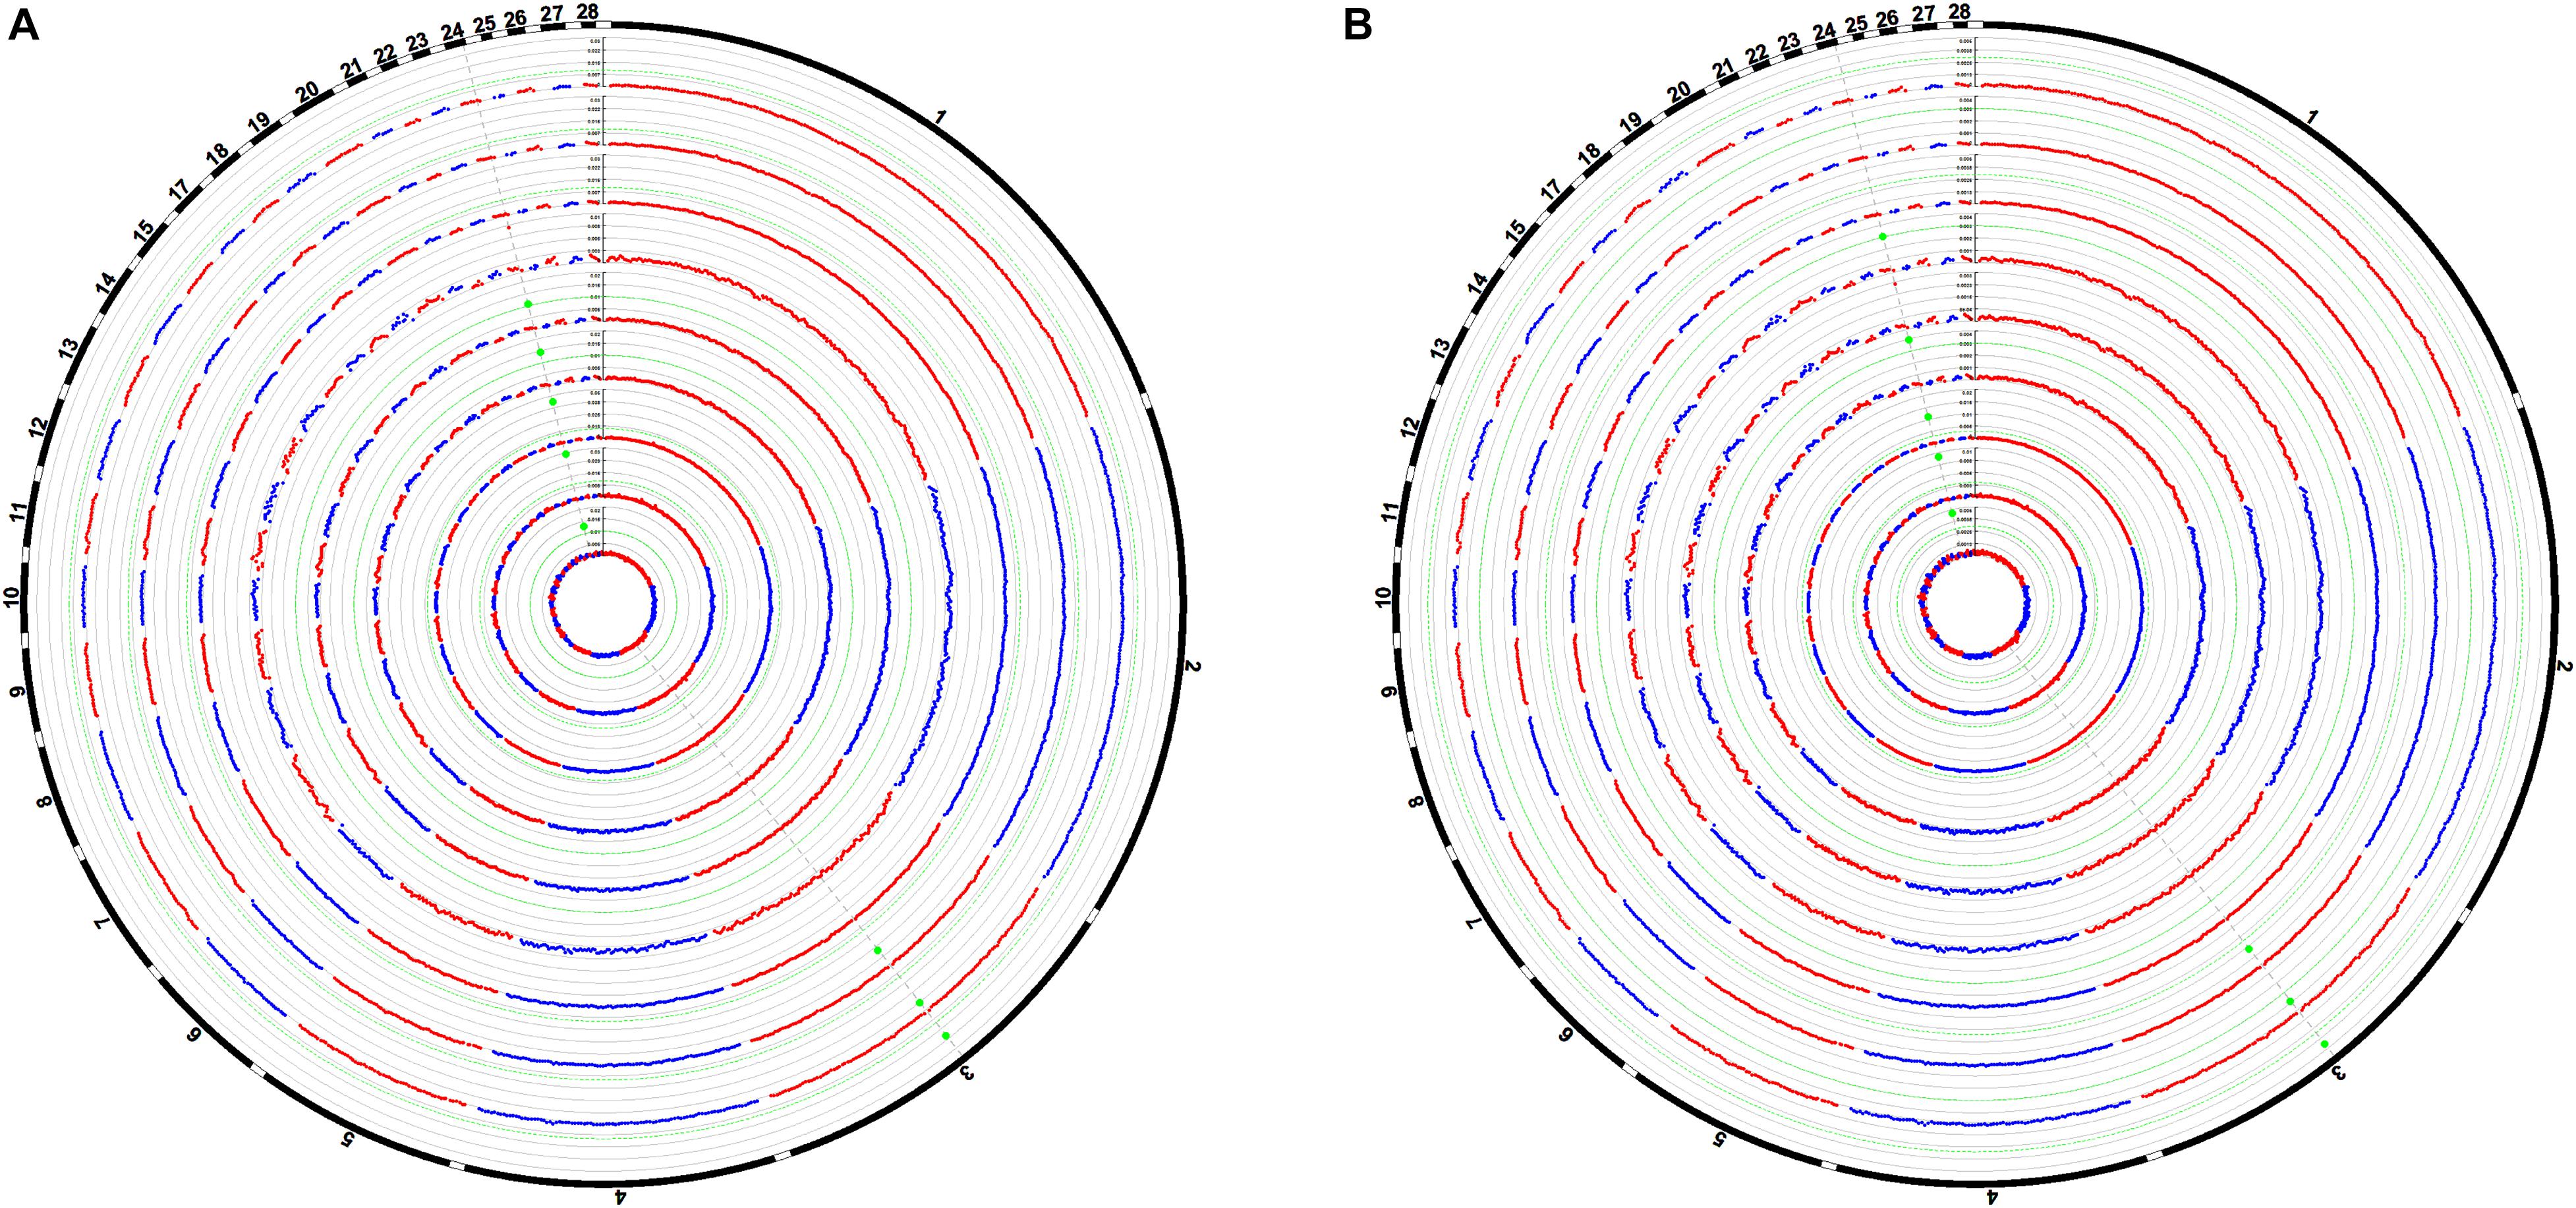
Figure 4. Manhattan plots of the average proportion of genetic variance (A) and phenotypic variance (B) explained by the 1-Mb window for all traits. Each dot represents a 1-Mb window. The circle Manhattan plots from the inside to the outside are BW42, CW, EW, WThW, ThW, ThMW, WThP, ThP, and ThMP. The dotted green lines indicate the 1.00% threshold of genetic variance and the 0.30% threshold of the phenotypic variance explained by the windows.
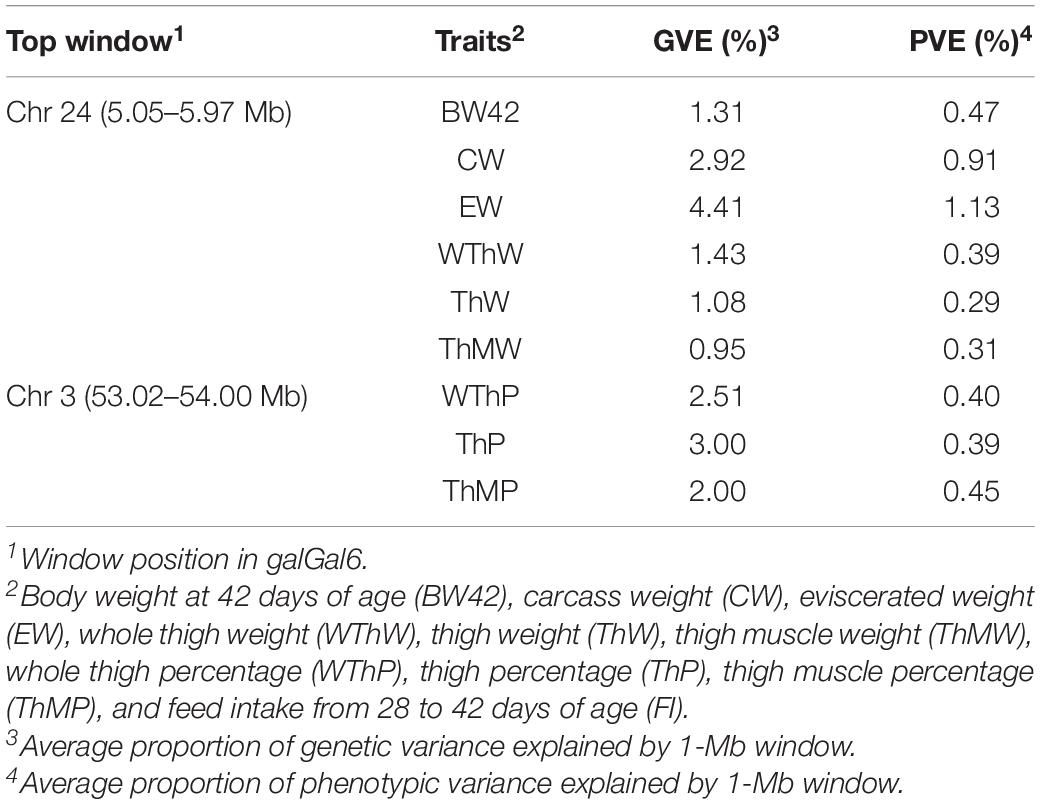
Table 3. genetic variance and phenotypic variance explained by top 1-Mb windows for all traits using Bayes Cπ.
The Manhattan plots of the SNP effect size are shown in Figure 5. The SNPs highlighted in red were suggestively significant in GWAS. The SNP effect size of the significant SNPs in GWAS of the six weight traits was between 0.008 and 0.155. The SNP effect size of the significant SNPs in GWAS of the three carcass composition traits was between −3.01e−4 and −2.06e−4. The SNP effect size of the significant SNPs in GWAS of the weight traits and carcass composition traits reached the top 0.24 and 0.26% of the whole-genome SNPs, respectively.
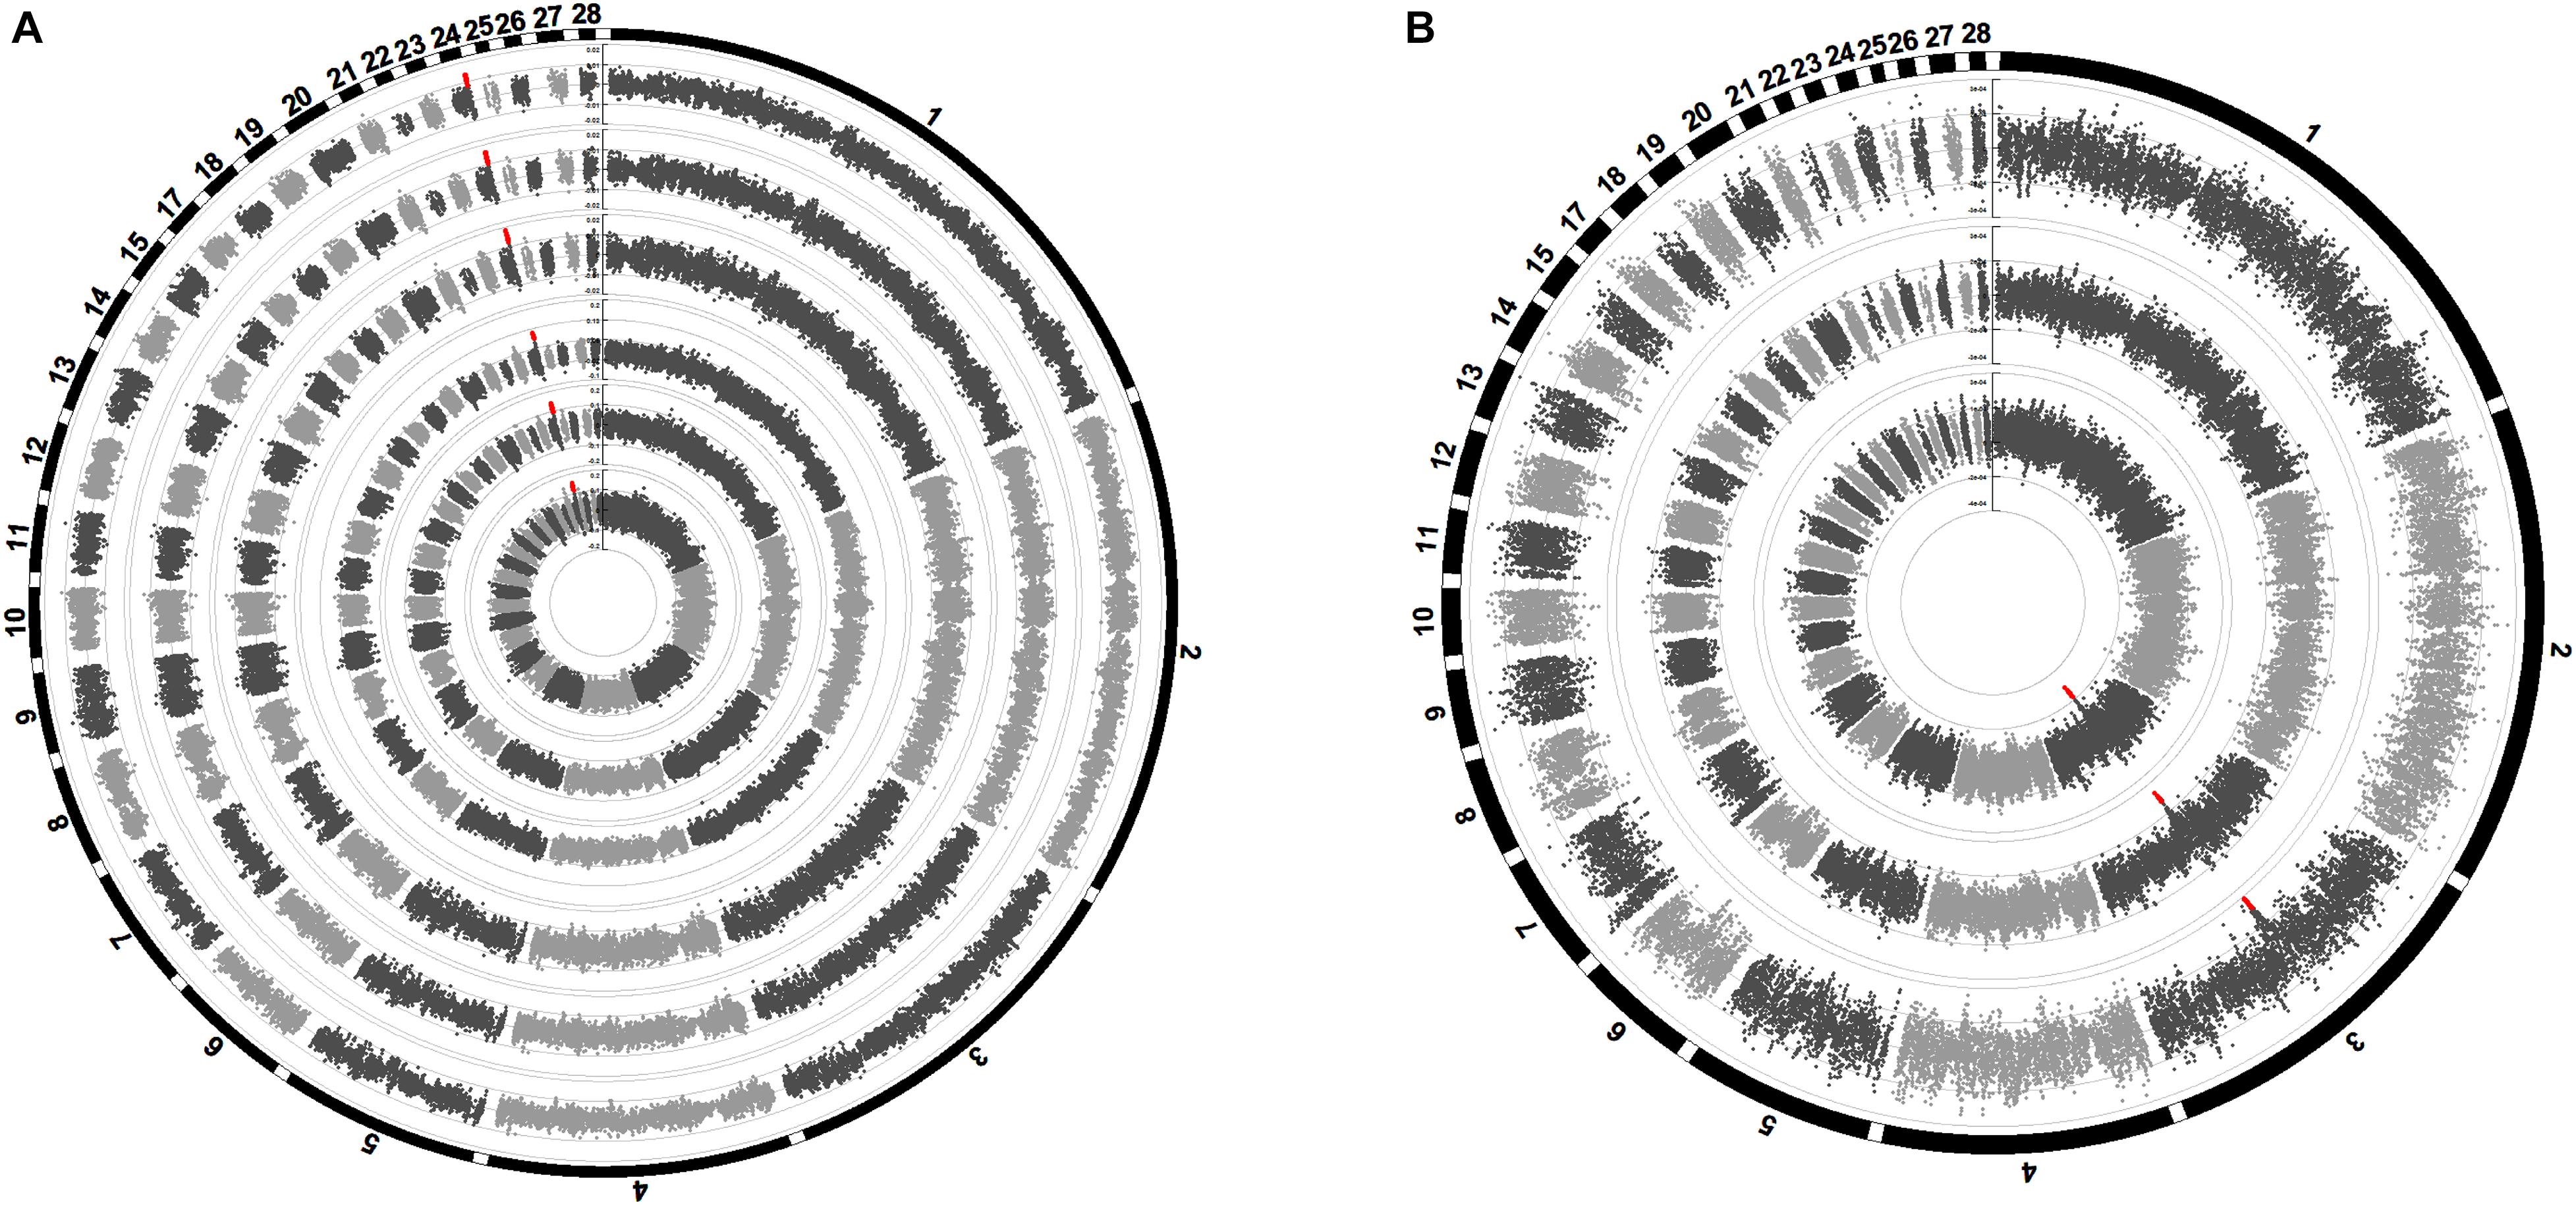
Figure 5. Manhattan plots of SNP effect sizes for the carcass traits (A) and carcass composition traits (B). Each dot represents an SNP. The SNP effect sizes are shown on the y-axis. The circle Manhattan plots from the inside to the outside are BW42, CW, EW, WThW, ThW, ThMW, WThP, ThP, and ThMP. The SNPs highlighted in red are suggestively significant in GWAS.
The phylogenetic analysis showed that the Line B chickens were separated from the Chahua and Daweishan mini chickens based on whole-genome SNPs, the SNPs within DRD2, or the SNPs within ADGRG6, respectively (Figures 6A–C). In contrast, the Line B chickens were not separated from the Chahua and Daweishan mini chickens when five random-selected 100 Kb regions were used (Figures 6D–H).
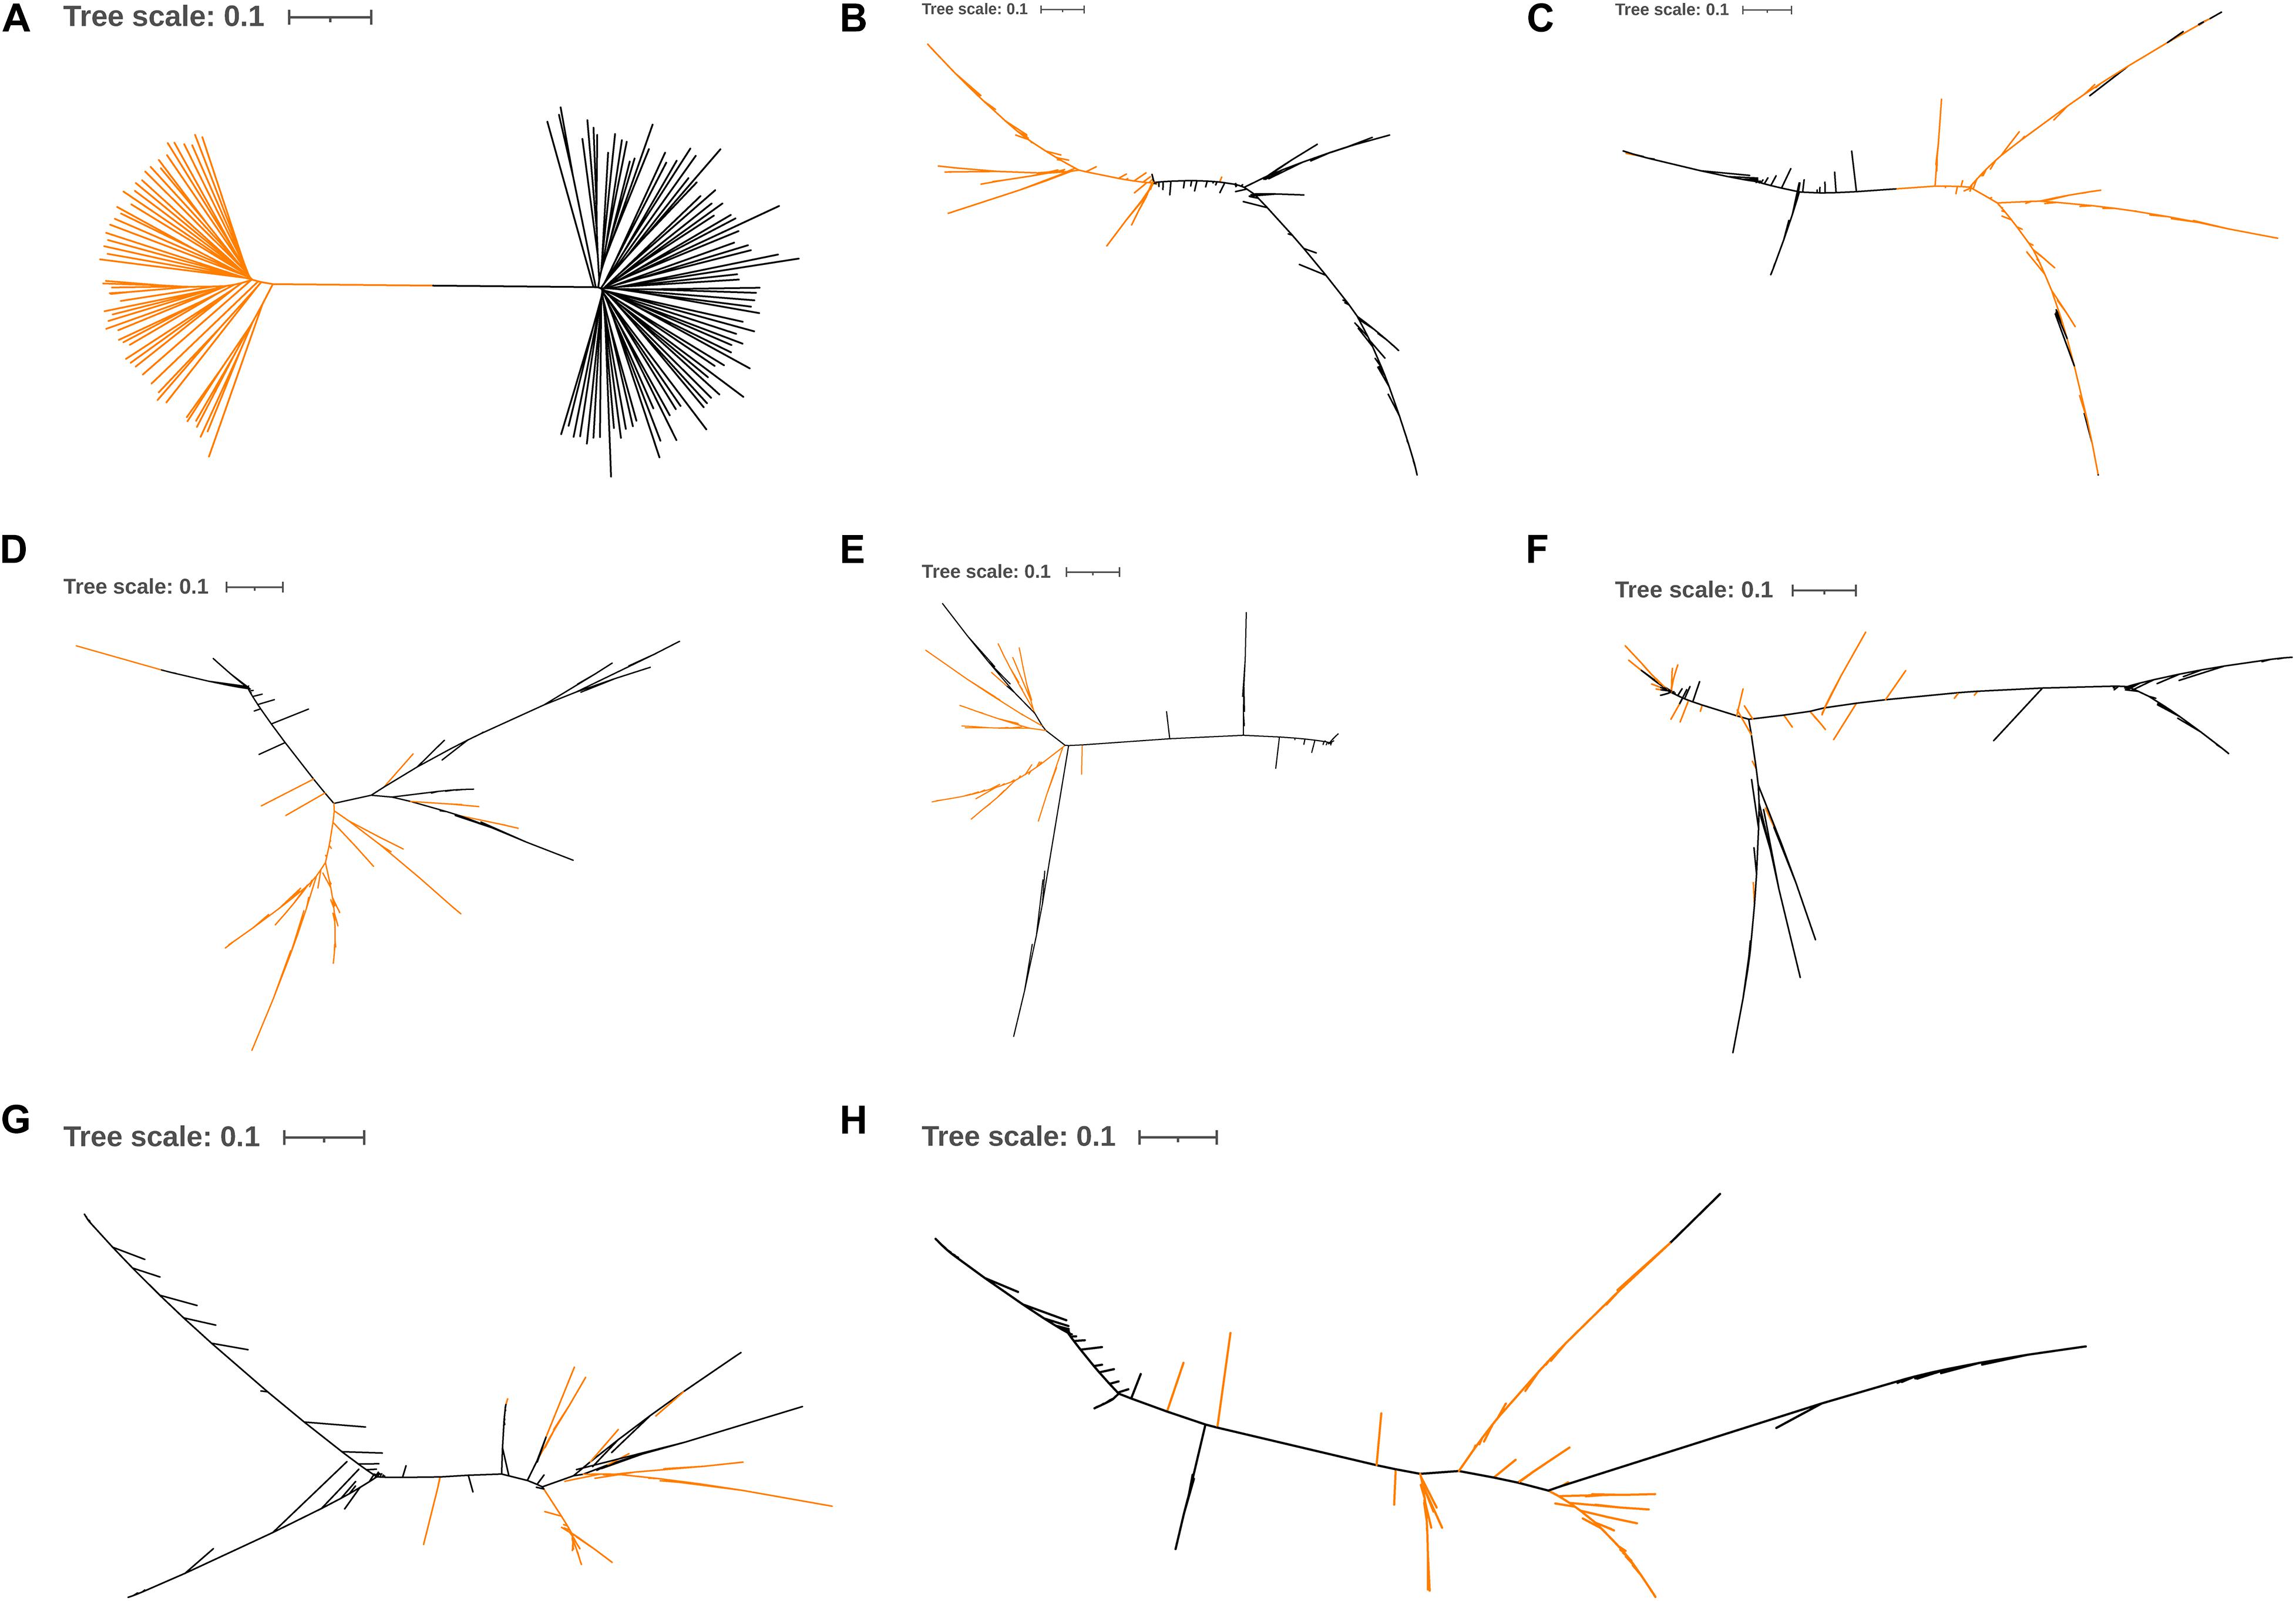
Figure 6. Neighbor-joining tree based on the whole-genome SNPs (A), candidate genes (B,C), and 5 random 100-Kb regions (D–H). The yellow line represents the Chahua chickens and Daweishan mini chickens, and the black line represents Line B.
A genome-wide selective sweep analysis was performed with the fast-growing Line B chickens, the Chahua chickens, and the Daweishan mini chickens (Figure 7). The FST values in DRD2 were between 0.11 and 0.21, and the FST values in ADGRG6 were between 0.17 and 0.40. Only the values in ADGRG6 reached the top 5% threshold (0.38) of the whole genome. The log2(πratio) values in DRD2 were between 0.07 and 0.20, and those in ADGRG6 were between -0.04 and 0.27, reaching the top 10% threshold (-0.04) of the whole genome. The zHp values in DRD2 were between 0.18 and 0.45, and those in ADGRG6 were between -1.37 and 0.19, reaching the top 10% threshold (-1.37) of the whole genome. The XP-EHH values in DRD2 were between -0.12 and 0.30, and those in ADGRG6 were between 0.64 and 1.02. Overall, only the ADGRG6 region showed some degree of genetic and nucleotide differentiation between large and small breeds.
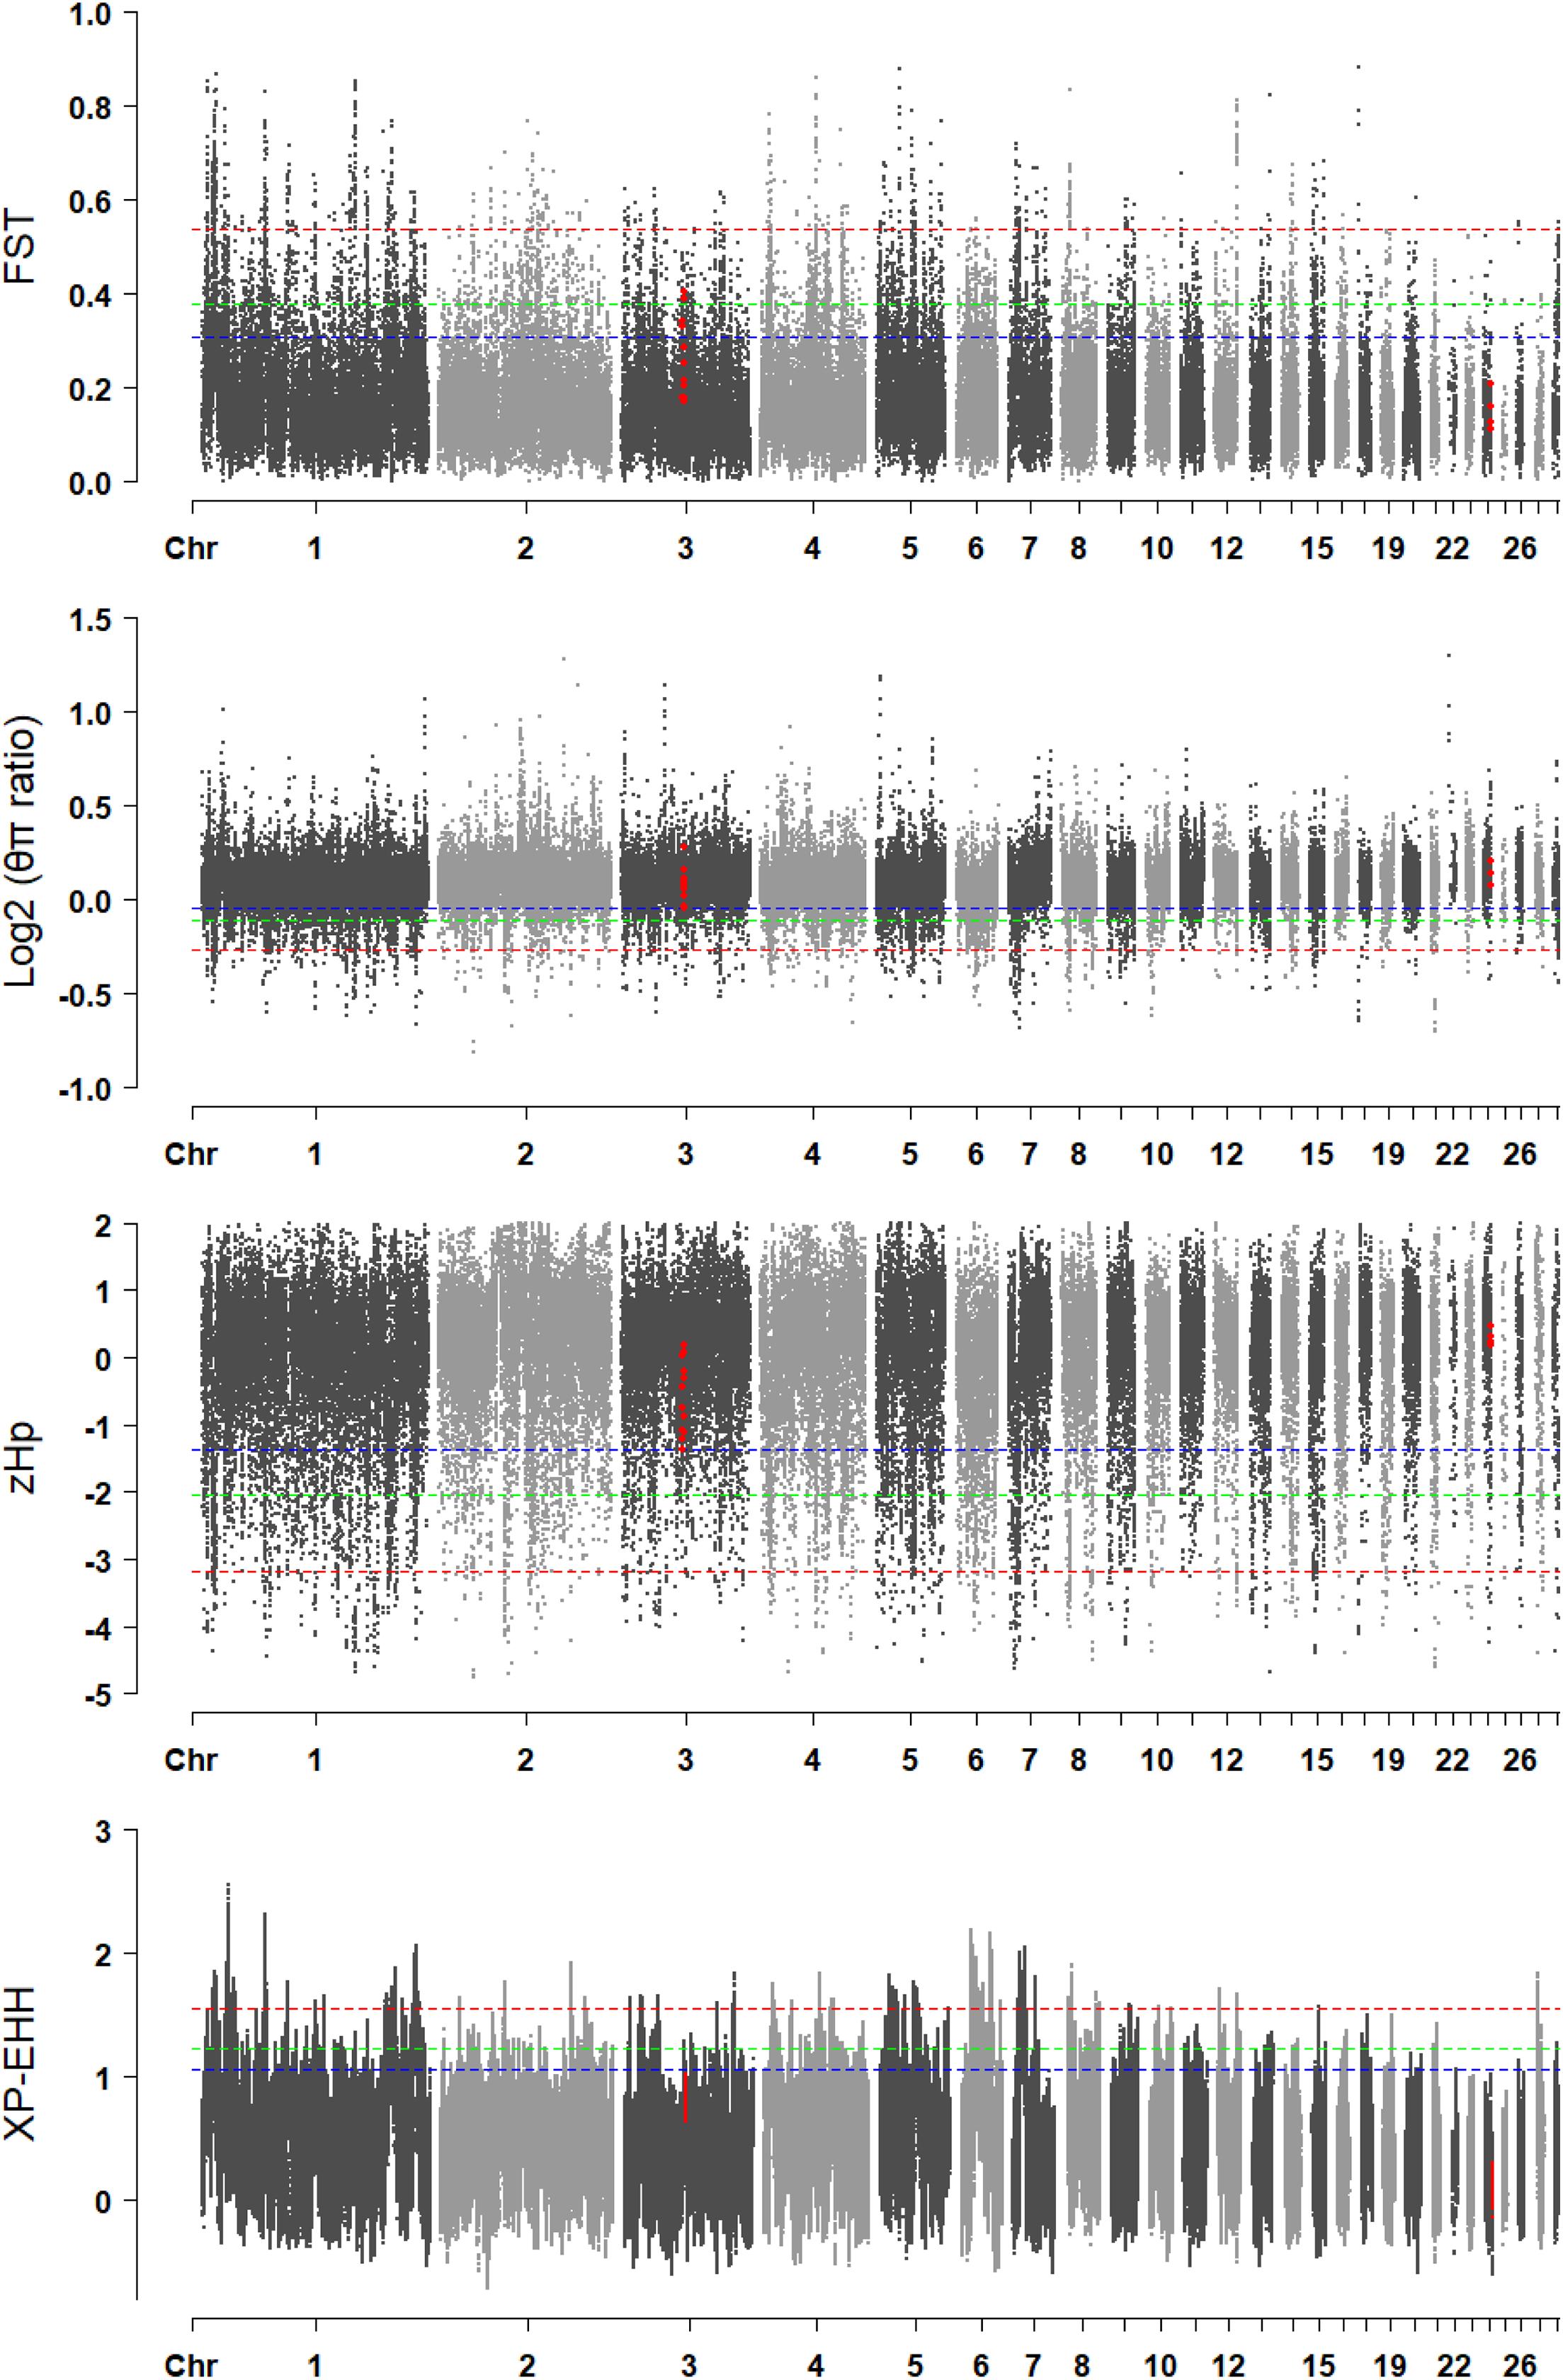
Figure 7. The visualization of the selective sweep analysis. The horizontal blue, green, and red lines indicate the thresholds for 10% genome-wide significance, 5% genome-wide significance, and 1% genome-wide significance, respectively.
Genotype imputation has been widely used in GWAS to boost power (Spencer et al., 2009). This method can aid in identifying many novel SNPs and QTLs associated with phenotypes of interest. In previous GWAS, imputation from low-density SNP chip genotypes to the WGS level was implemented in chickens (Huang et al., 2018; Li D. et al., 2020), pigs (Yan et al., 2018), and cattle (Höglund et al., 2015). Imputed genotypes with sufficiently high imputation accuracy are necessary to obtain reliable results in follow-up analyses, such as GWAS. Ni et al. (2017) reported that the post-imputation filtering criterion should be 0.80 to ensure the high accuracy of the imputed WGS data. In the current study, the average allelic R2 value and the genotype concordance rate between the imputed and true genotypes were 0.89 and 0.91, respectively.
The heritability estimates for the six weight traits were moderate to high (0.30–0.39), showing high consistency with previous reports (Demeure et al., 2013). However, the estimates were lower than 0.56 in medium-growing broilers at 44 days of age (Xu et al., 2016). Our heritability estimate for ThP was 0.22, which was slightly lower than 0.37, as reported by Demeure et al. (2013). The likely reason is the genetic background difference in the chicken lines.
A 24.08 Kb QTL on GGA24 (GGA24: 5.73–5.75 Mb) was identified for the six weight traits. According to the Animal QTL Database8, this region has been recorded as a QTL (GGA24: 4.3–6.0 Mb) for BW08 in an F2 population (Taiwan local chicken line L2 × experimental Rhode Island Red line; Lien et al., 2017). This region contains only one candidate gene (DRD2), which encodes the D2 subtype of the dopamine receptor. The gene is highly expressed in the basal ganglia (Missale et al., 1998), which is a control center for movement. Neurotransmission mediated by DRD2 is known to have a key role in the control of movement. DRD2 TaqIA polymorphisms were correlated with body mass in previous studies (Spitz et al., 2000; Thomas et al., 2001). The density of the DRD2 receptors can affect food reinforcement to influence energy intake (Epstein et al., 2007). Down-regulation of DRD2 receptors leads to increased food intake and weight gain (Epstein et al., 2007). In the current study, significant differences in weight traits and feed intake were observed between birds with different genotypes. The mRNA expression of DRD2 in the thigh muscle was not detected by quantitative polymerase chain reaction (Q-PCR; data not shown). The Galbase data shows that DRD2 has high mRNA expression in chickens’ brain tissue9. Therefore, brain tissue should be obtained and tested in a future study.
We focused specifically on the thigh traits in the carcass composition traits in the current study. A 42.52 kb genomic region on GGA3 (GGA3: 53.03–53.08 Mb) was identified for WThP and ThP. This QTL was not reported previously. This region contained only one candidate gene (ADGRG6), which encodes the G-protein-coupled receptor 126. Ravenscroft et al. (2015) proved that ADGRG6 is critical for myelination of peripheral nerves in humans and mutations of ADGRG6 are responsible for severe arthrogryposis multiplex congenita. Soranzo et al. (2009) found that mutations in ADGRG6 are related to trunk length, hip axis length, and height. Numerous studies have shown that ADGRG6 is associated with adult height and pediatric stature (Hirschhorn et al., 2001; Xu et al., 2002; Gudbjartsson et al., 2008; Lettre et al., 2008; Sovio et al., 2009; Liu et al., 2010; Zhao et al., 2010). Kou et al. (2013) found that ADGRG6 was highly expressed in cartilage, and the knockdown of ADGRG6 in zebrafish caused delayed ossification of the developing spine. It is believed that ADGRG6 may affect both adolescent idiopathic scoliosis susceptibility and height through abnormal spinal development and/or growth. Karner et al. (2015) also proved that the loss of ADGRG6 in osteochondroprogenitor cells alters cartilage biology and spinal column development.
Regarding weight traits, the significant region of BW42, CW, and EW detected by multivariate GWAS was consistent with that detected by univariate GWAS. The significance levels of BW42, CW, EW, WThW, ThW, and ThMW were lower in the multivariate GWAS than the univariate GWAS. Therefore, it was believed that the significant region on the GGA24 had a greater impact on the overall body weight of the chicken than on the thigh weight. Regarding carcass composition traits, the significant region of WThP and ThP detected by multivariate GWAS was consistent with that detected by univariate GWAS. Therefore, it was believed that the significant region on the GGA3 had an impact on WThP, ThP, and ThMP.
It was interesting that significant differences in thigh composition traits were observed between birds with different genotypes of the associated variants. The flavor of thigh meat is usually better than that of the breast muscle because its intramuscular fat content is three times higher than that of the latter (Zhao et al., 2007; Fu et al., 2014). The significant SNPs could be used in genomic selection programs to improve the percentage of thigh meat (Zhang et al., 2015).
In the current study, the results of the Bayesian analysis and the estimation of the SNP effect size verified the GWAS results. The SNP effect sizes of the significant SNPs in GWAS of the weight and carcass composition traits reached the top 0.24 and 0.26% of the whole genome SNPs, respectively. Among all traits, the top 1-Mb sliding windows, which overlapped with the significant regions in GWAS, explained 0.95–4.41% of genetic variation and 0.29–1.13% of phenotypic variation. In contrast, the remaining 1-Mb sliding window explained no more than 0.24% of genetic variation and no more than 0.08% of phenotypic variation.
In the study by Yoshida et al. (2017), the genes located in the top ten 1-Mb windows were identified as strong functional candidate genes, and the top window for the growth traits explained 3.71 and 3.61% of genetic variance, respectively. In a study of a pure line of broilers, the window with the largest effect for the bodyweight, breast meat, and leg score explained 2.5, 1.14, and 1.12% of the genetic variation, respectively (Fragomeni Bde et al., 2014).
In the current study, the phylogenetic tree indicated genetic differentiation in DRD2 and ADGRG6 between the Line B chickens and the small-sized breeds because the former could not be completely separated from the Chahua and Daweishan mini chickens when five random-selected 100 Kb regions were used. In the selective sweep analysis of chickens, windows with thresholds of 1 or 5% outliers were typically identified as candidate regions (Yin et al., 2019; Li W. et al., 2020; Luo et al., 2020; Weng et al., 2020). The FST values in ADGRG6 reached the top 5% threshold, whereas the log2(πratio) values and zHp values reached the top 10% threshold of the whole genome. ADGRG6 showed some degree of genetic and nucleotide differentiation between the fast-growing Line B chickens and the Chahua and Daweishan mini chickens. However, the DRD2 showed no related signals. Since the significant SNPs were located in the introns and the upstream and intergenic regions of the candidate genes, it is challenging to investigate causative mutations, which will be performed in a future study.
In summary, the genomic heritability estimates of nine chicken carcass traits ranged from moderate to high (0.21 to 0.39). Twelve genome-wide significant SNPs and 118 suggestively significant SNPs were detected. One 24.08 Kb region (GGA24: 5.73–5.75 Mb) for six weight traits and one 42.52 Kb region (GGA3: 53.03–53.08 Mb) for three thigh-related carcass traits were identified. The significant SNPs could be used in genomic selection programs to improve the weight traits and thigh composition traits. In the QTL regions, DRD2 was the only major-effect candidate gene for weight traits, and ADGRG6 was the only major-effect candidate gene for carcass composition traits. Some degree of genetic differentiation in ADGRG6 between large-sized and small-sized breeds was observed. Our results supply essential information for causative mutation identification of carcass traits in broilers.
The datasets presented in this study can be found in online repositories. The names of the repository and accession numbers can be found below: https://bigd.big.ac.cn/gsa, CRA002454 and CRA004023.
All experimental procedures with broilers were performed according to the Guidelines for Experimental Animals established by the Ministry of Science and Technology (Beijing, China). Ethical approval on animal survival was given by the animal welfare and ethics committee of the Institute of Animal Sciences (IAS) and the Chinese Academy of Agricultural Sciences (CAAS, Beijing, China) with the following reference number: IAS2019–44.
XY contributed to data collection, data analysis and interpretation, and wrote the manuscript. JS contributed to data collection and manuscript revision. GZ, MZ, and JW designed the research and revised manuscript. WL, XT, FF, and DL contributed to the chicken raising, sampling, and data collection. RL designed the research and contributed to data collection, data analysis and interpretation, and wrote the manuscript. All authors submitted comments on the draft and approved the final manuscript.
This research was supported by grants from the National Natural Science Foundation of China (31772591), the Agricultural Science and Technology Innovation Program (CAAS-ZDRW202005), and the joint research project of white feather broiler breeding of the Ministry of Agriculture and Rural Affairs of the People Republic of China (19200133).
FF and DL were employed by the Foshan Gaoming Xinguang Agricultural and Animal Industrials Corporation.
The remaining authors declare that the research was conducted in the absence of any commercial or financial relationships that could be construed as a potential conflict of interest.
The Supplementary Material for this article can be found online at: https://www.frontiersin.org/articles/10.3389/fgene.2021.645107/full#supplementary-material
Barbato, M., Orozco-Terwengel, P., Tapio, M., and Bruford, M. W. (2015). SNeP: a tool to estimate trends in recent effective population size trajectories using genome-wide SNP data. Front. Genet. 6:109. doi: 10.3389/fgene.2015.00109
Barrett, J. C., Fry, B., Maller, J., and Daly, M. J. (2005). Haploview: analysis and visualization of LD and haplotype maps. Bioinformatics 21, 263–265. doi: 10.1093/bioinformatics/bth457
Browning, B. L., Zhou, Y., and Browning, S. R. (2018). A one-penny imputed genome from next-generation reference panels. Am. J. Hum. Genet. 103, 338–348. doi: 10.1016/j.ajhg.2018.07.015
Canela-Xandri, O., Law, A., Gray, A., Woolliams, J. A., and Tenesa, A. (2015). A new tool called DISSECT for analysing large genomic data sets using a Big Data approach. Nat. Commun. 6:10162.
Claire D’Andre, H., Paul, W., Shen, X., Jia, X., Zhang, R., Sun, L., et al. (2013). Identification and characterization of genes that control fat deposition in chickens. J. Anim. Sci. Biotechnol. 4:43.
Danecek, P., Auton, A., Abecasis, G., Albers, C. A., Banks, E., Depristo, M. A., et al. (2011). The variant call format and VCFtools. Bioinformatics 27, 2156–2158. doi: 10.1093/bioinformatics/btr330
Demeure, O., Duclos, M. J., Bacciu, N., Le Mignon, G., Filangi, O., Pitel, F., et al. (2013). Genome-wide interval mapping using SNPs identifies new QTL for growth, body composition and several physiological variables in an F 2 intercross between fat and lean chicken lines. Genet. Sel. Evol. 45:36.
DePristo, M. A., Banks, E., Poplin, R., Garimella, K. V., Maguire, J. R., Hartl, C., et al. (2011). A framework for variation discovery and genotyping using next-generation DNA sequencing data. Nat. Genet. 43, 491–498.
Epstein, L. H., Temple, J. L., Neaderhiser, B. J., Salis, R. J., Erbe, R. W., and Leddy, J. J. (2007). Food reinforcement, the dopamine D2 receptor genotype, and energy intake in obese and nonobese humans. Behav. Neurosci. 121, 877–886. doi: 10.1037/0735-7044.121.5.877
Flisar, T., Malovrh, Š, Terèiè, D., Holcman, A., and Kovaè, M. (2014). Thirty-four generations of divergent selection for 8-week body weight in chickens. Poultry Sci. 93, 16–23. doi: 10.3382/ps.2013-03464
Fragomeni Bde, O., Misztal, I., Lourenco, D. L., Aguilar, I., Okimoto, R., and Muir, W. M. (2014). Changes in variance explained by top SNP windows over generations for three traits in broiler chicken. Front. Genet. 5:332. doi: 10.3389/fgene.2014.00332
Fu, R. Q., Liu, R. R., Zhao, G. P., Zheng, M. Q., Chen, J. L., and Wen, J. (2014). Expression profiles of key transcription factors involved in lipid metabolism in Beijing-You chickens. Gene 537, 120–125. doi: 10.1016/j.gene.2013.07.109
Gilmour, A. R., Gogel, B. J., Cullis, B. R., Thompson, R., et al. (2009). ASReml User Guide Release 3.0. Hemel Hempstead: VSN International Ltd.
Gu, X., Feng, C., Ma, L., Song, C., Wang, Y., Da, Y., et al. (2011). Genome-Wide association study of body weight in chicken F2 resource population. PLoS One 6:e21872. doi: 10.1371/journal.pone.0021872
Gudbjartsson, D. F., Walters, G. B., Thorleifsson, G., Stefansson, H., Halldorsson, B. V., Zusmanovich, P., et al. (2008). Many sequence variants affecting diversity of adult human height. Nat. Genet. 40, 609–615. doi: 10.1038/ng.122
Habier, D., Fernando, R. L., Kizilkaya, K., and Garrick, D. J. (2011). Extension of the Bayesian alphabet for genomic selection. BMC Bioinformatics 12:186. doi: 10.1186/1471-2105-12-186
Hall, S. J. G. (2016). Effective population sizes in cattle, sheep, horses, pigs and goats estimated from census and herdbook data. Animal 10, 1778–1785. doi: 10.1017/s1751731116000914
Hirschhorn, J. N., Lindgren, C. M., Daly, M. J., Kirby, A., Schaffner, S. F., Burtt, N. P., et al. (2001). Genomewide linkage analysis of stature in multiple populations reveals several regions with evidence of linkage to adult height. Am. J. Hum. Genet. 69, 106–116. doi: 10.1086/321287
Höglund, J. K., Buitenhuis, B., Guldbrandtsen, B., Lund, M. S., and Sahana, G. (2015). Genome-wide association study for female fertility in Nordic Red cattle. BMC Genetics 16:110. doi: 10.1186/s12863-015-0269-x
Huang, S., He, Y., Ye, S., Wang, J., Yuan, X., Zhang, H., et al. (2018). Genome-wide association study on chicken carcass traits using sequence data imputed from SNP array. J. Appl. Genet. 59, 335–344. doi: 10.1007/s13353-018-0448-3
Karner, C. M., Long, F., Solnica-Krezel, L., Monk, K. R., and Gray, R. S. (2015). Gpr126/Adgrg6 deletion in cartilage models idiopathic scoliosis and pectus excavatum in mice. Hum. Mol. Genet. 24, 4365–4373. doi: 10.1093/hmg/ddv170
Kou, I., Takahashi, Y., Johnson, T. A., Takahashi, A., Guo, L., Dai, J., et al. (2013). Genetic variants in GPR126 are associated with adolescent idiopathic scoliosis. Nat. Genet. 45:676.
Kumar, S., Stecher, G., Li, M., Knyaz, C., and Tamura, K. (2018). MEGA X: molecular evolutionary genetics analysis across computing platforms. Mol. Biol. Evol. 35, 1547–1549. doi: 10.1093/molbev/msy096
Lettre, G., Jackson, A. U., Gieger, C., Schumacher, F. R., Berndt, S. I., Sanna, S., et al. (2008). Identification of ten loci associated with height highlights new biological pathways in human growth. Nat. Genet. 40, 584–591. doi: 10.1038/ng.125
Li, D., Sun, G., Zhang, M., Cao, Y., Zhang, C., Fu, Y., et al. (2020). Breeding history and candidate genes responsible for black skin of Xichuan black-bone chicken. BMC Genomics 21:511. doi: 10.1186/s12864-020-06900-8
Li, H. (2013). Aligning sequence reads, clone sequences and assembly contigs with BWA-MEM. arXiv [preprint] arXiv:1303.3997
Li, W., Liu, R., Zheng, M., Feng, F., Liu, D., Guo, Y., et al. (2020). New insights into the associations among feed efficiency, metabolizable efficiency traits and related QTL regions in broiler chickens. J. Anim. Sci. Biotechnol. 11:65.
Li, W. J., Zhao, G. P., Chen, J. L., Zheng, M. Q., and Wen, J. (2009). Influence of dietary vitamin E supplementation on meat quality traits and gene expression related to lipid metabolism in the Beijing-you chicken. Br. Poultry Sci. 50, 188–198. doi: 10.1080/00071660902755409
Lien, C.-Y., Tixier-Boichard, M., Wu, S.-W., Wang, W.-F., Ng, C. S., and Chen, C.-F. (2017). Detection of QTL for traits related to adaptation to sub-optimal climatic conditions in chickens. Genet. Sel. Evol. 49:39.
Liu, J. Z., Medland, S. E., Wright, M. J., Henders, A. K., Heath, A. C., Madden, P. a. F., et al. (2010). Genome-wide association study of height and body mass index in Australian twin families. Twin Res. Hum. Genet. 13, 179–193. doi: 10.1375/twin.13.2.179
Liu, R., Sun, Y., Zhao, G., Wang, F., Wu, D., Zheng, M., et al. (2013). Genome-Wide association study identifies loci and candidate genes for body composition and meat quality traits in Beijing-You chickens. PLoS One 8:e61172. doi: 10.1371/journal.pone.0061172
Liu, R., Sun, Y., Zhao, G., Wang, H., Zheng, M., Li, P., et al. (2015). Identification of loci and genes for growth related traits from a genome-wide association study in a slow- × fast-growing broiler chicken cross. Genes Genom. 37, 829–836. doi: 10.1007/s13258-015-0314-1
Liu, R., Xing, S., Wang, J., Zheng, M., Cui, H., Crooijmans, R. P. M. A., et al. (2019). A new chicken 55K SNP genotyping array. BMC Genomics 20:410. doi: 10.1186/s12864-019-5736-8
Luo, W., Luo, C., Wang, M., Guo, L., Chen, X., Li, Z., et al. (2020). Genome diversity of Chinese indigenous chicken and the selective signatures in Chinese gamecock chicken. Sci. Rep. 10:14532.
Missale, C., Nash, S. R., Robinson, S. W., Jaber, M., and Caron, M. G. (1998). Dopamine receptors: from structure to function. Physiol. Rev. 78, 189–225.
Ni, G., Cavero, D., Fangmann, A., Erbe, M., and Simianer, H. (2017). Whole-genome sequence-based genomic prediction in laying chickens with different genomic relationship matrices to account for genetic architecture. Genet. Sel. Evol. 49:8.
Olszewski, P. K., Rozman, J., Jacobsson, J. A., Rathkolb, B., Strömberg, S., Hans, W., et al. (2012). Neurobeachin, a regulator of synaptic protein targeting, is associated with body fat mass and feeding behavior in mice and body-mass index in humans. PLoS Genet. 8:e1002568. doi: 10.1371/journal.pgen.1002568
Plassais, J., Rimbault, M., Williams, F. J., Davis, B. W., Schoenebeck, J. J., and Ostrander, E. A. (2017). Analysis of large versus small dogs reveals three genes on the canine X chromosome associated with body weight, muscling and back fat thickness. PLoS Genet. 13:e1006661. doi: 10.1371/journal.pgen.1006661
Ravenscroft, G., Nolent, F., Rajagopalan, S., Meireles, A. M., Paavola, K. J., Gaillard, D., et al. (2015). Mutations of GPR126 are responsible for severe arthrogryposis multiplex congenita. Am. J. Hum. Genet. 96, 955–961.
Rong, H., Chen, X., Xiong, B., Wan, Q., Cao, Z., Chen, B., et al. (2011). Study on the germplasm characteristic of Yunnan Daweishan mini chickens. J. Yunnan Agric. Univ. 26, 48–63.
Sabeti, P. C., Varilly, P., Fry, B., Lohmueller, J., Hostetter, E., Cotsapas, C., et al. (2007). Genome-wide detection and characterization of positive selection in human populations. Nature 449, 913–918. doi: 10.1038/nature06250
Soranzo, N., Rivadeneira, F., Chinappen-Horsley, U., Malkina, I., Richards, J. B., Hammond, N., et al. (2009). Meta-analysis of genome-wide scans for human adult stature identifies novel Loci and associations with measures of skeletal frame size. PLoS Genet. 5:e1000445. doi: 10.1371/journal.pgen.1000445
Sovio, U., Bennett, A. J., Millwood, I. Y., Molitor, J., O’reilly, P. F., Timpson, N. J., et al. (2009). Genetic determinants of height growth assessed longitudinally from infancy to adulthood in the northern Finland birth cohort 1966. PLoS Genet. 5:e1000409. doi: 10.1371/journal.pgen.1000409
Spencer, C. C. A., Su, Z., Donnelly, P., and Marchini, J. (2009). Designing genome-wide association studies: sample size, power, imputation, and the choice of genotyping chip. PLoS Genetics 5:e1000477. doi: 10.1371/journal.pgen.1000477
Spitz, M. R., Detry, M. A., Pillow, P., Hu, Y., Amos, C. I., Hong, W. K., et al. (2000). Variant alleles of the D2 dopamine receptor gene and obesity. Nutr. Res. 20, 371–380. doi: 10.1016/s0271-5317(00)00130-5
Szpiech, Z. A., and Hernandez, R. D. (2014). selscan: an efficient multithreaded program to perform EHH-based scans for positive selection. Mol. Biol. Evol. 31, 2824–2827. doi: 10.1093/molbev/msu211
Takasuga, A., Sato, K., Nakamura, R., Saito, Y., Sasaki, S., Tsuji, T., et al. (2015). Non-synonymous FGD3 variant as positional candidate for disproportional tall stature accounting for a carcass weight QTL (CW-3) and skeletal dysplasia in Japanese black cattle. PLoS Genet. 11:e1005433. doi: 10.1371/journal.pgen.1005433
Thomas, G. N., Critchley, J. a. J. H., Tomlinson, B., Cockram, C. S., and Chan, J. C. N. (2001). Relationships between the taqI polymorphism of the dopamine D2 receptor and blood pressure in hyperglycaemic and normoglycaemic Chinese subjects. Clin. Endocrinol. 55, 605–611. doi: 10.1046/j.1365-2265.2001.01404.x
Van den Berg, S., Vandenplas, J., Van Eeuwijk, F. A., Bouwman, A. C., Lopes, M. S., and Veerkamp, R. F. (2019). Imputation to whole-genome sequence using multiple pig populations and its use in genome-wide association studies. Genet. Sel. Evol. 51:2.
Van der Auwera, G. A., Carneiro, M. O., Hartl, C., Poplin, R., Del Angel, G., Levy-Moonshine, A., et al. (2013). From FastQ data to high confidence variant calls: the genome analysis toolkit best practices pipeline. Curr. Protoc. Bioinform. 43, 11.10.11–11.10.33.
Van Laere, A.-S., Nguyen, M., Braunschweig, M., Nezer, C., Collette, C., Moreau, L., et al. (2003). A regulatory mutation in IGF2 causes a major QTL effect on muscle growth in the pig. Nature 425, 832–836. doi: 10.1038/nature02064
Wang, K., Li, M., and Hakonarson, H. (2010). ANNOVAR: functional annotation of genetic variants from high-throughput sequencing data. Nucleic Acids Res. 38:e164. doi: 10.1093/nar/gkq603
Wang, Y., Cao, X., Luo, C., Sheng, Z., Zhang, C., Bian, C., et al. (2020). Multiple ancestral haplotypes harboring regulatory mutations cumulatively contribute to a QTL affecting chicken growth traits. Commun. Biol. 3:472.
Weir, B. S., and Cockerham, C. C. (1984). Estimating F-statistics for the analysis of population structure. Evolution 38, 1358–1370. doi: 10.1111/j.1558-5646.1984.tb05657.x
Weng, Z., Xu, Y., Li, W., Chen, J., Zhong, M., Zhong, F., et al. (2020). Genomic variations and signatures of selection in Wuhua yellow chicken. PLoS One 15:e0241137. doi: 10.1371/journal.pone.0241137
Xu, J., Bleecker, E. R., Jongepier, H., Howard, T. D., Koppelman, G. H., Postma, D. S., et al. (2002). Major recessive gene (s) with considerable residual polygenic effect regulating adult height: confirmation of genomewide scan results for chromosomes 6, 9, and 12. Am. J. Hum. Genet. 71, 646–650. doi: 10.1086/342216
Xu, Z., Ji, C., Zhang, Y., Zhang, Z., Nie, Q., Xu, J., et al. (2016). Combination analysis of genome-wide association and transcriptome sequencing of residual feed intake in quality chickens. BMC Genomics 17:594. doi: 10.1186/s12864-016-2861-5
Yan, G., Guo, T., Xiao, S., Zhang, F., Xin, W., Huang, T., et al. (2018). Imputation-based whole-genome sequence association study reveals constant and novel loci for hematological traits in a large-scale swine F2 resource population. Front. Genet. 9:401. doi: 10.3389/fgene.2018.00401
Yin, H., Li, D., Wang, Y., and Zhu, Q. (2019). Whole-genome resequencing analysis of Pengxian Yellow Chicken to identify genome-wide SNPs and signatures of selection. 3 Biotech 9:383.
Yoshida, G. M., Lhorente, J. P., Carvalheiro, R., and Yáñez, J. M. (2017). Bayesian genome-wide association analysis for body weight in farmed Atlantic salmon (Salmo salar L.). Anim. Genet. 48, 698–703. doi: 10.1111/age.12621
Zhang, Z., Erbe, M., He, J., Ober, U., Gao, N., Zhang, H., et al. (2015). Accuracy of whole-genome prediction using a genetic architecture-enhanced variance-covariance matrix. G3 Genes Genom. Genet. 5, 615–627. doi: 10.1534/g3.114.016261
Zhao, G. P., Chen, J. L., Zheng, M. Q., Wen, J., and Zhang, Y. (2007). Correlated responses to selection for increased intramuscular fat in a Chinese quality chicken line. Poultry Sci. 86, 2309–2314. doi: 10.1093/ps/86.11.2309
Zhao, J., Li, M., Bradfield, J. P., Zhang, H., Mentch, F. D., Wang, K., et al. (2010). The role of height-associated loci identified in genome wide association studies in the determination of pediatric stature. BMC Med. Genet. 11:96. doi: 10.1186/1471-2350-11-96
Keywords: carcass composition, thigh meat, weight trait, genome-wide association study, imputation, candidate genes
Citation: Yang X, Sun J, Zhao G, Li W, Tan X, Zheng M, Feng F, Liu D, Wen J and Liu R (2021) Identification of Major Loci and Candidate Genes for Meat Production-Related Traits in Broilers. Front. Genet. 12:645107. doi: 10.3389/fgene.2021.645107
Received: 22 December 2020; Accepted: 02 March 2021;
Published: 30 March 2021.
Edited by:
Zhe Zhang, South China Agricultural University, ChinaReviewed by:
Luke Kramer, Iowa State University, United StatesCopyright © 2021 Yang, Sun, Zhao, Li, Tan, Zheng, Feng, Liu, Wen and Liu. This is an open-access article distributed under the terms of the Creative Commons Attribution License (CC BY). The use, distribution or reproduction in other forums is permitted, provided the original author(s) and the copyright owner(s) are credited and that the original publication in this journal is cited, in accordance with accepted academic practice. No use, distribution or reproduction is permitted which does not comply with these terms.
*Correspondence: Ranran Liu, bGl1cmFucmFuQGNhYXMuY24=
†These authors have contributed equally to this work
Disclaimer: All claims expressed in this article are solely those of the authors and do not necessarily represent those of their affiliated organizations, or those of the publisher, the editors and the reviewers. Any product that may be evaluated in this article or claim that may be made by its manufacturer is not guaranteed or endorsed by the publisher.
Research integrity at Frontiers
Learn more about the work of our research integrity team to safeguard the quality of each article we publish.