 Junfang Jiang
 Yuhao Cao
 Huili Shan1
 Xuemei Song
95% of researchers rate our articles as excellent or good
Learn more about the work of our research integrity team to safeguard the quality of each article we publish.
Find out more
ORIGINAL RESEARCH article
Front. Genet. , 20 May 2021
Sec. Livestock Genomics
Volume 12 - 2021 | https://doi.org/10.3389/fgene.2021.642552
This article is part of the Research Topic Multi-Layered Genome-Wide Association/Prediction in Animals View all 10 articles
Body size is an important indicator of growth and health in sheep. In the present study, we performed Genome-Wide Association Studies (GWAS) to detect significant single-nucleotide polymorphisms (SNPs) associated with Hu sheep’s body size. After genotyping parental (G1) and offspring (G2) generation of the nucleus herd for meat production of Hu sheep and conducting GWAS on the body height, chest circumference, body length, tail length, and tail width of the two groups, 5 SNPs associated with body height and 4 SNPs correlated with chest circumference were identified at the chromosomal significance level. No SNPs were significantly correlated to body length, tail length, and width. Four out of the 9 SNPs were found to be located within the 4 genes. KITLG and CADM2 are considered as candidate functional genes related to body height; MCTP1 and COL4A6 are candidate functional genes related to chest circumference. The 9 SNPs found in GWAS were verified using the G3 generation of the nucleus herd for meat production. Nine products were amplified around the 9 sites, and 29 SNPs were found; 3 mutation sites, G > C mutation at 134 bp downstream of s554331, T > G mutation at 19 bp upstream of s26859.1, and A > G mutation at 81 bp downstream of s26859.1, were significantly correlated to the body height. Dual-luciferase reporter gene experiments showed that the 3 SNPs could significantly impact dual-luciferase and gene transcription activity.
In sheep, body size has been widely recognized as an important indicator of growth and health (Kemper et al., 2012), which impacts animal feeding and management as well as adaptation to the environment. Mature body size has been extensively studied in humans, cattle, and other domestic animals but not in sheep (Posbergh and Huson, 2021). In sheep, the mature body size is more polygenic than in other domesticated animals, which suggests that the development of genomic trait selection might be the optimal option for evaluating body size in sheep (Posbergh and Huson, 2021).
GWAS (Genome-wide association study) is a method that uses millions of single nucleotide polymorphism (SNP) in genomes as molecular genetic markers to conduct control analysis or correlation analysis at the whole genome level so as to investigate the genetic mutation of complex traits. This technique has been applied to screen the SNPs of agricultural animals’ major traits.
Eight common gene candidates, i.e., GRID1, ALOX12, SLC16A13, SLC16A11, TP53, STX8, NTN1, and ZNF521, were identified from GWAS for body size traits in crossbreeding sheep between Frizarta sheep and East Friesian sheep (Kominakis et al., 2017). In Hulun Buir sheep, 13 candidate genes, including SMURF2, FBF1, DTNBP1, SETD7, and RBM11, have been associated with fat metabolism, and SMARCA5 and GAB1 were associated with body size (Zhang et al., 2019). In addition, MARCA5 and GAB1 have been found to be related to sheep’s body size. Height has been associated with 12 SNPs across six chromosomes. Ear length was associated with a single locus on chromosome 3.
Hu sheep, which are mainly housed all year round, are a special type of sheep that is only found in China. Hu sheep are characterized by early sexual maturity, high fecundity, and rapid growth. It is famous for its beautiful lamb skin. Hu sheep also have good meat quality, strong resistance to stress, and resistance to rough feeding (Yue, 1996). Until now, no GWAS study on the body size traits of Hu sheep has been reported.
In this study, GWAS were applied to screen and select candidate SNPs for traits and body size of meat-type Hu sheep. Moreover, the candidate SNPs associated with Hu sheep’s body size were verified among meat-type Hu sheep’ offspring of G3 generation.
The GWAS study included 240 Hu sheep from G1 and G2 generation of meat-type Hu sheep nucleus herd in Huzhou Taihu Lake Culture Cooperative by semi-open nucleus breeding. The SNP herd verification included 202 Hu sheep from the G3 generation of Hu sheep nucleus herd in Hangzhou Pangda Agricultural Development Co., Ltd. The breeding and management of the Hu sheep included in the study were conducted according to the standard methods of breeding and management of Hu sheep.
Selected body size traits included body height, chest circumference, body length, tail length, and tail width. The body height and body length were measured using a measuring stick (Zhengzhou Zhimuren Machinery Equipment Co., Ltd.) with an accuracy of 1 mm; chest circumference, tail length, and tail width were measured using a tape measure with an accuracy of 1 mm (Zhengzhou Zhimuren Machinery Equipment Co., Ltd.). Sheep were on horizontal ground, quiet and relaxed. The measurement methods were: (1) body length: the straight-line length from the front edge of the shoulder and foot bones to the back edge of the ischial tuberosity; (2) body height: the vertical length from the highest point of the bun to the ground; (3) chest circumference: the length of the circumference around the back edge of scapula; (4) tail length: the length from root to the top of the tail; (5) tail width: the widest range length of the tail. All measurements were performed by the same worker to minimize measurement errors caused by artificial reasons. Each sheep was measured at least 2 times, and the average was taken as the final measurement result. In addition, a total of 10 ml of blood was collected from each sheep’s jugular vein and then placed into EDTA anticoagulant tubes. DNA was extracted with phenol/chloroform extraction method and kept at −20°C.
Ovine SNP50 BeadChip was applied to genotype individual SNPs. The chip was co-developed by Illumina and experts from International Sheep Genomics Consortium. Plink 1.09 software was applied to conduct quality control on genotypes, phenotypic data and samples, analyze SNPs, and estimate genotypes and phenotypic value.
Population structure analysis was performed using admixture v1.3. A heat map of the values in the kinship matrix was created for the kinship plot. After quality control was performed on genotype data, GWAS on SNP was performed using the mixed linear model (MLM) of TASSEL5.0 software to identify SNPs related to the body size traits of the nucleus herd for meat production of Hu sheep. MLM model was adjusted according to 3 confounding factors, i.e., sex, herd structure, and genetic relationship. The following concrete model was used:
where Y is the phenotypic value of Hu sheep’s body size traits; β stands for fixed effects apart from SNP and herd structure; α stands for SNP effect; v represents herd structure effect; u stands for polygenic background effect; e represents residual effect, and X, S, Q, Z represent the incidence matrix of β, α, v, u, respectively.
When performing correlation analysis on the body size traits of Hu sheep, if errors were found in multiple hypothesis tests, a p-value was analyzed and adjusted. MLM was used to calculate F and p values, after which the results were verified. The following formula was applied:
where α stands for the level of significance and N for the number of independent SNPs used in the analysis. If the p-value at the SNP site was less than α, this SNP site was considered as significantly correlated to body size traits.
After SNPs sites were obtained with the performance of GWAS, base sequence 500 bp upstream and downstream of the significantly correlated SNP sites were downloaded. Next, BLAST research for the sequence was then performed with NCBI and Ovis aries_v4.0 (UCSC) to confirm the information of the location of SNP and adjacent genes.
Two hundred two ewes (from Hangzhou Pangda Agricultural Development Co., Ltd.) were included as subjects. PCR Amplification, product sequencing, and gene sequence analysis were used to perform SNPs detection. Base sequence 500 bp upstream and downstream of the SNP sites were significantly correlated to Hu sheep’s body height, and chest circumference was downloaded. Primers are shown in Supplementary Table 1. A total of 25 μL PCR reaction system was used for PCR amplification; the reaction procedure included: initial denaturation for 2 min at 94°C; denaturation for 30 s at 95°C, annealing for 30 s at 55°C, an extension for 30 s at 72°C, 35 circulations; extension for 10 min at 72°C, preservation at 4°C after the completion of the reaction. Direct sequencing was performed on the upstream and downstream primers for PCR products for each SNP site of each sample. Mutation Surveyor 5.02 was used to analyze the forward and reverse sequencing diagram of each ewe so as to confirm the mutation sites and mutation methods of the sequencing results of the amplified products at different sites in each sample. PopGen32 was used to calculate the gene frequency and genotype frequency of the SNPs. Hardy-Weinberg equilibrium test was performed to calculate Polymorphism information content (PIC).
The relationship between the different genotypes or haplotypes and body size traits of meat-type Hu sheep was evaluated by fitting a general linear model using the restricted maximum likelihood method in the Statistical Package for the Social Sciences (SPSS; version 20.0; SPSS Inc., Chicago, IL, United States). The general model used for Hu sheep body size traits was:
where Yij is the meat type Hu sheep body height or Chest circumference; μi is the least square mean; Mj is the fixed effect of the jth genotype or haplotypes, and eij is the random residual effect of each Hu sheep body height or chest circumference value.
HaploView version 4.2 was used to perform Linkage disequilibrium (LD) block and Haplotype analyses (Whitehead Institute for Biomedical Research, Cambridge, MA, United States). The D′-value of the lower 95% confidence interval in the analysis was used to define the haplotype block (Brym et al., 2005).
Candidate functional SNP loci significantly associated with body height in the wild-type and homozygous mutant sheep were selected. The different haplotypes amplification product was cloned into the pGL4.10 vector (Promega, United States), expressing a dual-luciferase gene (General Biosystems Corporation, Anhui, China). The vector was then transfected into sheep kidney cells. After 24 h, the luciferase activity was measured on a microplate reader using the Dual-Luciferase® reporter assay system (Promega, United States).
The relationship between the different genotypes or haplotypes and luciferase activities was evaluated by fitting a general linear model using the restricted maximum likelihood method in the Statistical Package for the Social Sciences (SPSS; version 20.0; SPSS Inc., Chicago, IL, United States). The general model used for luciferase activity value was:
where Yij is the luciferase activities; μi is the least square mean; Mj is the fixed effect of the jth genotype or haplotypes, and eij is the random residual effect of luciferase activities.
The descriptive statistical information of the phenotypic values related to the individual body size traits of 240 G1 and G2 generation Hu sheep has is shown in Supplementary Table 2. The descriptive statistical information of the phenotypic values related to the individual body size traits of 202 G3 generation Hu sheep is shown in Supplementary Table 3.
In the previous work, we focused on Genome-Wide Association Study of body weights in Hu Sheep. Here, we examined the relationship between the same population and body sizes traits. The result of data quality control can be found in the study by Cao et al. (2020).
A total of 226 Hu sheep were randomly selected from the group of Huzhou Taihu Lake Culture Cooperative. According to the population structure, the result was given by admixture v1.3 with K from 1 to 5, where the optimal K was 2 (Figure 1). Kinship estimation and Principle component analysis (PCA) of all individuals indicated the effectiveness of sampling (Figures 2A–D).
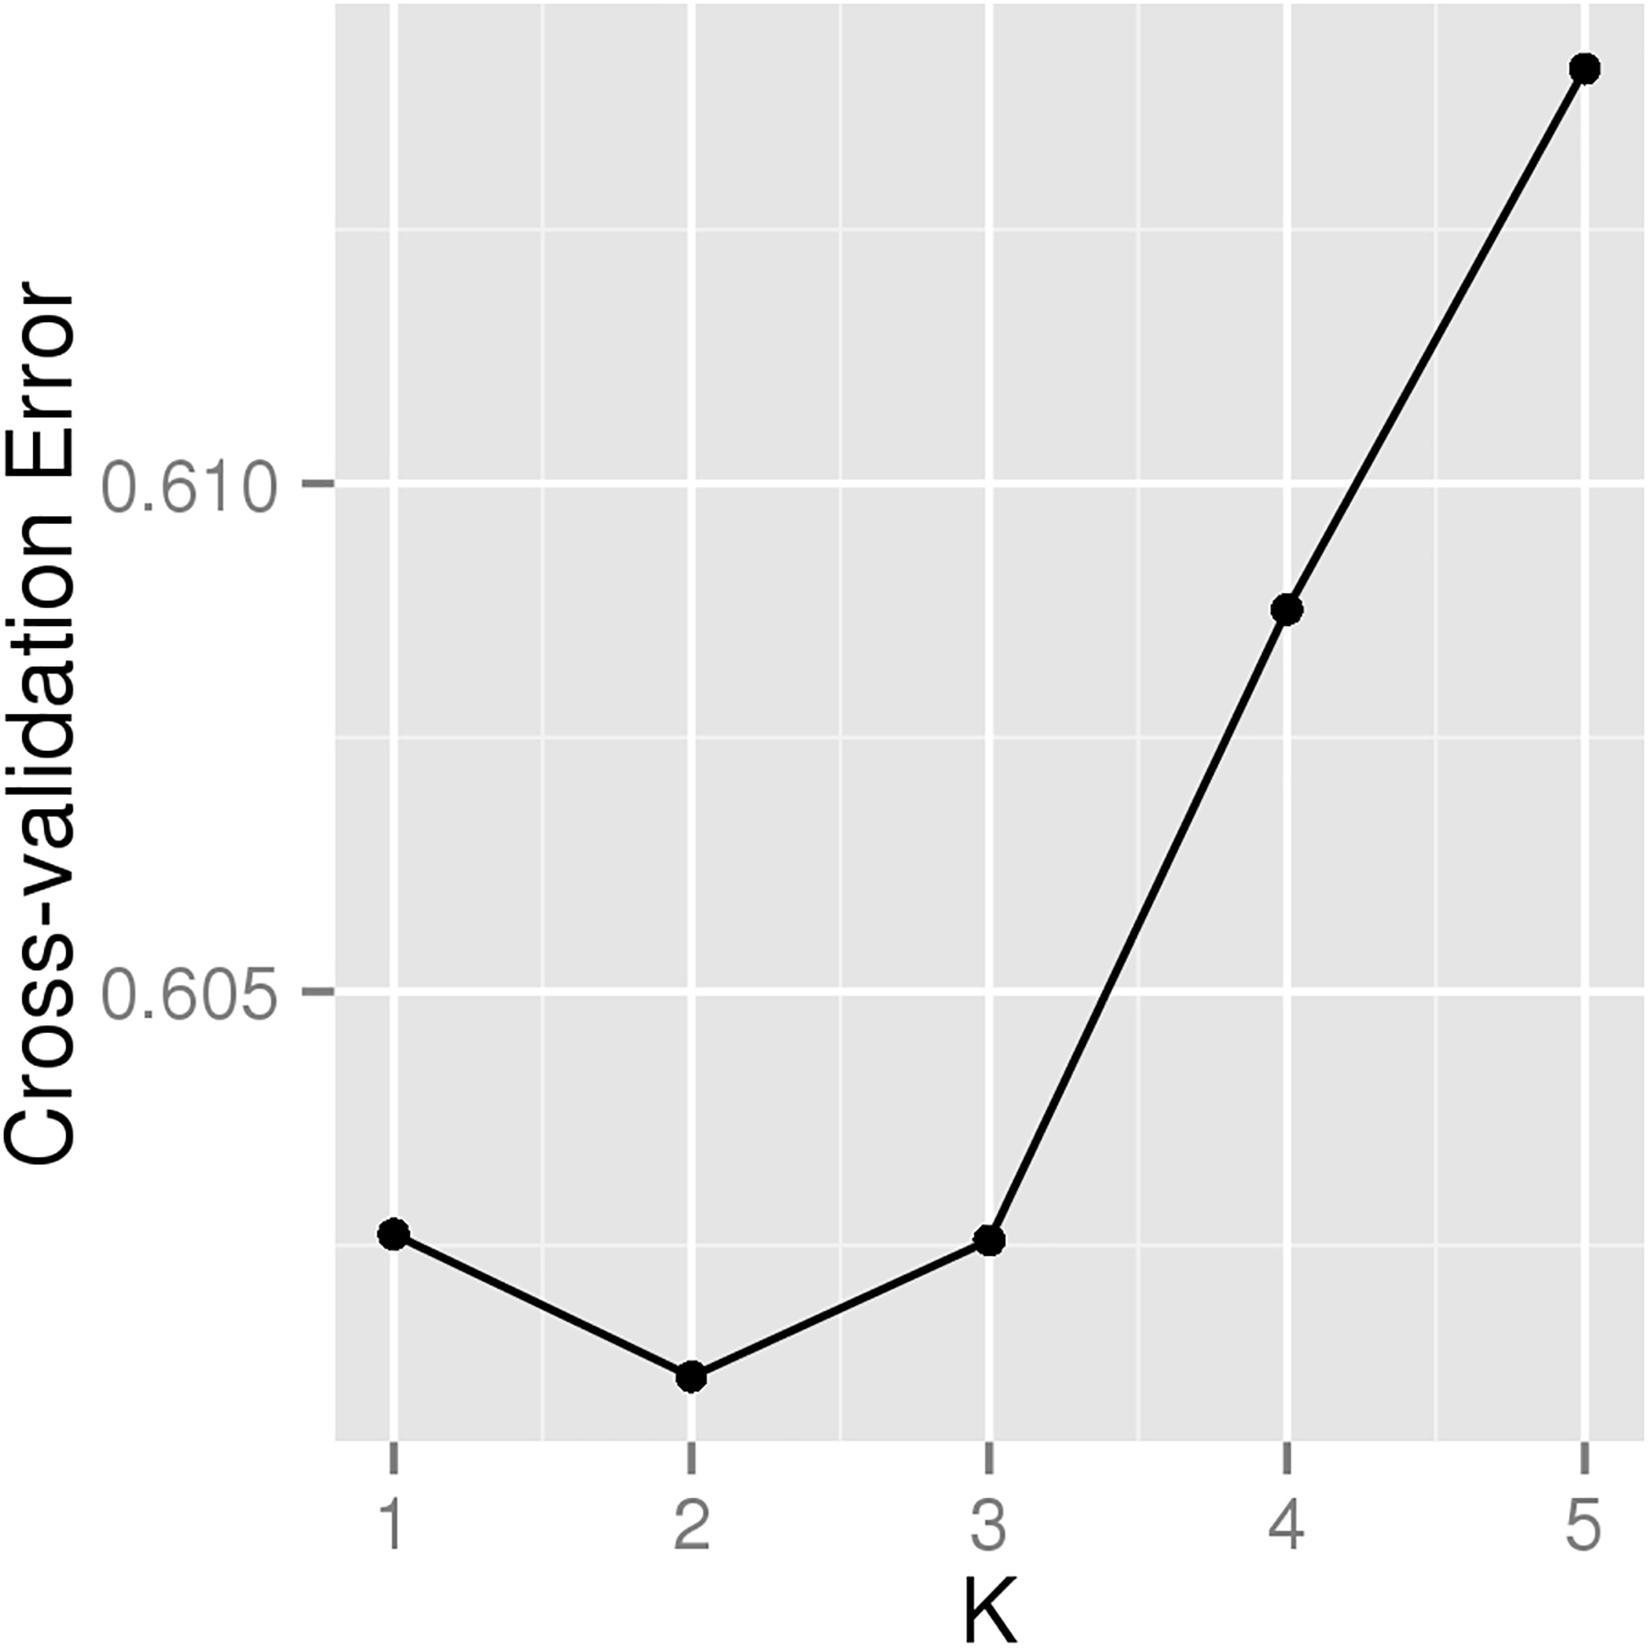
Figure 1. Cross-validation plot for determining the best K.
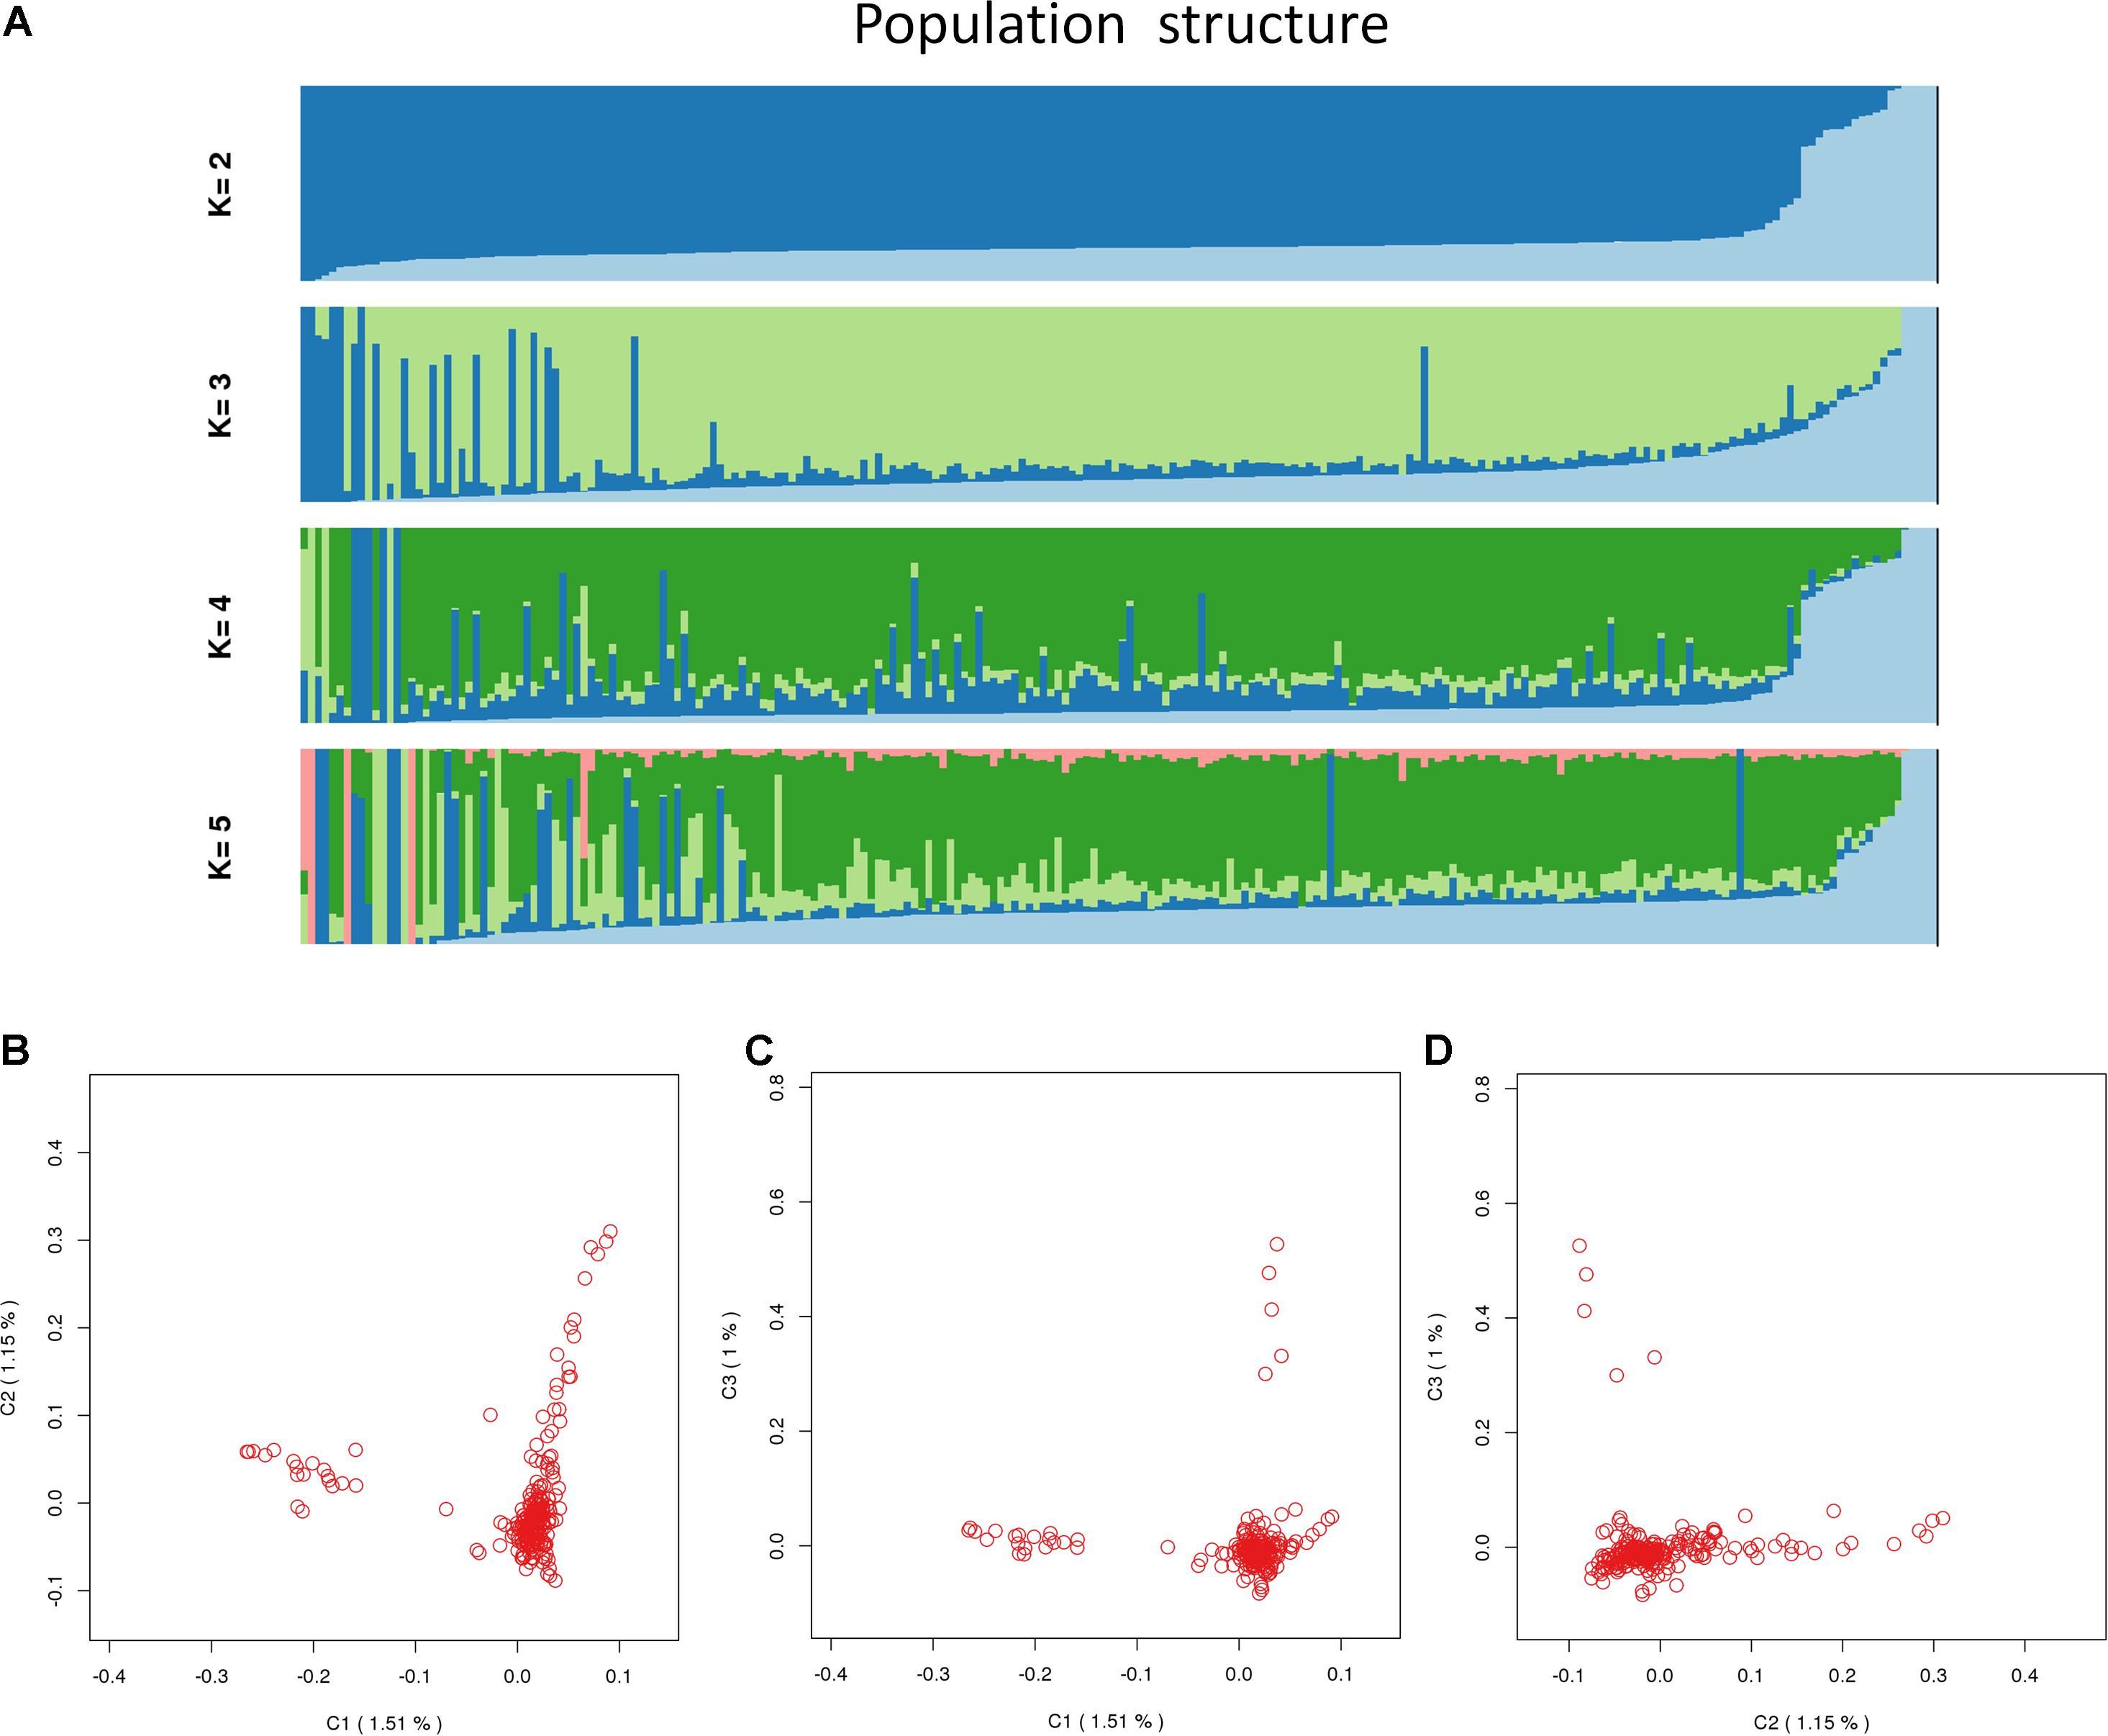
Figure 2. Population_structure_by_Admixture. (A) Population structure with K from 2 to 5; (B) principal components (PC) plot drawn from the second principal component (C2) against the first principal component (C1); (C) principal components (PC) plot drawn from the second principal component (C3) against the first principal component (C1); (D) principal components (PC) plot drawn from the second principal component (C3) against the first principal component (C2).
Based on the number of independently effective SNPs, the p-value corresponding to the 1% significance level was 2.83 × 10⁻⁷, and that corresponding to the 5% significance level was 1.41 × 10⁻⁶. SNPs with a p-value lower than this threshold value were considered to be significantly correlated to phenotype. GWAS’ results showed that 5 SNPs were significantly correlated to body height (Figure 3) in terms of genomic level; OAR23_3237800.1 (p = 5.53 × 10⁻⁸) of chromosome 23; OAR6_95218086.1 (p = 1.52 × 10⁻⁸) of chromosome 6; OARX_120998827.1 (p = 1.22 × 10⁻⁷) of chromosome 27 and OAR3_132833292.1 (p = 2.30 × 10⁻⁷) of chromosome 3; OAR1_164254640.1 (p = 5.08 × 10⁻⁷) (Figure 3) of chromosome 1. Four SNPs, s55433.1 (p = 3.26 × 10⁻⁸) and OAR5_99879334.1 (p = 3.26 × 10⁻⁸) of chromosome 5, OARX_79209204.1 (p = 3.26 × 10⁻⁸) of chromosome 27, and s26859.1 (p = 1.89 × 10⁻⁷) of chromosome 1 (Table 1), were significantly correlated to chest circumference (Figure 3) in terms of genomic level; no SNP was significantly correlated to body length, tail width or tail length.

Figure 3. Manhattan plot of analysis results; -log10 (p-values) in the studied population of Hu sheep. (A) Manhattan plot of the results of the body height analysis. (B) Manhattan plot of the results of the chest circumference.
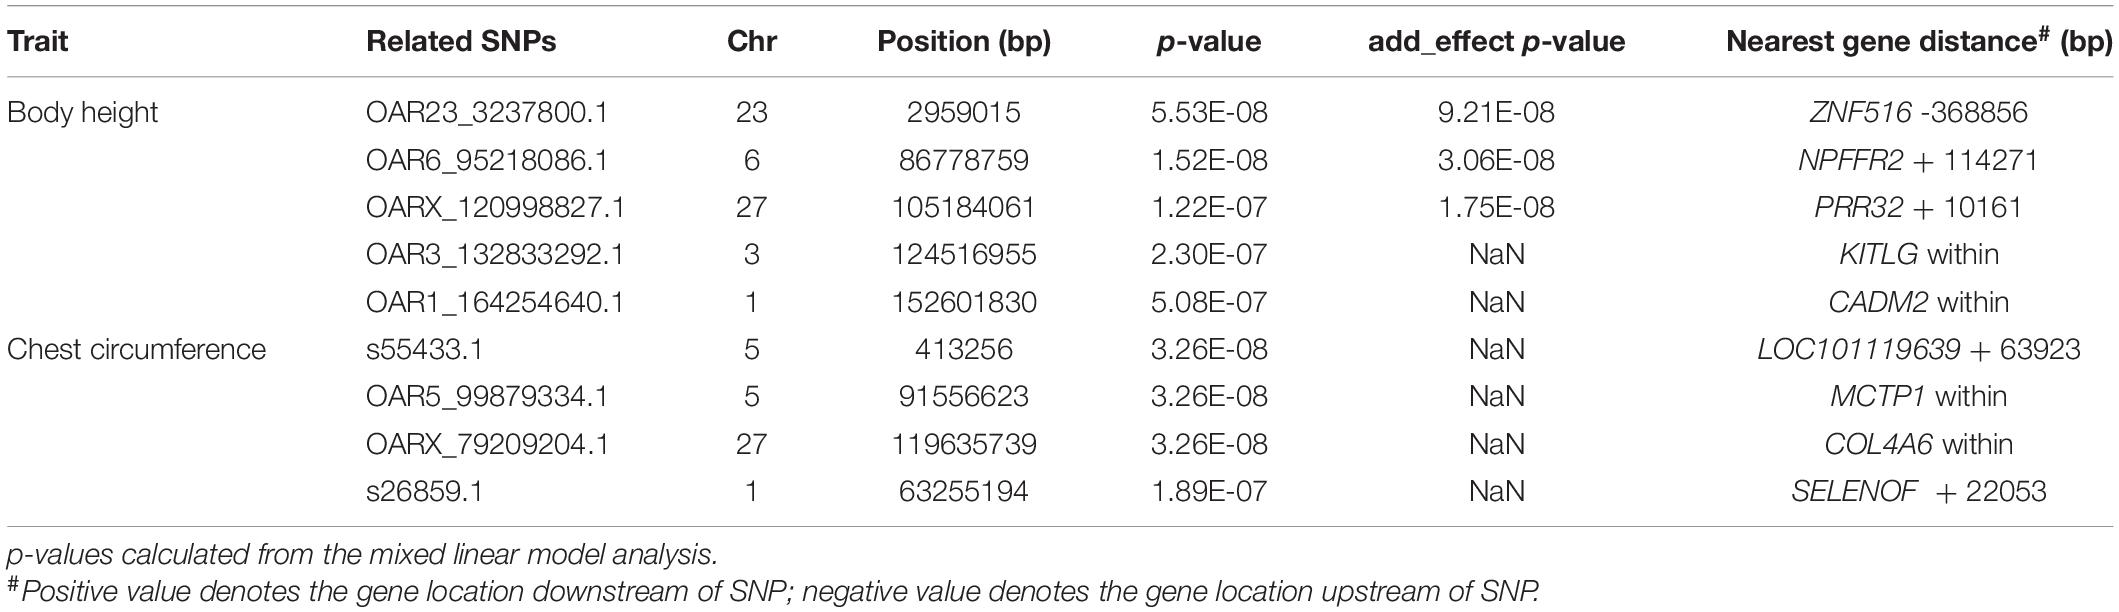
Table 1. Analysis of related SNPs associated with body size traits of Hu sheep.
At the genomic level, annotation information of the 9 SNPs sites that were significantly correlated to body height and chest circumference are shown in Table 1. Four of the SNPs were within genes. OAR3_132833292.1 was within gene KITLG; OAR1_164254640.1 was within gene CADM2; OAR5_99879334.1 was within gene MCTP1; OARX_79209204.1 was within gene COL4A6. There were 5 other SNPs at intergenic regions: OAR23_3237800.1 located 368,856 bp downstream of ZNF516, OAR6_95218086.1 located 114,271 bp upstream of NPFFR2, OARX_120998827.1 located 10,161 bp upstream of PRR32, s55433.1 located 63,923 bp upstream of LOC101119639, and s26859.1 located 22053bp upstream of SELENOF (Table 1).
The above 9 SNPs sites found by GWAS were verified by using the G3 generation 202 ewes of the nucleus herd for meat production. Nine products were amplified around nine sites (Figure 4), and 29 SNPs were found. Two mutation sites were detected in the amplified products at s55433.1, two mutation sites in the amplified products at OAR5_99879334.1, five in the amplified products at OARX_79209204.1, three in the amplified products at OAR23_3237800.1, three in the amplified products at s26859.1, six in the amplified products at OAR3_132833292.1, two in the amplified products at OAR6_95218086.1, two in the amplified products at OARX_120998827.1, and four mutation sites were detected in the amplified products at OAR1_164254640.1 (Supplementary Table 4).
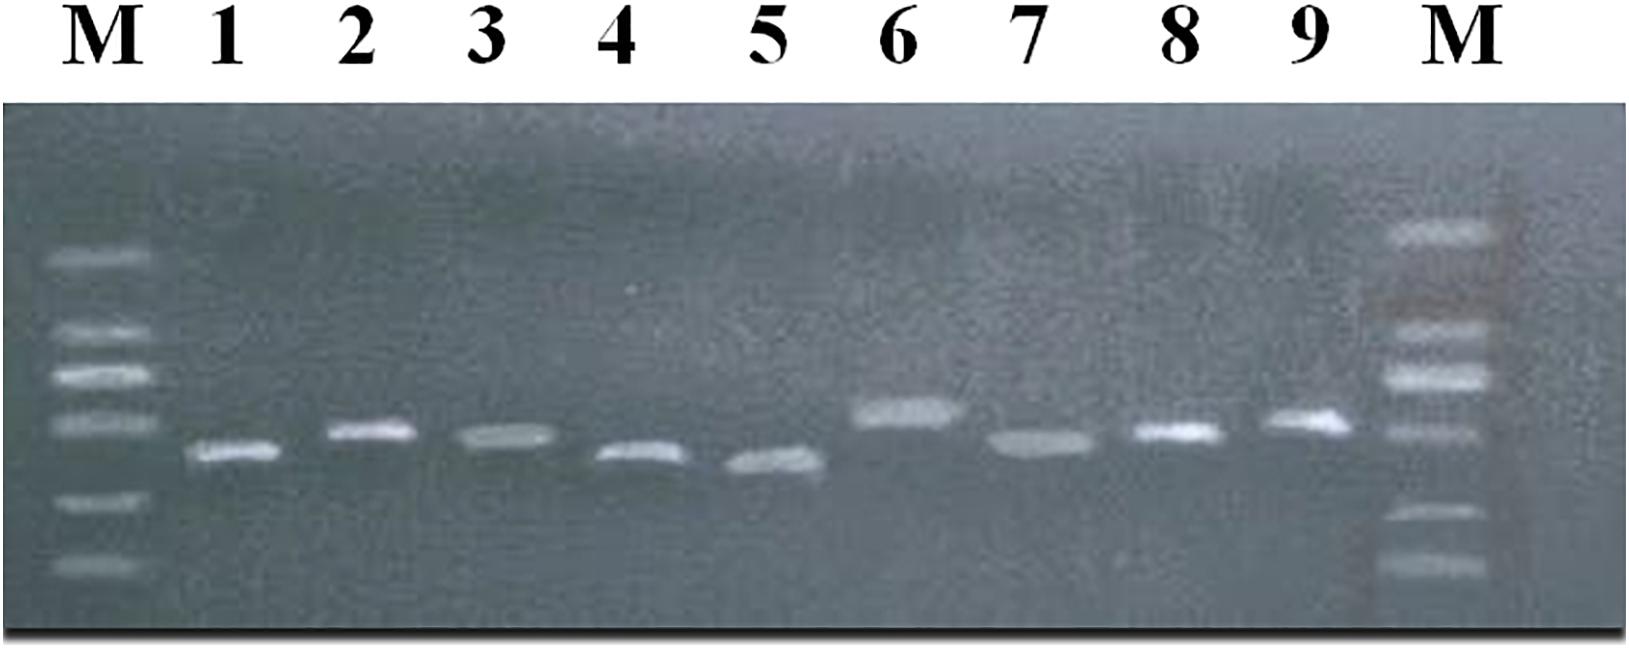
Figure 4. PCR amplification products of body size-related SNPs in meat-type Hu sheep. M:DL2000 plus. (1) LOC101119639 + 63923; (2) MCTP1; (3) COL4A6; (4) ZNF516 -368856; (5) SELENOF + 22053; (6) KITLG; (7) NPFFR2 + 114271; (8) CADM2; (9) PRR32 + 10161.
Population genetic analysis was performed on 29 sites. All loci were subjected to genotyping, population genetic analysis, and the association analysis between SNPs and body size traits. The value of PIC at 24 sites was < 0.25, which was indicative of low polymorphism. The value of PIC at five sites was between 0.25 and 0.5, which was indicative of intermediate polymorphism (Supplementary Tables 5, 6).
Verification results of SNPs showed that three mutation sites were significantly correlated to Hu sheep’s body height (Table 2): G > C mutation at 134 bp downstream of s554331, T > G mutation at 19 bp upstream of s26859.1, A > G mutation at 81 bp downstream of s26859.1.
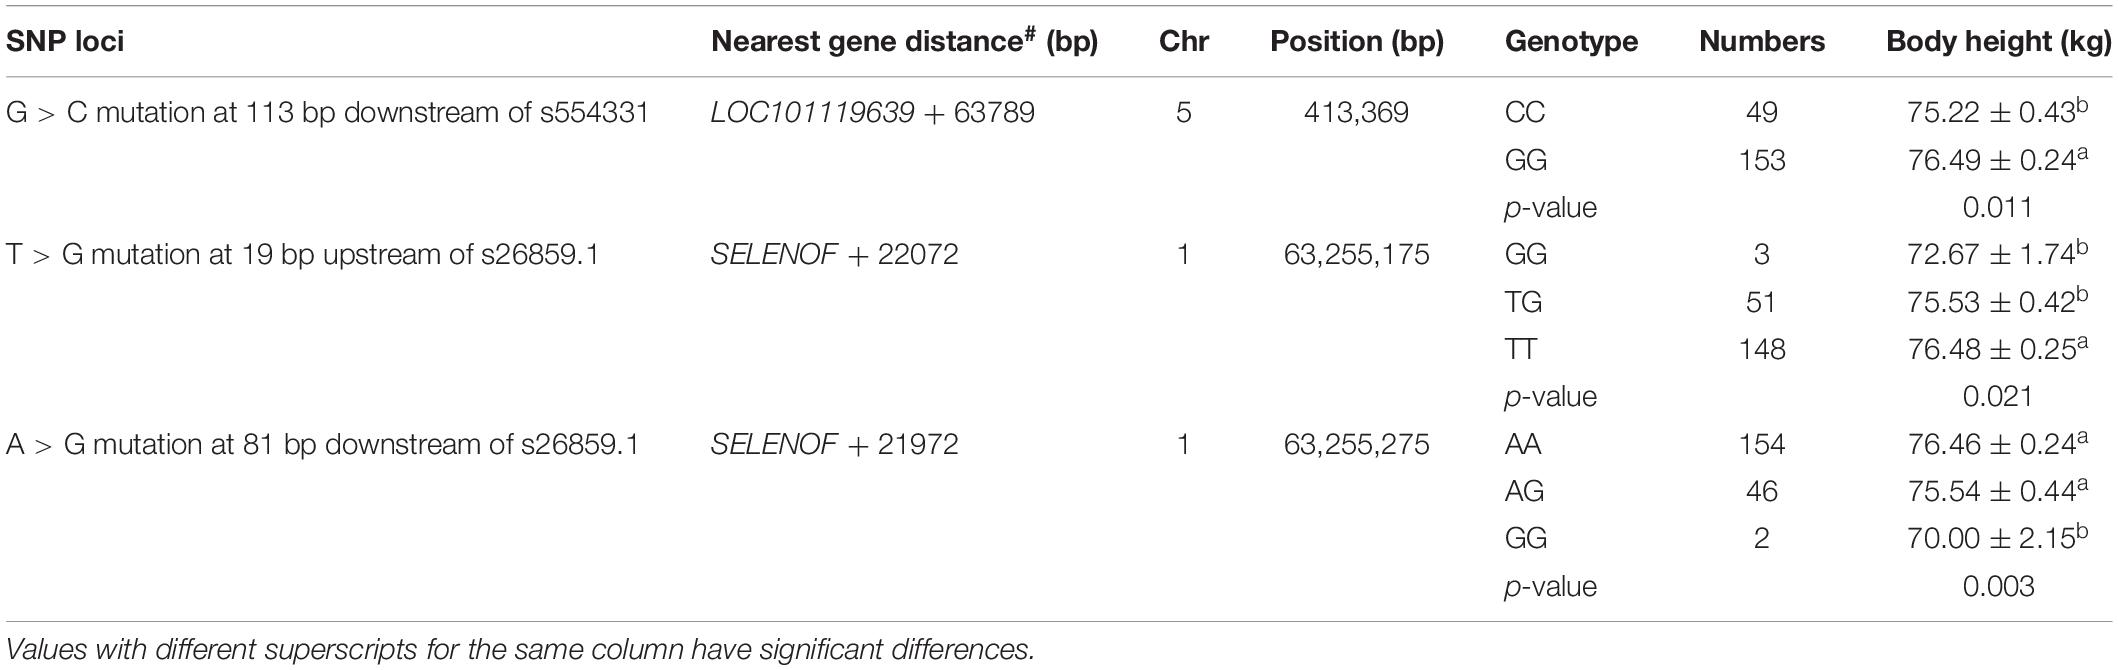
Table 2. Association analysis between SNPs and body height of Hu sheep.
Linkage disequilibrium (Linkage Disequilibrium, LD) refers to the non-random co-occurrence of alleles of chromosomes or haplotypes, i.e., there are statistical associations between alleles at different sites, which are different from independent alleles. Usually, D′ and r2 are used to measure LD. D′ > 0.33 and r2 > 0.1 represent a meaningful linkage disequilibrium; D′ > 0.8 and r2 > 0.33 a strong linkage disequilibrium (Long et al., 2004). According to the LD analysis results, the three SNPs showed strong linkage disequilibrium (Figure 5).
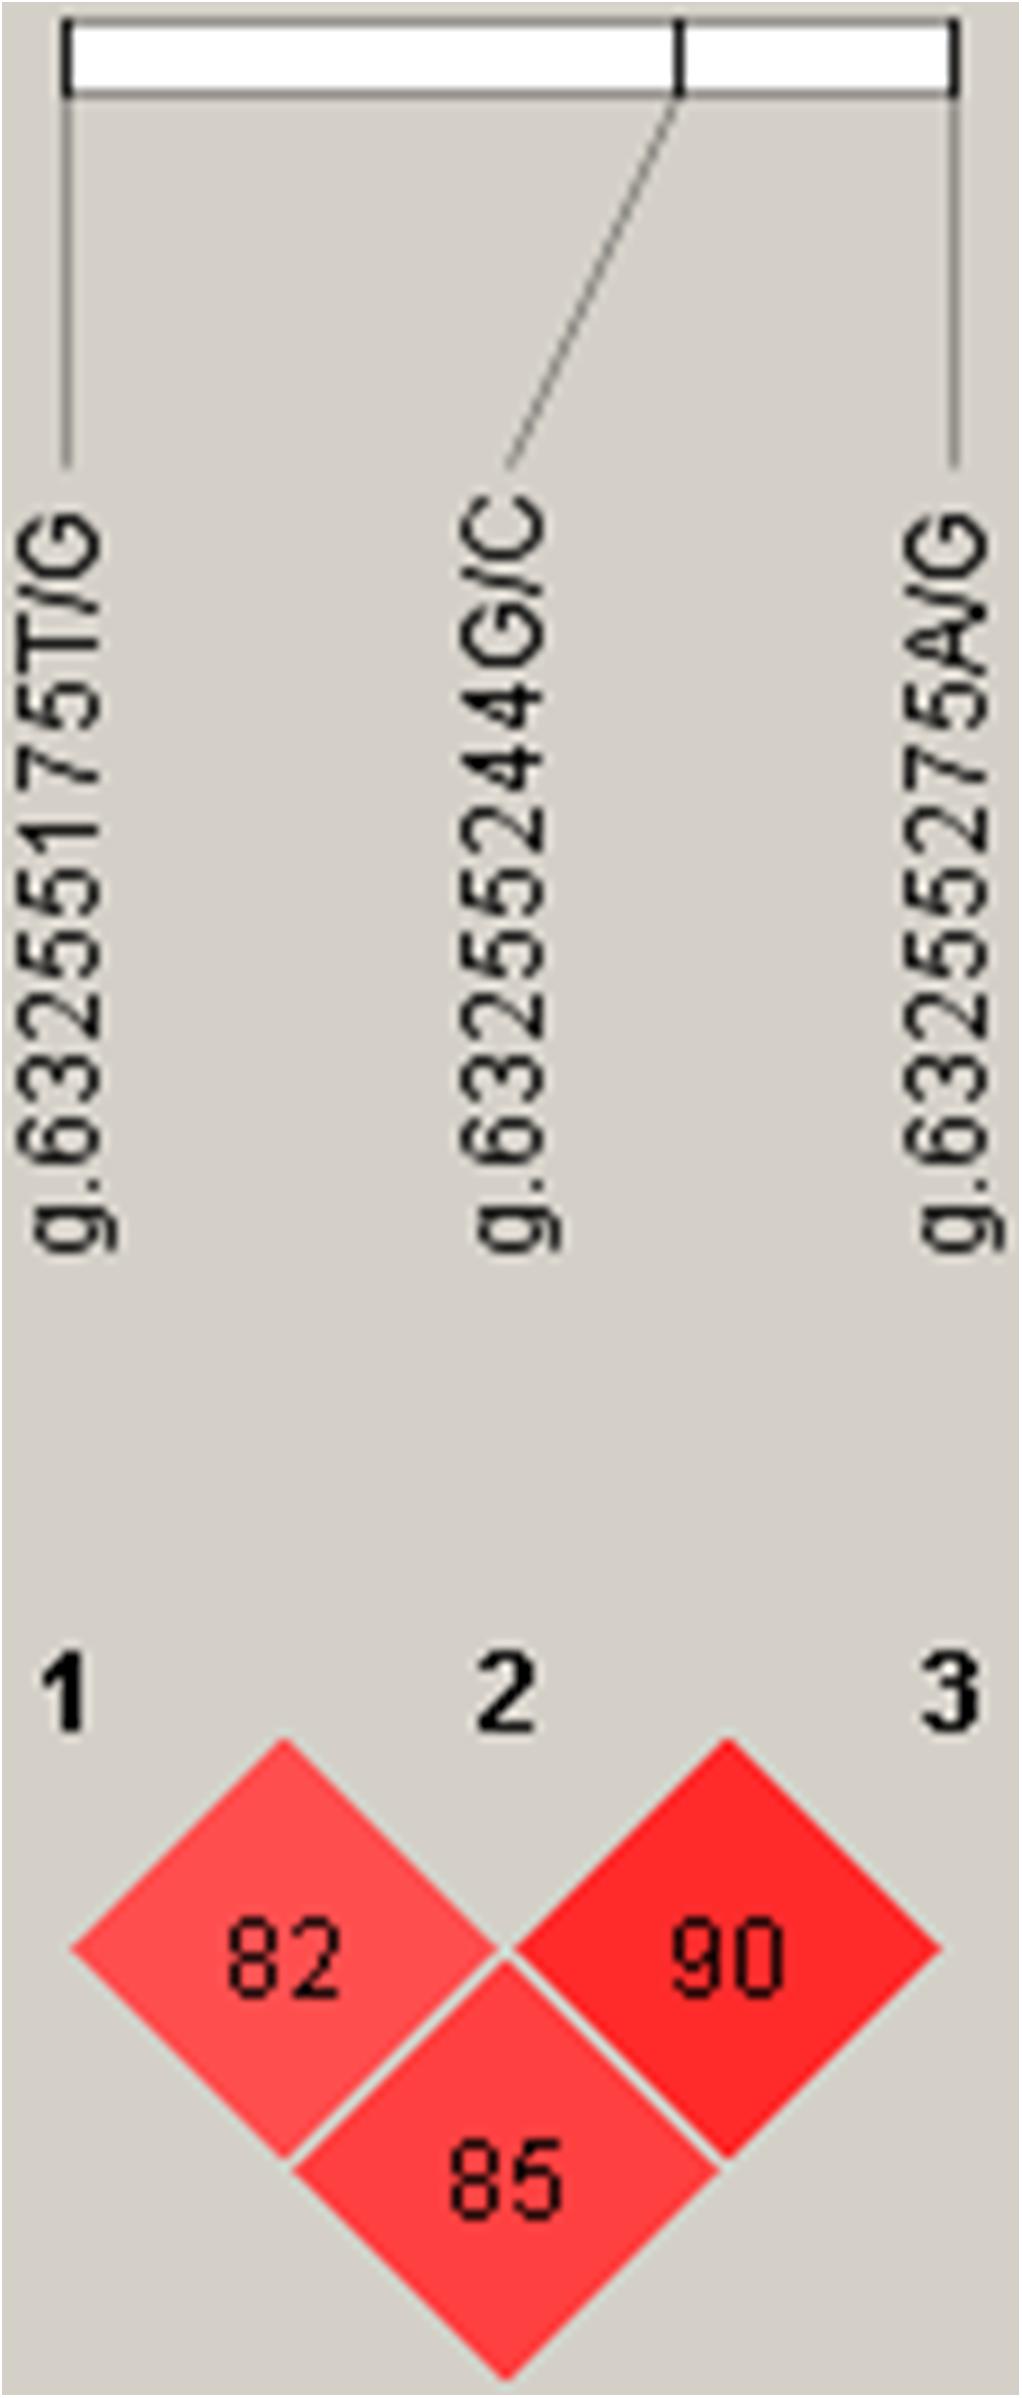
Figure 5. Linkage disequilibrium (LD) analyses of SNPs near s26859.1.
Three SNPs, g.63255175T/G, g.63255244G/C, and g.63255275A/G, were chosen for haplotype analysis based on linkage disequilibrium evaluation (D′ > 0.8, r2 < 0.05). Two tag SNPs (g.63255175T/G, g.63255275A/G) represented the genetic variation in the haplotype block. The effects of different haplotypes indicated a significant effect of haplotypes on the body height of Hu sheep (Table 3).

Table 3. Association analysis between haplotypes and body height of Hu sheep.
The results of dual-luciferase reporter gene experiments (Table 4) showed that SNPs (G > C mutation at 134 bp downstream of s554331) significantly impacted the activity of dual-luciferase and decreased the activity of dual-luciferase after mutation (p < 0.05). Moreover, SNPs (T > G mutation at 19 bp upstream of s26859.1; A > G mutation at 81 bp downstream of s26859.1) significantly decreased the activity of dual-luciferase after mutation (all p < 0.05). Haplotypes (T > G mutation at 19 bp upstream of s26859.1, A > G mutation at 81 bp downstream of s26859.1) significantly affected the activity of the reporter gene (p < 0.05). These results showed that the above SNPs and haplotypes could significantly impact the activity of gene transcription.
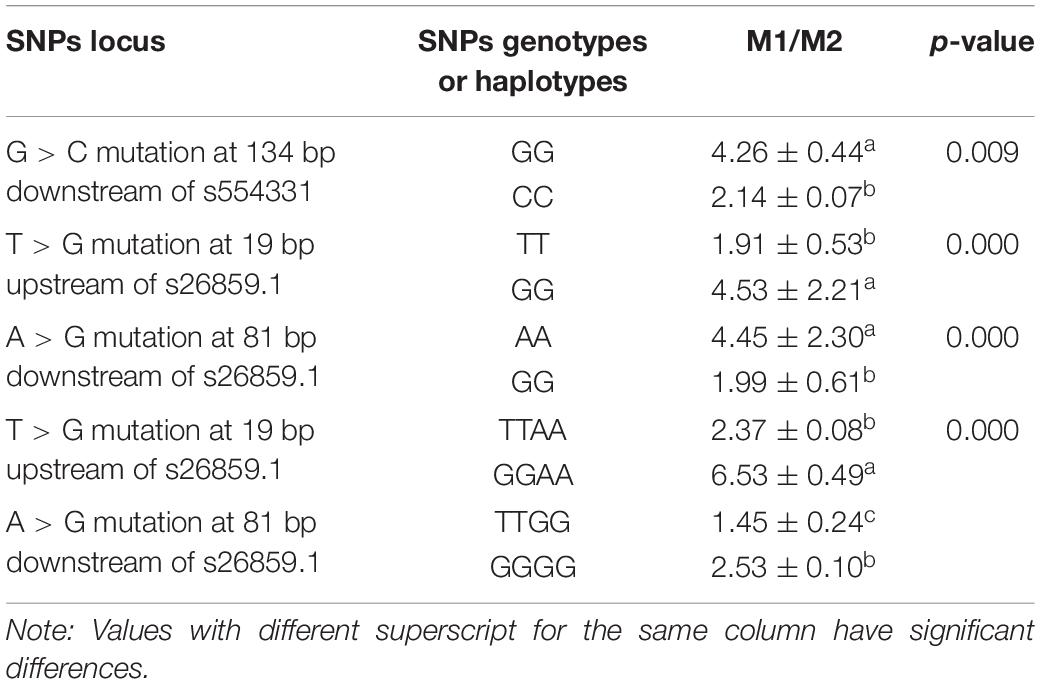
Table 4. Effects of genotypes or haplotypes of candidate functional SNPs on dual-luciferase activities.
Existing GWAS studies on sheep have mainly focused on reproductive traits (Demars et al., 2013; Gholizadeh et al., 2014; Martinez-Royo et al., 2017; Abdoli et al., 2019), body weight, and meat production traits (Zhang et al., 2013; Almamun et al., 2015; Matika et al., 2016), while few investigated body size traits. Thus far, no SNPs significantly correlated to body size traits at the genomic level were identified at p < 0.05. Eleven chromosome-wide significant SNPs, five for the “width Dimension” factor, four for the “height Dimension” factor, and two for the “length Dimension” factor were confirmed at p < 0.10 (Kominakis et al., 2017). One SNP (OAR17_14085599) was found to be significantly correlated to chest circumference. No SNPs were found to be correlated to body length and height (Zhang et al., 2019). In the present study, we found that 5 SNPs were significantly correlated to body height, and 4 SNPs were significantly correlated to chest circumference. Compared to the previous two studies, these SNPs were significantly different.
Our results identified nine significant SNPs at the genomic level. After performing genome annotation on the 9 SNPs, some candidate functional genes correlated to Hu sheep’s body height and chest circumference were found: KITLG and CADM2 are candidate functional genes correlated to body height, while MCTP1 and COL4A6 are candidate functional genes correlated to chest circumference.
OAR1_164254640.1 is within CADM2 (Gene ID: 101120371). Cell adhesion molecules (CADM) consist of a protein family that maintains cell polarity. Most CADM belong to the immunoglobulin superfamily. Previous studies have shown that CADM can be used as a tumor inhibitor (He et al., 2013). CADM2 belongs to the CADM family. CADM2 activates methylation and/or heterogeneity loss by promoting DNA to contain human kidney clear cell carcinoma. The loss of CADM2 leads to tumor progression (He et al., 2013). Previous genome-wide association meta-analysis confirmed several susceptibility sites to be correlated to BMI, including CADM2 (Speliotes et al., 2010; Locke et al., 2015). Moreover, obesity and glucose level can be reduced, and insulin sensitivity, sports function, energy expenditure rate, and core temperature can be increased in cadm2-knockout mice, emphasizing its relevance in systematic energy balance (Yan et al., 2018). Moreover, CADM2 is related to a series of behavioral and metabolic features, including physical activity, adventure, educational level, and obesity (Morris et al., 2019). It has been proved that CADM2 gene mutation has a critical role in BMI through the central nervous system (Speakman et al., 2018).
OAR5_99879334.1 is within gene MCTP1, a neuronal vesicle/endosome protein. In terms of structure, MCTP protein contains 3 C2 domains and 2 transmembrane domains near the C-end (Shin et al., 2005). The mutation or expression of MCTP1 variants is related to neuro psychosis. Genome-wide analysis shows that MCTP1 single nucleotide polymorphism (SNP), rs17418283, is related to bipolar affective disorder (Scott et al., 2009). In vivo and in vitro imaging studies all identified the location of MCTP1 on the endocrine recovery approach. Moreover, functional tests have shown that MCTP1 participates in various cell functions, including endocrine, cell migration, and anti-excitement virulence of neuronal cells (Qiu et al., 2015).
OAR3_132833292.1 is within the KITLG gene known as mammary gland cell growth factor (MGF) or stem cell factor (SCF). It encodes the ligand of c-Kit, a receptor tyrosine kinase, and participates in many biological processes, including hematopoiesis, gametogenesis, and melanogenesis (Talenti et al., 2018). The KITLG gene affects pigmentation in both humans and mice (Guenther et al., 2014). Polymorphisms in the KITLG gene have already been associated with litter size in goats (An et al., 2012, 2015). The genomic analysis suggested that KITLG is Responsible for a Roan Pattern in two Pakistani Goat Breeds (Talenti et al., 2018). Pigmentation genes KITLG have also been shown to have strong selection characteristics on Tibetan Cashmere Goat (Guo et al., 2019).
OARX_79209204.1 is within the COL4A6 gene (Collagen Type IV Alpha 6 Chain), a protein-coding gene that encodes the alpha-6 chain of type IV collagen basal membranes. The genes COL4A5 and COL4A6 are located head-to-head near human chromosome Xq22. COL4A6 activates transcription with 2 selectable promoters in a particular way of the tissue (Sugimoto et al., 1994). Gene Ontology (GO) annotations related to this gene include structural molecule activity and extracellular matrix structural constituent. Wang et al. (2018) suggested that the two dislocation mutations in COL4A5 and COL4A6 could be risk factors for cerebrovascular fibromuscular dysplasia. The dislocation mutation of the COL4A6 gene causes serious non-syndromic hearing impairment in males (Rost et al., 2014). Downregulation of COL4A6 may promote prostate cancer progression and invasion (Ma et al., 2020).
The 9 SNPs found in GWAS were verified by using 202 G3 generation ewes of the nucleus herd. Nine products were amplified around the 9 sites, and 29 SNPs were found using direct sequencing. Ovine SNP50 BeadChip developed by Illumina contains 54,241 SNP sites, with a mark on average every 46 kb. However, it is estimated that 1 SNP will appear every 1,000 bp in the human genome. Due to the insufficient SNP density of GWAS chips for commercial use, only 15% of genetic variation could be tested; thus, a large amount of genetic variation is yet to be found. Because of such GWAS defects, follow-up herd verification is essential. Herd verification is not only a supplement for the results of GWAS analysis but may also reveal new sites during the verification.
Our results revealed four new SNPs in follow-up verification that were significantly correlated to Hu sheep’s body size traits. The results of dual-luciferase reporter gene experiments showed that the 4 SNPs could significantly impact gene transcription activity. These significant sites can be included in our analysis field because they are close to GWAS positive sites. Therefore, we believe that GWAS is an important tool for candidate functional genes and the screening of functional SNP that can be used as a signpost to guide follow-up verification, thus preventing researchers from being overwhelmed by sequential information. However, a higher-density SNP detection chip may greatly improve the reliability of the results.
Data supporting this study has been deposited in GEO—accession number GSE152717.
The animal study was reviewed and approved by the Ethical Committee of Zhejiang Academy of Agricultural Sciences.
YJ was in charge of the whole trial. XS designed the experiments. JJ completed the majority of the experiments and was a major contributor in writing the manuscript. HS and YC participated in sampling and laboratory analyses. JW for animal feeding and care. All authors read and approved the final manuscript.
This work was financially supported by the Zhejiang Provincial Major Science and Technology Projects on Agricultural New Varieties Selection and Breeding (2016C02054-8) and the Zhejiang Agriculture Science and Technology Cooperation Projects (2019SNLF016).
The authors declare that the research was conducted in the absence of any commercial or financial relationships that could be construed as a potential conflict of interest.
We thank China Hangzhou Giant Agricultural Development Co., Ltd. for support.
The Supplementary Material for this article can be found online at: https://www.frontiersin.org/articles/10.3389/fgene.2021.642552/full#supplementary-material
Abdoli, R., Mirhoseini, S. Z., Ghavi Hossein-Zadeh, N., Zamani, P., Ferdosi, M. H., and Gondro, C. (2019). Genome-wide association study of four composite reproductive traits in Iranian fat-tailed sheep. Reprod. Fertil. Dev. 31, 1127–1133. doi: 10.1071/RD18282
Almamun, H. A., Kwan, P., Clark, S. A., Ferdosi, M. H., Tellam, R., Gondro, C., et al. (2015). Genome-wide association study of body weight in Australian merino sheep reveals an orthologous region on OAR6 to human and bovine genomic regions affecting height and weight. Genet. Sel. Evol. 47:66.
An, X. P., Hou, J. X., Gao, T. Y., Lei, Y. N., Song, Y. X., Wang, J. G., et al. (2015). Association analysis between variants in KITLG gene and litter size in goats. Gene 558, 126–130. doi: 10.1016/j.gene.2014.12.058
An, X. P., Hou, J. X., Li, G., Song, Y. X., Wang, J. G., Chen, Q. J., et al. (2012). Polymorphism identification in the goat KITLG gene and association analysis with litter size. Anim. Genet. 43, 104–107. doi: 10.1111/j.1365-2052.2011.02219.x
Brym, P., Kaminski, S., and Wojcik, E. (2005). Nucleotide sequence polymorphism within exon 4 of the bovine prolactin gene and its associations with milk performance traits. J. Appl. Genet. 46, 179–185.
Cao, Y., Song, X., Shan, H., Jiang, J., Xiong, P., Wu, J., et al. (2020). Genome-wide sssociation study of body weights in Hu Sheep and population verification of related single-nucleotide polymorphisms. Front. Genet. 11:588. doi: 10.3389/fgene.2020.00588
Demars, J., Fabre, S., Sarry, J., Rossetti, R., Gilbert, H., Persani, L., et al. (2013). Genome-wide association studies identify two novel BMP15 mutations responsible for an atypical hyperprolificacy phenotype in sheep. PLoS Genet. 9:e1003482. doi: 10.1371/journal.pgen.1003482
Gholizadeh, M., Rahimimianji, G., Nejatijavaremi, A., De Koning, D. J., and Jonas, E. (2014). Genomewide association study to detect QTL for twinning rate in baluchi sheep. J. Genet. 93, 489–493. doi: 10.1007/s12041-014-0372-1
Guenther, C. A., Tasic, B., Luo, L., Bedell, M. A., and Kingsley, D. M. (2014). A molecular basis for classic blond hair color in Europeans. Nat. Genet. 46, 748–752. doi: 10.1038/ng.2991
Guo, J., Zhong, J., Li, L., Zhong, T., Wang, L., Song, T., et al. (2019). Comparative genome analyses reveal the unique genetic composition and selection signals underlying the phenotypic characteristics of three Chinese domestic goat breeds. Genet. Sel. Evol. 51:70. doi: 10.1186/s12711-019-0512-4
He, W., Li, X., Xu, S., Ai, J., Gong, Y., Gregg, J. L., et al. (2013). Aberrant methylation and loss of CADM2 tumor suppressor expression is associated with human renal cell carcinoma tumor progression. Biochem. Biophys. Res. Commun. 435, 526–532. doi: 10.1016/j.bbrc.2013.04.074
Kemper, K. E., Visscher, P. M., and Goddard, M. E. (2012). Genetic architecture of body size in mammals. Genome Biol. 13:244. doi: 10.1186/gb-2012-13-4-244
Kominakis, A., Hager-Theodorides, A. L., Zoidis, E., Saridaki, A., Antonakos, G., and Tsiamis, G. (2017). Combined GWAS and ‘guilt by association’-based prioritization analysis identifies functional candidate genes for body size in sheep. Genet. Sel. Evol. 49:41. doi: 10.1186/s12711-017-0316-3
Locke, A. E., Kahali, B., Berndt, S. I., Justice, A. E., Pers, T. H., and Day, F. R. (2015). Genetic studies of body mass index yield new insights for obesity biology. Nature 518, 197–206.
Long, J. R., Zhao, L. J., and Liu, P. Y. (2004). Patterns of linkage disequilibrium and haplotype distribution in disease candidate genes. BMC Genetics 5:11. doi: 10.1186/1471-2156-5-11
Ma, J. B., Bai, J. Y., Zhang, H. B., Gu, L., He, D., and Guo, P. (2020). Downregulation of collagen COL4A6 is associated with prostate cancer progression and metastasis. Genet. Test Mol. Biomarkers 24, 399–408. doi: 10.1089/gtmb.2020.0009
Martinez-Royo, A., Alabart, J. L., Sarto, P., Serrano, M., Lahoz, B., Folch, J., et al. (2017). Genome-wide association studies for reproductive seasonality traits in Rasa Aragonesa sheep breed. Theriogenology 99, 21–29. doi: 10.1016/j.theriogenology.2017.05.011
Matika, O., Riggio, V., Anselme-Moizan, M., Law, A. S., Pong-Wong, R., Archibald, A. L., et al. (2016). Genome-wide association reveals QTL for growth, bone and in vivo carcass traits as assessed by computed tomography in Scottish Blackface lambs. Genet. Sel. Evol. 48:11.
Morris, J., Bailey, M. E. S., Baldassarre, D., Cullen, B., de Faire, U., Ferguson, A., et al. (2019). Genetic variation in CADM2 as a link between psychological traits and obesity. Sci Rep. 9:7339.
Posbergh, C. J., and Huson, H. J. (2021). All sheeps and sizes: a genetic investigation of mature body size across sheep breeds reveals a polygenic nature. Anim. Genet. 52, 99–107. doi: 10.1111/age.13016
Qiu, L., Yu, H., and Liang, F. (2015). Multiple C2 domains transmembrane protein 1 is expressed in CNS neurons and possibly regulates cellular vesicle retrieval and oxidative stress. J. Neurochem. 135, 492–507. doi: 10.1111/jnc.13251
Rost, S., Bach, E., Neuner, C., Nanda, I., Dysek, S., Bittner, R. E., et al. (2014). Novel form of X-linked nonsyndromic hearing loss with cochlear malformation caused by a mutation in the type IV collagen gene COL4A6. Eur. J. Hum. Genet. 22, 208–215. doi: 10.1038/ejhg.2013.108
Scott, L. J., Muglia, P., Kong, X. Q., Guan, W., Flickinger, M., Upmanyu, R., et al. (2009). Genome−wide association and meta−analysis of bipolar disorder in individuals of European ancestry. Proc. Natl. Acad. Sci. U.S.A. 106, 7501–7506.
Shin, O. H., Han, W., Wang, Y., and Südhof, T. C. (2005). Evolutionarily conserved multiple C2 domain proteins with two transmembrane regions (MCTPs) and unusual Ca2 + binding properties. J. Biol. Chem. 280, 1641–1651. doi: 10.1074/jbc.m407305200
Speakman, J. R., Loos, R. J. F., O’Rahilly, S., Hirschhorn, J. N., and Allison, D. B. (2018). GWAS for BMI: a treasure trove of fundamental insights into the genetic basis of obesity. Int. J. Obes. 42, 1524–1531. doi: 10.1038/s41366-018-0147-5
Speliotes, E. K., Willer, C. J., Berndt, S. I., Monda, K. L., Thorleifsson, G., and Jackson, A. U. (2010). Association analyses of 249,796 individuals reveal 18 new loci associated with body mass index. Nat. Genet. 42, 937–948.
Sugimoto, M., Oohashi, T., and Ninomiya, Y. (1994). The genes COL4A5 and COL4A6, coding for basement membrane collagen chains alpha 5(IV) and alpha 6(IV), are located head-to-head in close proximity on human chromosome Xq22 and COL4A6 is transcribed from two alternative promoters. Proc. Natl. Acad. Sci. U.S.A. 91, 11679–11683. doi: 10.1073/pnas.91.24.11679
Talenti, A., Bertolini, F., Williams, J., Moaeen-Ud-Din, M., Frattini, S., Coizet, B., et al. (2018). Genomic analysis suggests KITLG is responsible for a roan pattern in two pakistani goat breeds. J. Hered. 109, 315–319. doi: 10.1093/jhered/esx093
Wang, X., Li, W., Wei, K., Xiao, R., Wang, J., Ma, H., et al. (2018). Missense mutations in COL4A5 or COL4A6 genes may cause cerebrovascular fibromuscular dysplasia: case report and literature review. Medicine 97:e11538. doi: 10.1097/MD.0000000000011538
Yan, X., Wang, Z., Schmidt, V., Gauert, A., Willnow, T. E., Heinig, M., et al. (2018). Cadm2 regulates body weight and energy homeostasis in mice. Mol. Metab. 8, 180–188. doi: 10.1016/j.molmet.2017.11.010
Yue, G. H. (1996). Reproductive characteristics of Chinese hu sheep. Anim. Reprod. Sci. 44, 223–230. doi: 10.1016/0378-4320(96)01562-x
Zhang, L., Liu, J., Zhao, F., Ren, H., Xu, L., Lu, J., et al. (2013). Genome-wide association studies for growth and meat production traits in sheep. PLoS One 8:e66569. doi: 10.1371/journal.pone.0066569
Keywords: Hu sheep, body size traits, genome wide association studies, SNPs, transcription activity, population verification
Citation: Jiang J, Cao Y, Shan H, Wu J, Song X and Jiang Y (2021) The GWAS Analysis of Body Size and Population Verification of Related SNPs in Hu Sheep. Front. Genet. 12:642552. doi: 10.3389/fgene.2021.642552
Received: 16 December 2020; Accepted: 20 April 2021;
Published: 20 May 2021.
Edited by:
Zhe Zhang, South China Agricultural University, ChinaReviewed by:
Ricardo Zanella, The University of Passo Fundo, BrazilCopyright © 2021 Jiang, Cao, Shan, Wu, Song and Jiang. This is an open-access article distributed under the terms of the Creative Commons Attribution License (CC BY). The use, distribution or reproduction in other forums is permitted, provided the original author(s) and the copyright owner(s) are credited and that the original publication in this journal is cited, in accordance with accepted academic practice. No use, distribution or reproduction is permitted which does not comply with these terms.
*Correspondence: Junfang Jiang, amlhbmdqdW5mYW5nMTAzMUBzaW5hLmNu; Xuemei Song, c29uZ3h1ZW1laUBuYnUuZWR1LmNu; Yongqing Jiang, anlxNjFAc29odS5jb20=
Disclaimer: All claims expressed in this article are solely those of the authors and do not necessarily represent those of their affiliated organizations, or those of the publisher, the editors and the reviewers. Any product that may be evaluated in this article or claim that may be made by its manufacturer is not guaranteed or endorsed by the publisher.
Research integrity at Frontiers
Learn more about the work of our research integrity team to safeguard the quality of each article we publish.