
94% of researchers rate our articles as excellent or good
Learn more about the work of our research integrity team to safeguard the quality of each article we publish.
Find out more
ORIGINAL RESEARCH article
Front. Genet. , 09 April 2021
Sec. Cancer Genetics
Volume 12 - 2021 | https://doi.org/10.3389/fgene.2021.630794
 Ruoyan Cao1,2,3
 Suyang Liu1,2,3
 Jiayu Zhang1,2,3
 Xianyue Ren1,2,3Xijuan Chen1,2,3
 Bin Cheng1,2,3*
 Juan Xia1,2,3*
TP53INP2 plays an important role in regulating gene transcription and starvation-induced autophagy, however, its function in head and neck squamous cell carcinoma (HNSCC) remains unclear. Therefore, we assessed the expression and prognostic value of TP53INP2. In addition, RNAseq, miRNAseq, copy number variation, and mutation profiles from The Cancer Genome Atlas (TCGA) dataset were applied to evaluate the distinctive genomic patterns related to TP53INP2 expression. We found that TP53INP2 expression was lower in HNSCC compared with normal controls. Patients with higher TP53INP2 expression had longer survival time. Knockdown of TP53INP2 promoted cell viability. Functional analysis exhibited that TP53INP2 was linked to DNA replication, DNA repair, cell cycle, and multiple metabolic pathways. Moreover, TP53INP2 might affect the expression of multiple genes via enhancing the transcriptional activity of nuclear hormone receptors. A competing endogenous RNA (ceRNA) network consisting of 33 lncRNAs, eight miRNAs, and 13 mRNAs was constructed based on the expression of TP53INP2. Taken together, our study highlights the potential value of TP53INP2 in predicting the survival of HNSCC and its important role in the genesis and development of HNSCC.
Head and neck squamous cell carcinoma (HNSCC) is the sixth most prevalent cancer with approximately 830,000 new cases and 430,000 related death per year worldwide, bringing a heavy burden to the patients and the society (Bray et al., 2018; Yu et al., 2019). Despite of the great advancements in surgical excision, chemotherapy, and radiotherapy in the past years, the 5-year overall survival rate of HNSCC has not been effectively improved, about 50% (van der Schroeff et al., 2010). Thus, there is an urgent need to further understand the oncogenesis and development of HNSCC as well as developing novel therapeutic targets.
Tumor protein p53-inducible nuclear protein 2 (TP53INP2), also named diabetes- and obesity-related gene (DOR), is a bi-functional protein that is associated with gene transcription and starvation-induced autophagy (Xu and Wan, 2020). In detail, TP53INP2 is a nuclear protein serving as a transcriptional coactivator of nuclear hormone receptors, including thyroid hormone receptor alpha (THRA/TRα), glucocorticoid receptor (GR), vitamin D receptor (VDR), and peroxisome proliferator-activated receptor gamma (PPARG) (Baumgartner et al., 2007; Sancho et al., 2012). Under starvation and rapamycin treatment, nuclear TP53INP2 moves to the cytoplasm and involves in autophagy (Nowak et al., 2009; Huang et al., 2015; You et al., 2019). In addition, TP53INP2 regulates rDNA transcription and interacts with ubiquitinated proteins and ubiquitin (Xu et al., 2016; Xu and Wan, 2019). In bladder cancer, TP53INP2 is upregulated and knockdown of TP53INP2 inhibits the invasion, migration as well as epithelial-to-mesenchymal transition (Zhou et al., 2020). However, the function of TP53INP2 in HNSCC is largely unclear.
In this study, we found TP53INP2 was down-regulated in HNSCC based on multiple datasets and validated these results in multiple HNSCC cell lines. Knockdown of TP53INP2 promoted CAL27 cell proliferation. We also investigated the functional network, genomic alterations, and competing endogenous RNA (ceRNA) network related to TP53INP2 in HNSCC. Our results highlight the potential value of TP53INP2 in the treatment of HNSCC.
Level 3 RNA-Seq data and the corresponding clinical data for our HNSCC datasets were downloaded from the TCGA data portal1. After excluding the HNSCC patients followed for no more than 30 days and more than 2,000 days, we finally included 455 HNSCC patients and 44 normal controls for our subsequent analysis. Besides, we also downloaded five HNSCC datasets (GSE30784, GSE31056, GSE33205, GSE59102, and GSE33791) from Gene Expression Omnibus (GEO) database2 to validate the expression of TP53INP2 between HNSCC and normal controls.
We divided TCGA HNSCC cohort into two groups (TP53INP2-high and TP53INP2-low) based on the R package “survminer.” To explore the difference in biological process between the different expressions of TP53INP2, we performed Gene Set Enrichment Analysis (GSEA) using “clusterProfiler” R packages. The gene sets of “h.all.v6.2.-symbols” and “c2.cp.kegg.v7.1- symbols” were obtained from the MSigDB database for running GSEA analysis. An adjusted P value less than 0.05 was considered to be statistically significant.
TP53INP2 could enhance the transcriptional activity of nuclear hormone receptors. Thus, we extracted targeted genes of nuclear hormone receptors from the TRRUST database3 and assessed the relationship between these genes and TP53INP2 based on the spearman correlation test. FDR < 0.05 was considered to be statistically significant. Cytoscape was used to visualize the regulatory network.
We identified significant differential mRNAs (DEmRNAs), miRNAs (DEmiRNAs), and lncRNAs (DElncRNAs) between TP53INP2-high and TP53INP2-low using “DEseq2” R package according to the criteria of absolute fold change (FC) more than 1.5 and FDR less than 0.05. LncRNA-miRNA interactions were predicted based on the starBase database4. The interactions of miRNA-mRNA were predicted by miRTarBase, miRDB, and TargetScan. To enhance the reliability of this ceRNA network, only miRNA-targeted mRNAs exist in all three databases and DEmRNAs were included. We employed Cytoscape software to visualize the ceRNA network.
The copy number variation (CNV) profiles of HNSCC were extracted from GDAC Firehose5 and separated into different groups based on the expression of TP53INP2. We applied GISTIC 2.0 to detect significant deletion or amplification alterations in the whole genome. GISTIC 2.0 is a biological program to identify somatic CNVs by assessing the amplitude and frequency of corresponding events. The somatic mutation data of HNSCC patients was downloaded via the TCGAbiolinks and the data was visualized by “maftools” R package.
The small interfere RNA (siRNA) specifically targeting TP53INP2 (si-TP53INP2) and the negative control (si-NC) were purchased from GenePharma (Suzhou, China). The sequence of siTP53INP2 is 5′–3′ GCAUGUCCGUUUACGUCACdTdT and CCUGAAAUCUGAAGGGCUUdTdT. Lipofectamine 3000 (Invitrogen, Carlsbad, CA, United States) was used to transfect si-TP53INP2 and si-NC into HNSCC cell according to the manufacturer’s protocol suggested.
Total RNA was extracted from HOK, CAL27, CAL33, HSC3, HSC6, SCC25, and UM1 cells using the RNA-quick purification kit (ESscience Biotech). RNA (1 μg) was reversed into cDNA using HiScript® III RT SuperMix (Vazyme). The obtained cDNA product was used for PCR amplification. Primer sequences are as follows: TP53INP2, forward 5′-CCTGTTCCCTTATTCTTCATTCC-3′, and reverse 5′-ATTCCCTCCATCTTCTCCCT-3′; GAPDH, forward 5′-CTCCTCCTGTTCGACAGTCAGC-3′, and reverse 5′-CCCAATACGACCAAATCCGTT-3′.
The CAL27 cell line was seeded on 96-well plates at a final density of 1.5 × 10³ cells per well. Cell proliferation was assessed using Cell Counting Kit-8 (CCK-8, Beyotime, China).
For survival analysis, we employed the log-rank test to compare the difference using the Kaplan–Meier survival curve. Spearman correlation analysis was used to assess the linear relationship between different genes. Two-tailed Student’s t-tests, Wilcoxon rank sum test, and one-way ANOVA test were used for assessing differences between groups. Unless otherwise specified, a p value less than 0.05 was considered to be statistically significant. R software (version: 3.6.2) was employed to perform all statistical analyses.
We assessed the expression of TP53INP2 in multiple HNSCC datasets from the GEO and TCGA. The results indicated that TP53INP2 was significantly downregulated in HNSCC than normal control (Figure 1A). Meanwhile, similar results were found in pairs of HNSCC and normal tissues (Figure 1B). Furthermore, the down-regulated expression of TP53INP2 in multiple HNSCC cell lines was validated using quantitative real-time PCR (qRT-PCR) (Figure 1C). We also found that TP53INP2 was significantly decreased in patients with poor differentiation and lymphatic metastasis (Figure 1D). To further verify the function of TP53INP2, the knockdown of TP53INP2 in CAL27 cell line was performed (Figure 1E). The subsequent CCK8 assay indicated that TP53INP2 knockdown significantly promoted cell proliferation (Figure 1F). According to the “survminer” R package, we determined the best cut-off point to stratify TCGA-HNSCC patients into TP53INP2-high (n = 224) and TP53INP2-low (n = 211) subgroups. Low expression of TP53INP2 was associated with poor prognosis (Figure 1G). In line with the results in TCGA cohort, we found that patients with lower expression in GSE41613 cohort also exhibited shorter survival time (Figure 1H). In addition, we found that TP53INP2 could be an independent prognostic factor for the survival of HNSCC (Table 1). Compared with low expression of TP53INP2, those with high expression of TP53INP2 had a significantly lower mortality [0.61 (0.46, 0.81), P = 0.0007 in model I; 0.63 (0.47, 0.84), P = 0.0016 in model II].
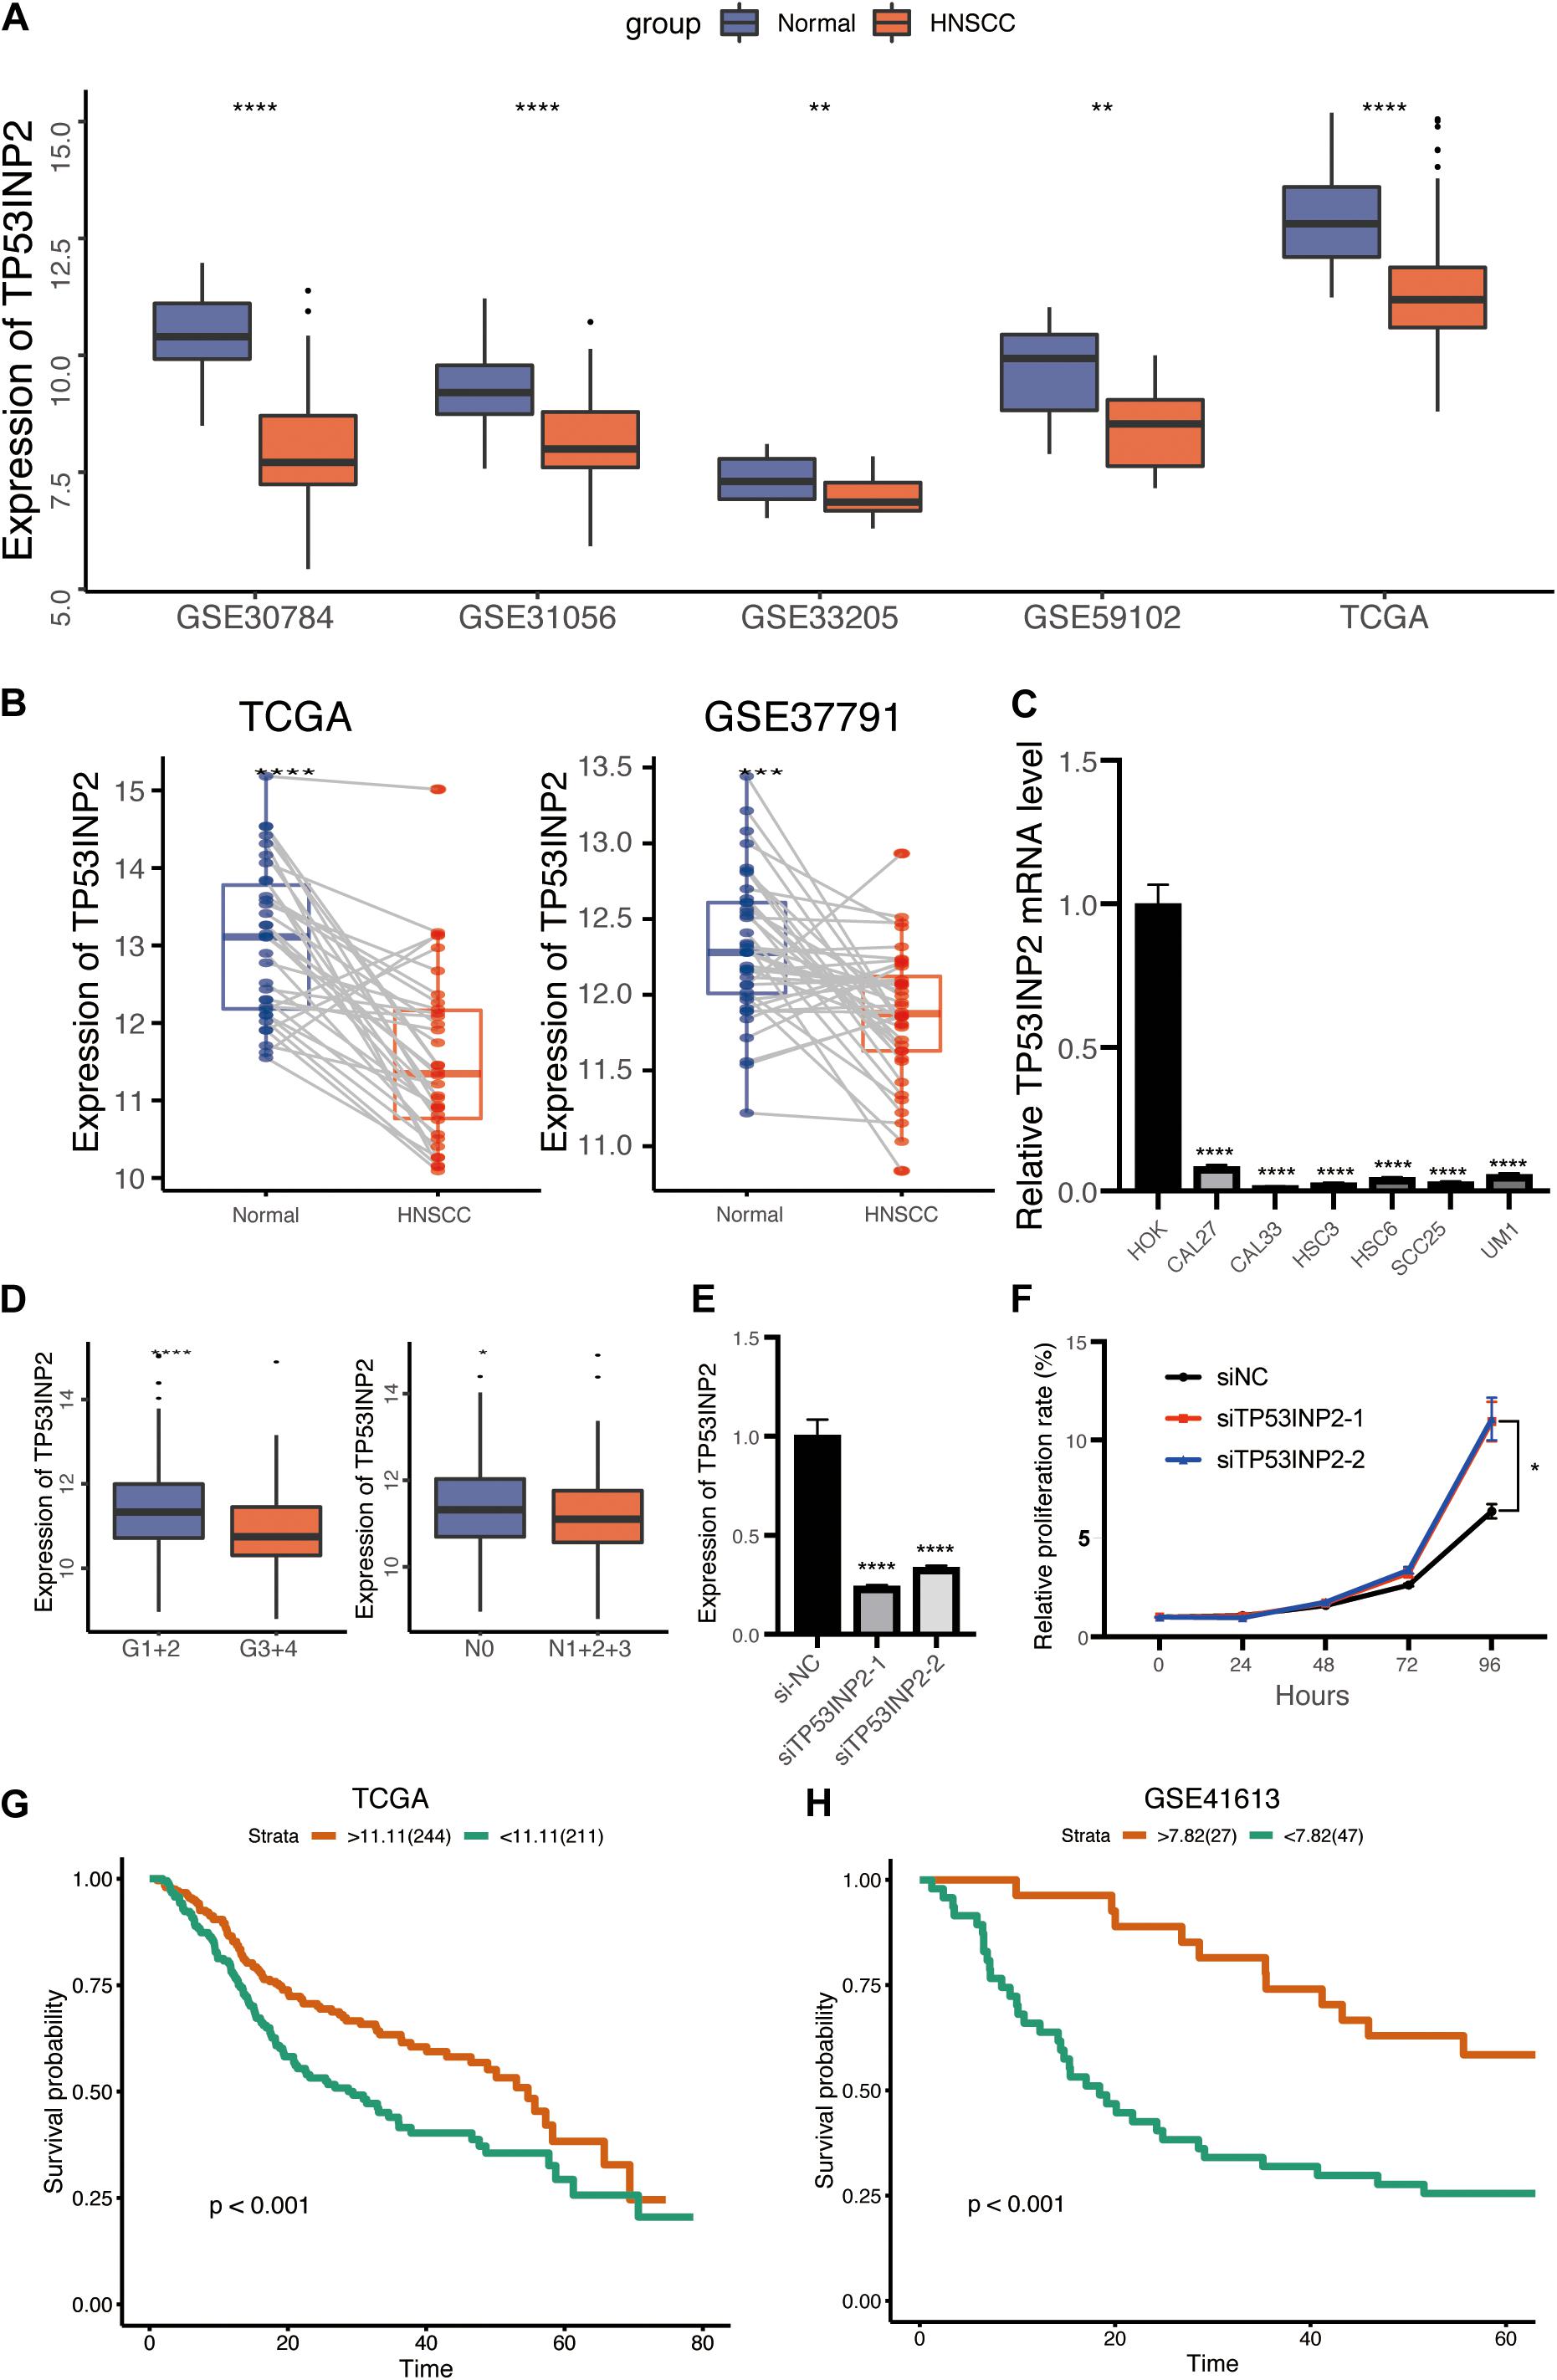
Figure 1. Low expression of TP53INP2 predicts prognosis in HNSCC. (A) Box plot of TP53INP2 expression between HNSCC and normal controls in multiple datasets. (B) Box plot of TP53INP2 expression between HNSCC and paired normal controls. (C) The relative expression of TP53INP2 expression between HNSCC cell lines and normal controls. (D) Box plot of TP53INP2 in grade and lymphatic metastasis subgroup. (E) TP53INP2 mRNA levels in CAL27 cell transfected with TP53INP2 siRNA. (F) Relative cell viability of CAL27 cell was measured by the CCK-8 at indicated time points. (G,H) Survival analysis of TP53INP2 in TCGA and GSE41613.
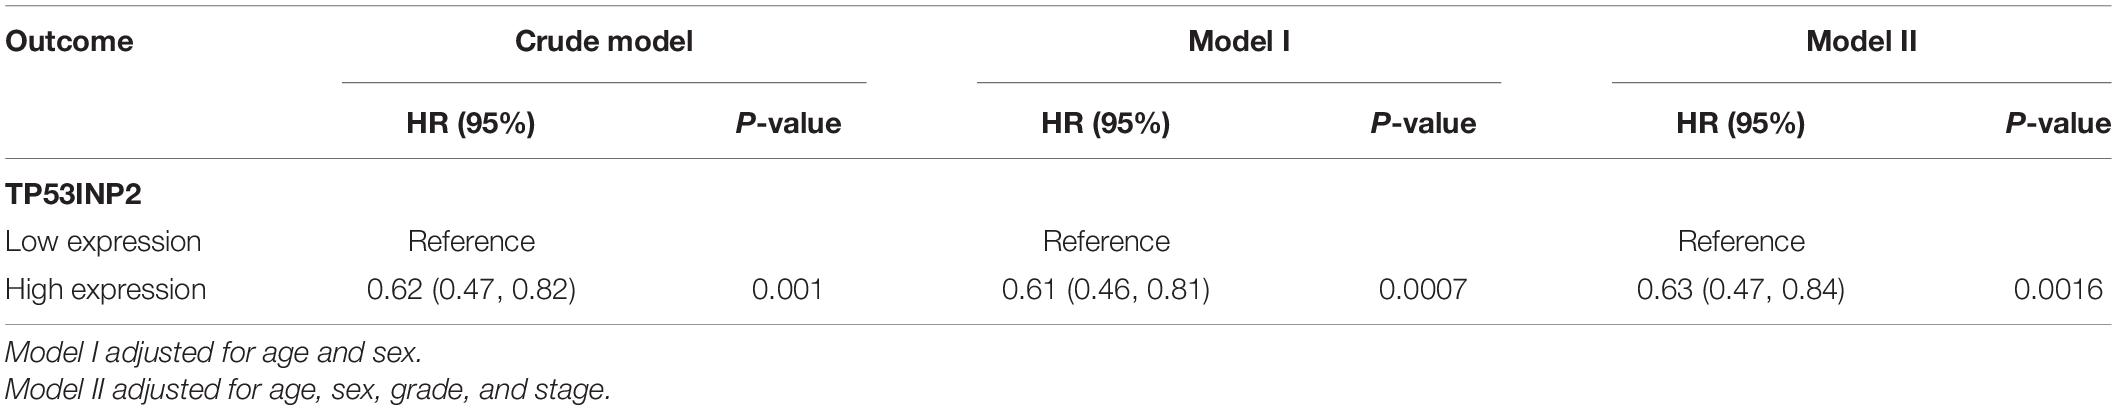
Table 1. Relationship between TP53INP2 and overall survival of HNSCC.
To elucidate whether TP53INP2 participates in the progression of HNSCC, we performed the GSEA analysis. The results showed that TP53INP2 was negatively correlated with DNA replication, DNA repair, and cell cycle. On the other hand, TP53INP2 was involved in multiple metabolic pathways, such as lipid metabolism and retinol metabolism (Figures 2A,B). To systematically evaluate the involvement of TP53INP2 in metabolic pathways, we compared the differences in 26 metabolic pathways (Choi and Na, 2018). Biological oxidations, cholesterol biosynthesis, hormone biosynthesis, lipoprotein metabolism, peroxisomal lipid metabolism, and steroid metabolism were significantly up-regulated in TP53INP2-high. Conversely, lower levels of amino acids, mRNA metabolism, proteins metabolism, RNA metabolism, purine metabolism, purine ribonucleoside monophosphate biosynthesis, and pyrimidine metabolism were found in TP53INP2-high (Figure 2C).
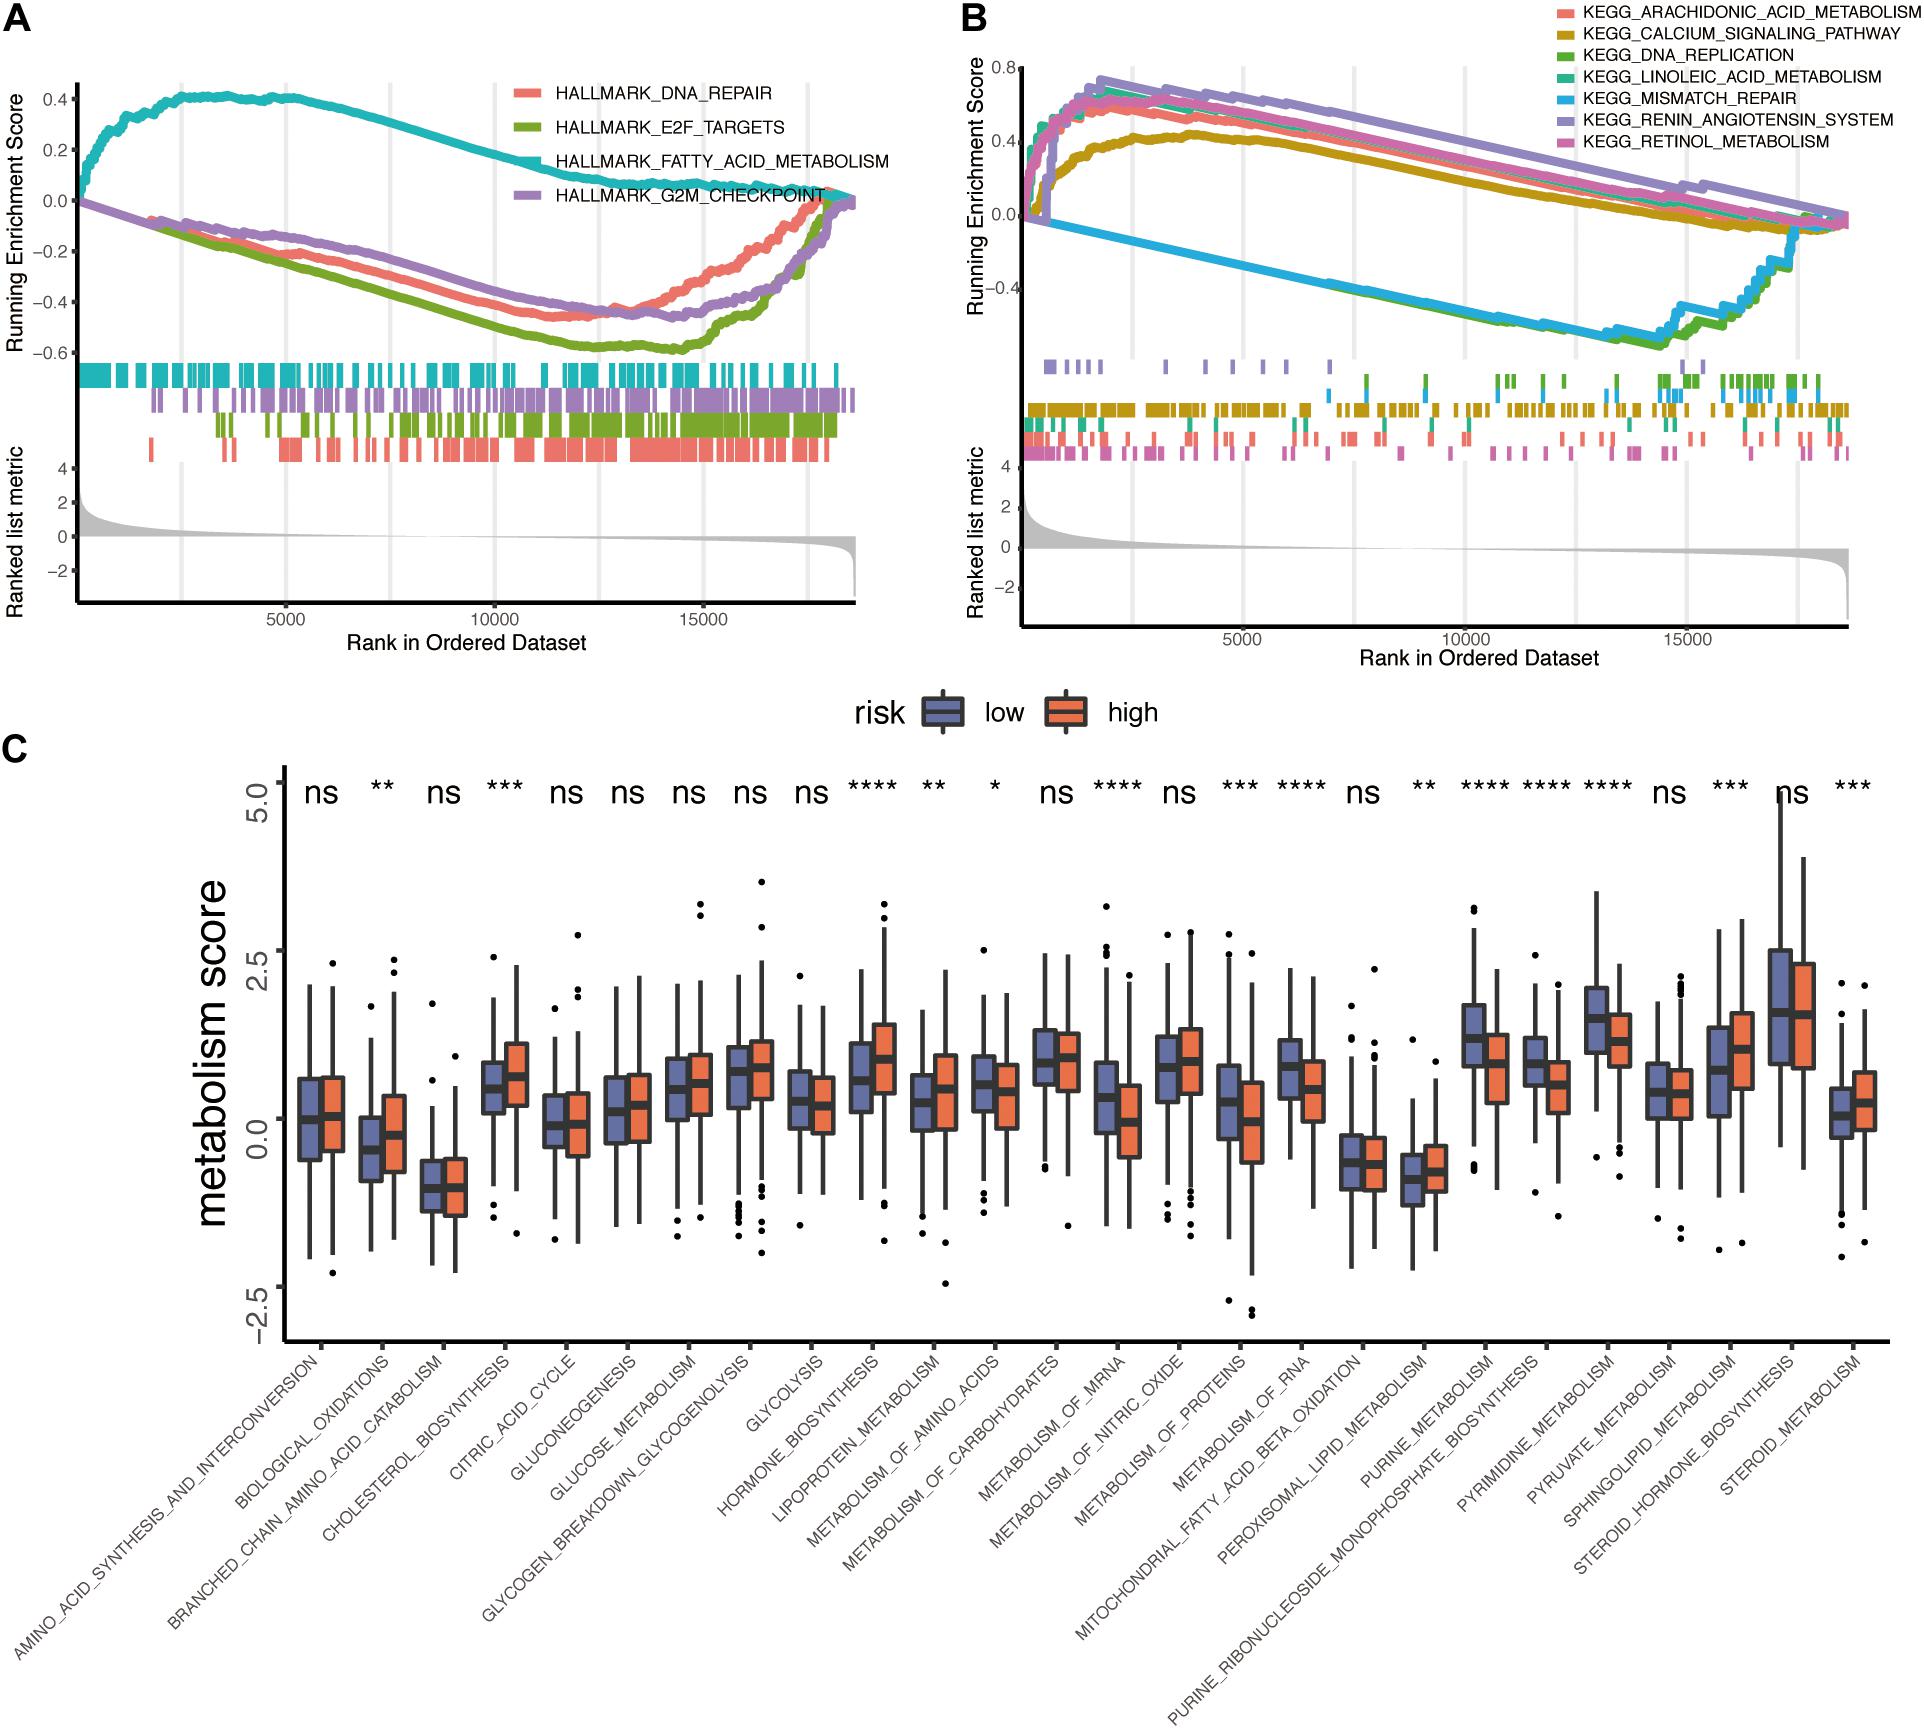
Figure 2. Functional analysis of TP53INP2 in TCGA-HNSC dataset. (A,B) GSEA analysis of Hallmarks and KEGG pathway gene sets in TP53INP2-high vs. TP53INP2-low. (C) Box plot of 26 metabolism pathways between TP53INP2-high and TP53INP2-low.
An important function of TP53INP2 is targeting THRA/TRα, GR, VDR, and PPARG to increase their transcriptional activity. Thus, we performed correlation analysis between TP53INP2 and targeted genes of nuclear hormone receptors, as well as the relationship between nuclear hormone receptors and their targeted genes. The related networks were demonstrated in Figure 3 and Supplementary Table 1. Another function of TP53INP2 is participating in autophagy. However, we did not find the difference in autophagy level between TP53INP2-high and TP53INP2-low (Supplementary Figure 1).
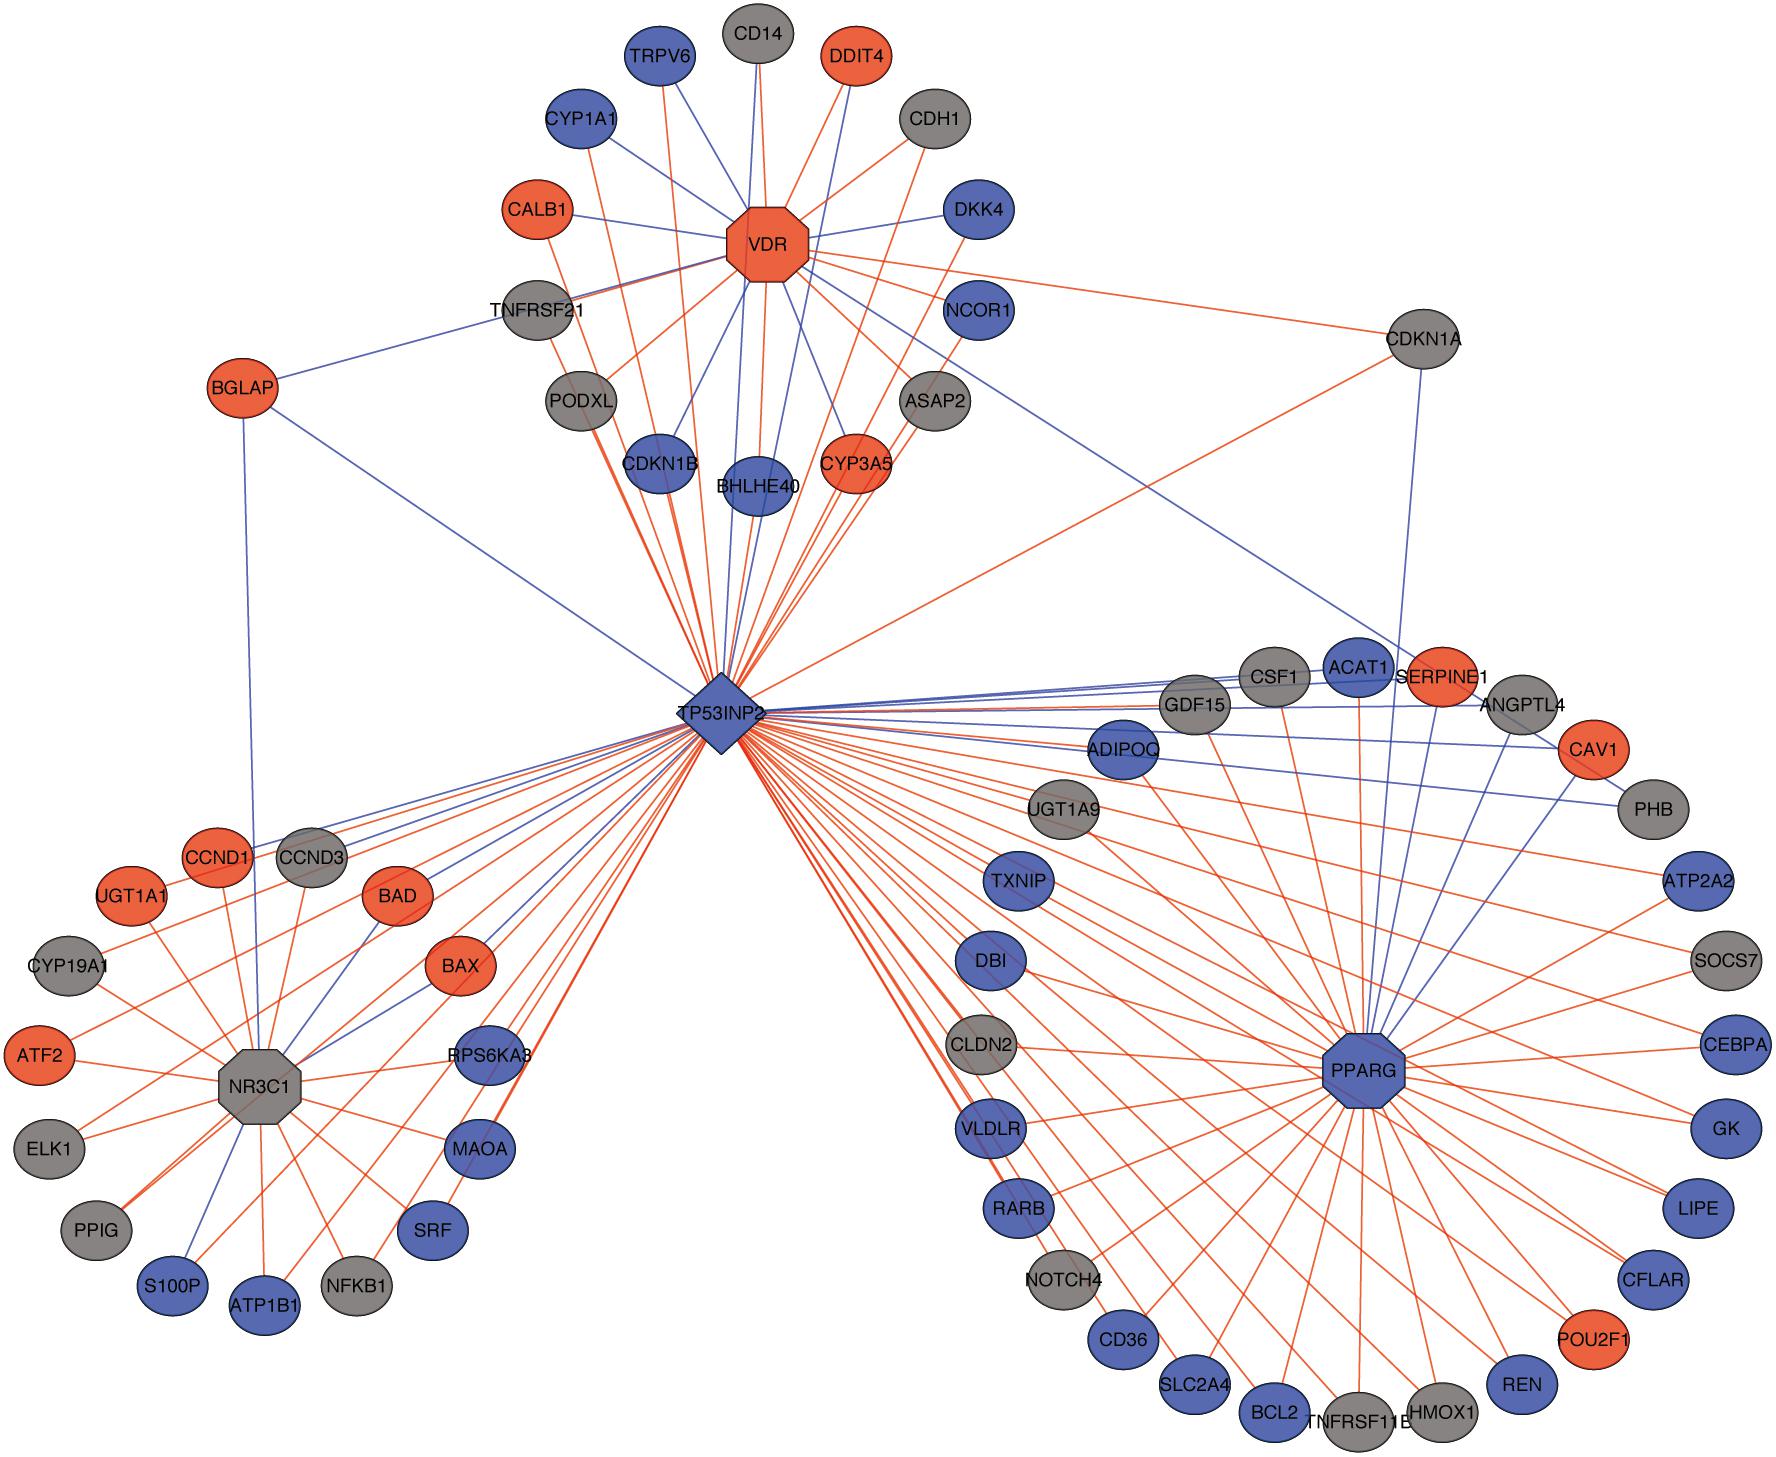
Figure 3. The network of TP53INP2 and targeted genes of nuclear hormone receptors. Red dot represents up-regulated targeted genes; blue dot represents down-regulated targeted genes; red line represents positive correlation; blue line represents negative correlation.
Based on the criteria (|FC| > 1.5 and FDR < 0.05), a total of 1,796 DEmRNAs, 26 DEmiRNAs and 1,827 DElncRNAs were identified (Figures 4A–C). According to the starbase database, we identified 71 lncRNA-miRNA pairs, including 55 lncRNAs and 13 miRNAs. A total of 335 target genes of the above 13 miRNAs were identified. Among 335 target genes, 17 genes were DEmRNAs. We finally constructed a ceRNA network including 33 lncRNAs, eight miRNAs, and 13 mRNAs based on the links of lncRNA-miRNA and miRNA-mRNA (Figure 4D and Supplementary Table 2). The survival-related genes in the ceRNA network were shown in Supplementary Figures 2–4. In addition, the relationship between mRNAs in ceRNA and drugs was presented in Supplementary Figure 5.
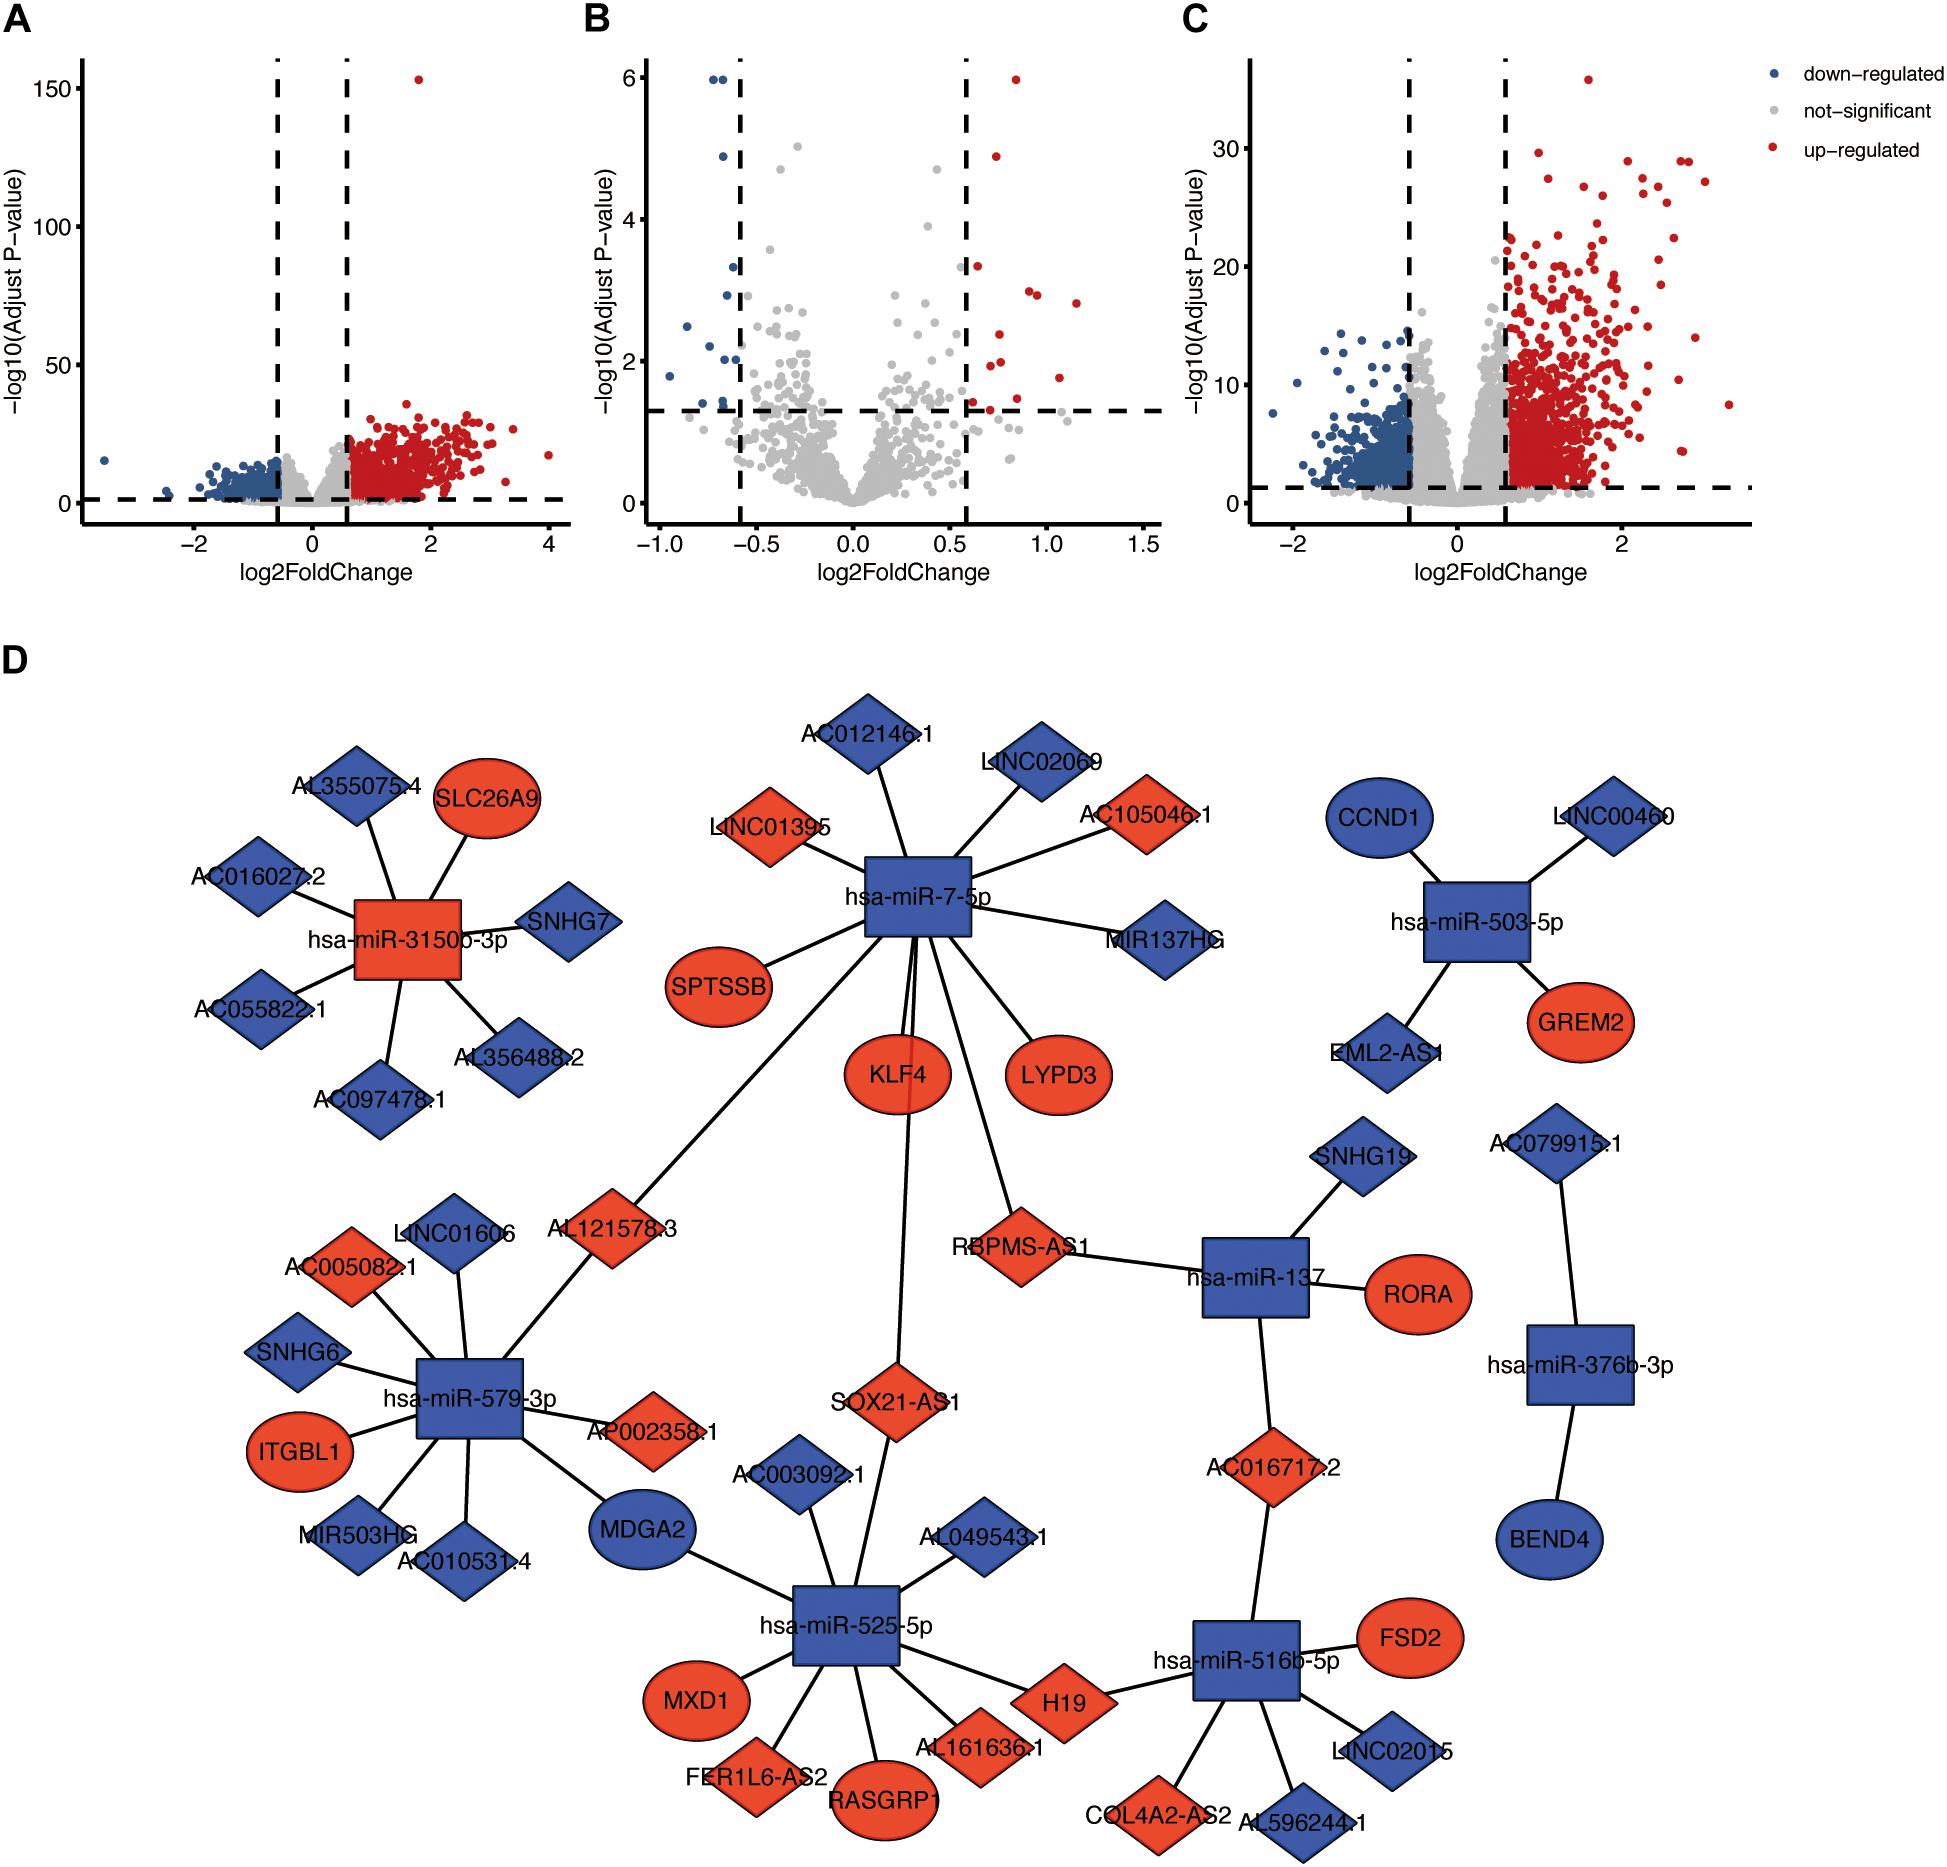
Figure 4. ceRNA network based on the TP53INP2 expression in HNSCC. (A) Volcano plot of differentially expressed mRNAs between TP53INP2-high and TP53INP2-low. (B) Volcano plot of differentially expressed miRNAs between TP53INP2-high and TP53INP2-low. (C) Volcano plot of differentially expressed lncRNAs between TP53INP2-high and TP53INP2-low. (D) LncRNAs mediated ceRNA network in HNSCC based on the expression of TP53INP2. LncRNAs, mRNAs, and miRNAs are represented by diamond, ellipse, and rectangle, respectively.
We identified 91 and 67 genomic events enriched in TP53INP2-low and TP53INP2-high based on GSITIC analysis (Figure 5A). In TP53INP2-low patients, oncogenic genes such as EGFR (7p11.2), CDK6 (7q21.13), YAP1 (11q22.2), and MMP7 (11q22.2) were frequently amplified genomic regions, while tumor suppressor genes including CDKN2A (9p21.3), KLF6 (10p15.3), and PTEN (10q23.31) were frequently deleted genomic regions. In TP53INP2-high samples, the two main significant amplification peaks were 11q13.3 and 7p11.2 while 9q21.11 was the most significant deletion peak. Based on TP53INP2 expression levels, we found similar somatic mutation profiles between TP53INP2-high and TP53INP2-low (Figure 5B).
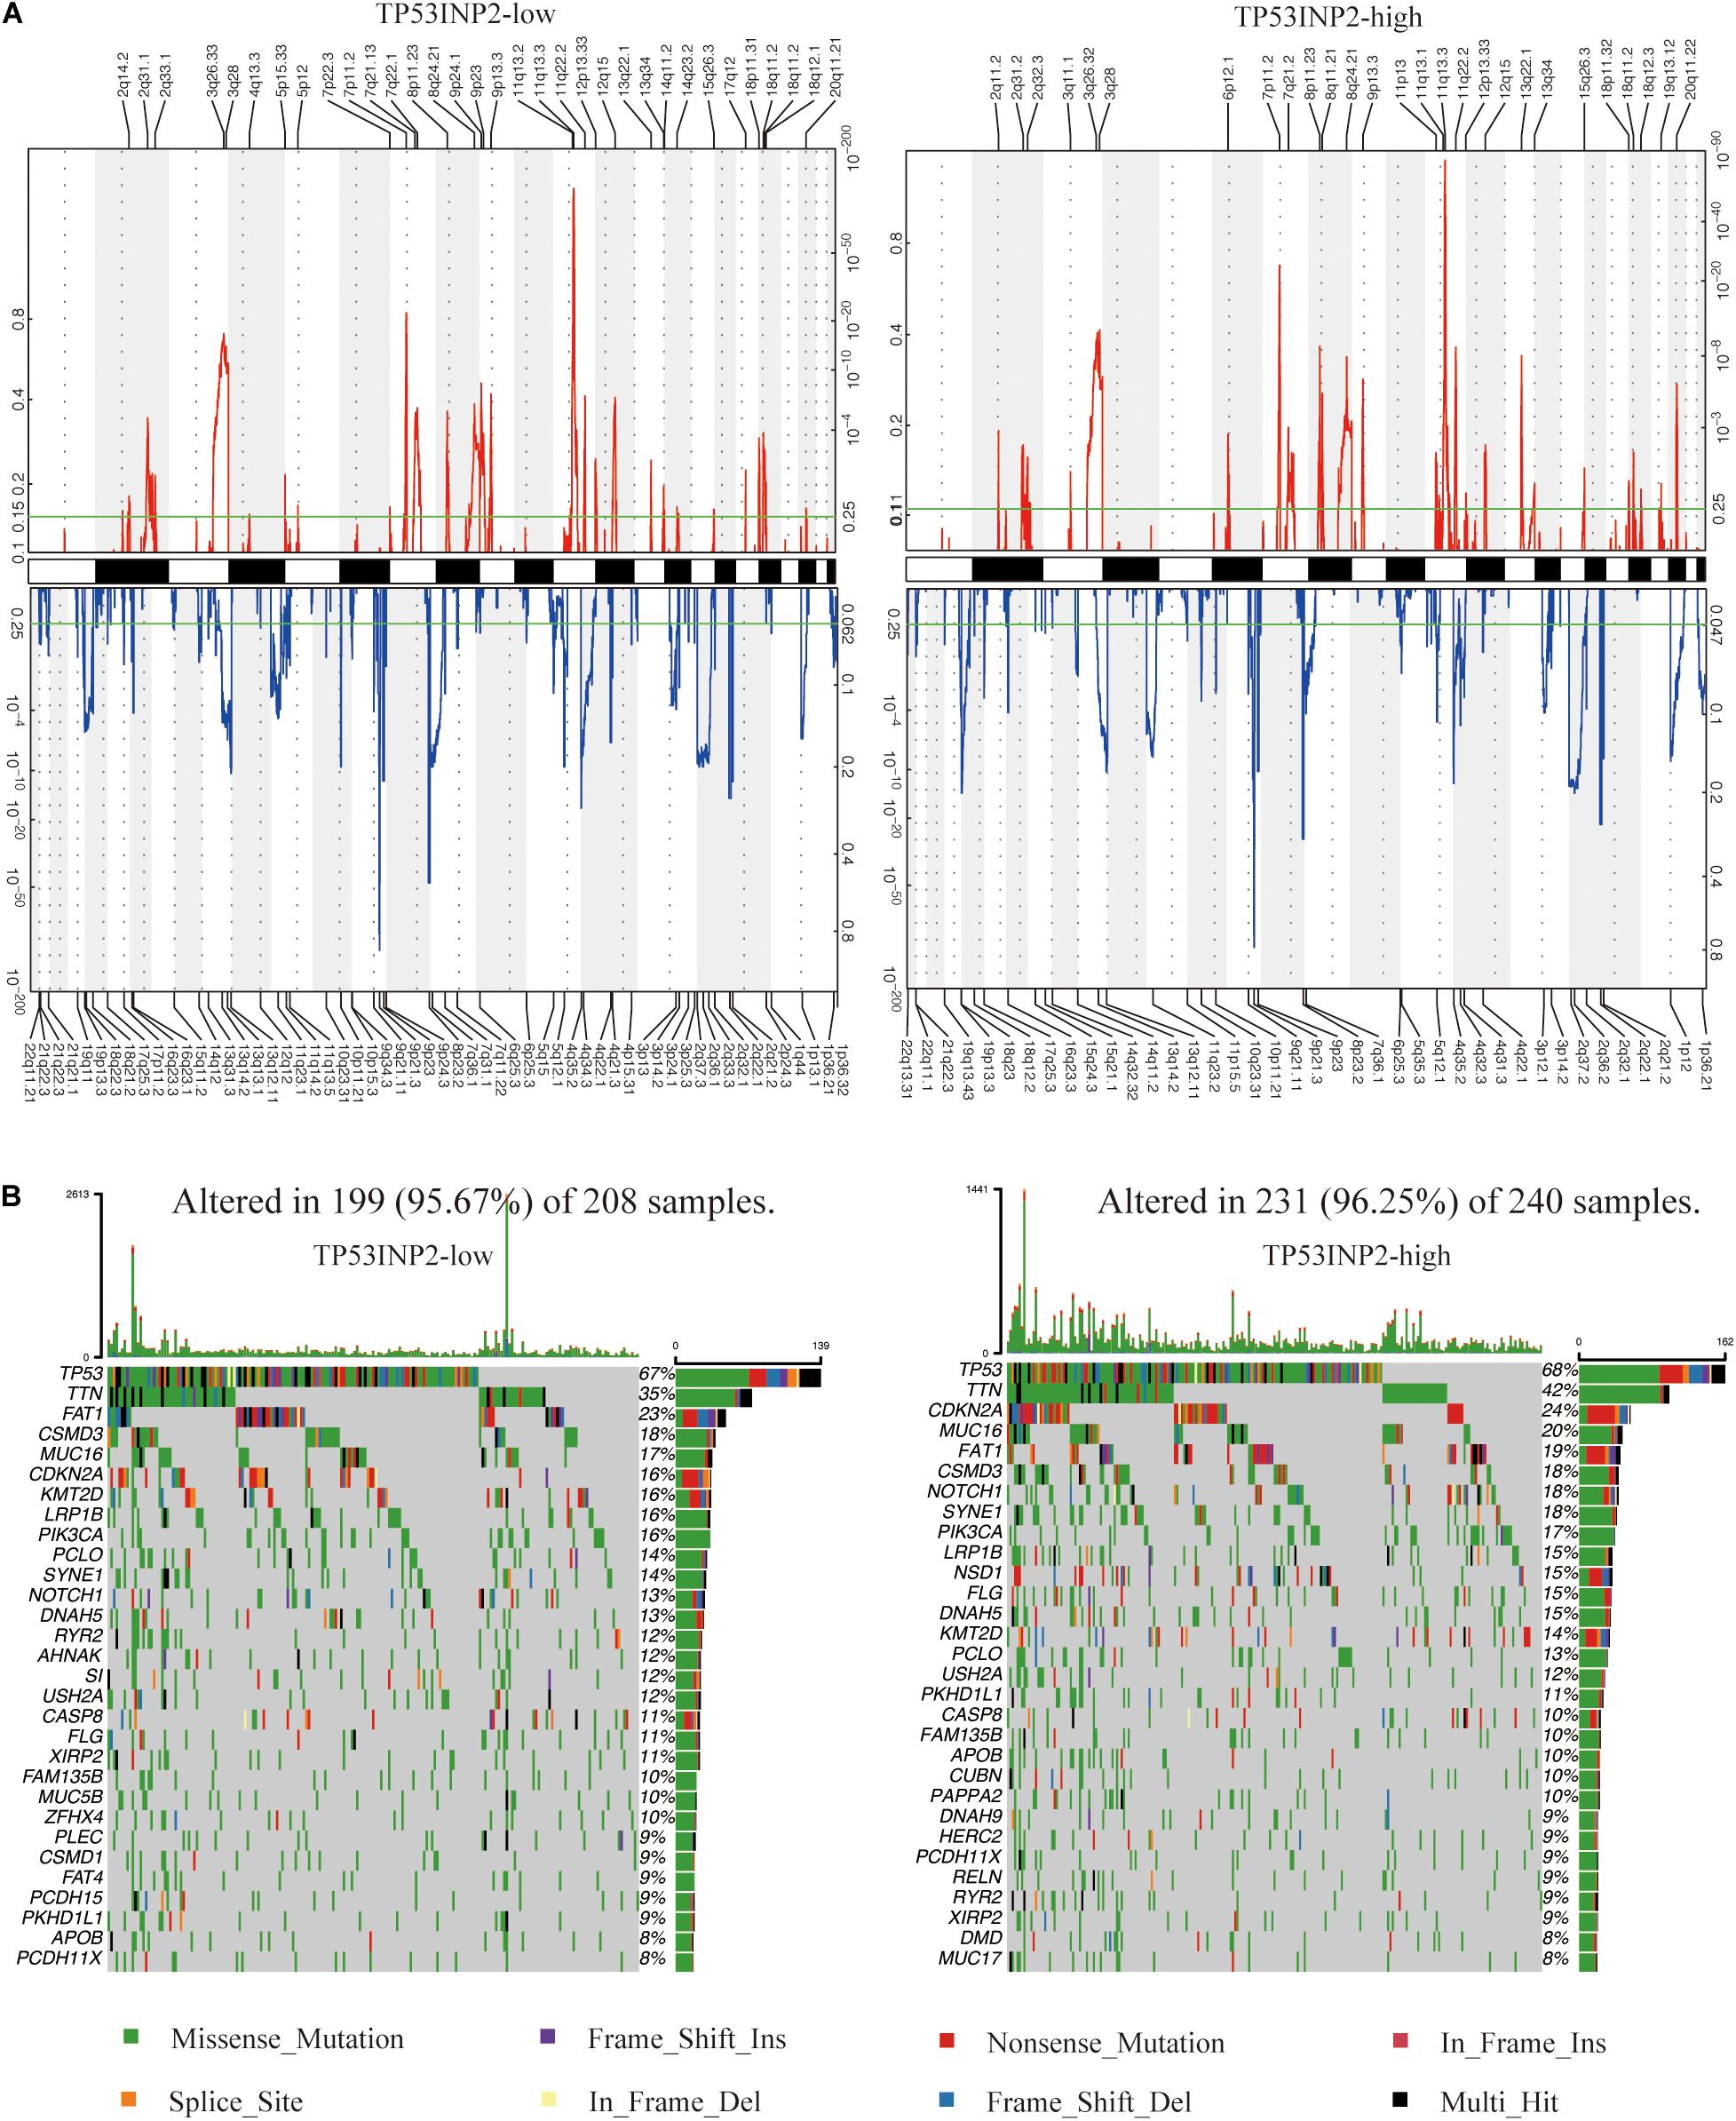
Figure 5. Distinct genomic profiles are correlated with TP53INP2 expression. (A) GISTIC 2.0 amplifications and deletions in TP53INP2-high and TP53INP2-low. (B) Somatic mutations in TP53INP2-high and TP53INP2-low.
TP53INP2, a protein-coding gene, regulates the transcriptional activity of nuclear hormone receptors, autophagy, rDNA transcription, and ubiquitylation. However, its function in HNSCC is largely unclear. Thus, this study systematically analyzed the value of TP53INP2 in HNSCC.
In this study, we found that TP53INP2 was down-regulated in HNSCC, especially in patients with poor differentiation and lymphatic metastasis. Knockdown of TP53INP2 promoted CAL27 cell proliferation. Correspondingly, low expression of TP53INP2 indicated a poor prognosis. Furthermore, some oncogenic genes like EGFR, CDK6, YAP1, and MMP7 were amplified in the TP53INP2-low patients while some tumor suppressor genes including CDKN2A, KLF6, and PTEN were deleted. These results indicated that TP53INP2 serve as a tumor suppressor gene in HNSCC. However, TP53INP2 acts as an oncogene in bladder cancer evidenced by its promotion of migration and invasion in bladder cancer cells (Zhou et al., 2020). Thus, the function of TP53INP2 might vary from the location of tumors.
Functional analysis suggested that TP53INP2 was associated with multiple metabolism pathways. Among these metabolism pathways, purine ribonucleoside monophosphate biosynthesis was higher in TP53INP2-low and it was reported to be associated with poor prognosis in HNSCC (Choi and Na, 2018). This could partly explain why HNSCC with low expression of TP53INP2 had a shorter survival time. Additionally, it has been found that TP53INP2 negatively regulates adipogenesis in preadipocytes (Romero et al., 2018). In our study, we found that the balance of lipid metabolism was disrupted when TP53INP2 was dysregulated, which might attribute to the altered expression of multiple lipid-related genes (e.g., ADIPOQ, SERPINE1, and DBI) affected by TP53INP2 via enhancing the transcriptional activity of PPARG.
Increasing studies have shown that the network mediated by lncRNAs plays an important role in tumorigenesis and progression. Thus, we constructed a ceRNA network based on the high/low expression of TP53INP2. After selecting significant lncRNAs potentially regulated by TP53INP2 expression, we noticed that LINC00460, an oncogene in HNSCC (Jiang et al., 2019; Xue et al., 2019), was also up-regulated in TP53INP2-low patients. Furthermore, we discovered that LINC00460 might regulate CCND1 which also served as an oncogene (Hanken et al., 2014; Gan et al., 2019) and was highly expressed in TP53INP2-low patients as well. Additionally, SOX21-AS1 has been reported to be a tumor suppressor gene in oral squamous cell carcinoma (Yang et al., 2016) and it was up-regulated in TP53INP2-high patients. We found that SOX21-AS1 might control the expression of MXD1, which was a tumor suppressor gene (Wu et al., 2014). However, another oncogene H19 (Guan et al., 2016; Kou et al., 2019) was up-regulated in TP53INP2-high patients, suggesting the potential feedback loop in the HNSCC carcinogenesis of the TP53INP2-high patients regulated by lncRNAs.
In conclusion, our study highlights the value of TP53INP2 in predicting HNSCC prognosis and its potential function in affecting cell viability, gene expression, metabolism pathways, copy number alteration, and ceRNA network. These results indicate the underlying mechanisms leading to the poor prognosis of HNSCC with lower TP53INP2 expression.
Publicly available datasets were analyzed in this study. This data can be found here: The Cancer Genome Atlas (TCGA) dataset (https://portal.gdc.cancer.gov/) and Gene Expression Omnibus (GEO) database (https://www.ncbi.nlm.nih.gov/geo/).
JX and BC designed the study and supervised the project. RC performed all the bioinformatics analysis described here. SL performed in vitro experiments. RC, JZ, and SL wrote and edited the manuscript. JZ, XR, and XC collected and examined the data. All authors read and approved the final manuscript.
This study was supported by the National Natural Science Foundation of China (Nos. 81671000 and 81700979), Guangdong Financial fund for High-Caliber Hospital Construction (174-2018-XMZC-0001-03-0125/D-05), the Guangdong Financial Fund for High-Caliber Hospital Construction (174-2018-XMZC-0001-03-0125/C-08), and the Fundamental Research Funds for the Central Universities (19ykpy83).
The authors declare that the research was conducted in the absence of any commercial or financial relationships that could be construed as a potential conflict of interest.
The Supplementary Material for this article can be found online at: https://www.frontiersin.org/articles/10.3389/fgene.2021.630794/full#supplementary-material
Supplementary Figure 1 | Box plot of autophagy level between TP53INP2-high and TP53INP2-low.
Supplementary Figure 2 | Survival analysis of mRNAs in TP53INP2 related ceRNA network.
Supplementary Figure 3 | Survival analysis of miRNAs in TP53INP2 related ceRNA network.
Supplementary Figure 4 | Survival analysis of lnRNAs in TP53INP2 related ceRNA network.
Supplementary Figure 5 | The relationship between drugs and mRNAs in TP53INP2 related ceRNA network.
Supplementary Table 1 | The coefficients of correlation of Figure 3.
Supplementary Table 2 | The coefficients of correlation of Figure 4.
Baumgartner, B. G., Orpinell, M., Duran, J., Ribas, V., Burghardt, H. E., Bach, D., et al. (2007). Identification of a novel modulator of thyroid hormone receptor-mediated action. PLoS One 2:e1183. doi: 10.1371/journal.pone.0001183
Bray, F., Ferlay, J., Soerjomataram, I., Siegel, R., Torre, L., and Jemal, A. J. (2018). Global cancer statistics 2018: GLOBOCAN estimates of incidence and mortality worldwide for 36 cancers in 185 countries. CA Cancer J. Clin. 68, 394–424. doi: 10.3322/caac.21492
Choi, H., and Na, K. J. (2018). Pan-cancer analysis of tumor metabolic landscape associated with genomic alterations. Mol. Cancer 17:150.
Gan, C. P., Sam, K. K., Yee, P. S., Zainal, N. S., Lee, B. K. B., Abdul Rahman, Z. A., et al. (2019). IFITM3 knockdown reduces the expression of CCND1 and CDK4 and suppresses the growth of oral squamous cell carcinoma cells. Cell. Oncol. 42, 477–490. doi: 10.1007/s13402-019-00437-z
Guan, G. F., Zhang, D. J., Wen, L. J., Xin, D., Liu, Y., Yu, D. J., et al. (2016). Overexpression of lncRNA H19/miR-675 promotes tumorigenesis in head and neck squamous cell carcinoma. Intern. J. Med. Sci. 13, 914–922. doi: 10.7150/ijms.16571
Hanken, H., Gröbe, A., Cachovan, G., Smeets, R., Simon, R., Sauter, G., et al. (2014). CCND1 amplification and cyclin D1 immunohistochemical expression in head and neck squamous cell carcinomas. Clin. Oral Invest. 18, 269–276. doi: 10.1007/s00784-013-0967-6
Huang, R., Xu, Y., Wan, W., Shou, X., Qian, J., You, Z., et al. (2015). Deacetylation of nuclear LC3 drives autophagy initiation under starvation. Mol. Cell 57, 456–466. doi: 10.1016/j.molcel.2014.12.013
Jiang, Y., Cao, W., Wu, K., Qin, X., Wang, X., Li, Y., et al. (2019). LncRNA LINC00460 promotes EMT in head and neck squamous cell carcinoma by facilitating peroxiredoxin-1 into the nucleus. J. Exper. Clin. Cancer Res. 38:365.
Kou, N., Liu, S., Li, X., Li, W., Zhong, W., Gui, L., et al. (2019). H19 facilitates tongue squamous cell carcinoma migration and invasion via sponging miR-let-7. Oncol. Res. 27, 173–182. doi: 10.3727/096504018x15202945197589
Nowak, J., Archange, C., Tardivel-Lacombe, J., Pontarotti, P., Pébusque, M. J., Vaccaro, M. I., et al. (2009). The TP53INP2 protein is required for autophagy in mammalian cells. Mol. Biol. Cell 20, 870–881. doi: 10.1091/mbc.e08-07-0671
Romero, M., Sabaté-Pérez, A., Francis, V. A., Castrillón-Rodriguez, I., Díaz-Ramos, Á, Sánchez-Feutrie, M., et al. (2018). TP53INP2 regulates adiposity by activating β-catenin through autophagy-dependent sequestration of GSK3β. Nat. Cell Biol. 20, 443–454. doi: 10.1038/s41556-018-0072-9
Sancho, A., Duran, J., García-España, A., Mauvezin, C., Alemu, E. A., Lamark, T., et al. (2012). DOR/Tp53inp2 and Tp53inp1 constitute a metazoan gene family encoding dual regulators of autophagy and transcription. PLoS One 7:e34034. doi: 10.1371/journal.pone.0034034
van der Schroeff, M. P., van de Schans, S. A., Piccirillo, J. F., Langeveld, T. P., Baatenburg de Jong, R. J., and Janssen-Heijnen, M. L. (2010). Conditional relative survival in head and neck squamous cell carcinoma: permanent excess mortality risk for long-term survivors. Head Neck 32, 1613–1618. doi: 10.1002/hed.21369
Wu, Q., Yang, Z., An, Y., Hu, H., Yin, J., Zhang, P., et al. (2014). MiR-19a/b modulate. The metastasis of gastric cancer cells by targeting the tumour suppressor MXD1. Cell Death Dis. 5:e1144. doi: 10.1038/cddis.2014.110
Xu, Y., and Wan, W. (2019). TP53INP2 mediates autophagic degradation of ubiquitinated proteins through. its ubiquitin-interacting motif. FEBS Lett. 593, 1974–1982. doi: 10.1002/1873-3468.13467
Xu, Y., and Wan, W. (2020). The bifunctional role of TP53INP2 in transcription and autophagy. Autophagy 16, 1341–1343. doi: 10.1080/15548627.2020.1713646
Xu, Y., Wan, W., Shou, X., Huang, R., You, Z., Shou, Y., et al. (2016). TP53INP2/DOR, a. mediator of cell autophagy, promotes rDNA transcription via facilitating the assembly of the POLR1/RNA polymerase I preinitiation complex at rDNA promoters. Autophagy 12, 1118–1128. doi: 10.1080/15548627.2016.1175693
Xue, K., Li, J., Nan, S., Zhao, X., and Xu, C. (2019). Downregulation of LINC00460 decreases STC2 and. promotes autophagy of head and neck squamous cell carcinoma by up-regulating microRNA-206. Life Sci. 231:116459. doi: 10.1016/j.lfs.2019.05.015
Yang, C. M., Wang, T. H., Chen, H. C., Li, S. C., Lee, M. C., Liou, H. H., et al. (2016). Aberrant DNA hypermethylation-silenced SOX21-AS1 gene expression and its clinical importance in oral cancer. Clin. Epigenet. 8:129.
You, Z., Xu, Y., Wan, W., Zhou, L., Li, J., Zhou, T., et al. (2019). TP53INP2 contributes to. autophagosome formation by promoting LC3-ATG7 interaction. Autophagy 15, 1309–1321. doi: 10.1080/15548627.2019.1580510
Yu, D., Liu, X., Han, G., Liu, Y., Zhao, X., Wang, D., et al. (2019). The let-7 family of microRNAs suppresses immune evasion in head and neck squamous cell carcinoma by promoting PD-L1 degradation. Cell Commun. Signal. 17:173.
Keywords: TP53INP2, head and neck squamous cell carcinoma, prognosis, bioinformatics, multi-omics
Citation: Cao R, Liu S, Zhang J, Ren X, Chen X, Cheng B and Xia J (2021) Integrative Analysis of TP53INP2 in Head and Neck Squamous Cell Carcinoma. Front. Genet. 12:630794. doi: 10.3389/fgene.2021.630794
Received: 18 November 2020; Accepted: 18 March 2021;
Published: 09 April 2021.
Edited by:
Giulia Fontemaggi, Regina Elena National Cancer Institute (IRCCS), ItalyReviewed by:
Andrea Sacconi, Regina Elena National Cancer Institute (IRCCS), ItalyCopyright © 2021 Cao, Liu, Zhang, Ren, Chen, Cheng and Xia. This is an open-access article distributed under the terms of the Creative Commons Attribution License (CC BY). The use, distribution or reproduction in other forums is permitted, provided the original author(s) and the copyright owner(s) are credited and that the original publication in this journal is cited, in accordance with accepted academic practice. No use, distribution or reproduction is permitted which does not comply with these terms.
*Correspondence: Bin Cheng, Y2hlbmdiaW5AbWFpbC5zeXN1LmVkdS5jbg==; Juan Xia, eGlhanVhbkBtYWlsLnN5c3UuZWR1LmNu
Disclaimer: All claims expressed in this article are solely those of the authors and do not necessarily represent those of their affiliated organizations, or those of the publisher, the editors and the reviewers. Any product that may be evaluated in this article or claim that may be made by its manufacturer is not guaranteed or endorsed by the publisher.
Research integrity at Frontiers
Learn more about the work of our research integrity team to safeguard the quality of each article we publish.