 Cheng-He Sun
 Hong-Yi Liu
 Nan Xu2
- 1Department of Ecology, Jinan University, Guangzhou, China
- 2College of Biology and the Environment, Nanjing Forestry University, Nanjing, China
The Characidae family contains the largest number of tropical fish species. Morphological similarities make species identification difficult within this family. Here, the complete mitogenomes of two Characidae fish were determined and comparatively analyzed with those of nine other Characidae fish species. The two newly sequenced complete mitogenomes are circular DNA molecules with sizes of 16,701 bp (Hyphessobrycon amandae; MT484069) and 16,710 bp (Hemigrammus erythrozonus; MT484070); both have a highly conserved structure typical of Characidae, with the start codon ATN (ATG/ATT) and stop codon TAR (TAA/TAG) or an incomplete T−−/TA−. Most protein-coding genes of the 11 Characidae mitogenomes showed significant codon usage bias, and the protein-coding gene cox1 was found to be a comparatively slow-evolving gene. Phylogenetic analyses via the maximum likelihood and Bayesian inference methods confirmed that H. amandae and H. erythrozonus belong to the family Characidae. In all Characidae species studied, one genus was well supported; whereas other two genera showed marked differentiation. These findings provide a phylogenetic basis for improved classification of the family Characidae. Determining the mitogenomes of H. erythrozonus and H. amandae improves our understanding of the phylogeny and evolution of fish species.
Highlights
- The first complete mitogenomes of Hemigrammus erythrozonus and Hyphessobrycon amandae were assembled.
- The phylogenetic relationships among Characidae fishes were deduced using complete mitogenomes.
- These data are important for phylogenetic and taxonomic studies on Characidae.
Introduction
The mitochondrion is an organelle that can directly convert organic matter into energy to support the biological activities of a cell (Avise et al., 1987; Wataru et al., 2013; Strohm et al., 2015; Parhi et al., 2019). It is the main site of ATP production and oxidative phosphorylation in eukaryotic cells (Wilson et al., 1985). Mitochondria possess mitochondrial DNA (mtDNA), which has a closed circular double-stranded structure and self-replicates semi-conservatively (Prosdocimi et al., 2012; Paz et al., 2014). Mitochondrial DNA is considered the second genetic information system of eukaryotic cells (Kim et al., 2008; Cooke et al., 2012; Zhao et al., 2015; Ruan et al., 2020). Compared with nuclear DNA, it is a relatively independent replication unit characterized by a small size, simple structure, maternal inheritance, rapid evolution, limited recombination, and variability in evolutionary rate at different loci (Harrison, 1989; Javonillo et al., 2010). These characteristics make mitochondrial genome (mitogenome) a valuable resource for studying DNA structure and gene expression, as well as for understanding the evolution and phylogenetic distribution of species.
Recent advances in molecular biology, such as second-generation sequencing technologies, have facilitated the sequencing of fish mtDNA, thereby providing a clearer understanding of the structures of fish mitogenomes, which are between 16 and 18 kb. Structurally, protein coding (PCG), transfer RNA (tRNA), and ribosomal RNA (rRNA) genes as well as the noncoding regions of fish mitogenomes are highly conserved, but gene intervals and lengths vary between species (Gray, 1989; Kim et al., 2009; Alam et al., 2014). As mtDNA sequences of many fish species have been determined, mitogenomes have become popular molecular guides in phylogenetic and evolutionary studies of fishes (Brown et al., 1979; Wang et al., 2016; Wu et al., 2020).
The Characidae family contains the largest number of species among tropical fishes and belongs to class Actinopterygii and order Characiformes (Wilkens, 1988; Mirande, 2010). This family is mainly found in the freshwater rivers and lakes of Africa and America and inhabits habitats with slow water flows. The fish species of this family are characterized by a small adipose fin on the caudal stalk. Most Characidae are small and harmless; only a few species are predatory. Because of the small body size and colorful markings, Characidae is the most popular tropical fish family raised. With the rapid development of the global trade market of ornamental fish, increase in fishing activities, and deterioration of ecological habitats, the natural resources that Characidae fish depend on have been seriously damaged. Accurate species identification and understanding of the systematic relationships among species are useful for protecting existing species and discovering new species. However, the classification of Characidae species remains difficult because of the morphological similarities among many species (Wilkens, 1971; Langerhans et al., 2003; Oliveira et al., 2011; Barreto et al., 2017).
As there are many types of ornamental fish available in the market and hybrid species are widespread, two common fishes were selected for this study. The main reason for choosing Glowlight tetras (Hemigrammus erythrozonus) and Ember tetra (Hyphessobrycon amandae) is that these two fishes are representative and common in the family Characidae, and their morphological characterization is relatively accurate. In this study, the complete mitochondrial genomes of two tropical fishes were sequenced, assembled, and annotated. The genome organization, gene contents, repeat sequences, and tRNA structures of the two newly sequenced mitogenomes were compared and analyzed. The mitogenomes of these two fishes were compared with those of nine other Characidae species to identify the similarities and differences in their gene orders, genetic structures, base compositions, evolutionary features, and codon usage. Additionally, phylogenetic analysis of various Characiformes species was carried out using a combined mitochondrial gene set. The mitogenomes of the two Characidae species improve our phylogenetic and evolutionary understanding of Characidae fishes.
Materials and Methods
Samples and DNA Extraction
The two specimens were collected from the Nanjing Qiqiaoweng flower and bird market, Jiangsu province, China (32°0′27.1′′N, 118°50′11.5′′E). Morphological identification was conducted during the sampling according to the latest taxonomic classification of fish. As these two species were collected from an ornamental fish market, the geographic data about the specific origins of the species are unknown. Total genomic DNA from the samples was extracted using a FastPure Cell/Tissue DNA Isolation Mini Kit V7.1 (Vazyme Biotech Co., Ltd., Nanjing, China) (Chen et al., 2018). DNA integrity was evaluated via 1.5% agarose gel electrophoresis. DNA concentration and purity were assessed using a NanoDrop 2000 (NanoDrop Technologies, Wilmington, NC, United States).
PCR Amplification and DNA Sequencing
To amplify the mitogenomes of Hemigrammus erythrozonus and Hyphessobrycon amandae, nine pairs of specificity primers (Table 1) were designed based on the published conserved nucleotide sequences of nine Characidae mitogenomes (Astyanax giton, Astyanax paranae, Gephyrocharax atracaudatus, Grundulus bogotensis, Hasemania nana, Hemigrammus bleheri, Oligosarcus argenteus, Paracheirodon axelrodi, and Paracheirodon innesi). For accurate sequencing and assembly of the complete mitogenomes, the overlap between adjacent fragments was designed to exceed 200–300 base pairs (bp). Because of the differences in the mitogenomes between the two species, specific primers were designed. PCR amplification was performed as described previously (Sun et al., 2019a). The PCR products were electrophoretically separated on a 1.5% agarose gel and subsequently purified and Sanger-sequenced by Tsingke Biotech (Tsingke Biotechnology Co., Ltd., Nanjing, China).

Table 1. Primers for the PCR-amplification of the two Characidae mitogenome sequences.
Genome Assembly and Annotation
DNA sequencing results were verified using NCBI BLAST (Johnson et al., 2008). Raw sequence data from the DNA fragments were screened and assembled using Lasergene 7.1 (DNAStar, Inc. Madison, WI, United States) to obtain the complete mitogenome sequences. The tRNAscan-SE v2.0 (Lowe and Chan, 2016) software and MITOS WebServer1 (Bernt et al., 2013) were used to verify the tRNA genes. Open reading frame finder (Master et al., 2016; Sun et al., 2019b) and the NCBI website were used to identify the protein-coding regions by using the default settings for the vertebrate mitochondrial code, and GenBank was used to translate the putative proteins. The sequences of the identified PCGs and rRNAs were analyzed and compared with those of other Characidae species.
MEGA version 7.0 (Kumar et al., 2016) was used to determine base compositions, genetic distances, and relative synonymous codon usage values. The formula “AT-skew = (A − T)/(A ++ T)” (Perna and Kocher, 1995) was used to analyze strand asymmetry. DnaSP 5.1 (Librado and Rozas, 2009) was used to determine the rates of non-synonymous (Ka) and synonymous substitutions (Ks) and the ratio of Ka/Ks for the 13 Characidae species. The online software Ogdraw2 (Lohse et al., 2013) was used to generate circular mitogenome maps.
Phylogenetic Analyses
To investigate the phylogenetic relationship between the two Characidae species, a phylogenetic tree of 24 Actinopterygii species (Table 2) was constructed based on the combined mitochondrial gene set (13 PCGs + two rRNAs). MAFFT v7.313 (Katoh and Standley, 2013) was used to perform multiple-sequence alignment. The maximum likelihood (ML) and Bayesian inference (BI) methods were used for phylogenetic analysis. ModelFinder (Kalyaanamoorthy et al., 2017) was used to select the best-fit substitution model and best partitioning scheme, a greedy algorithm was adopted with the Akaike information criterion (Yamaoka et al., 1978). ML method was used to construct an evolutionary tree by using IQ-TREE v.1.6.8 (Nguyen et al., 2015) based on the GTR + R + F model. The BI method was used to construct an evolutionary tree by using MrBayes v3.2.6 (Ronquist et al., 2012) based on the GTR + I + G + F model. Two independent runs with four chains each were simultaneously conducted for ten million generations, with one tree sampled every 100 generations. The first 25% of the samples was discarded as burn-in, and the remaining trees were used to calculate the Bayesian posterior probabilities. FigTree v1.4.0 (Rambaut, 2015) was used to visualize and edit the resulting phylogenetic evolutionary trees.

Table 2. List of the mitogenomes analyzed in this study.
Results and Discussion
General Features of the Two Mitogenomes
The two mitogenomes were found to be circular DNA molecules. The sizes of H. erythrozonus and H. amandae mitogenomes were 16,710 and 16,701 bp, respectively, (Table 3 and Figure 1), which are similar to the mitogenome sizes of other Characidae species, (Javonillo et al., 2010) such as H. bleheri (17,021 bp) and O. argenteus (16,711 bp). The gene arrangement and content of the two Characidae mitogenomes were typical of Characidae and highly conserved (Table 4), comprising 37 mitochondrial genes (13 PCGs, 22 tRNAs, and 2 rRNAs) and one control regions (CR). Eight tRNAs (trnA, trnC, trnE, trnN, trnP, trnQ, trnS2, and trnY) and nad6 were found to be encoded on the L-strand (Figure 1), whereas 14 tRNAs, 12 PCGs, 2 rRNAs, and 1 CR were on the H-strand. Similar to other fish mitogenomes (Kim et al., 2008; Ruan et al., 2020), the A + T content in Characidae mitogenomes was highly biased, ranging from 57.1 (A. paranae) to 60.1% (G. bogotensis) (Table 4). The base composition of a mitogenome is frequently described in terms of the AT skew. The negligible A skew (0.020 and 0.016 for H. erythrozonus and H. amandae, respectively) in each sequenced mitogenome was similar to those in other Characidae and most fish species (Calcagnotto et al., 2005; Zhang et al., 2016).
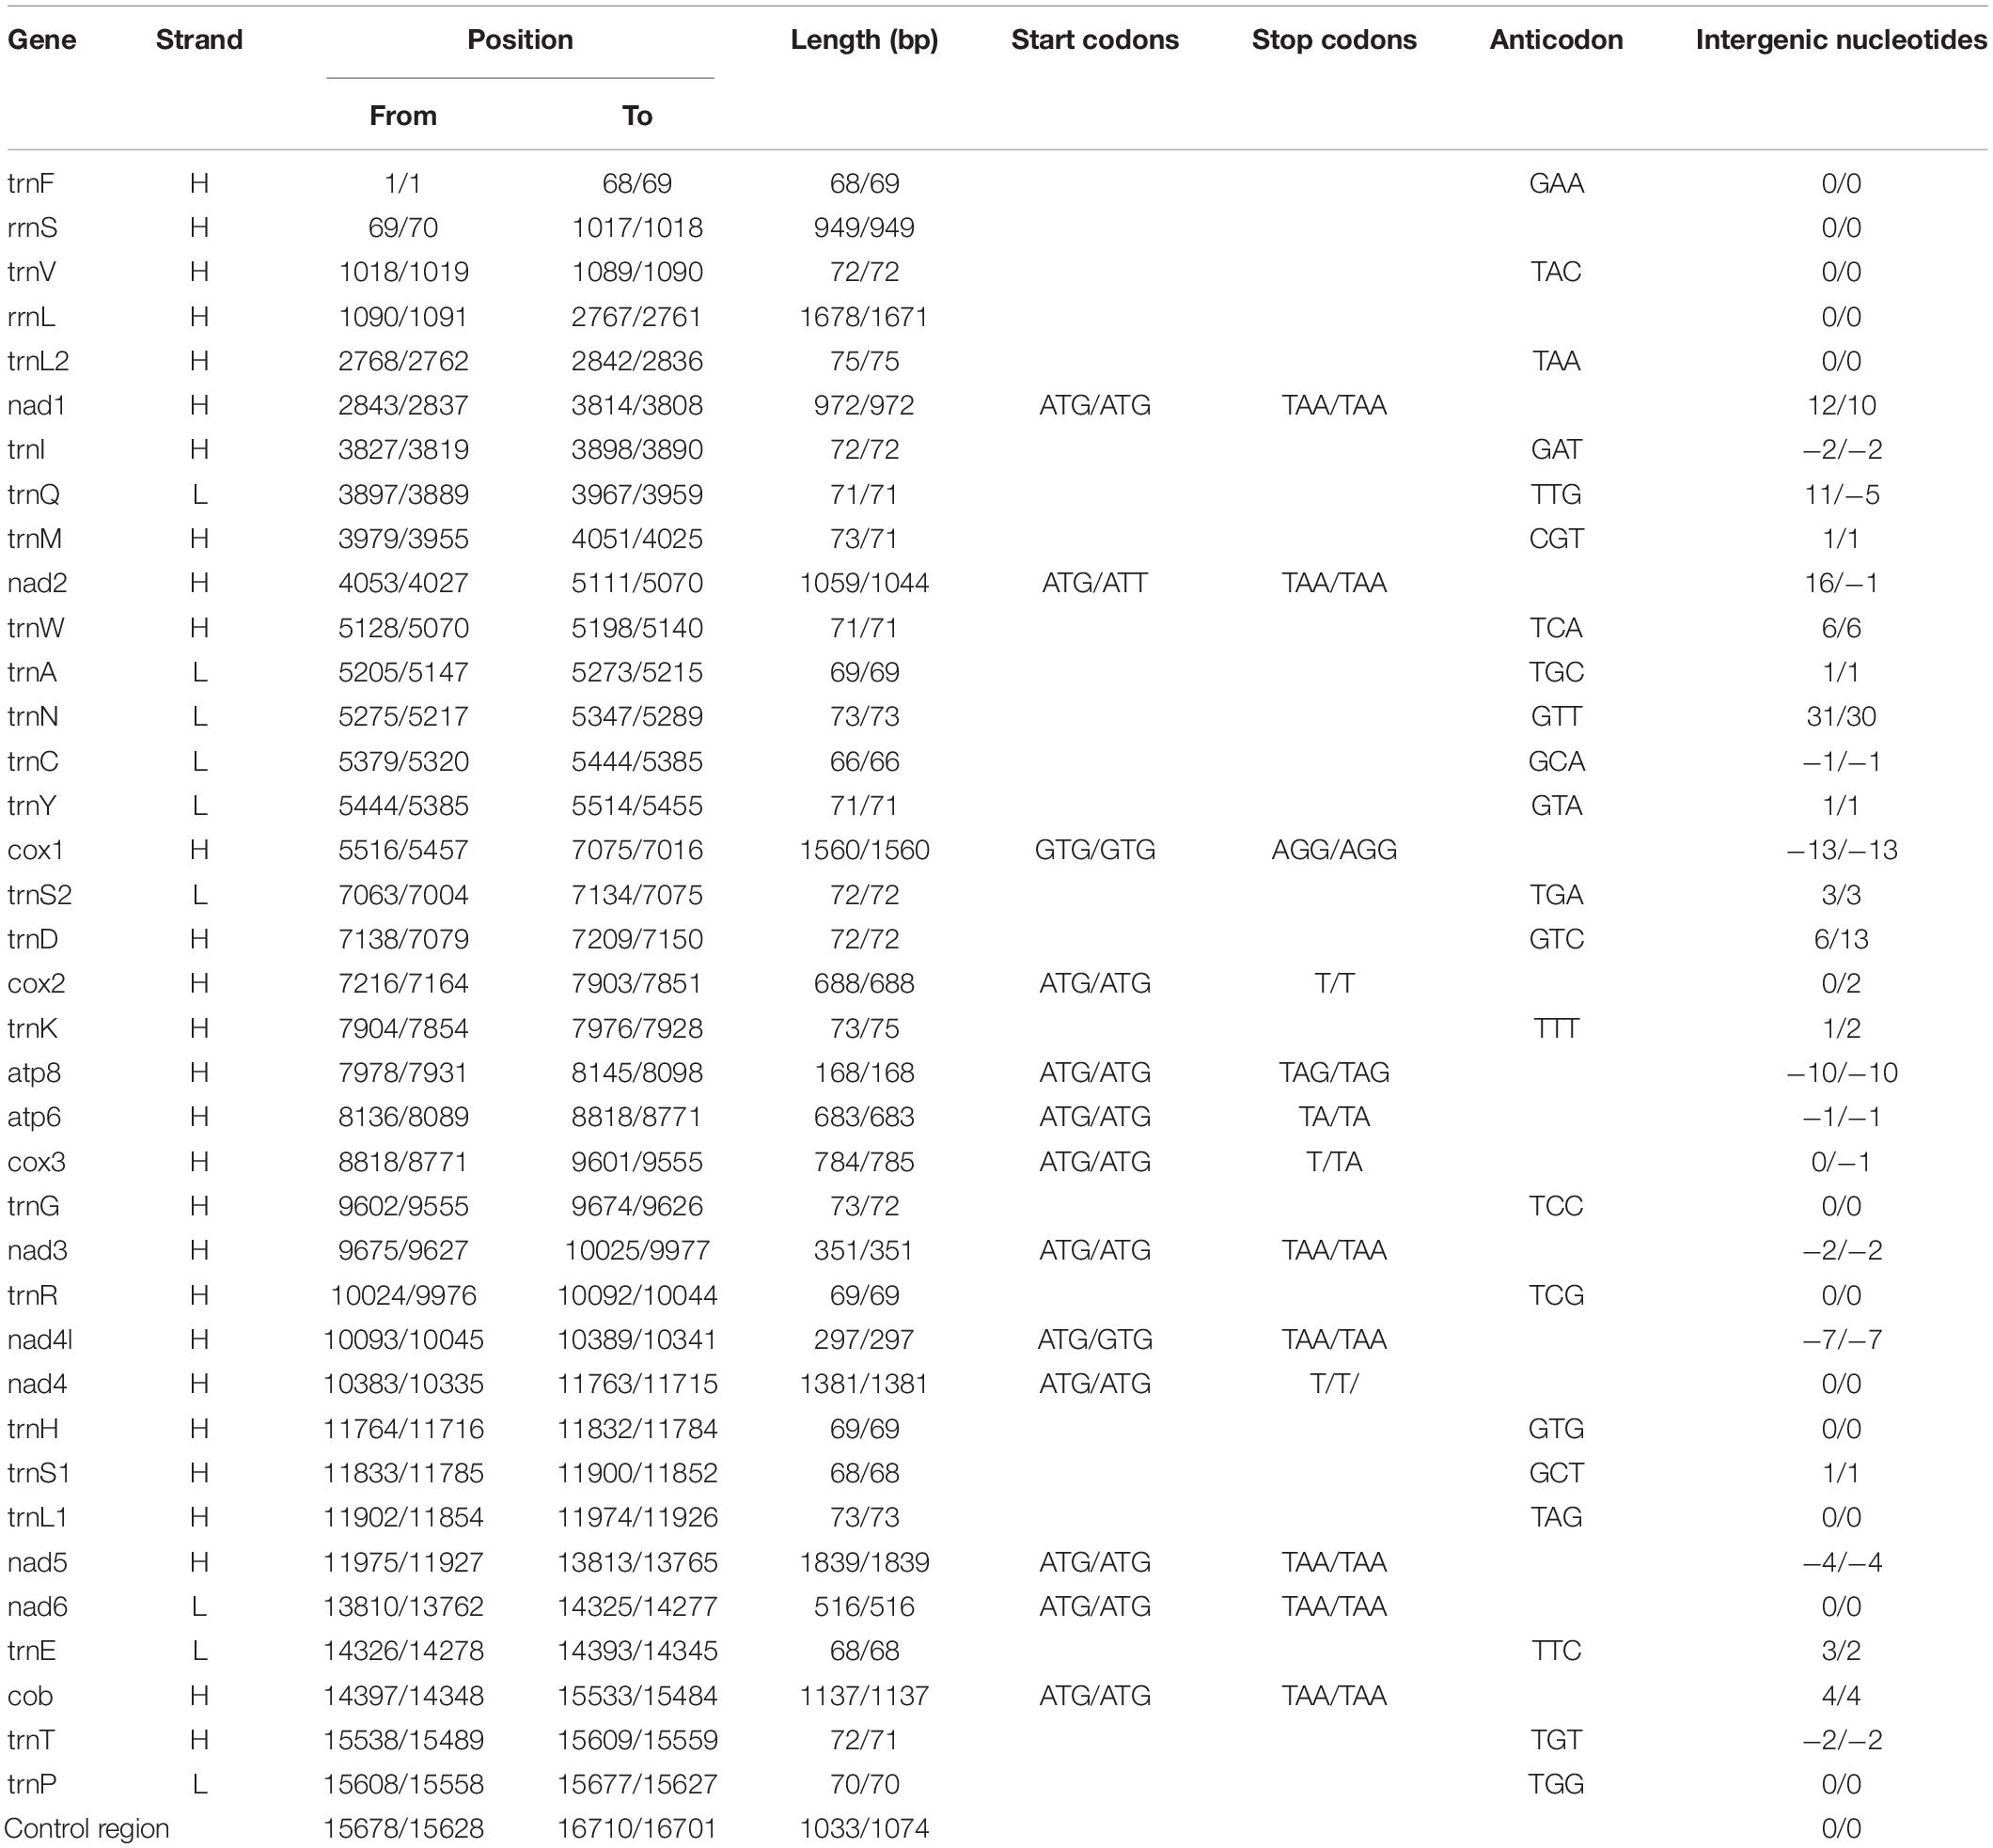
Table 3. Gene annotations of the complete mitogenomes of H. erythrozonus and H. amandae.
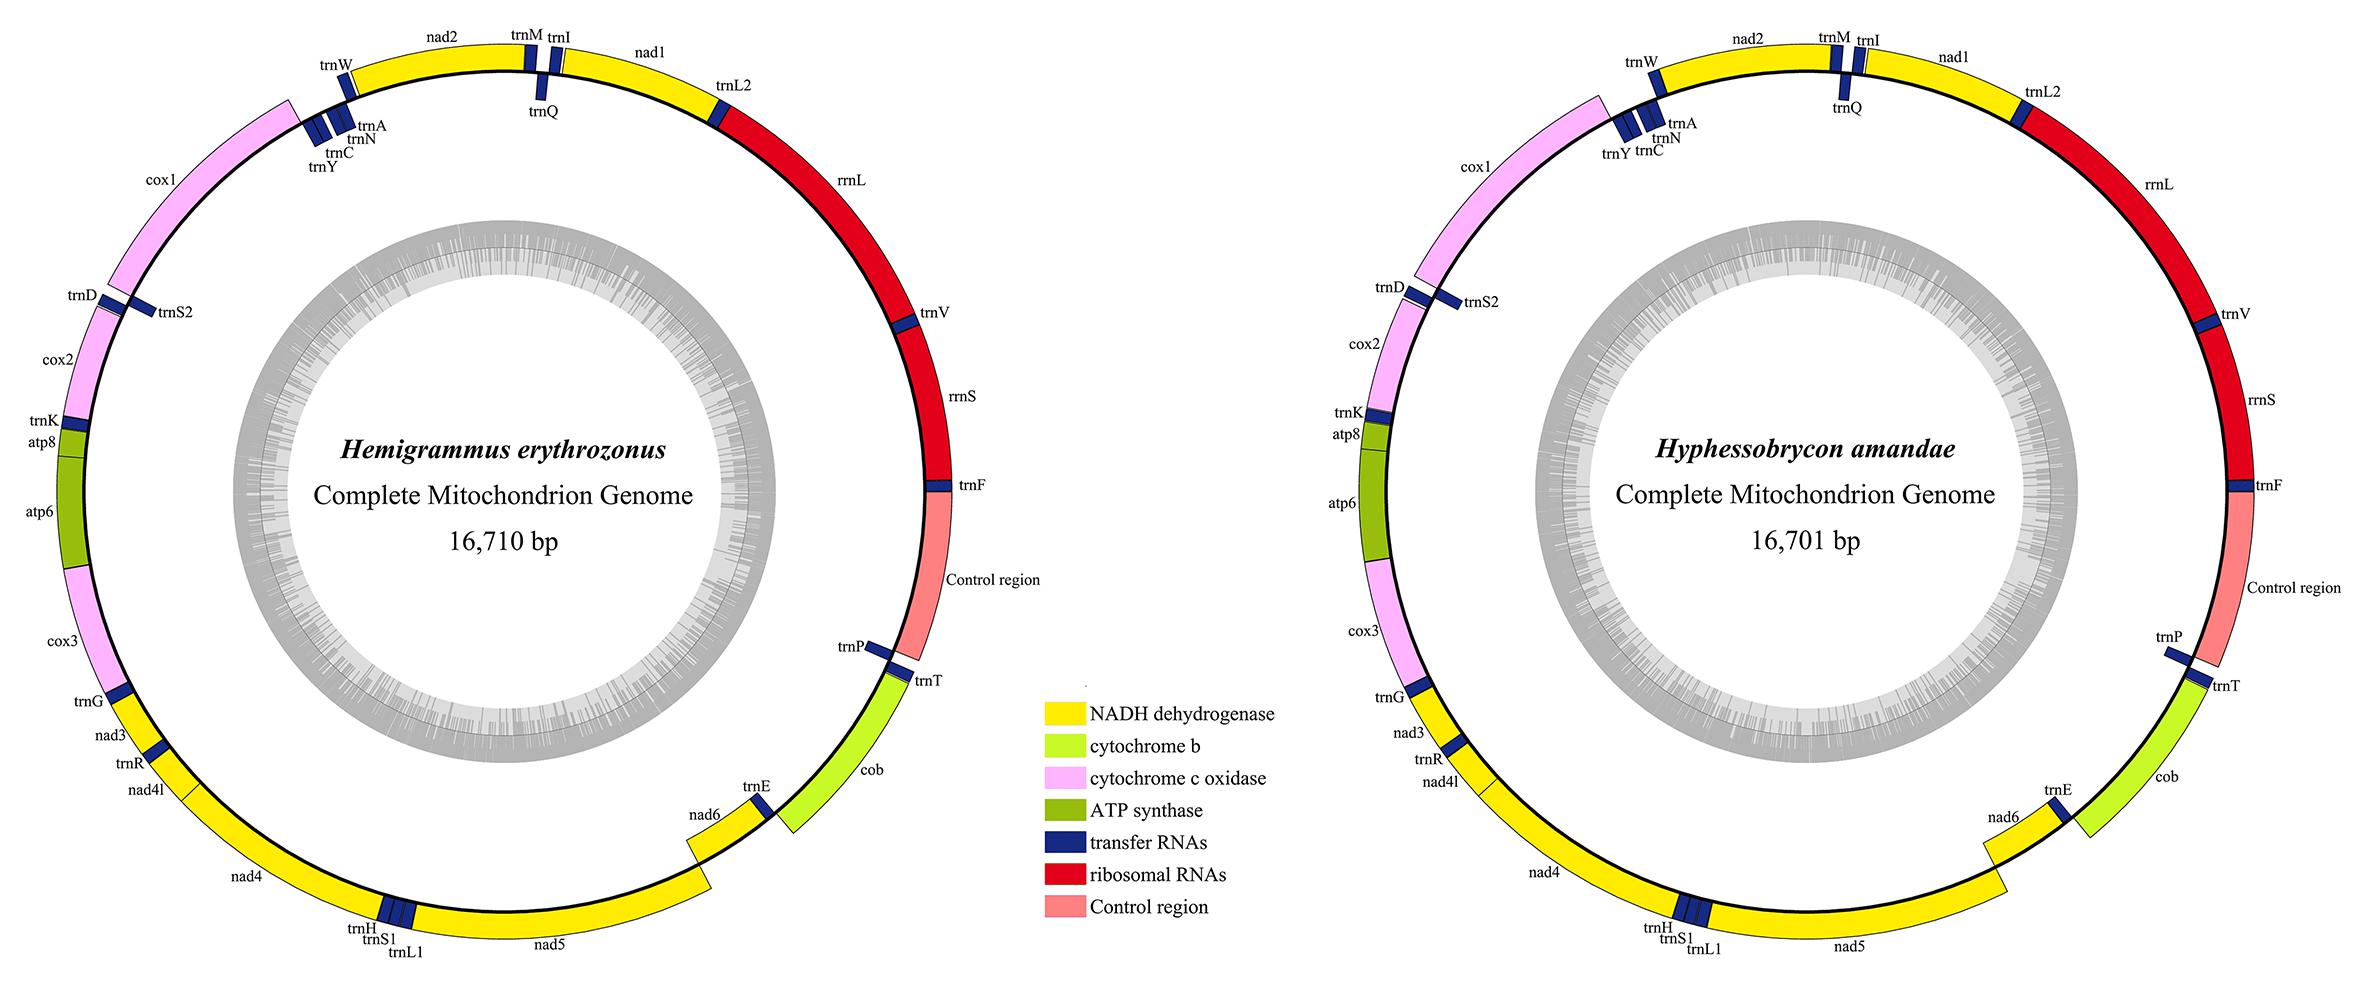
Figure 1. Gene maps of the two newly sequenced Characidae species. Genes encoded by the H-strand were showed outside the circle, and those encoded by the L-strand were showed inside the circle. Different gene types are shown as filled boxes in different colors. The gray inner circles showed the GC content in the mitogenome.
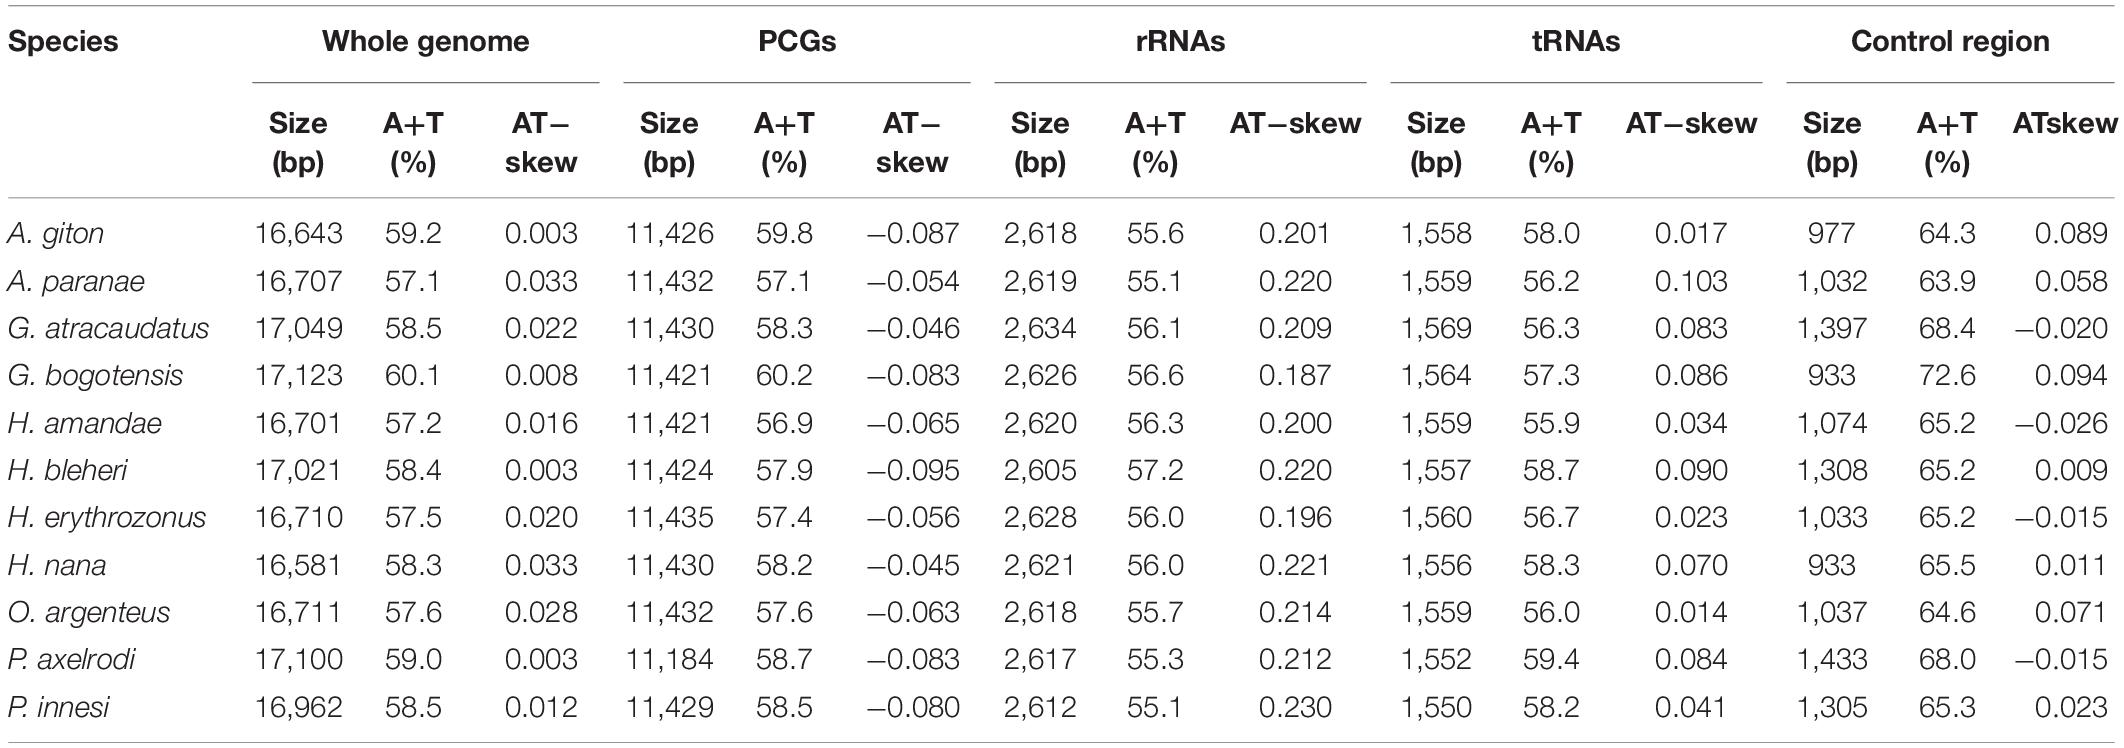
Table 4. Base compositions of the whole genomes, protein-coding genes (PCGs), rRNAs, tRNAs, and Control regions of the 11 Characidae mitogenomes.
Protein-Coding Genes
The total length of the PCGs in each of the 11 Characidae species ranged from 11,184 bp (P. axelrodi) to 11,435 (H. erythrozonus) (Table 4). Among these 11 sequenced mitogenomes, one PCG (nad6) was encoded on the L-strand, whereas the remaining PCGs were located on the H-strand. The average A + T content of the PCGs in each of the 11 Characidae species varied from 56.9 (H. amandae) to 60.2% (G. bogotensis). Most PCGs used the conventional start codon ATN (ATG/ATT), except for H. erythrozonus cox1, which started with GTG. Within our two newly sequenced mitogenomes, only the cox1 and nad4L genes of H. amandae started with GTG (Table 3). Most PCGs terminated with the codon TAR (TAA/TAG) or incomplete codon (TA−/T−−), except for the cox1 gene, which terminated with AGG, in both mitogenomes. As with Characidae mitogenomes, incomplete stop codons are commonly observed across fish mitogenomes (Cooper et al., 2001; Zhao et al., 2015), which may be related to post-transcriptional modification during mRNA maturation. The AT-skews (−0.095 to −0.045) of PCGs were similar among the 11 Characidae species (Table 4).
Excluding the stop codons, the mitogenome PCGs consisted of 3,718–3,801 codons (CDs) and showed very similar codon usage among the 11 Characidae species (Figure 2). Ile (283.64 ± 9.67 CDs), Thr (287.36 ± 12.52 CDs), Ala (331.36 ± 8.67 CDs), and Leu1 (CUN) (459.91 ± 29.62 CDs) were the four most predominant codon families. Among these, Leu1 (CUN) exhibited the highest usage bias (402–508 CDs), which may be associated with the coding function of the chondriosome. In contrast, Cys (27.27 ± 1.81 CDs) showed the least number of CDs. To gain an insight into the genetic codon bias of the 11 Characidae mitogenomes, the relative synonymous codon usage was evaluated. As shown in Figure 3, the usage of synonymous codons was biased for most amino acids. Moreover, the synonymous codon preferences for the 11 Characidae species were conserved, which may be attributed to their close relationship in the same fish family; these preferences have also been observed in some other fishes (Parhi et al., 2019). The two most commonly used codons in these 11 species were consistently AUU and CUU.
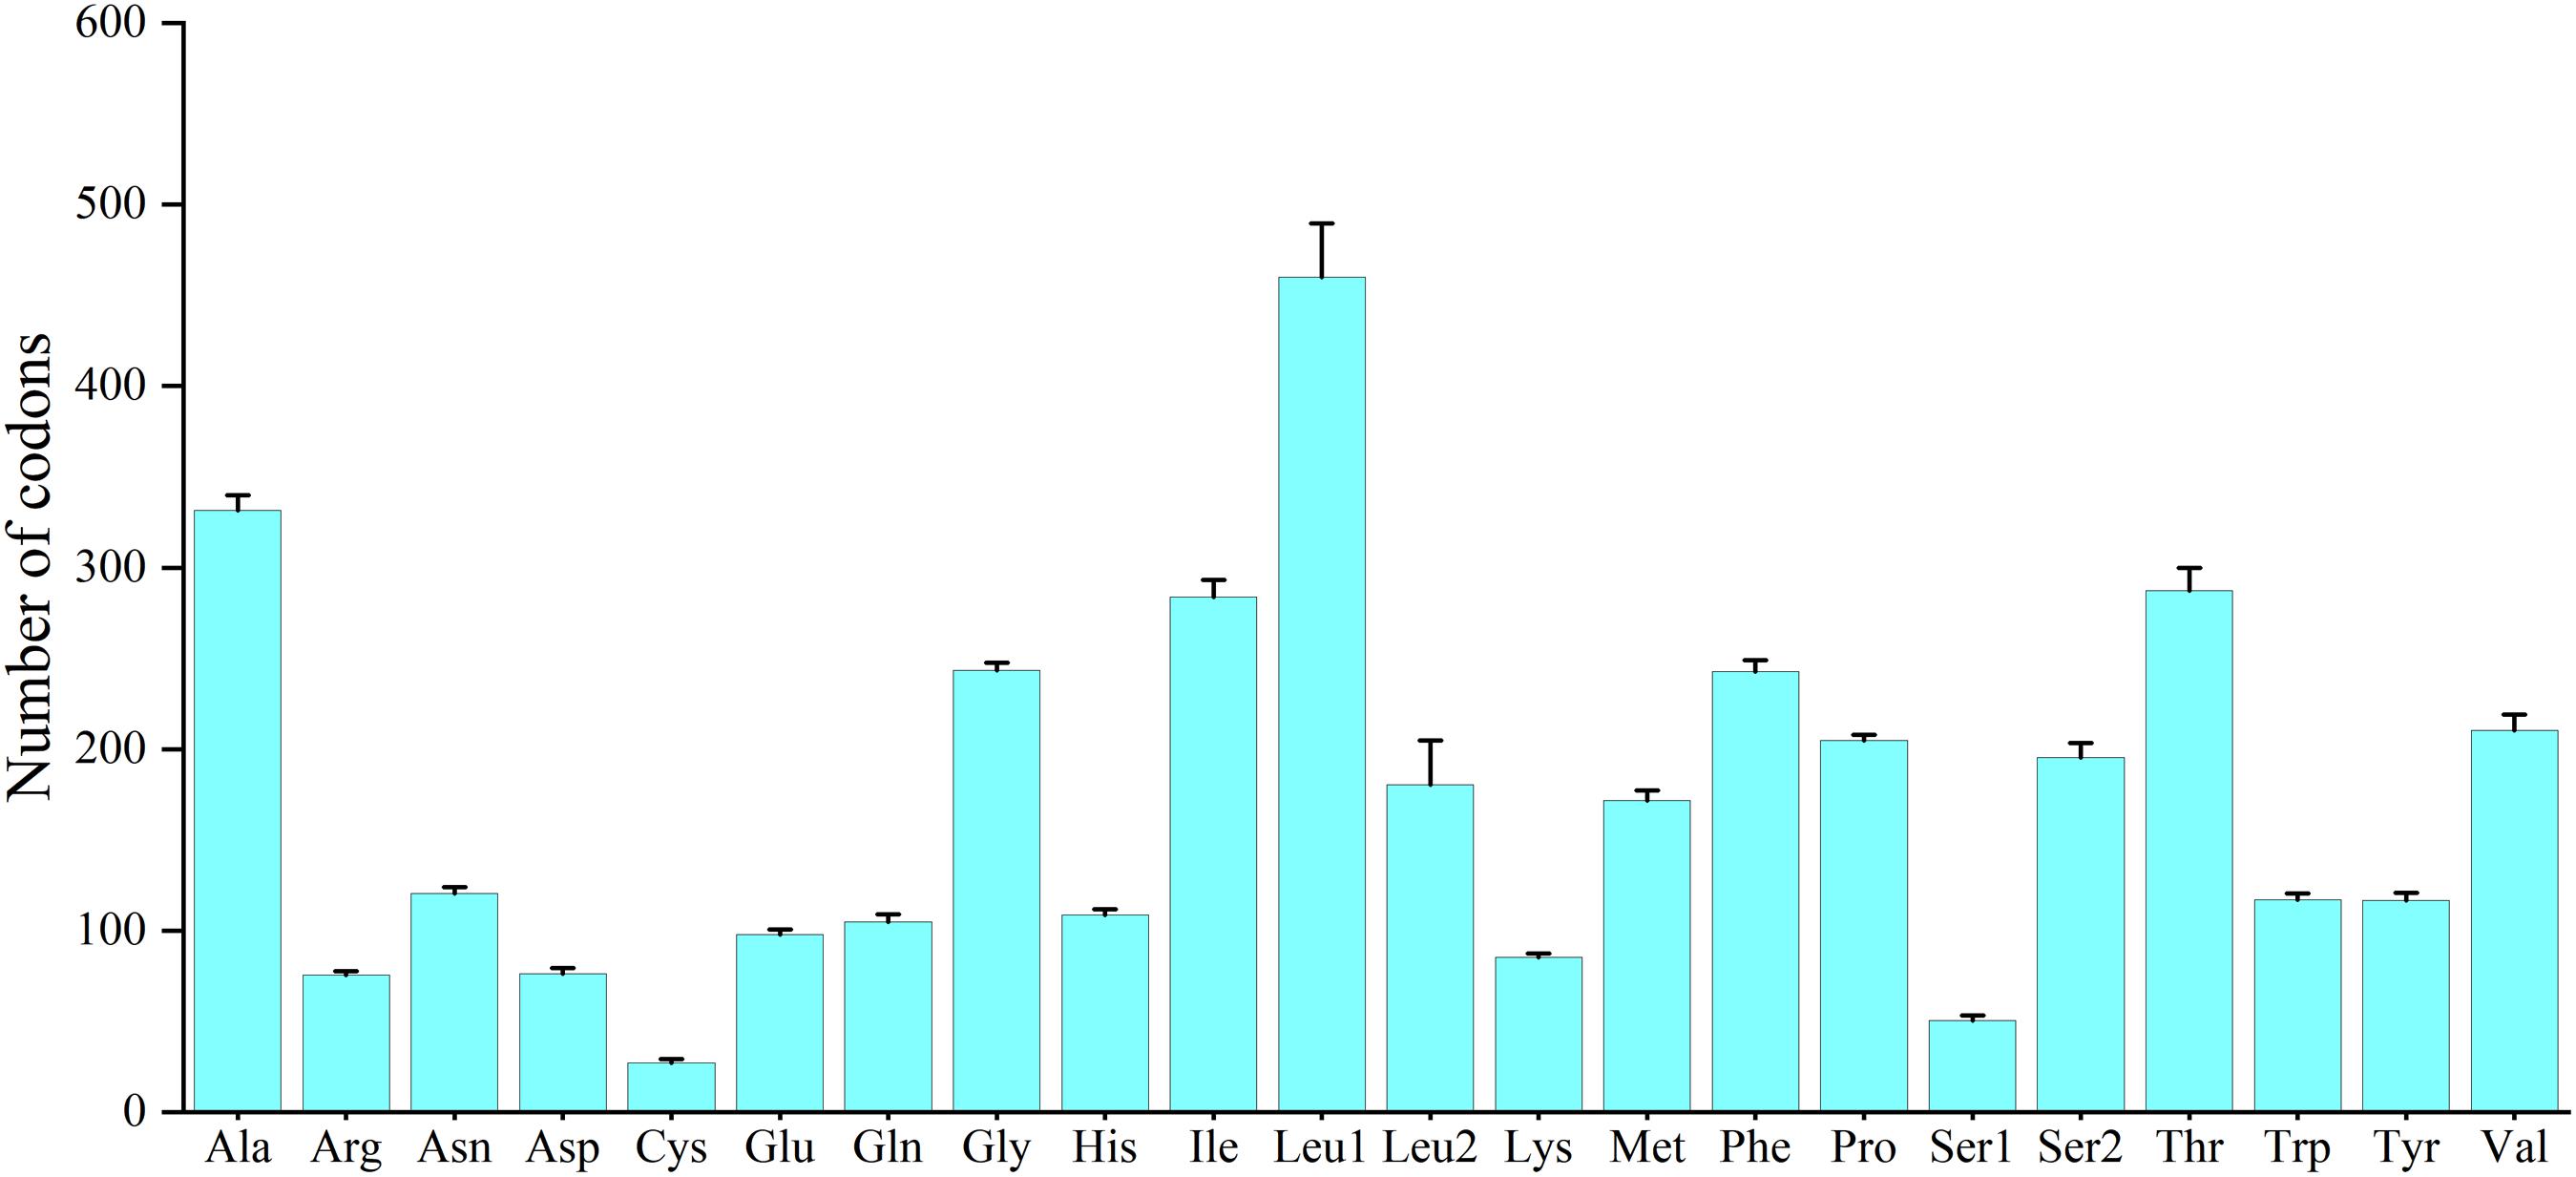
Figure 2. Codon usage patterns of 11 Characidae mitogenomes.
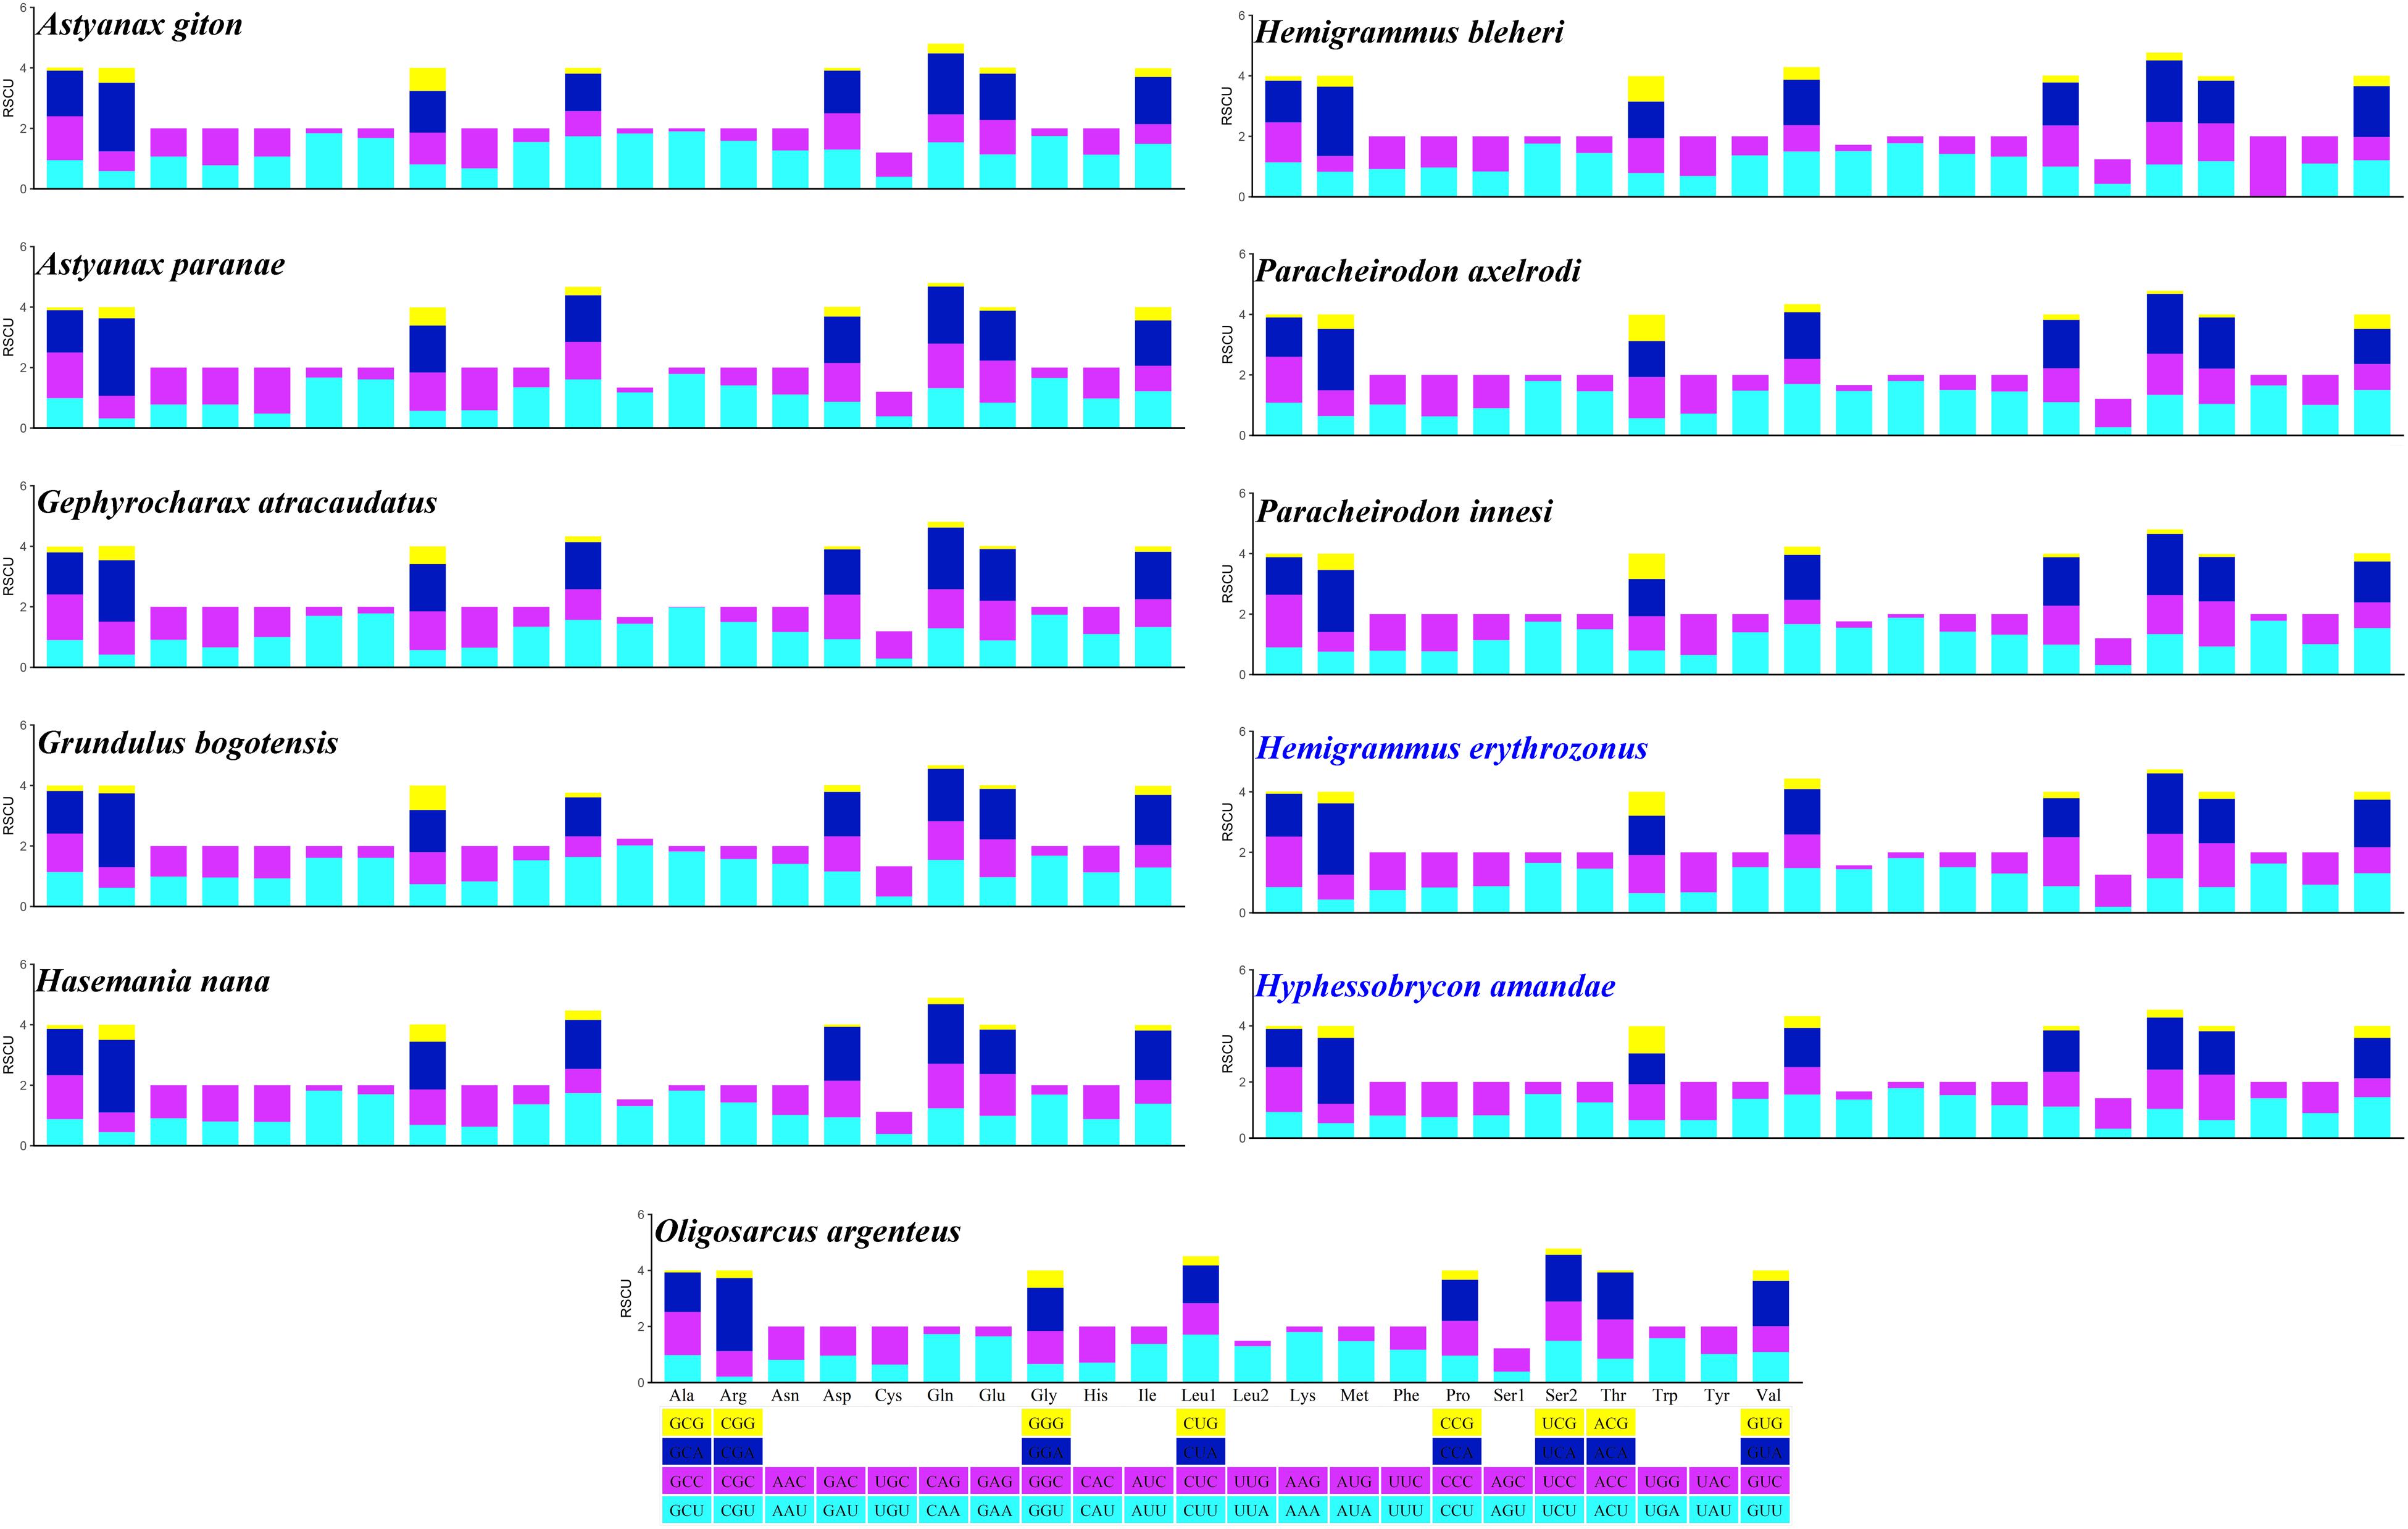
Figure 3. Relative synonymous codon usage of 13 protein-coding genes in the mitogenomes of 11 Characidae species. The codon families are shown on the X-axis, and the RSCU values are shown on the Y-axis. The different colors of the bars corresponds to the codon distribution at the bottom.
To analyze the evolutionary pattern of the PCGs, the ratio of Ka/Ks, nucleotide diversity, and K2P genetic distance across all Characidae mitogenomes were calculated for each aligned PCG. Among the PCGs detected, nad2 showed the largest K2P genetic distance among the 11 Characidae species (Figure 4A), followed by atp8 and atp6. As seen in Figure 4B, nad2 and atp8 had the highest nucleotide diversity; in contrast, cox1 and cox3 had the lowest nucleotide diversity. Similar to the nucleotide diversity, Ka/Ks value was the highest for nad2, followed by nad4, cox3, and nad3; the lowest value was observed for cox1 and cob (Figure 4C). Notably, the Ka/Ks values were <1 in all the PCGs, suggesting that all the PCGs have evolved under purifying selection. Based on the above-mentioned analyses, nad2 is the most rapidly evolving gene among Characidae mitochondrial PCGs, since it is under the least selection pressure. In contrast, cox1 is the most slowly evolving gene due to the highest selection pressure it is subjected to.
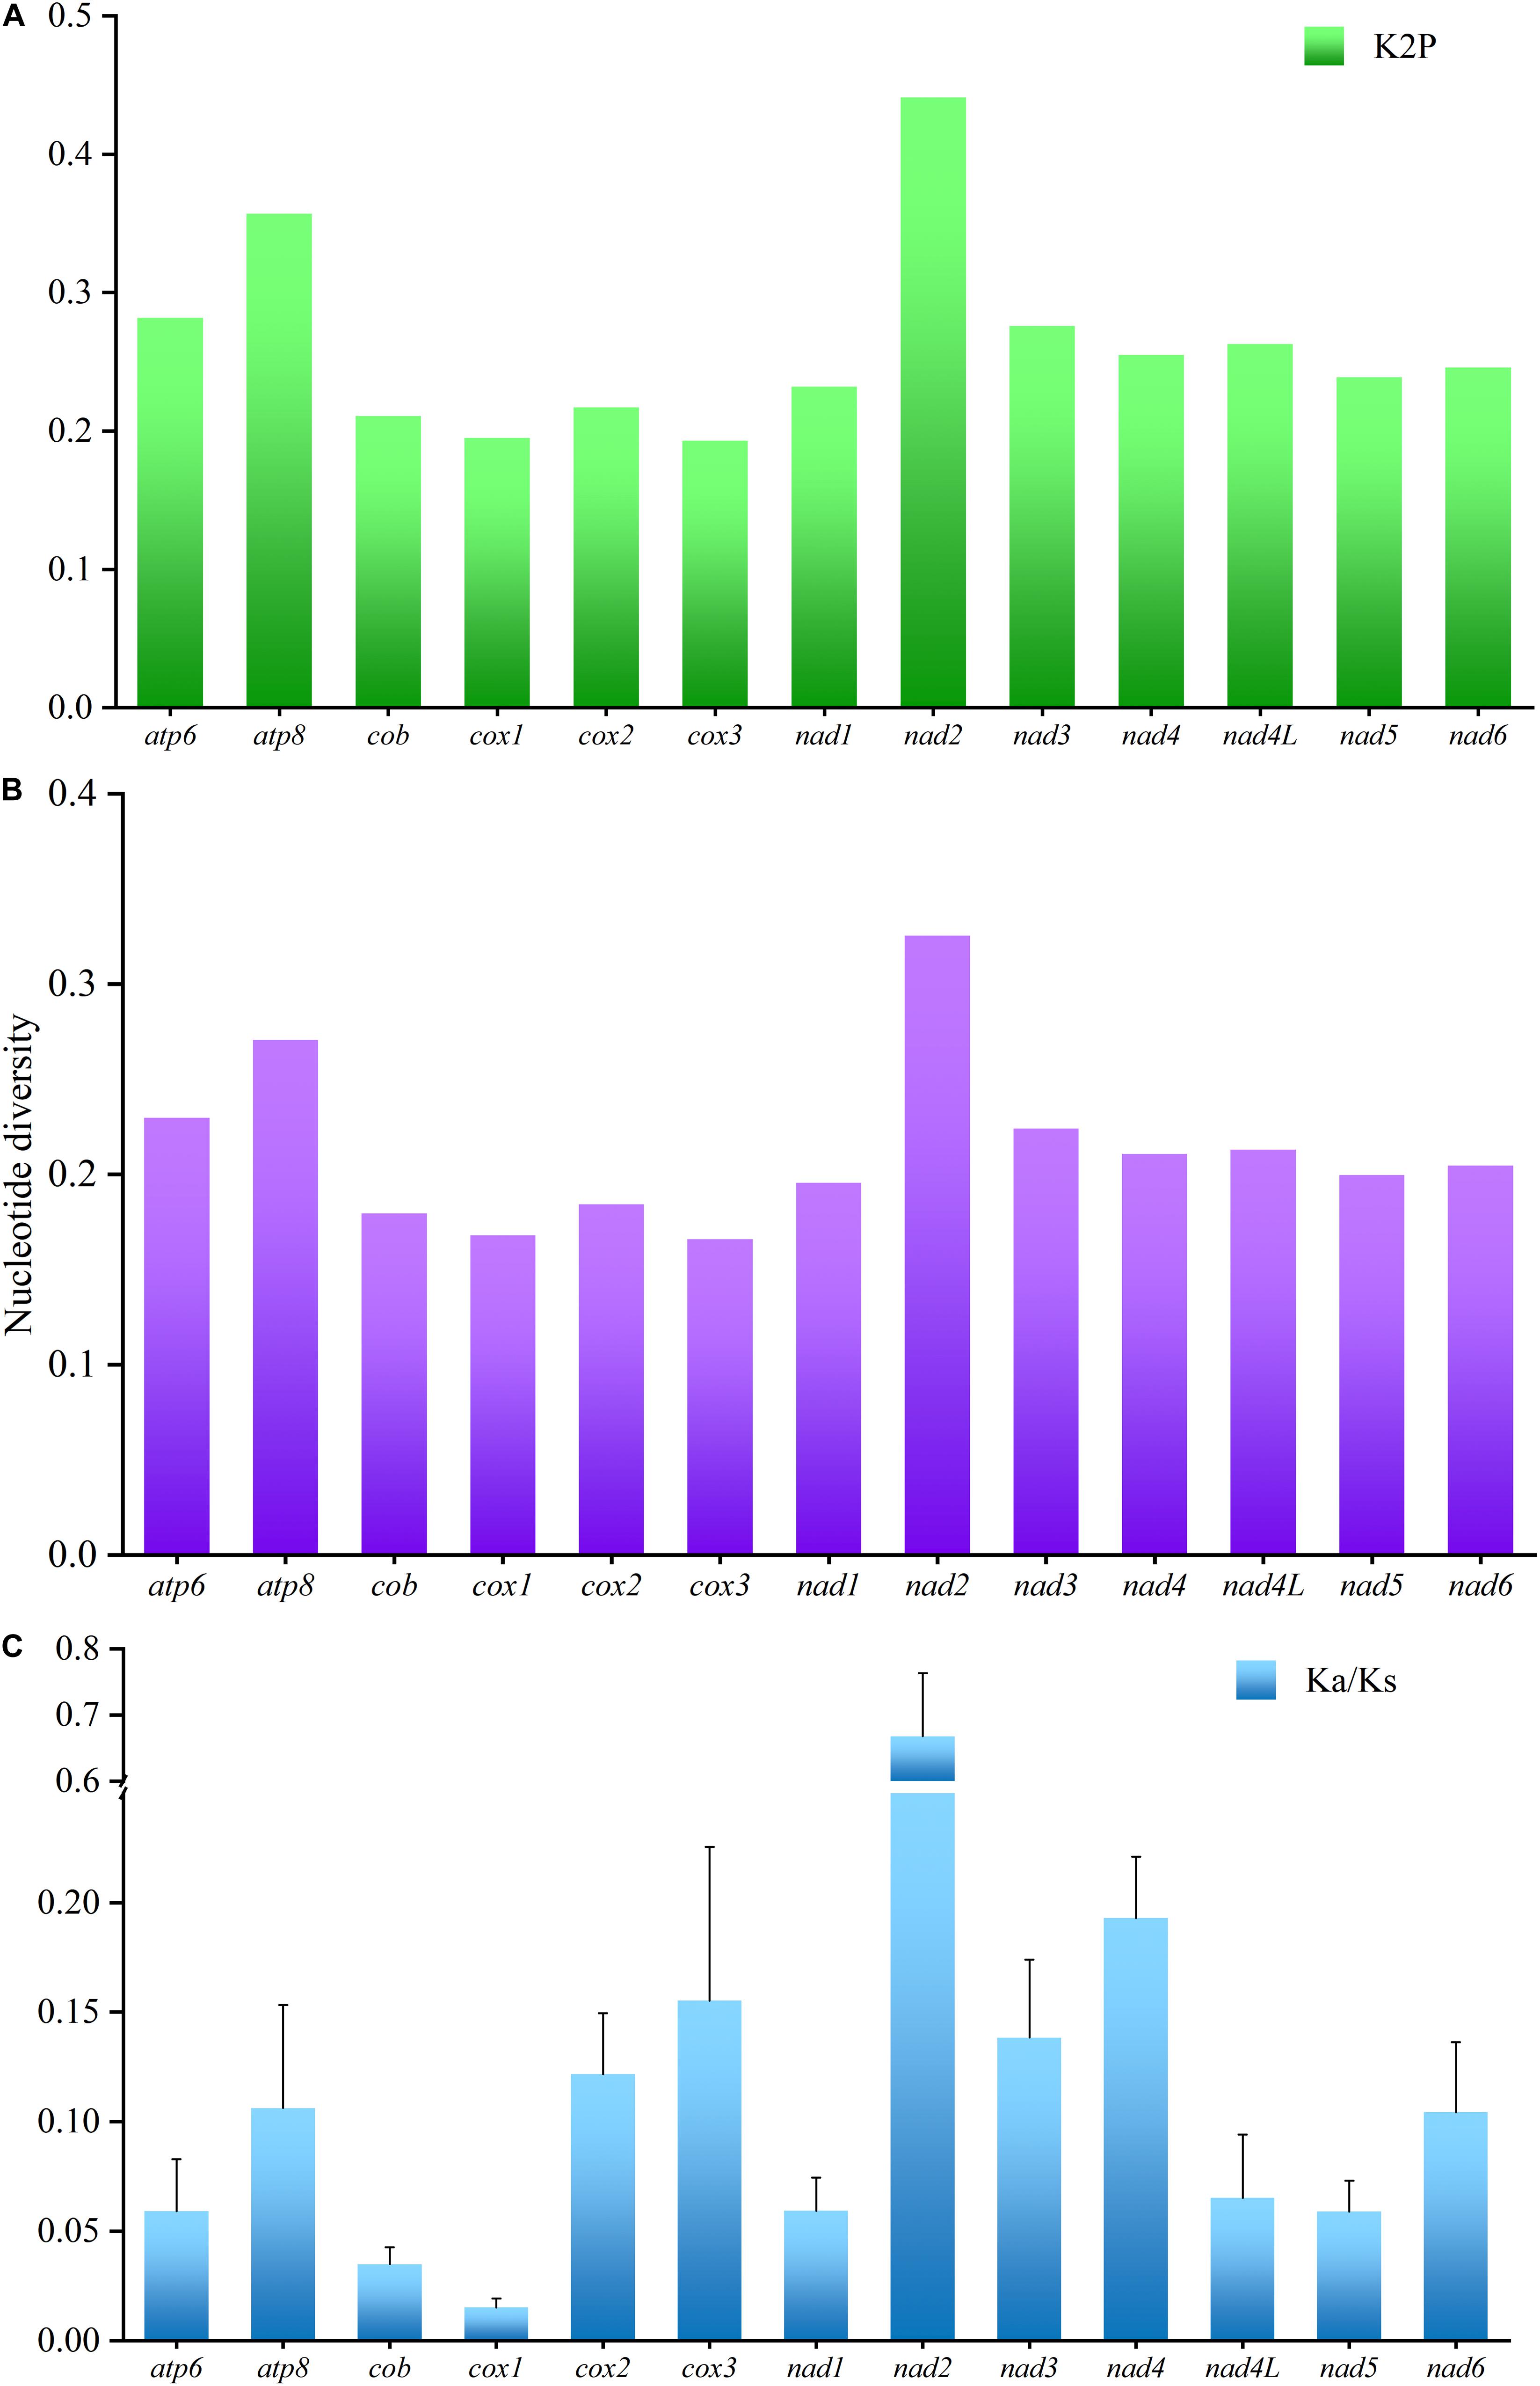
Figure 4. K2P genetic distance (A), nucleotide diversity (B), and the Ka/Ks ratio (C) analyses of the protein-coding genes among 11 Characidae mitogenomes.
Ribosomal and Transfer RNA Genes
The sizes of the 16S rRNA genes were 1,678 bp (H. erythrozonus) and 1,671 bp (H. amandae), and the 12S rRNA genes of both mitogenomes were 949 bp. The rRNA genes of Characidae mitogenomes were found to be highly conserved compared with those of other published fish mitogenomes (Javonillo et al., 2010; Zhao et al., 2015; Ruan et al., 2020), with the two rRNA genes located between trnL2 and trnF separated by trnV. The A + T contents of rRNA genes ranged from 55.1 to 57.2% among the 11 Characidae species (Table 4). For the two newly sequenced Characidae mitogenomes, the typical 22 tRNAs were detected. Among them, 14 tRNAs were encoded on the H-strand, and the remaining eight on the L-strand.
The sizes of the tRNA genes ranged from 66 bp (trnC) to 75 bp (trnL2) in both H. erythrozonus and H. amandae. The total lengths of the 22 tRNA genes ranged from 1,550 bp (P. innesi) to 1,529 bp (G. atracaudatus) among the 11 Characidae. As shown in Figure 5, all the tRNAs exhibited a typical clover-leaf secondary structure, except for trnS1 (GCT), which lacked the dihydrouridine arm, a feature generally present in Characidae fishes and vertebrate mitogenomes (Krajewski et al., 2010; Sun et al., 2020a,b).
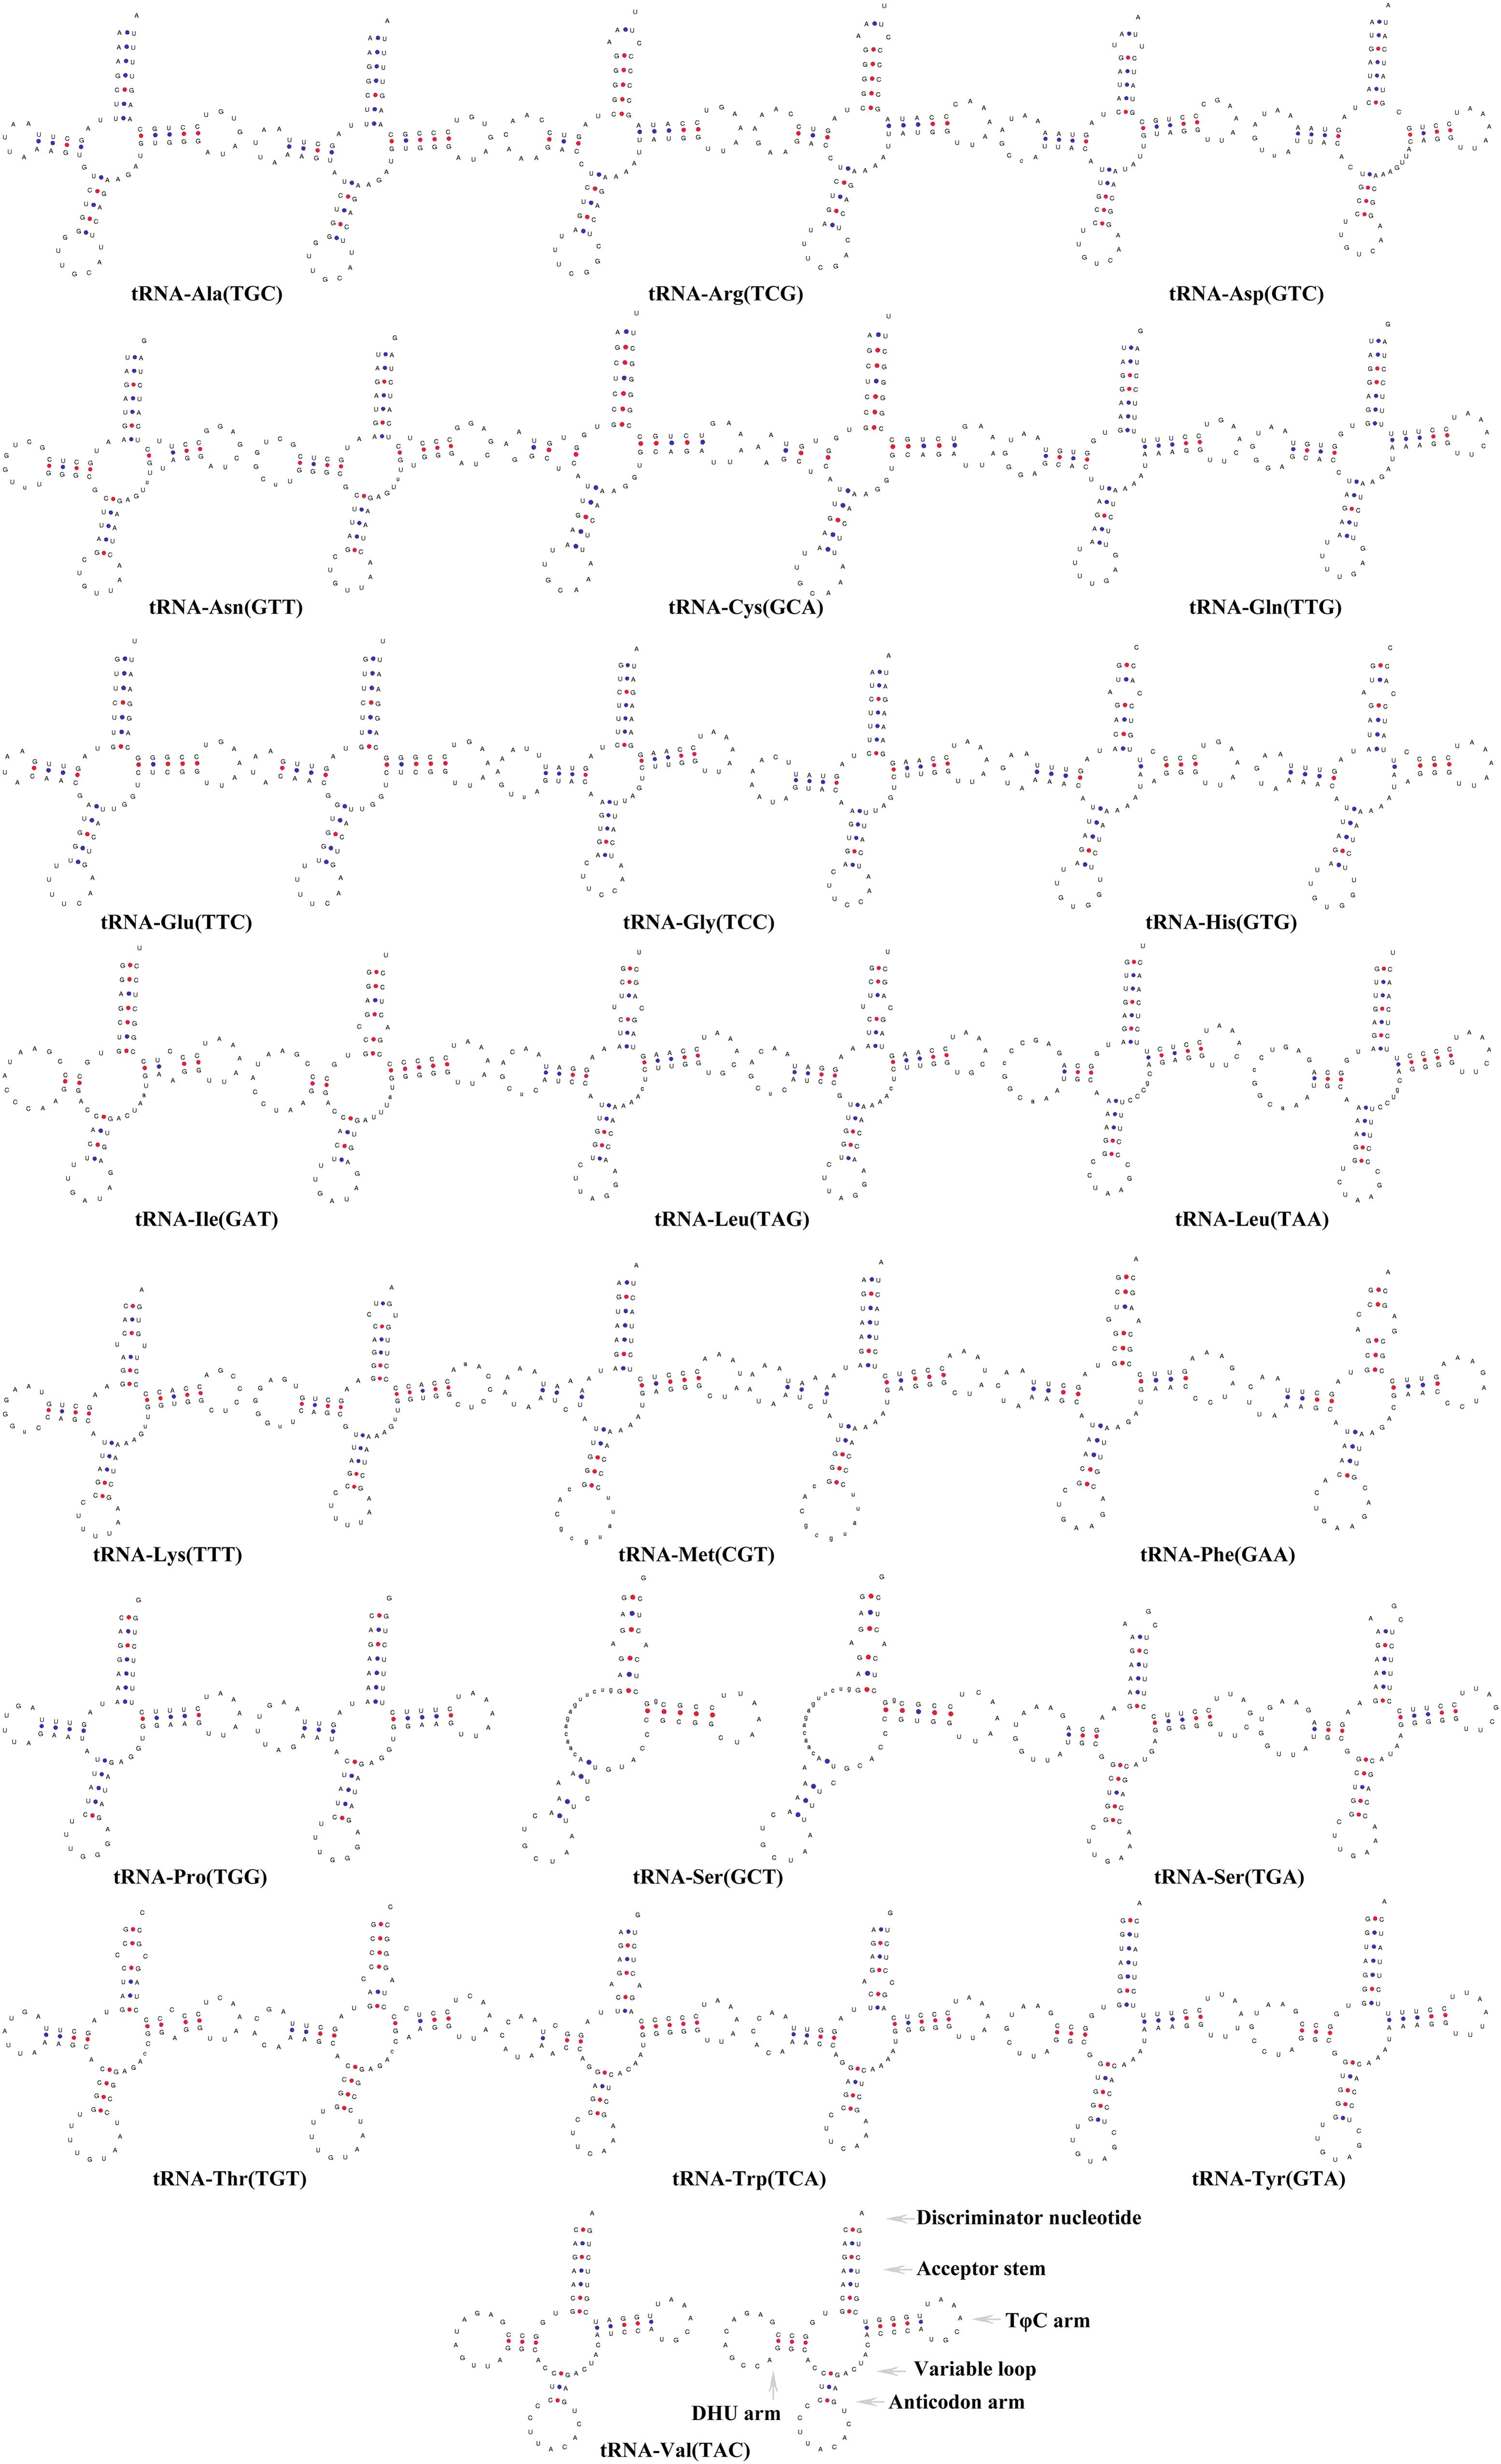
Figure 5. Secondary structures of the 22 transfer RNA genes of two Characidae species [Hemigrammus erythrozonus (left) and Hyphessobrycon amandae (right)].
Control Region
Compared with PCGs and rRNA genes, the CR displayed the highest variation and mutation rates throughout the mitogenomes; thus, this region was the dominant region for evaluating intraspecies variations. The CR has become a hotspot for phylogenetic research since this region shows the maximum mutation and fastest evolution rates in the whole mitogenomes. Similar to other fish mitogenomes, the CRs were found to be located between trnF and trnP in all the 11 Characidae species. The average A + T content (63.9–72.6%) of the CRs was higher than that of the whole genomes (57.1–60.1%), PCGs (56.9–60.2%), rRNAs (55.1–57.2%), or tRNAs (55.9–59.4%). Composition analysis revealed seven positive and four negative AT skew regions in the mitogenome CRs of the 11 Characidae species.
Phylogenetic Analyses
To determine the phylogenetic relationship between H. erythrozonus and H. amandae in the family Characidae, we selected the concatenated nucleotide sequences of the combined mitochondrial gene set (13 PCGs + two rRNAs) from 23 Characiformes species. Additionally, we used Lateolabrax japonicas (Lavoue et al., 2014) as an outgroup because it belongs to the order Perciformes and family Moronidae. As shown in Figure 6 and Supplementary Figures 1, 2, the phylogenetic analysis of the two tree models (BI and ML) by using the combined mitochondrial gene set well supported the tree topologies and yielded identical results. All the major clades were supported in the preferred trees by the analysis.
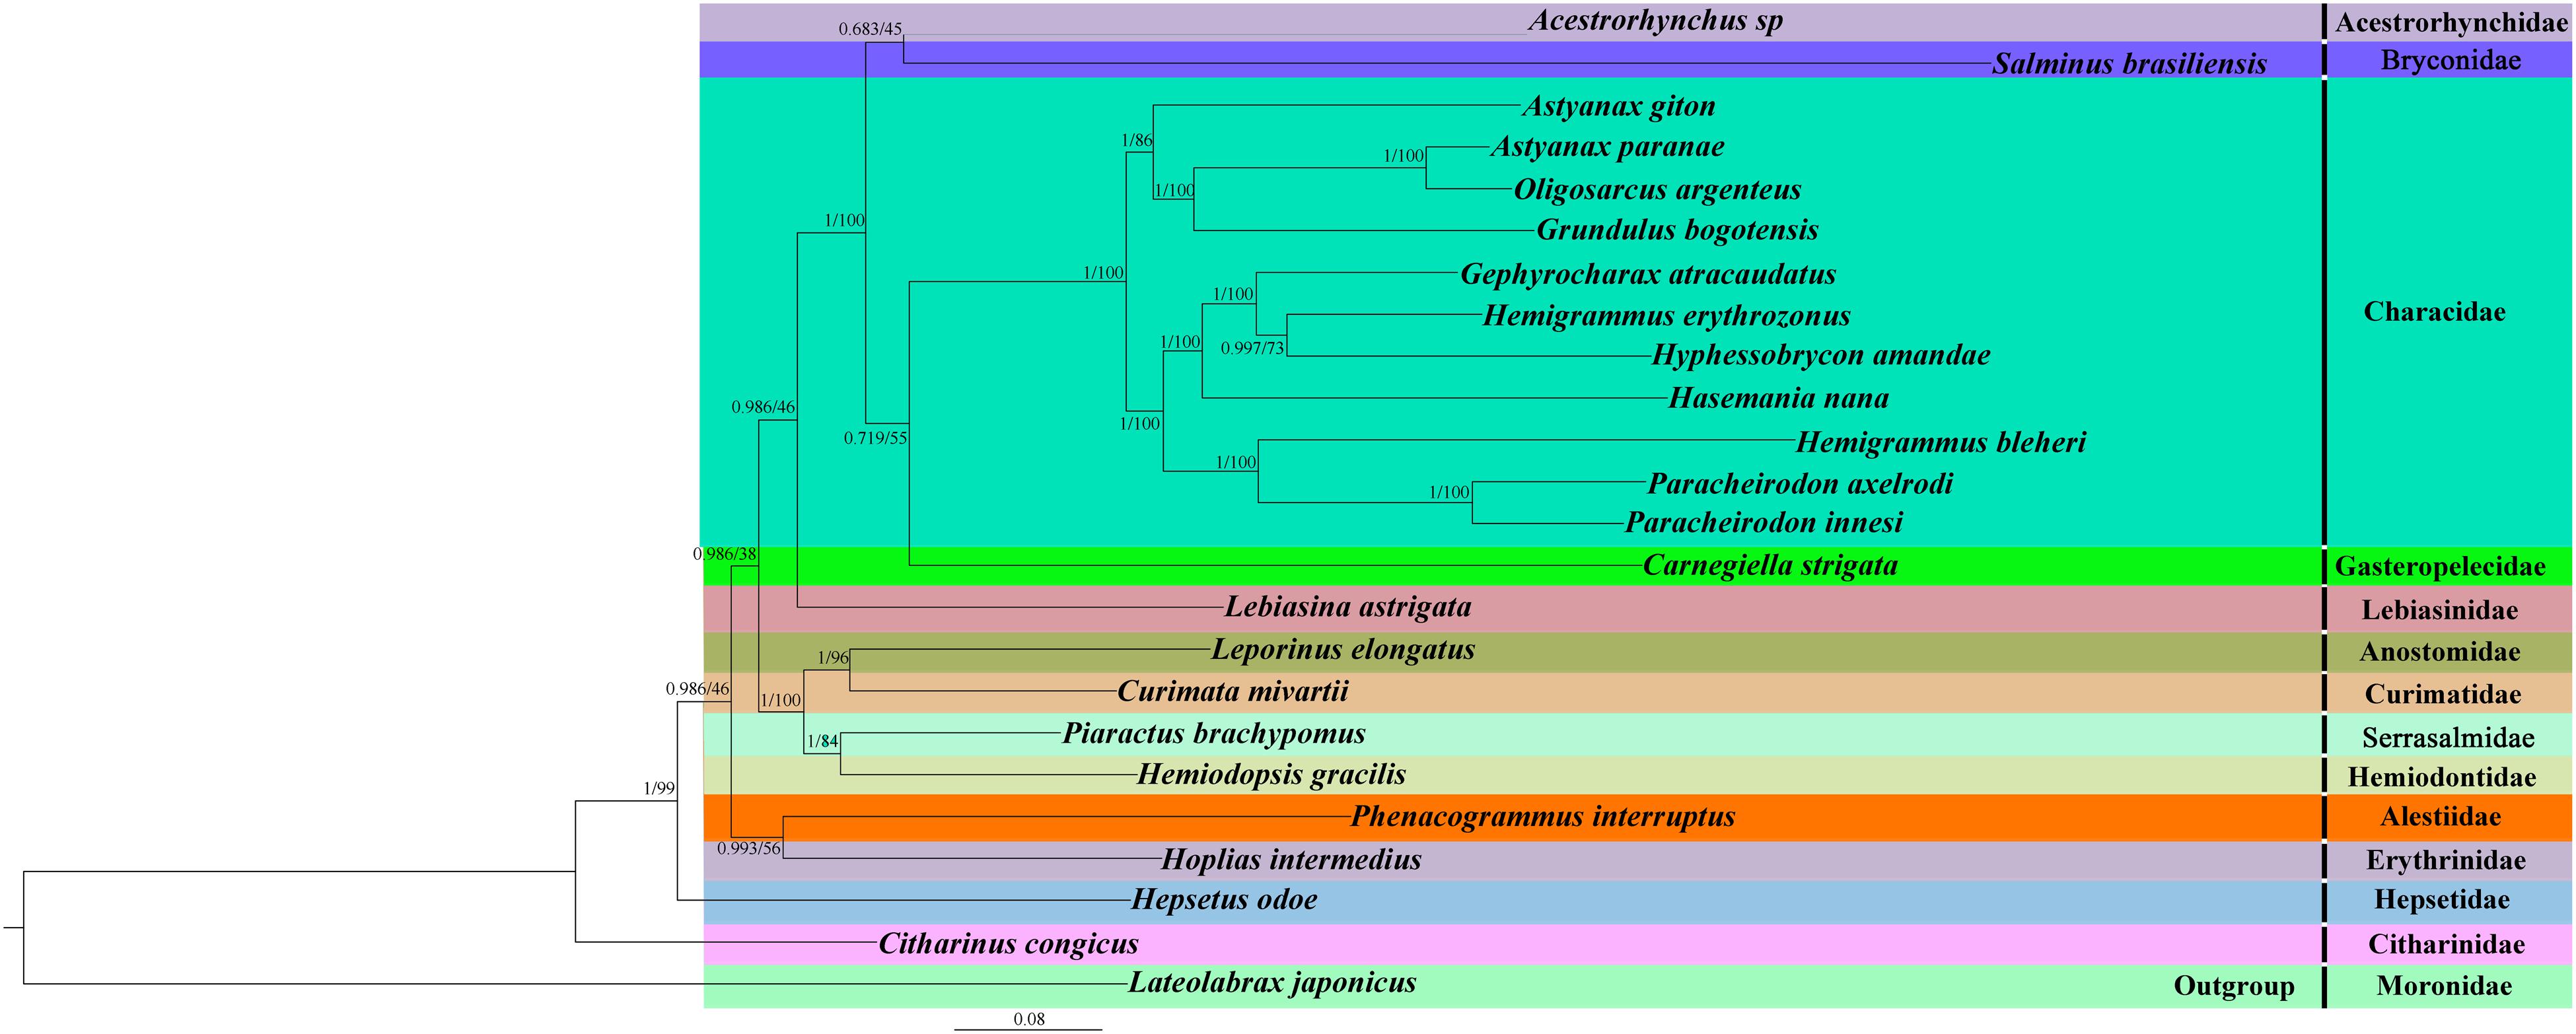
Figure 6. Phylogenetic tree of 24 Actinopterygii species constructed by the Bayesian inference and maximum likelihood methods based on the concatenated sequences of 13 PCGs and two rRNAs. The support values are Bayesian posterior probabilities (left) and bootstrap support values (right), respectively.
Although the experimental samples were from an animal market and there is a lack of comparison among wild samples, mitochondria are inherited from the maternal line, and we have a good morphological classification basis. Therefore, we believe that, even if samples are gathered from an animal market, the corresponding results will not be compromised by analysis bias as long as the morphological identification is performed well.
Two target species, H. erythrozonus and H. amandae, and nine other Characidae were clustered into one branch with a high nodal support value (BI posterior probabilities [PP] > 0.99; ML bootstrap [BP] > 70). This result confirmed the classification statuses of H. erythrozonus and H. amandae in Characidae. In line with previous reports (Mirande, 2019; Montero-Mendieta and Dheer, 2019), our study proves that P. brachypomus and S. brasiliensis do not belong to the family Characidae. Piaractus is a member of Serrasalmidae, and Salminus is a member of Bryconidae. A. paranae and O. argenteus form a well-supported clade. Likewise, P. axelrodi and P. innesi form a separate well-supported clade (PP = 1; BP = 100). In all the Characidae species studied, one genus was well supported (P. axelrodi and P. innesi), and the other two genera diverged (A. giton and A. paranae, and H. erythrozonus and H. bleheri). This two genera have been discussed in a recent taxonomic study. The taxonomic status of three species has been reassessed: Hemigrammus bleheri should be Petitella bleheri (Bittencourt et al., 2020), renamed Astyanax giton as Deuterodon giton, and Astyanax paranae as Psalidodon paranae (Terán et al., 2020). These results indicated that the taxonomic status of the family Characidae is currently unresolved, and morphological classification combined with the usage of mitogenomes and other molecular markers are needed for comprehensive classification (Liu et al., 2020). These findings provide a phylogenetic basis for improved classification of the family Characidae. The newly sequenced mitogenomes of the two species (H. erythrozonus and H. amandae) improve our understanding of the phylogeny and evolution of fish species.
Data Availability Statement
The data presented in this study can be found in GenBank with accession numbers MT484070 and MT484069.
Ethics Statement
The animal study was reviewed and approved by the Ethics Committee of the Nanjing Forestry University.
Author Contributions
H-YL, B-PH, and C-HS contributed to the experimental design. NX and X-LZ were involved in the sample collection and pre-processing. C-HS contributed to the data analysis and image editing. H-YL and C-HS drafted the manuscript. B-PH, QZ, and C-HS reviewed and edited the manuscript. All authors contributed to the article and approved the submitted version.
Funding
This work was supported by the Priority Academic Program Development of Jiangsu Higher Education Institutions (PAPD).
Conflict of Interest
The authors declare that the research was conducted in the absence of any commercial or financial relationships that could be construed as a potential conflict of interest.
Acknowledgments
We kindly acknowledge two reviewers for their fruitful and critical comments and would like to thank Editage (www.editage.com) for the support on language-editing.
Supplementary Material
The Supplementary Material for this article can be found online at: https://www.frontiersin.org/articles/10.3389/fgene.2021.627402/full#supplementary-material
Supplementary Figure 1 | Phylogenetic tree of 24 Actinopterygii species constructed by the Bayesian inference methods based on the concatenated sequences of 13 PCGs and two rRNAs. The support values are Bayesian posterior probabilities.
Supplementary Figure 2 | Phylogenetic tree of 24 Actinopterygii species constructed by the Maximum likelihood methods based on the concatenated sequences of 13 PCGs and two rRNAs. The support values are bootstrap support values.
Footnotes
References
Alam, M. T., Petit, R. A., Read, T. D., and Dove, A. D. M. (2014). The complete mitochondrial genome sequence of the world”s largest fish, the whale shark (Rhincodon typus), and its comparison with those of related shark species. Gene 539, 44–49. doi: 10.1016/j.gene.2014.01.064
Avise, J. C., Arnold, J., Ball, R. M., Bermingham, E., Lamb, T., and Neigel, J. E. (1987). Intraspecific phylogeography: the mitochondrial dna bridge between population genetics and systematics. Annu. Rev. Ecol. Syst. 18, 489–522. doi: 10.1146/annurev.es.18.110187.002421
Barreto, C. A., Granja, M. M., Vidigal, P. M., Carmo, A. O., and Dergam, J. A. (2017). Complete mitochondrial genome sequence of neotropical fish Astyanax giton Eigenmann 1908 (Ostariophysi; Characidae). Mitochondrial DNA B 2, 839–840. doi: 10.1080/23802359.2017.1403869
Bernt, M., Donath, A., Jühling, F., Externbrink, F., Florentz, C., Fritzsch, G., et al. (2013). MITOS: improved de novo metazoan mitochondrial genome annotation. Mol. Phylogenet. Evol. 69, 313–319. doi: 10.1016/j.ympev.2012.08.023
Bittencourt, P. S., Machado, V. N., Marshall, B. G., Hrbek, T., and Farias, I. P. (2020). Phylogenetic relationships of the neon tetras Paracheirodon spp.(Characiformes: Characidae: Stethaprioninae), including comments on Petitella georgiae and Hemigrammus bleheri. Neotrop. Ichthyol. 18, e190109. doi: 10.1590/1982-0224-2019-0109
Brown, W. M., George, M., and Wilson, A. C. (1979). Rapid evolution of animal mitochondrial DNA. Proc. Natl. Acad. Sci. U.S.A. 76, 1967–1971. doi: 10.2307/69636
Calcagnotto, D., Schaefer, S. A., and Desalle, R. (2005). Relationships among characiform fishes inferred from analysis of nuclear and mitochondrial gene sequences. Mol. Phylogenet. Evol. 36, 135–153. doi: 10.1016/j.ympev.2005.01.004
Chen, B., Zou, W., Xu, H., Liang, Y., and Huang, B. (2018). Efficient labeling and imaging of protein-coding genes in living cells using CRISPR-Tag. Nat. Commun. 9, 1–9. doi: 10.1038/s41467-018-07498-y
Cooke, G. M., Chao, N. L., and Beheregaray, L. B. (2012). Divergent natural selection with gene flow along major environmental gradients in Amazonia: insights from genome scans, population genetics and phylogeography of the characin fish Triportheus albus. Mol. Ecol. 21, 2410–2427. doi: 10.1111/j.1365-294X.2012.05540.x
Cooper, A., Lalueza-Fox, C., Anderson, S., Rambaut, A., Austin, J., and Ward, R. (2001). Complete mitochondrial genome sequences of two extinct moas clarify ratite evolution. Nature 409:704. doi: 10.1038/35055536
Gray, M. W. (1989). Origin and evolution of mitochondrial DNA. Annu. Rev. Cell Biol. 5, 25–50. doi: 10.1146/annurev.cb.05.110189.000325
Harrison, R. G. (1989). Animal mitochondrial DNA as a genetic marker in population and evolutionary biology. Trends Ecol. Evol. 4, 6–11. doi: 10.1016/0169-5347(89)90006-2
Javonillo, R., Malabarba, L. R., Weitzman, S. H., and Burns, J. R. (2010). Relationships among major lineages of characid fishes (Teleostei: Ostariophysi: Characiformes), based on molecular sequence data. Mol. Phylogenet. Evol. 54, 498–511. doi: 10.1016/j.ympev.2009.08.026
Johnson, M. R., Zaretskaya, I., Raytselis, Y., Merezhuk, Y., Mcginnis, S. D., and Madden, T. L. (2008). NCBI BLAST: a better web interface. Nucleic Acids Res. 36, 5–9. doi: 10.1093/nar/gkn201
Kalyaanamoorthy, S., Minh, B. Q., Wong, T. K., von Haeseler, A., and Jermiin, L. S. (2017). ModelFinder: fast model selection for accurate phylogenetic estimates. Nat. Methods 14, 587–589. doi: 10.1038/nmeth.4285
Katoh, K., and Standley, D. M. (2013). MAFFT multiple sequence alignment software version 7: improvements in performance and usability. Mol. Biol. Evol. 30, 772–780. doi: 10.1093/molbev/mst010
Kim, K., Lee, S. Y., Bang, I., and Nam, Y. K. (2008). Complete mitogenome sequence of an endangered freshwater fish, Iksookimia choii (Teleostei; Cypriniformes; Cobitidae). DNA Sequence 19, 438–445. doi: 10.1080/19401730802449188
Kim, M. I., Baek, J. Y., Kim, M. J., Jeong, H. C., Kim, K. G., and Bae, C. H. (2009). Complete nucleotide sequence and organization of the mitogenome of the red-spotted apollo butterfly, parnassius bremeri(lepidoptera: papilionidae) and comparison with other lepidopteran insects. Mol. Cells 28, 347–363. doi: 10.1007/s10059-009-0129-5
Krajewski, C., Sipiorski, J. T., and Anderson, F. E. (2010). Complete mitochondrial genome sequences and the phylogeny of cranes (Gruiformes: Gruidae). Auk 127, 440–452. doi: 10.1525/auk.2009.09045
Kumar, S., Stecher, G., and Tamura, K. (2016). MEGA7: molecular evolutionary genetics analysis version 7.0 for bigger datasets. Mol. Biol. Evol. 33, 1870–1874. doi: 10.1093/molbev/msw054
Langerhans, R. B., Layman, C. A., Langerhans, A. K., and Dewitt, T. J. (2003). Habitat-associated morphological divergence in two Neotropical fish species. Biol. J. Linn. Soc. 80, 689–698. doi: 10.1111/j.1095-8312.2003.00266.x
Lavoue, S., Nakayama, K., Jerry, D. R., Yamanoue, Y., Yagishita, N., Suzuki, N., et al. (2014). Mitogenomic phylogeny of the Percichthyidae and Centrarchiformes (Percomorphaceae): comparison with recent nuclear gene-based studies and simultaneous analysis. Gene 549, 46–57. doi: 10.1016/j.gene.2014.07.033
Librado, P., and Rozas, J. (2009). DnaSP v5: a software for comprehensive analysis of DNA polymorphism data. Bioinformatics 25, 1451–1452. doi: 10.1093/bioinformatics/btp187
Liu, H., Sun, C., Zhu, Y., Li, Y., Wei, Y., and Ruan, H. (2020). Mitochondrial genomes of four American characins and phylogenetic relationships within the family Characidae (Teleostei: Characiformes). Gene 762, 145041. doi: 10.1016/j.gene.2020.145041
Lohse, M., Drechsel, O., Kahlau, S., and Bock, R. (2013). Organellar Genome DRAW− a suite of tools for generating physical maps of plastid and mitochondrial genomes and visualizing expression data sets. Nucleic Acids Res. 41, 575. doi: 10.1093/nar/gkt289
Lowe, T. M., and Chan, P. P. (2016). tRNAscan-SE On-line: integrating search and context for analysis of transfer RNA genes. Nucleic Acids Res. 44, W54–W57. doi: 10.1093/nar/gkw413
Master, A. R. R., Li, B., and Li, F. (2016). The complete mitochondrial genome of Japanese Marsh Warbler, Locustella pryeri. Mitochondrial DNA A 27, 373–374. doi: 10.3109/19401736.2014.895992
Mirande, J. M. (2010). Phylogeny of the family Characidae (Teleostei: Characiformes): from characters to taxonomy. Neotrop. Ichthyol. 8, 385–568. doi: 10.1590/S1679-62252010000300001
Mirande, J. M. (2019). Morphology, molecules and the phylogeny of Characidae (Teleostei, Characiformes). Cladistics 35, 282–300. doi: 10.1111/cla.12345
Montero-Mendieta, S., and Dheer, A. (2019). Digest: Resolving phylogenomic conflicts in characiform fishes. Evolution 73, 416–418. doi: 10.1111/evo.13649
Nguyen, L. T., Schmidt, H. A., Haeseler, A., and Minh, B. Q. (2015). IQ-TREE: a fast and effective stochastic algorithm for estimating maximum likelihood phylogenies. Mol. Biol. Evol. 32, 268–274. doi: 10.1093/molbev/msu300
Oliveira, C., Avelino, G. S., Abe, K. T., Mariguela, T. C., Benine, R. C., Orti, G., et al. (2011). Phylogenetic relationships within the speciose family Characidae (Teleostei: Ostariophysi: Characiformes) based on multilocus analysis and extensive ingroup sampling. BMC Evol. Biol. 11:275.
Parhi, J., Tripathy, P. S., Priyadarshi, H., Mandal, S. C., and Pandey, P. K. (2019). Diagnosis of mitogenome for robust phylogeny: a case of Cypriniformes fish group. Gene 713, 143967. doi: 10.1016/j.gene.2019.143967
Paz, F. P., Batista, J. D., and Porto, J. I. (2014). DNA barcodes of Rosy Tetras and allied species (Characiformes: Characidae: Hyphessobrycon) from the Brazilian Amazon basin. PLoS One 9:e98603. doi: 10.1371/journal.pone.0098603
Perna, N. T., and Kocher, T. D. (1995). Patterns of nucleotide composition at fourfold degenerate sites of animal mitochondrial genomes. J. Mol. Evol. 41, 353–358. doi: 10.1007/bf00186547
Prosdocimi, F., Carvalho, D. C., De Almeida, R. N., and Beheregaray, L. B. (2012). The complete mitochondrial genome of two recently derived species of the fish genus Nannoperca (Perciformes, Percichthyidae). Mol. Biol. Rep. 39, 2767–2772. doi: 10.1007/s11033-011-1034-5
Rambaut, A. (2015). FigTree, A Graphical Viewer of Phylogenetic Trees. Available online at: http://tree.bio.ed.ac.uk/software/figtree (accessed July 24, 2015)
Ronquist, F., Teslenko, M., Van Der Mark, P., Ayres, D. L., Darling, A., Höhna, S., et al. (2012). MrBayes 3.2: efficient Bayesian phylogenetic inference and model choice across a large model space. Syst. Biol. 61, 539–542. doi: 10.1093/sysbio/sys029
Ruan, H., Li, M., Li, Z., Huang, J., and Zou, K. (2020). Comparative analysis of complete mitochondrial genomes of three gerres fishes (perciformes: gerreidae) and primary exploration of their evolution history. Int. J. Mol. Sci. 21, 1874. doi: 10.3390/ijms21051874
Strohm, J. H. T., Gwiazdowski, R. A., and Hanner, R. (2015). Fast fish face fewer mitochondrial mutations: patterns of dn/ds across fish mitogenomes. Gene 572, 27–34. doi: 10.1016/j.gene.2015.06.074
Sun, C. H., Liu, H., Min, X., and Lu, C. (2020b). Mitogenome of the little owl Athene noctua and phylogenetic analysis of Strigidae. Int. J. Biol. Macromol. 151, 924–931. doi: 10.1016/j.ijbiomac.2020.02.238
Sun, C. H., Liu, B., and Lu, C. H. (2019b). Complete mitochondrial genome of the Siberian thrush, Geokichla sibirica sibirica (Aves, Turdidae). Mitochondrial DNA B 4, 1150–1151. doi: 10.1080/23802359.2019.1591195
Sun, C. H., Liu, H. Y., and Lu, C. H. (2019a). Five new mitogenomes of Phylloscopus (Passeriformes, Phylloscopidae): Sequence, structure, and phylogenetic analyses. Int. J. Biol. Macromol. 146, 638–647. doi: 10.1016/j.ijbiomac.2019.12.253
Sun, C. H., Liu, H. Y., Xu, P., and Lu, C. H. (2020a). Genetic diversity of wild wintering red-crowned crane (Grus japonensis) by microsatellite markers and mitochondrial Cyt B gene sequence in the Yancheng reserve. Anim. Biotechnol. doi: 10.1080/10495398.2020.1725538 [Epub ahead of print].
Terán, G. E., Benitez, M. F., and Mirande, J. M. (2020). Opening the Trojan horse: phylogeny of Astyanax, two new genera and resurrection of Psalidodon (Teleostei: Characidae). Zool. J. Linn. Soc. 190, 1217–1234. doi: 10.1093/zoolinnean/zlaa019
Wang, L., Chen, Z., Gao, J., Zhao, Y., Sun, P., and Lu, K. (2016). The complete mitochondrial genome of Indonesian tiger fish Datnioides microlepis (Bleeker 1854). Mitochondrial DNA B 1, 328–329. doi: 10.1080/23802359.2016.1172050
Wataru, I., Tsukasa, F., Ryota, I., Koichiro, Y., Yasunobu, M., and Satoh, T. P. (2013). Mitofish and mitoannotator: a mitochondrial genome database of fish with an accurate and automatic annotation pipeline. Mol. Biol. Evol. 11, 11. doi: 10.1093/molbev/mst141
Wilkens, H. (1971). Genetic interpretation of regressive evolutionary processes: studies on hybrid eyes of two astyanax cave populations (Characidae, Pisces). Evolution 25, 530–544. doi: 10.2307/2407352
Wilkens, H. (1988). Evolution and genetics of epigean and cave Astyanax fasciatus (Characidae, Pisces). Evol. Biol. 23, 271–367. doi: 10.1007/978-1-4613-1043-3_8
Wilson, A. C., Cann, R. L., Carr, S. M., George, M., Gyllensten, U. B., Helm-Bychowski, K. M., et al. (1985). Mitochondrial DNA and two perspectives on evolutionary genetics. Biol. J. Linn. Soc. 26, 375–400. doi: 10.1111/j.1095-8312.1985.tb02048.x
Wu, Y., Wang, X., Liu, S., Luo, H., and Lin, Q. (2020). Population genetic structure and phylogenetic analysis of gray’s pipefish, Halicampus grayi in the South China Sea. Genes Genomi. 42, 155–164. doi: 10.1007/s13258-019-00893-9
Yamaoka, K., Nakagawa, T., and Uno, T. (1978). Application of Akaike’s information criterion (AIC) in the evaluation of linear pharmacokinetic equations. J. Pharmacokinet. Biopharm. 6, 165–175. doi: 10.1007/BF01117450
Zhang, S., Cui, J., Xu, R., Xu, P., and Sun, J. (2016). The complete mitochondrial genome of Paracheirodon axelrodi (Characiformes:Characidae:Paracheirodon). Mitochondrial DNA 27, 230–231. doi: 10.3109/19401736.2014.880903
Keywords: Characidae, Hemigrammus erythrozonus, Hyphessobrycon amandae, mitochondrial genome, phylogeny
Citation: Sun C-H, Liu H-Y, Xu N, Zhang X-L, Zhang Q and Han B-P (2021) Mitochondrial Genome Structures and Phylogenetic Analyses of Two Tropical Characidae Fishes. Front. Genet. 12:627402. doi: 10.3389/fgene.2021.627402
Received: 09 November 2020; Accepted: 13 January 2021;
Published: 01 February 2021.
Edited by:
Santiago Castillo Ramírez, National Autonomous University of Mexico, MexicoReviewed by:
Milton Tan, Illinois Natural History Survey (INHS), United StatesAnderson Oliveira Carmo, Federal University of Minas Gerais, Brazil
Copyright © 2021 Sun, Liu, Xu, Zhang, Zhang and Han. This is an open-access article distributed under the terms of the Creative Commons Attribution License (CC BY). The use, distribution or reproduction in other forums is permitted, provided the original author(s) and the copyright owner(s) are credited and that the original publication in this journal is cited, in accordance with accepted academic practice. No use, distribution or reproduction is permitted which does not comply with these terms.
*Correspondence: Hong-Yi Liu, aG9uZ3lpX2xpdUBuamZ1LmVkdS5jbg==